Abstract
The intake air preheating is an effective method to improve the cold start performance of diesel engines. The combustion process and ignition probability were investigated in the present study. The average flame area (AFA) during the steady stage of the combustion process was used to evaluate the effects of various factors on combustion. The increase of voltage was found to enhance the combustion process, while the increased diesel flow rate first promoted the combustion before deteriorating it. The increased intake air flow velocity enhanced the combustion within 2.64 m/s, and excessive air flow velocity hindered the combustion from 2.7 to 3 m/s. The cross-distributed vortex clusters in the combustion chamber, periodic diesel evaporation and vortexes with opposite rotation directions in the vicinity of the intake manifold burner were believed to be the main reasons for flame stripping and swirl motion. The temperature rise in the exhaust pipe was recorded to investigate the thermal distribution. The warm air was concentrated in the upper region because of the buoyancy effect of the flame. With the air flow velocity increasing from 1.4 to 10 m/s, the average temperature rise increased first before decreasing, while the combustion efficiency increased due to the increased air flow volume.
1. Introduction
Internal combustion engines play an important role in transportation and power systems. Diesel engines show poor cold start performance at low temperatures, for instance, high emissions, high fuel consumption and long cranking time [1]. Various methods were investigated to improve the engine performance, including pilot injection [2,3], fuel optimization [4,5,6,7,8,9], thermal barrier coating [10] and intake air preheating [11]. However, diesel engines still face great challenges.
Under low ambient temperature, diesel engines present poor emissions. In [12], it was reported that a large proportion of heat from the combustion is used to heat the engine block, lubricant oil and coolant. It was also reported that higher PM, CO and PN emission at the first two minutes of cold start conditions is shown compared with the steady state condition [12]. Compared with the hot start, higher maximum in-cylinder pressure, indicated torque and fuel consumption were shown during the cold start phase [5]. Zare et al. [13] studied the NOx emissions, and they found that the NOx emissions increased during the diesel engine warm up, then a sharp drop was shown due to the retarded injection. After that, the NOx emission reaches a steady increasing phase with the injection retardation. Lodi et al. [14] studied the engine performance and emissions of a heavy-duty engine during the warm up process. It was reported that an advanced injection strategy could accelerate the warm up, while the retarded injection reduced the NOx emissions. Regulated and unregulated idling emissions of diesel engines on cold start conditions were studied and it was reported that the CH4, C2H4, C3H6, NO and NH3 emissions were significantly reduced in comparison with the hot restart idle condition [15].
Intake air heating strategy improves the engine performance and reduces the emissions effectively. Yontar et al. [16] studied the cold start performance of HCCI engine with the inlet air temperature control, and they pointed out that the maximum in-cylinder pressure and heat release rate increased with the increasing intake air temperature from 273 to 373 K, while the CO, HC and soot emissions showed a decreasing trend. Celik et al. [11] heated the intake manifold air by mixing the hot air of the vortex tube with the cold ambient air and found that the CO and PM emissions decreased while the HC and NO emissions increased. Pastor et al. [17] studied the influence of glow plugs on cold start and found that the spray-glow plug orientation and distance affected the start of combustion (SOC) and indicated mean effective pressure (IMEP). They also pointed out that the glow plug temperature increased with the supply tension, leading to the luminosity delay reduction, that is to say, enhancing the pilot ignition. Deng et al. [18] tested the intake air preheater on cold start and found that the preheating time increased when the start temperature decreased. A new intake air heating strategy was found to significantly reduce the CO and HC emissions compared with glow plugs, indicating the combustion improvement [19]. Ramadhas et al. [20] tested the diesel engine performance on cold start conditions by means of the intake air heater. They found that when the intake air temperature increased from −7 to 15 °C, the hydrocarbon, NOx and particle number emissions reduce considerably, indicating the improved combustion. Through an intake manifold burner heating strategy, the HC emission and exhaust gas opacity were significantly reduced at the subzero ambient temperature [21]. It was also reported that the flame glow plug showed good performance in the heavy vehicle at extremely low ambient temperature. Kreun et al. [22] studied the performance of the intake manifold burner by simulation, and they reported that with the assistance of an intake manifold burner, the effective equivalent ratio was 2.6, which was much higher than that without starting aids. With the help of intake manifold burner, the starting speed was higher than that without preheating [23].
The intake manifold burner consumed the oxygen and introduced the combustion product species. It is similar to the exhaust gas recirculation (EGR) [22], which is widely investigated to reduce emissions [24,25]. The dilution effect was found to prolong the ignition delay and led to lower thermal NOx formation, while the chemical effect has minor effects on combustion and emissions [26]. The intake manifold burner was found to be an effective intake air heating method. However, the interaction between the air motion and flame requires further study to improve the intake air preheating effect. The combustion process, intake air preheating effect and flame swirl motion also need to be investigated. In the present study, the flame stripping generated in the combustion chamber and the corresponding origin of the flame swirl motion were analyzed through simulation. The effects of the air flow and diesel flow on the fuel evaporation process, the velocity field and vortexes were studied. The preheating effect of the air flow and diesel flow were evaluated by the flame area and temperature rise in the combustion chamber. Besides, the effects of the voltage on combustion and ignition probability were also tested.
2. Experimental Setup
The schematic diagram of the test system is shown in Figure 1a. Air flow was generated by the fan, and the uniform air flow device was employed to ensure the uniformity of the air flow in the combustion chamber. Transparent quartz windows were employed in the combustion chamber to make the combustion process visible. A high-speed camera (Phantom V7.3) was used to capture the flame evolution. The diffusion flame development of the intake manifold burner was slow, and it took a long time to capture the whole combustion process in every case. Therefore, the combustion process was recorded at the frame speed of 5000 fps and the exposure time of 100 μs.
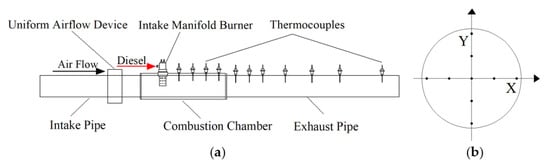
Figure 1.
Schematic diagram of (a) the test system and (b) the temperature measuring points in the cross-section of the exhaust pipe.
The type-K thermocouples were employed to measure the temperature of the air flow in the exhaust pipe. The measuring points in the cross section are shown in Figure 1b. The thermocouples were installed on the combustion chamber and exhaust pipe with the distance of 50 mm, 95 mm, 140 mm, 185 mm, 230 mm, 275 mm, 320 mm, 365 mm, 420 mm, 488 mm, 550 mm, 655 mm, 775 mm, 925 mm and 1120 mm away from the intake manifold burner, respectively. The temperatures of the points in the horizon axis and vertical axis are marked with “X” and “Y”, respectively. Therefore, the temperature at the center of the cross section was marked with “0”. The temperature at 20 mm below the pipe center is marked with “−20-Y”.
3. Test Fuel and Conditions
Commercial diesel fuel was employed in this study, as shown in Table 1. Diesel was delivered to the intake manifold burner after the preheating time of 80 s. Two test conditions, namely, 20 °C and −9 °C ambient temperatures were used. Both the intake air temperature and fuel temperature were consistent with the ambient temperature.

Table 1.
Properties of the diesel fuel.
The ignition probability with voltage ranging from 20 to 24 V was studied, while the combustion process was investigated when the voltage varies from 20.5 to 24 V because the intake manifold burner could not ignite the diesel below 20 V. The study of preheating effect and combustion process was carried out with various fuel flow rates ranging from 7.3 to 18.9 mL/min and air flow velocity ranging from 1.4 to 10 m/s.
4. Computation Models
The mixture process of the fuel and air, ignition process and diffusion flame development are simulated with CONVERGE 3-D software. The n-heptane is widely used to study the diesel diffusion flame due to the similar cetane number and combustion heat to diesel [27,28]. Therefore, n-heptane is chosen as the fuel for simulation in the present study.
The volume of fluid (VOF) model is employed to simulate the multi-phase flow by tracking the volume of fluid within each fluid cell. RNG k-ε turbulence model is used, and the transportation equations for the turbulent kinetic energy and turbulent dissipation are given by:
where ε is the turbulent dissipation, , and are constants. The default values in CONVERGE are applied.
The turbulent kinetic energy, κ, is defined by the equation shown below:
The SAGE detailed chemistry solver is used to model the detailed chemical kinetics, which calculates the reaction rates for each elementary reaction. The multi-step reaction mechanism is given by:
where the and are the stoichiometric coefficients for the reactants and products, respectively. For the r-th reaction, the rate of progress parameter is given by:
where kfr and krr are the forward and reverse rate coefficients, respectively. The governing equations for mass and energy are shown as follows:
The equations above are extracted from the CONVERGE software.
Figure 2 presents the structure of the intake manifold burner, the schematic of the model and the adaptive mesh evolution with time. The diameter of the fuel inlet pipe is 7.5 mm. The micro-channel between the heating rods and the metal housing of the intake manifold burner, which allows the flowing and gasifying of diesel, has a width of 1.75 mm. The base grid size is 4 mm, and the length of the combustion chamber is 500 mm. A fixed grid embedding is employed on the micro-channel, and the adaptive mesh refinement on temperature, species and velocity is employed. The minimum grid size is set to 0.5 mm. With the diesel flowing into the intake manifold burner, the grid number increases and continues to increase when it flows out of the flame shroud. Similar flame length to the result of the experiment is obtained, validating the computational model. The slices in Figure 2b are extracted from the model and named slice A and slice B. Similar flame penetration was obtained in the simulation model, indicating the accuracy of the model.
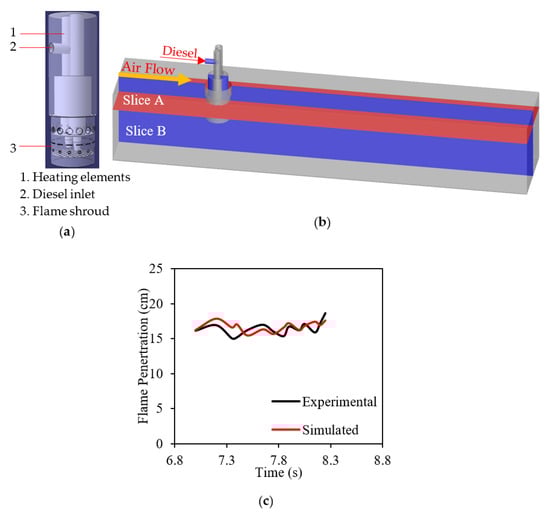
Figure 2.
(a) The structure of the intake manifold burner, (b) schematic of the model and (c) the model validation.
5. Results and Discussion
5.1. Effect of the Power Supply
The ignition probability is tested under intake air flow velocity of 1.4 m/s and diesel flow rate of 10 mL/min. The ambient temperature and intake air temperature are 20 °C in this section. The varying trends of the input power of the intake manifold burner under different voltages are shown in Figure 3. The electrical power of the heating elements shows the highest value at the starting time, then decreases with time elapse and reaches a stable value. Figure 4 presents the temperature of the heating rods of the intake manifold burner. With the power supply switching on, the temperature of the heating rods increases with time elapses until a stable value is reached. The electrical power of the intake manifold burner decreases with the decreasing voltage, leading to a lower surface temperature of the heating rods. This leads to poor fuel evaporation, making it more difficult to ignite the fuel-air mixture. Therefore, the ignition probability is 100% under the voltages of 23 V and 24 V, and it decreases significantly from 100% to 0% when the voltage decreases from 23 to 20 V.
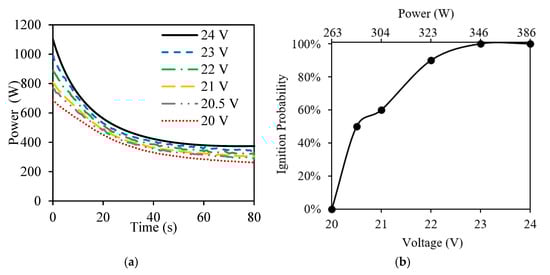
Figure 3.
(a) Electrical power and (b) ignition probability of the intake manifold burner.
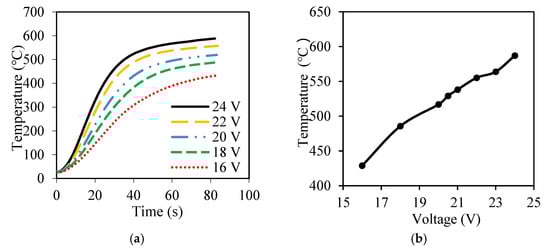
Figure 4.
(a) The increasing temperature and (b) the peak temperature of the heating rods in the intake manifold burner.
Under the voltage of 20 V, the surface temperature of the heating rods is too low to ignite the mixture of fuel and air. Therefore, the flame propagation of the intake manifold burner is presented with the voltage ranging from 20.5 to 24 V. In this section, the air flow velocity is fixed to 1.4 m/s, and the fuel flow rate is set to 10 mL/min.
The combustion process under the voltages of 24 V and 20.5 V are shown in Figure 5 and Figure 6. When the fuel-air mixture is ignited, the flame can be seen from holes in the flame shroud at 0 s. Then, the flame rushes out the flame burner, and a flame-developing stage is shown. Eventually, the flame area reaches the maximum value at about 1.2918 s under 24 V and enters the steady stage.
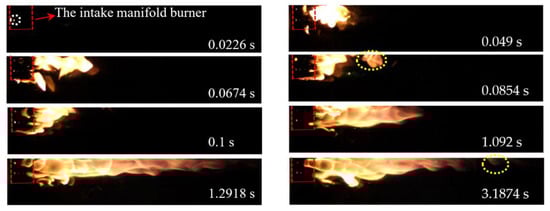
Figure 5.
Flame propagation under the voltage of 24 V.
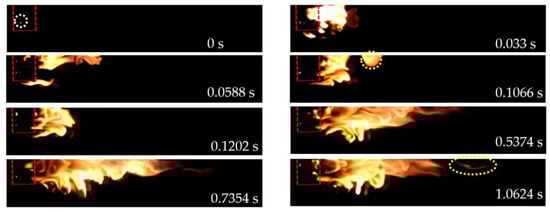
Figure 6.
Flame propagation under the voltage of 20.5 V.
During the developing and steady stage, flame stripping happens, which is denoted by the yellow dotted circle. Thus, the flame area decreased abruptly as a result of flame stripping. The occurrence probability of the stripped flame is almost the same with different operating voltages, indicating that flame swirl motion is irrelevant to voltage.
As shown in Figure 7, when the power supply increases from 20.5 to 24 V, the flame area in the steady stage shows an overall increasing trend, indicating the promotion of the power supply on the combustion. With the increase of the voltage, the surface temperature of the heating rods is higher, which promotes diesel evaporation and makes the mixture of air and diesel vapor better. Besides, higher surface temperature makes the ignition easier. Thus, higher flame area in the steady stage is shown.
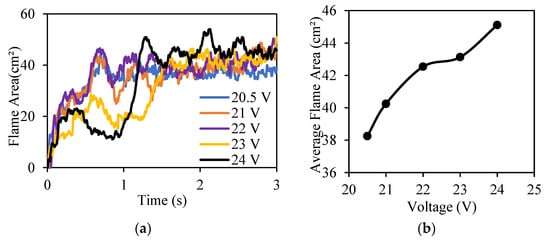
Figure 7.
(a) Flame area with time elapses and (b) the average flame area in the steady stage with different power supply.
5.2. Effect of the Air Flow Velocity
Figure 8 shows the velocity field of slice A and slice B under intake air flow velocity of 2 m/s and 1.4 m/s. The power supply, ambient temperature and diesel flow rate are set to 24 V, 20 °C and 10 mL/min in this section, respectively. In the downstream zone close to the intake manifold burner, a negative velocity zone is generated because the air flow is hindered by the burner block. The negative velocity zone under the intake air flow velocity of 2 m/s, which is denoted by the black dotted line, shows higher velocity compared with that under 1.4 m/s, leading to stronger flame swirl motion.
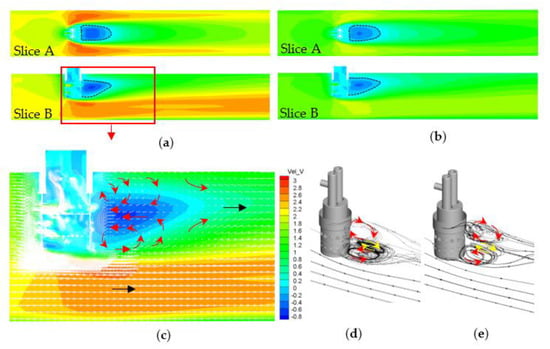
Figure 8.
The velocity field under (a) 2 m/s and (b) 1.4 m/s; (c) the velocity vector in the vicinity of the intake manifold burner; the 3D streamlines crossing slice plane B in the combustion chamber under (d) 2 m/s and (e) 1.4 m/s. The diesel flow rate is 10 mL/min.
The velocity vector diagram of the intake manifold burner vicinity under 2 m/s is shown in Figure 8c. It shows that two swirl zones with opposite rotation directions, which are noted with the red arrows. In order to obtain the air flow direction, 30 3D streamlines that cross the vertical slice plane A are extracted. The streamlines are three-dimensional distributed in the combustion chamber, as shown in Figure 8d,e. Two vortexes with opposite rotation directions are generated in the vertical plane, which is noted with the red arrows. It is consistent with the vortexes in Figure 8c. While the vortex located below is found to be symmetrically distributed, and the contrary swirl direction is shown, which is noted with the yellow arrows. Because of the complex vortexes and air flow direction in the vicinity of the intake manifold burner, air entrainment and flame swirl motion are generated, leading to flame stripping and instability.
The flame swirl motion is shown in Figure 9 and Figure 10, as denoted by the red dotted lines. The fuel flow rate is 10 mL/min. The flame plume generates with a small arc shape. Then, the small arc develops into a big arc with time elapses. Under the air flow velocity of 2 m/s, the radian of the flame plume increases significantly to the negative velocity zone closest to the intake manifold burner and breaks into two parts eventually. Part I shortens rapidly and fuses with the flame in the vicinity of the intake manifold burner. Part II continues to move downstream and eventually fuses with the ambient flame. However, part I under the intake air flow velocity of 1.4 m/s fuses with ambient flame before it breaks up and makes it difficult to distinguish. Therefore, only part II can be seen. With the increase of air flow velocity, higher occurrence probability of the stripped flame is shown, indicating that the flame swirl motion is enhanced by the strong air flow.
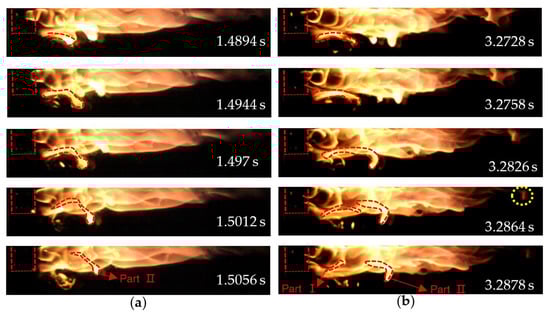
Figure 9.
The flame swirl motion under air flow velocity of (a) 1.4 m/s and (b) 2 m/s.
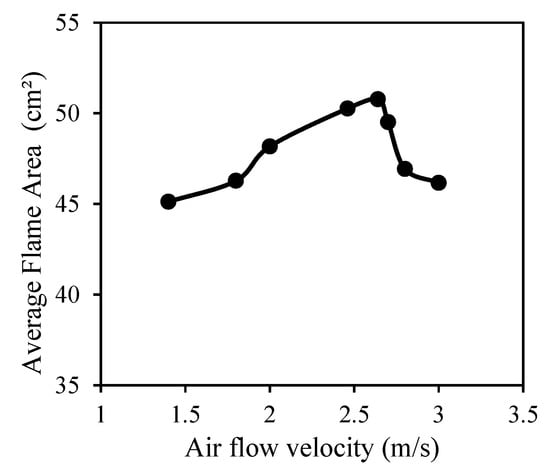
Figure 10.
The average flame area under the different air flow velocities.
The average flame area (AFA) under different intake air flow velocities during the steady stage is shown in Figure 10. During the steady stage, the flame is more stable than that at the developing stage. The AFA under the fuel flow rate of 10 mL/min increases first and then decreases with the air flow velocity increases from 1.4 to 3 m/s, indicating the hindrance effect of the excessive air flow on combustion. The increasing air flow provides more oxygen and boosts the mixture of air and diesel within 2.64 m/s, enhancing the combustion. In addition, the increasing air flow velocity enhances the air swirl motion and heat dissipation, leading to increased ignition difficulty and combustion deterioration from 2.7 to 3 m/s.
Figure 11 shows the diesel vapor (C7H16) distribution in the combustion chamber. The diesel vapor length in the combustion chamber shows obvious periodic reciprocating oscillation, indicating that the diesel evaporation process is periodic. Compared with the case under higher air flow velocity of 2 m/s, the fuel vapor under 1.4 m/s develops earlier and shows lower amplitude. The periodic evaporation of the fuel vapor is believed to be one reason that leads to flame pulsation and instability.
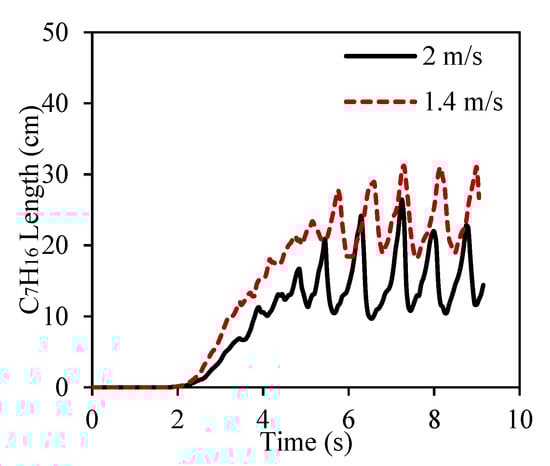
Figure 11.
The diesel vapor length with time.
Figure 12 shows the vorticity in the combustion chamber. It indicates that the vortex clusters of the air flow with negative and positive values cross-distribute downstream of the intake manifold burner and move downward along the air flow direction. Therefore, the flame is affected by the negative-value vortexes and the positive-value vortexes simultaneously, leading to the complex flame pulsation and swirl motion. The vorticity under intake air flow of 2 m/s is higher than that under 1.4 m/s, leading to stronger air swirl motion and more violent flame stripping.
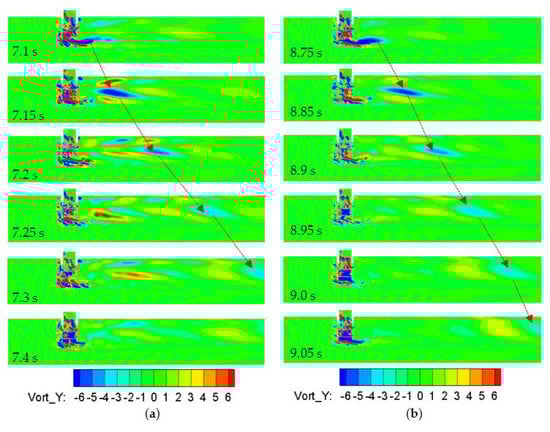
Figure 12.
The vorticity in the combustion chamber under (a) 2 m/s and (b) 1.4 m/s.
The preheating effect of the intake manifold burner is evaluated by the temperature rise of the air flow. Temperature rise in the combustion chamber and the exhaust pipe are measured by thermocouples. Figure 13 shows the preheating effect of the air flow velocity on the temperature rise in the combustion chamber. With the increase of the distance from the intake manifold burner, the temperature rise increases first and then decreases. This is because the outer flame locates at the position with the highest temperature rise.
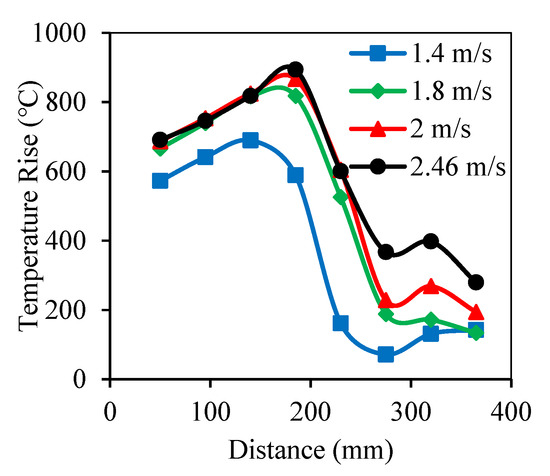
Figure 13.
The effect of air flow velocities on temperature rise in the combustion chamber under the fuel flow rate of 10 mL/min.
As the air flow velocity increases from 1.4 to 1.8 m/s, the position of the highest temperature rise shifts to 185 mm away from the intake manifold burner, and the temperature rise shows a significant increase. When the air flow velocity increases from 1.8 to 2.46 m/s, the position of the highest value remains constant, while the temperature rise shows a slight increase within 230 mm. Excessive heat is carried away by the air flow due to the forced heat convection, neutralizing the boost effect of the increased oxygen concentration and leading to a smaller temperature rise. The maximum flame length is about 25 cm in all the cases. Thus, the temperature rise within 250 mm reflects the flame temperature, while the temperature rise from 275 to 365 mm shows the air flow temperature. An obvious temperature rise from 275 to 365 mm is shown in Figure 13, indicating that though the promotion on combustion is neutralized by the forced heat convection, a better preheating effect can still be obtained.
Figure 14 presents the temperature rise in the exhaust pipe under the fuel flow rate of 13 mL/min and air flow velocity of 2 m/s. When the distance from the intake manifold increases from 420 mm to 1120 mm, the temperature rise of “40-Y” and “20-Y” decreases due to the thermal convection and dissipation. While the temperature rise of “0” and “−20-Y” shows an increasing trend, indicating that the lower region receives the heat transfers from the high temperature zone. However, the temperature at the point with 40 mm below the circle center, that is to say, the temperature rise of “−40-Y”, shows very slight fluctuation because most heat is dissipated before it arrives. The heat mainly concentrates in the upper zone due to the thermal buoyancy effect of the flame, then the heat transfers to the cold air, leading to decreasing temperature difference of adjacent points. Thus, the heat distribution becomes more uniform with the increasing distance from the intake manifold burner.
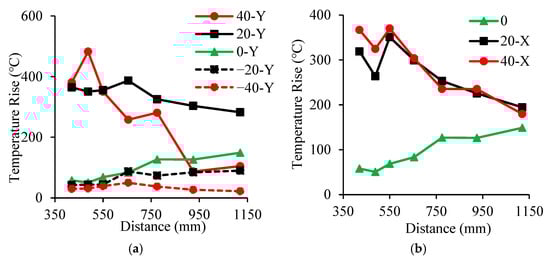
Figure 14.
The temperature rise at (a) y-axis and (b) x-axis in the exhaust pipe under the fuel flow rate of 13 mL/min and air flow velocity of 2 m/s.
The temperature rise of the points located symmetrically at the horizontal axis is similar. Therefore, the temperature rise of “−40-X” and “−20-X” can be expressed by the points of “40-X” and “20-X”. The temperature rise of “20-X” and “40-X” is much higher than that of “0” point, indicating that the heat concentrates in the zone closest to the exhaust pipe wall. With the increasing distance from the intake manifold burner, the temperature rise becomes more uniform due to the heat transfers from high temperature zone to low temperature zone, which is consistent with the results at the y-axis.
Compared with the case under the air flow velocity of 2 m/s, the temperature rise is lower under 10 m/s due to more heat dissipated in the air flow, as shown in Figure 15. With the increasing distance from the combustion chamber, the temperature rise of the vertical axis shows an overall decreasing trend because more heat is carried away by the high-speed air flow. The data of “20-Y” shows the highest temperature rise in the vertical axis, while the data of “0” and “20-X” show much higher temperature rise than that of “40-X”, indicating that the warm gas mainly distributes in the upper region and center zone of the exhaust pipe. Compared with the case under 2 m/s, the warm air is concentrated in the zone closer to the central zone under 10 m/s due to the stronger heat convection and dissipation.
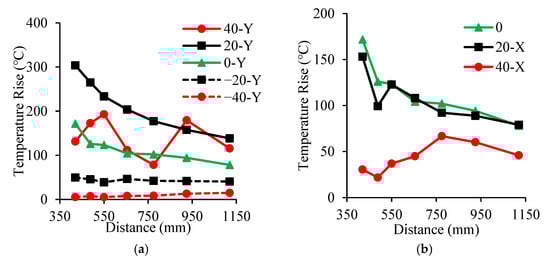
Figure 15.
The temperature rise at (a) y-axis and (b) x-axis in the exhaust pipe under the fuel flow rate of 13 mL/min and air flow velocity of 10 m/s.
The average temperature rise in the exhaust pipe at the distance of 1120 mm away from the intake manifold burner was used to calculate the combustion efficiency. The specific heat capacity of the exhaust gas is calculated through the equation shown below:
where gi is the mass percentage of each component and ci is the corresponding specific heat capacity. The combustion efficiency is calculated by the following equation:
where Q1 and Q2 are the heat of diesel and heating rods, respectively. Q3 is the heat loss along the exhaust pipe, m is the mass flow rate of the intake air, and Δt is the average temperature rise in the cross section.
The average temperature rise and combustion efficiency under different air flow velocities are shown in Figure 16. With the air flow velocity increasing from 1.4 to 10 m/s, the average temperature rise first increases before decreasing, indicating that the combustion is promoted within 2 m/s. Excess air flow hinders the combustion when the velocity exceeds 2.64 m/s, and the stronger air flow leads to higher heat dissipation. Thus, lower air flow temperature rise is shown from 3.9 to 10 m/s. However, the combustion efficiency increases due to the increased air flow volume.
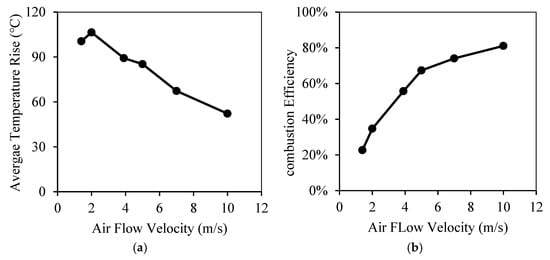
Figure 16.
(a) The average temperature rise and (b) the combustion efficiency in the exhaust pipe with different air flow velocities.
The flame penetration under the intake air temperature of normal temperature (20 °C, NT) and low temperature (LT, −9 °C) is shown in Figure 17. Lower intake air temperature has a negative effect on combustion due to the deteriorating diesel evaporation. The average temperature rise and combustion efficiency under low temperature are 96 °C and 33.7%, which are lower than that under normal temperature. The flame stripping phenomenon shows the same occurrence probability, indicating that the flame stripping is irrelevant to the intake air temperature.
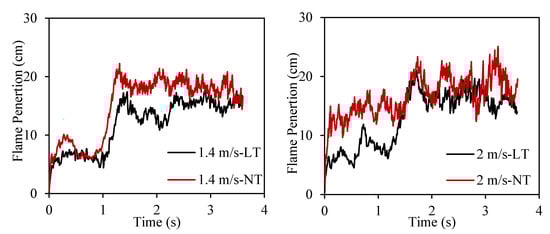
Figure 17.
The flame penetration under 20 °C (NT) and −9 °C (LT).
5.3. Effect of the Fuel Flow Rate
Figure 18 shows the flame propagation under the fuel flow rates of 7.3 mL/min, 15.2 mL/min and 16.8 mL/min, respectively. The air flow velocity, ambient temperature and voltage are 1.4 m/s, 20 °C and 24 V, respectively. With the increase of diesel flow rate, the flame length increases, indicating that the combustion is enhanced. The flame stripping phenomenon is found under different fuel flow rates, denoted by a yellow dotted circle, leading to the abrupt decrease of flame area. The flame plume with an arc shape generates close to the intake manifold burner due to the air entrainment and vortexes, then the flame swirl and rolls in the combustion chamber, leading to the flame stripping.
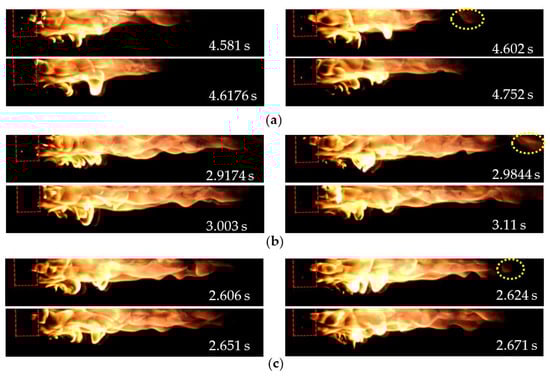
Figure 18.
The flame propagation under the fuel flow rate of (a) 7.3 mL/min, (b) 15.2 mL/min and (c) 16.8 mL/min.
As presented in Figure 19, the AFA under air flow velocity of 1.4 m/s shows an increasing trend with the fuel flow rate increase from 7.3 to 16.8 mL/min, meaning that the combustion is boosted. When the fuel flow rate ranges from 7.3 to 16.8 mL/min, the fuel quantity is low, leading to incomplete combustion. Thus, a higher fuel flow rate improves the lean fuel-air mixture and the subsequent combustion. However, the fixed power supply of the heating rods limits the amount of diesel evaporation. When the fuel flow rate increases from 16.8 to 18.9 mL/min, excess diesel makes the diesel evaporation and combustion deteriorate, leading to the decreasing AFA.
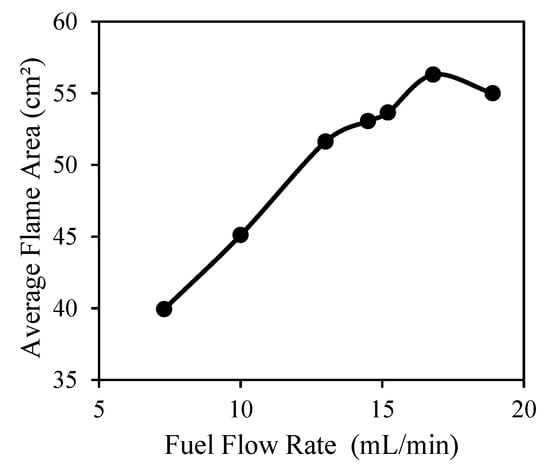
Figure 19.
The average flame area under the different fuel flow rates.
Figure 20a shows the fuel vapor under the fuel flow rates of 10 mL/min and 15.2 mL/min, respectively. The fuel vapor under the higher fuel flow rate of 15.2 mL/min develops earlier and shows a notably higher amplitude than that under 10 mL/min. The velocity field under 15.2 mL/min shows similar results with that under 10 mL/min, as shown in Figure 20b. The vorticity in the combustion chamber under 15.2 mL/min shows a slight increase compared with that under 10 mL/min. Noteworthy is that, with the fuel flow rate increasing from 7.3 to 18.9 mL/min, an extremely small increase of occurrence probability is shown, indicating that the effect of the fuel flow rate is weak and nearly negligible. Though the periodic diesel evaporation and vortex clusters are enhanced by the increasing fuel flow rate, the corresponding effect on flame swirl motion is too weak. Thus, the flame swirl motion is mainly determined by the air motion, which determines the vortexes in the vicinity of intake manifold burner.
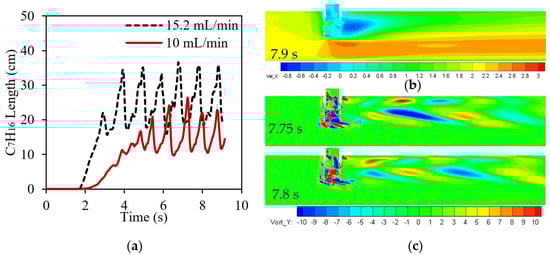
Figure 20.
(a) The diesel vapor length with time, (b) the velocity field and (c) the vorticity under the fuel flow rate of 15.2 mL/min.
Figure 21 shows the preheating effect of the fuel flow rate on the temperature rise in the combustion chamber. When the air flow velocity is 1.4 m/s, the temperature rise of air flow shows a notable increase with the increasing fuel flow rate within 14.5 mL/min. However, the temperature rise of the flame shows a slight increase when the fuel flow rate increases from 14.5 to 15.2 mL/min, and the air flow temperature remains the same, indicating that the promotion effect of flow rate reaches its limit. Under the air flow of 2 m/s, when the fuel flow rate increases from 7.3 to 15.2 mL/min, the temperature rise increases significantly, and the position of the highest value shifts away from the burner, meaning the combustion is boosted and the flame length increases.
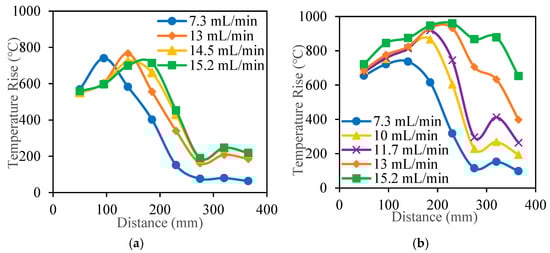
Figure 21.
The effect of fuel flow rates on temperature rise in the combustion chamber under the air flow velocities of (a) 1.4 m/s and (b) 2 m/s.
Figure 22 present the temperature rise in the exhaust pipe under different fuel flow rates. When the fuel flow rate increases from 7.3 to 15.2 mL/min, the temperature rise of all the points increases significantly, indicating the promotion of the intake manifold burner combustion. For all the temperature measuring points, the temperature rise with different fuel flow rates shows the same trend as that under the fuel flow rate of 13 mL/min. Thus, with the fuel flow rates ranging from 7.3 to 15.2 mL/min, the heat transfers from the upper region to the lower part, leading to better uniformity of the heat distribution in the exhaust pipe.
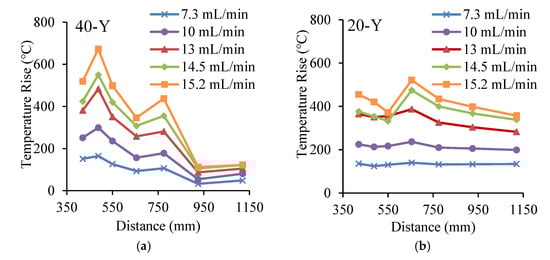
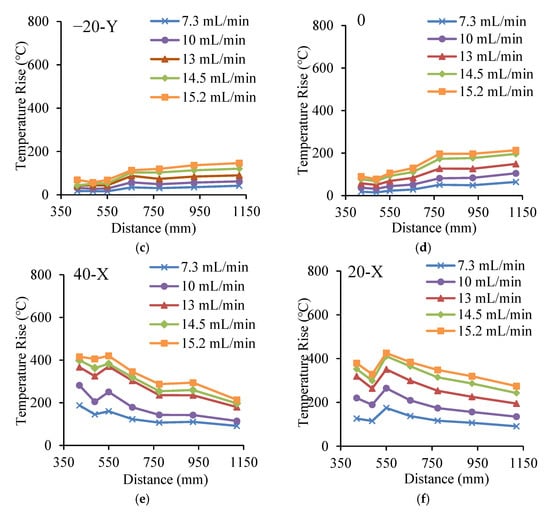
Figure 22.
The temperature rise of individual temperature-measuring points at the point of (a) 40-Y, (b) 20-Y, (c) −20-Y, (d) 0, (e) 40-X and (f) 20-X in the exhaust pipe under the air flow velocity of 2 m/s.
6. Conclusions
The ignition probability, combustion process, and the preheating effect of the intake manifold burner were investigated in the present study. Through the simulation by CONVERGE, the cause of the flame swirl motion and instabilities were studied. The main conclusions are shown below.
When the voltage decreases from 24 to 20 V, the surface temperature of the heating rods decreases due to the decreasing electrical power, leading to poor fuel evaporation and lower ignition probability. Eventually, the heating rods failed to ignite the fuel-air mixture under the voltage of 20 V.
The combustion process is divided into the developing stage and the steady stage. The AFA increases with the increasing voltage, indicating the promotion of the power supply on the combustion. With the increase of air flow velocity and fuel flow rate, the AFA first increases before decreasing. This means that the combustion is enhanced by the air flow first, then the combustion deteriorates due to the high heat dissipation and vigorous air swirl motion. When the fuel flow rate is too low, the combustion is incomplete. Therefore, a higher fuel flow rate boosts the combustion, while excess fuel leads to a worse air-fuel mixture, deteriorating the combustion. Vortexes with opposite swirl directions in the downstream close to the intake manifold burner, cross-distributed vortex clusters in the combustion chamber and the periodic process of the diesel evaporation are believed to be the main reasons for flame swirl motion and flame stripping.
In the vertical axis of the exhaust pipe, the warm air mainly distributes in the upper region due to the buoyancy effect. With increasing distanc, the heat distribution becomes more uniform due to the heat transfer. As the air flow velocity increases, the average temperature rise in the exhaust pipe first increases before decreasing, indicating that the combustion is boosted by the air flow within 2 m/s, and excessive air flow velocity causes the combustion deterioration.
Author Contributions
Conceptualization, Z.L. and Z.W.; methodology, Z.L.; formal analysis, Z.L.; investigation, Z.L. and H.M.; resources, Z.W.; data curation, Z.L. and H.M.; writing—original draft preparation, Z.L.; writing—review and editing, Z.W.; visualization, Z.L.; supervision, Z.W.; project administration, Z.W. All authors have read and agreed to the published version of the manuscript.
Funding
This research is supported by National Natural Science Foundation of China (grant No.: 51806012) and Beijing Natural Science Foundation (3192032).
Data Availability Statement
Not applicable.
Conflicts of Interest
The authors declare no conflict of interest.
References
- Celik, A.; Yilmaz, M.; Yildiz, O.F. Improvement of diesel engine startability under low temperatures by vortex tubes. Energy Rep. 2020, 6, 17–27. [Google Scholar] [CrossRef]
- Pastor, J.; García-Oliver, J.M.; Pastor, J.; Ramírez-Hernández, J.G. Ignition and combustion development for high speed direct in-jection diesel engines under low temperature cold start conditions. Fuel 2011, 90, 1556–1566. [Google Scholar] [CrossRef] [Green Version]
- Ge, J.C.; Wu, G.; Choi, N.J. Comparative study of pilot–main injection timings and diesel/ethanol binary blends on combustion, emission and microstructure of particles emitted from diesel engines. Fuel 2021, 313, 122658. [Google Scholar] [CrossRef]
- Wu, G.; Ge, J.C.; Kim, M.S.; Choi, N.J. NOx–Smoke Trade-off Characteristics in a Palm Oil-Fueled CRDI Diesel Engine under Various Injection Pressures and EGR Rates. Appl. Sci. 2022, 12, 1069. [Google Scholar] [CrossRef]
- Zare, A.; Bodisco, T.A.; Nabi, M.N.; Hossain, F.M.; Ristovski, Z.D.; Brown, R.J. A comparative investigation into cold-start and hot-start operation of diesel engine performance with oxygenated fuels during transient and steady-state operation. Fuel 2018, 228, 390–404. [Google Scholar] [CrossRef]
- Niculae, A.L.; Chiriac, R.; Racovitza, A. Effects of Injection Rate Shape on Performance and Emissions of a Diesel Engine Fuelled by Diesel and Biodiesel B20. Appl. Sci. 2022, 12, 1333. [Google Scholar] [CrossRef]
- Ge, J.C.; Kim, H.Y.; Yoon, S.K.; Choi, N.J. Reducing volatile organic compound emissions from diesel engines using canola oil biodiesel fuel and blends. Fuel 2018, 218, 266–274. [Google Scholar] [CrossRef]
- Ge, J.C.; Kim, H.Y.; Yoon, S.K.; Choi, N.J. Optimization of palm oil biodiesel blends and engine operating parameters to improve performance and PM morphology in a common rail direct injection diesel engine. Fuel 2020, 260, 116326. [Google Scholar] [CrossRef]
- Ge, J.; Choi, N.J. Soot Particle Size Distribution, Regulated and Unregulated Emissions of a Diesel Engine Fueled with Palm Oil Biodiesel Blends. Energies 2020, 13, 5736. [Google Scholar] [CrossRef]
- Das, D.; Majumdar, G.; Sen, R.S.; Ghosh, B.B. The Effects of Thermal Barrier Coatings on Diesel Engine Performance and Emission. J. Inst. Eng. Ser. C 2014, 95, 63–68. [Google Scholar] [CrossRef]
- Celik, A.; Yilmaz, M.; Yildiz, O.F. Effects of vortex tube on exhaust emissions during cold start of diesel engines. Appl. Energy Combust. Sci. 2021, 6, 100027. [Google Scholar] [CrossRef]
- Van, T.C.; Zare, A.; Jafari, M.; Bodisco, T.A.; Surawski, N.; Verma, P.; Suara, K.; Ristovski, Z.; Rainey, T.; Stevanovic, S.; et al. Effect of cold start on engine performance and emissions from diesel engines using IMO-Compliant distillate fuels. Environ. Pollut. 2019, 255, 113260. [Google Scholar] [CrossRef] [PubMed]
- Zare, A.; Bodisco, T.A.; Jafari, M.; Verma, P.; Yang, L.; Babaie, M.; Rahman, M.; Banks, A.; Ristovski, Z.D.; Brown, R.J.; et al. Cold-start NOx emissions: Diesel and waste lubricating oil as a fuel additive. Fuel 2021, 286, 119430. [Google Scholar] [CrossRef]
- Lodi, F.; Zare, A.; Arora, P.; Stevanovic, S.; Jafari, M.; Ristovski, Z.; Brown, R.J.; Bodisco, T. Engine Performance and Emissions Analysis in a Cold, Intermediate and Hot Start Diesel Engine. Appl. Sci. 2020, 10, 3839. [Google Scholar] [CrossRef]
- Ko, J.; Son, J.; Myung, C.-L.; Park, S. Comparative study on low ambient temperature regulated/unregulated emissions character-istics of idling light-duty diesel vehicles at cold start and hot restart. Fuel 2018, 233, 620–631. [Google Scholar] [CrossRef]
- Yontar, A.A.; Zhou, M.; Ahmad, S. Influence of intake air temperature control on characteristics of a Homogeneous Charge Compression Ignition engine for hydrogen-enriched kerosene-dimethyl ether usage. Int. J. Hydrogen Energy 2020, 45, 22019–22031. [Google Scholar] [CrossRef]
- Pastor, J.V.; Bermúdez, V.; García-Oliver, J.; Ramírez-Hernández, J. Influence of spray-glow plug configuration on cold start combustion for high-speed direct injection diesel engines. Energy 2011, 36, 5486–5496. [Google Scholar] [CrossRef]
- Deng, Y.; Liu, H.; Zhao, X.; E, J.; Chen, J. Effects of cold start control strategy on cold start performance of the diesel engine based on a comprehensive preheat diesel engine model. Appl. Energy 2018, 210, 279–287. [Google Scholar] [CrossRef]
- Broatch, A.; Luján, J.M.; Serrano, J.R.; Pla, B. A procedure to reduce pollutant gases from Diesel combustion during European MVEG-A cycle by using electrical intake air-heaters. Fuel 2008, 87, 2760–2778. [Google Scholar] [CrossRef]
- Ramadhas, A.; Xu, H. Intake air heating strategy to reduce cold-start emissions from diesel engines. Biofuels 2018, 9, 405–414. [Google Scholar] [CrossRef]
- Lindl, B.; Schmitz, H.-G. Cold Start Equipment for Diesel Direct Injection Engines (No. 1999–01–1244); SAE International: Warrendale, PA, USA, 1999. [Google Scholar]
- Kreun, P.K.; Fajardo, C.M.; Baumann, A. Simulation of an Intake Manifold Preheater for Cold Engine Startup. J. Eng. Gas Turbines Power 2013, 135, 071505. [Google Scholar] [CrossRef]
- Zhang, C.; Liu, B.; Hu, J.; Yu, X.; Wang, X. Study on cold starting performance of a low compression ratio diesel engine by using intake flame preheating. Therm. Sci. 2020, 24, 51–62. [Google Scholar] [CrossRef]
- Papagiannakis, R. Study of air inlet preheating and EGR impacts for improving the operation of compression ignition engine running under dual fuel mode. Energy Convers. Manag. 2013, 68, 40–53. [Google Scholar] [CrossRef]
- Peng, H.; Cui, Y.; Shi, L.; Deng, K. Effects of exhaust gas recirculation (EGR) on combustion and emissions during cold start of direct injection (DI) diesel engine. Energy 2008, 33, 471–479. [Google Scholar] [CrossRef]
- Ladommatos, N.; Abdelhalim, S.M.; Zhao, H.; Hu, Z. Effects of EGR on Heat Release in Diesel Combustion; SAE International: Warrendale, PA, USA, 1998. [Google Scholar]
- Zhang, K.; Zheng, L.; Wang, J.; Wang, Z. Diesel diffusion flame simulation using reduced n-heptane oxidation mechanism. Appl. Energy 2013, 105, 223–228. [Google Scholar] [CrossRef]
- Maroteaux, F.; Noël, L. Development of a reduced n-heptane oxidation mechanism for HCCI combustion modeling. Combust. Flame 2006, 146, 246–267. [Google Scholar] [CrossRef]
Publisher’s Note: MDPI stays neutral with regard to jurisdictional claims in published maps and institutional affiliations. |
© 2022 by the authors. Licensee MDPI, Basel, Switzerland. This article is an open access article distributed under the terms and conditions of the Creative Commons Attribution (CC BY) license (https://creativecommons.org/licenses/by/4.0/).