
Comparison of the Performance of Artificial Intelligence Models Depending on the Labelled Image by Different User Levels


Abstract
:1. Introduction
2. Related Works
2.1. Artificial Intelligence in the Construction Industry
2.2. Importance of Raw Data and Labeling
2.3. AI in Specialized Fields
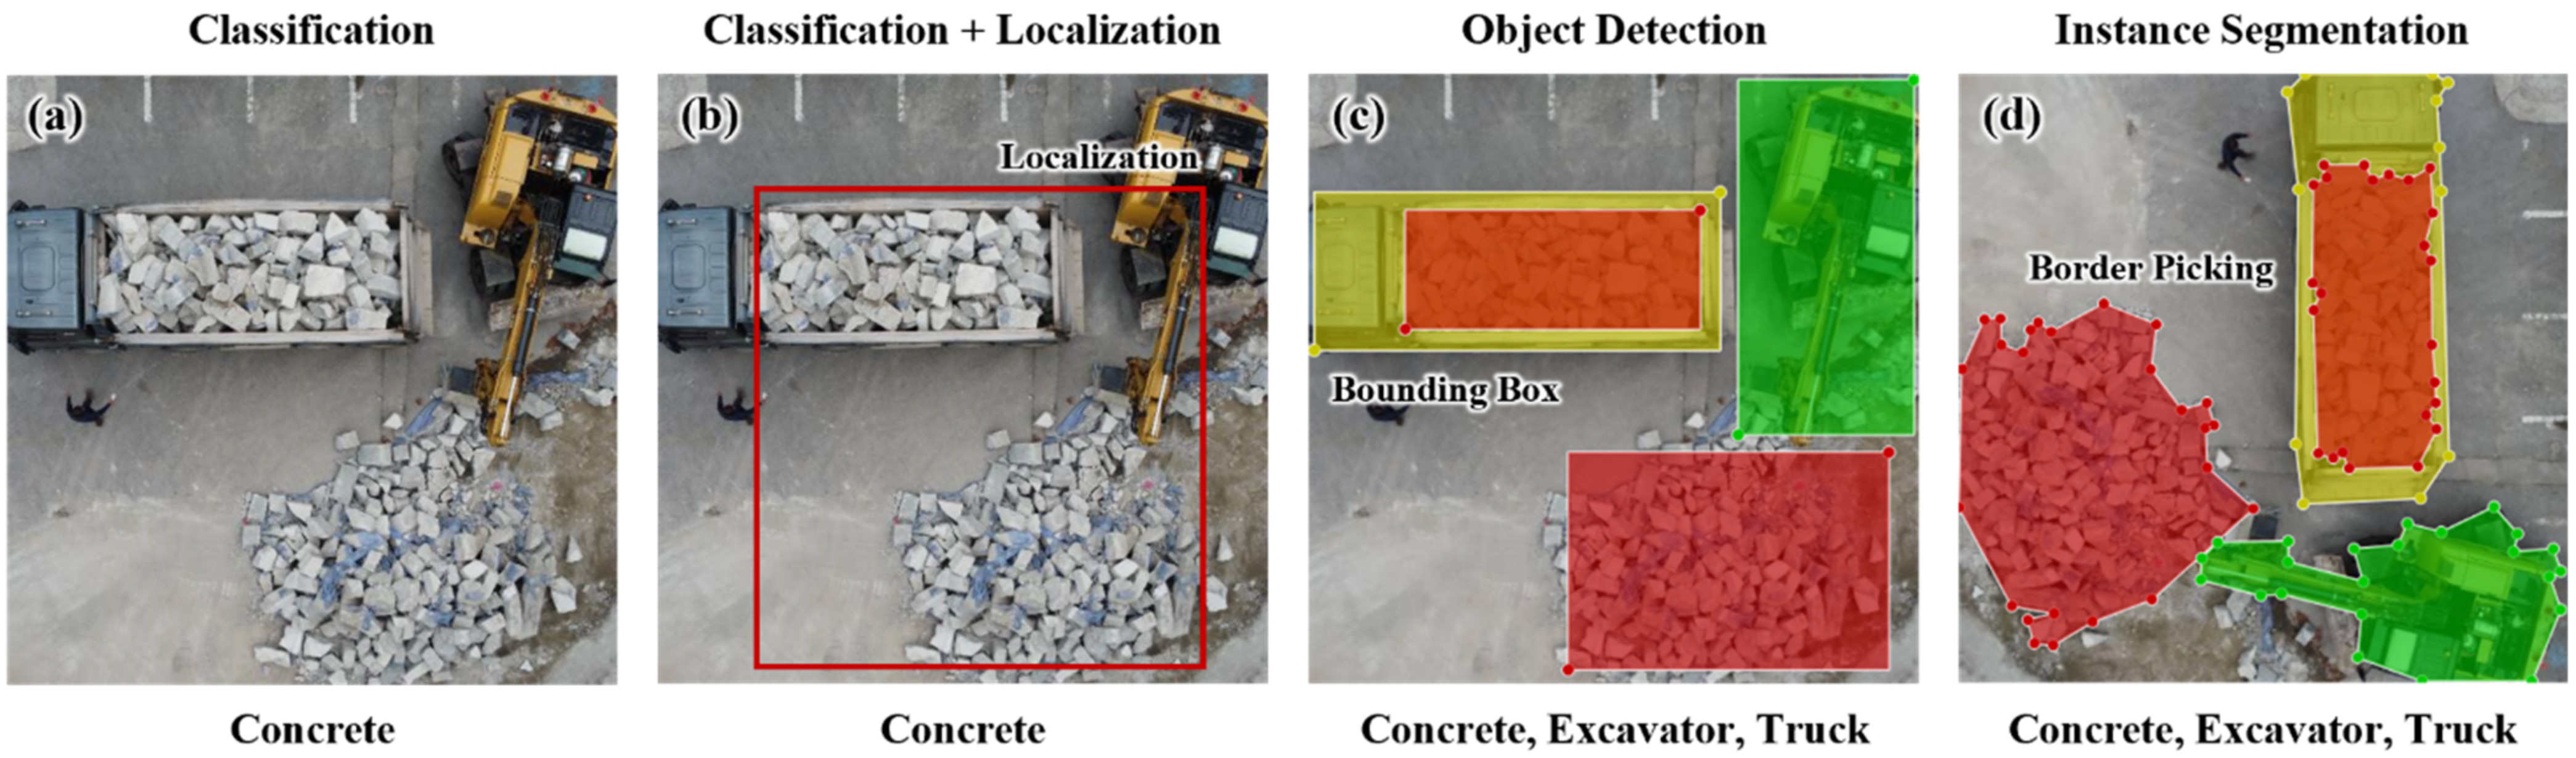
2.4. Instance Segmentation for Labelling
3. Comparison of mAP According to Data Pre-Processing Proficiency
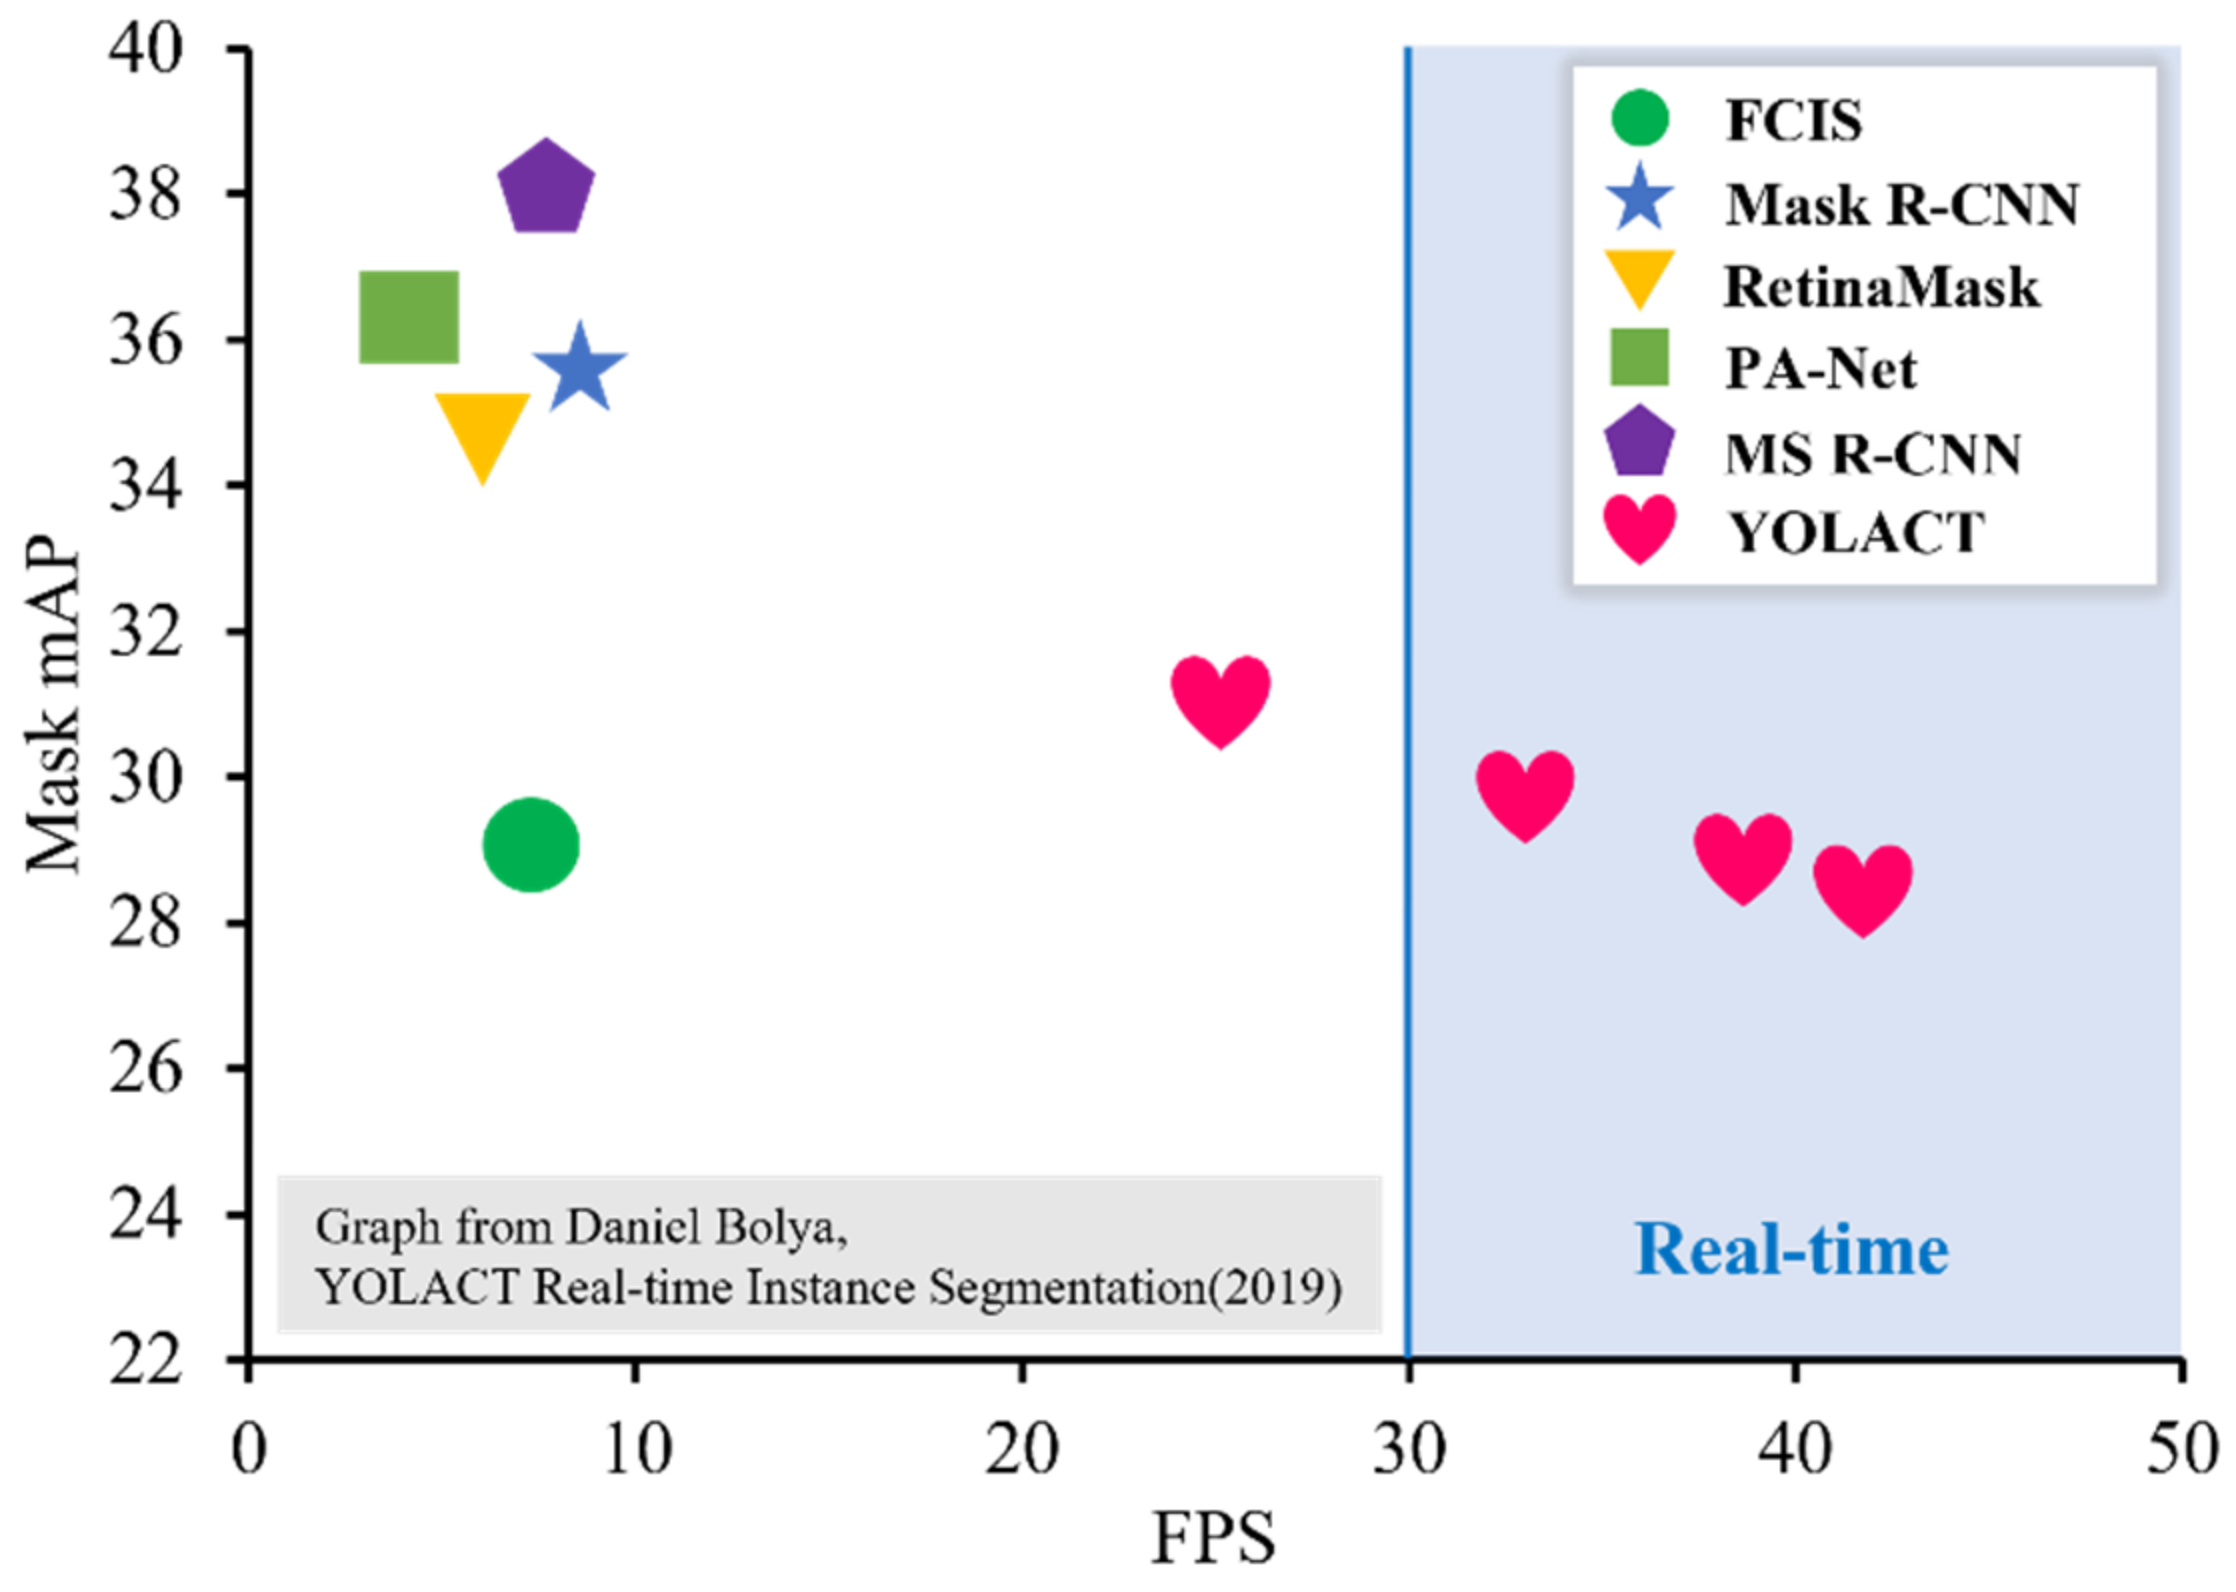
3.1. AI Model Selection
3.2. Criteria for Classification as Professional and Non-Professional
3.3. Learning Method
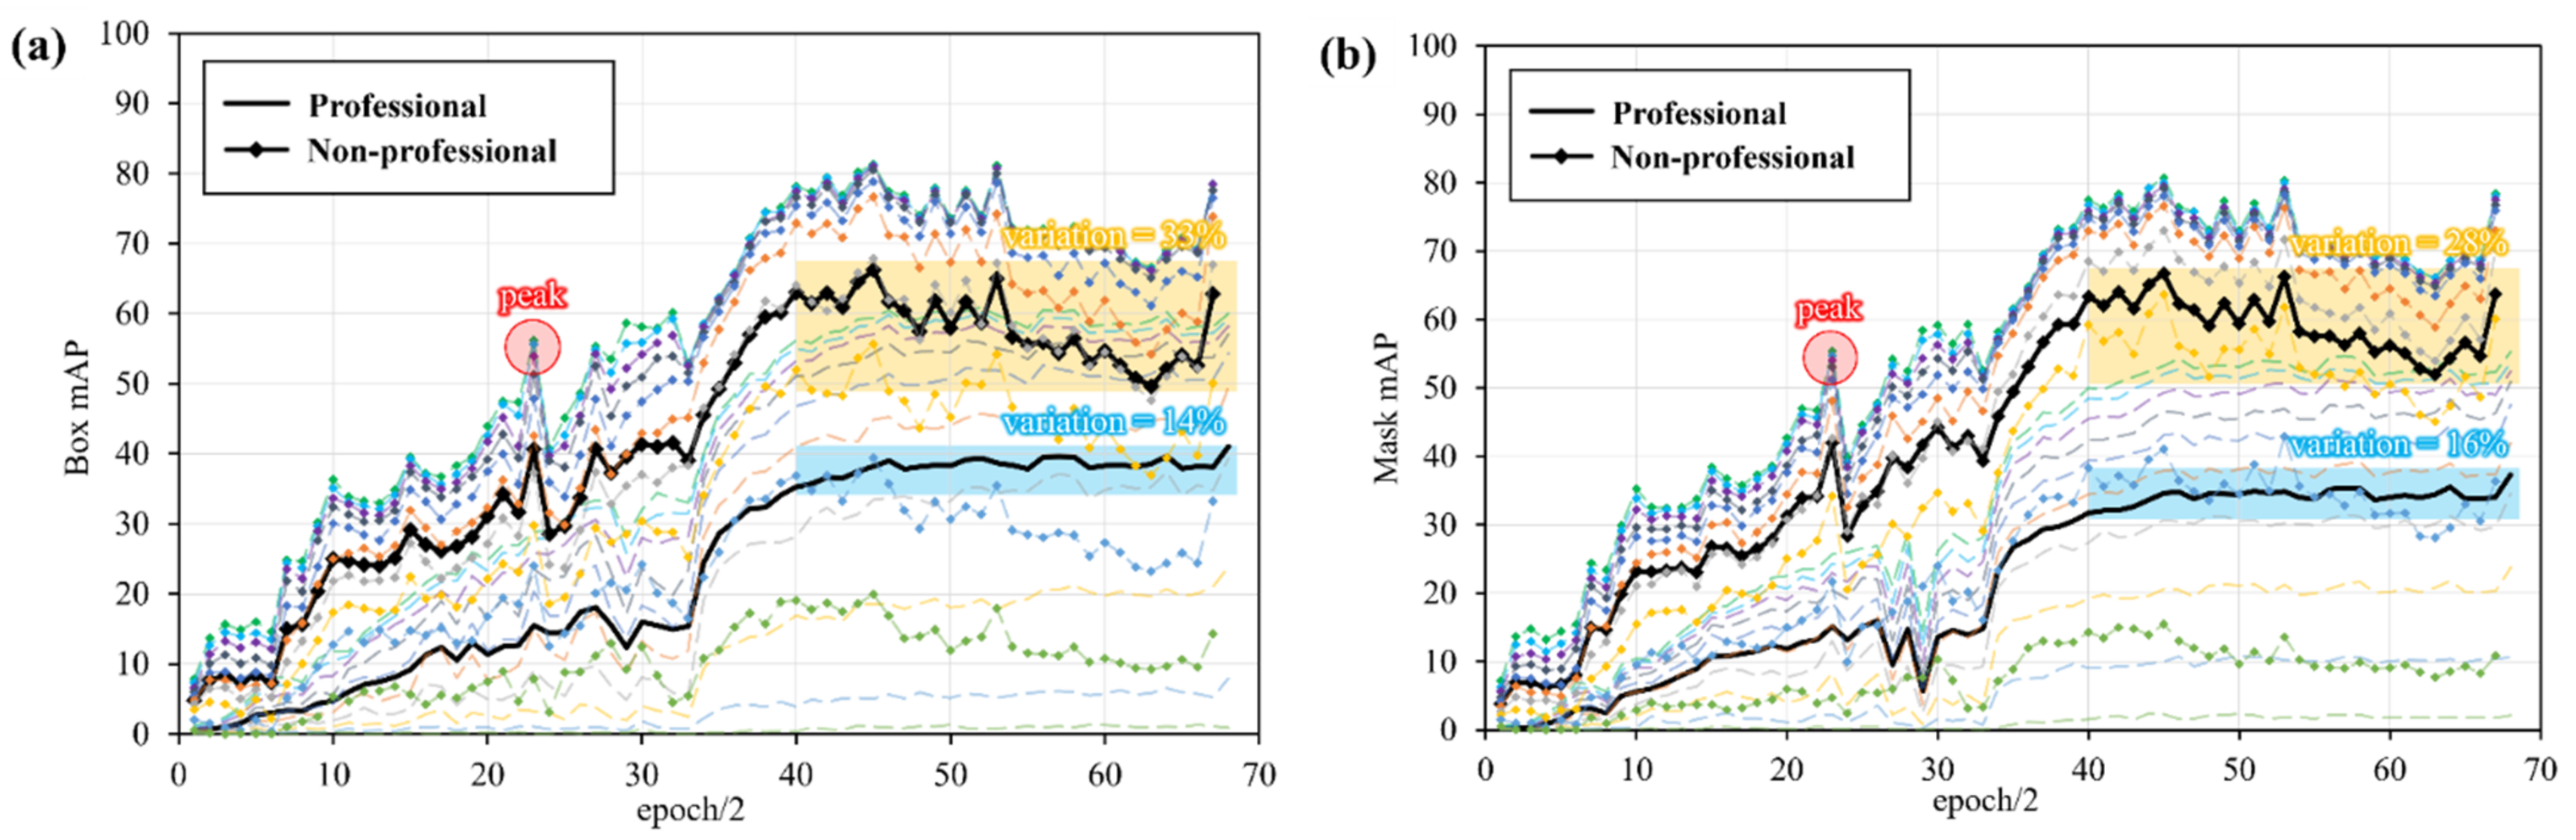
3.4. Learning Results Analysis
4. Discussion
5. Conclusions
Author Contributions
Funding
Institutional Review Board Statement
Informed Consent Statement
Data Availability Statement
Conflicts of Interest
References
- Kim, H.K. Apartment Prices in the Metropolitan Area Rise at an All-Time High for 8 Weeks. Available online: https://www.donga.com/news/Economy/article/all/20210909/109181926/1 (accessed on 10 December 2021).
- Korea Development Institute. KDI, Results of ‘Real Estate Forum’. Available online: https://www.kdi.re.kr/news/coverage_view.jsp?idx=11003 (accessed on 13 December 2021).
- Seoul Metropolitan Government. Seoul City’s ‘Relaxation of Redevelopment Regulations’ Will Be Applied in Earnes. First Nomination Contest. Available online: https://mediahub.seoul.go.kr/archives/2002616 (accessed on 5 January 2022).
- Korea Resource Recirculation Information System. National Waste Generation and Treatment Status. Available online: https://www.recycling-info.or.kr/rrs/stat/envStatDetail.do?menuNo=M13020201&pageIndex=1&bbsId=BBSMSTR_000000000002&s_nttSj=KEC005&nttId=1090&searchBgnDe=&searchEndDe= (accessed on 31 December 2020).
- Ko, D.-H. Gov’t seeks land to operate new waste treatment facilities. In The Korea Times; The Korea Times: Seoul, Korea, 2021. [Google Scholar]
- Kim, S.K. A Study on Separation Analysis of Woods from Construction Waste by the Double-Cyclone Windy Separator. In Proceedings of the Korean Society for Renewable Energy Conference, Jeju, Korea, 19–21 November 2018; p. 267. [Google Scholar]
- Davis, P.; Aziz, F.; Newaz, M.T.; Sher, W.; Simon, L. The classification of construction waste material using a deep convolutional neural network. Autom. Constr. 2021, 122, 103481. [Google Scholar] [CrossRef]
- Na, S.; Heo, S.-J.; Han, S. Construction Waste Reduction through Application of Different Structural Systems for the Slab in a Commercial Building: A South Korean Case. Appl. Sci. 2021, 11, 5870. [Google Scholar] [CrossRef]
- Ali, T.H.; Akhund, M.A.; Memon, N.A.; Memon, A.H.; Imad, H.U.; Khahro, S.H. Application of Artifical Intelligence in Construction Waste Management. In Proceedings of the 2019 8th International Conference on Industrial Technology and Management (ICITM), Cambridge, UK, 2–4 March 2019; IEEE: Piscataway, NJ, USA, 2019. [Google Scholar]
- Lu, W.; Chen, J.; Xue, F. Using computer vision to recognize composition of construction waste mixtures: A semantic segmentation approach. Resour. Conserv. Recycl. 2021, 178, 106022. [Google Scholar] [CrossRef]
- Raptopoulos, F.; Koskinopoulou, M.; Maniadakis, M. Robotic pick-and-toss facilitates urban waste sorting. In Proceedings of the 2020 IEEE 16th International Conference on Automation Science and Engineering (CASE), Hong Kong, China, 20–21 August 2020; IEEE: Piscataway, NJ, USA, 2020. [Google Scholar]
- Felderer, M.; Ramler, R. Quality Assurance for AI-Based Systems: Overview and Challenges (Introduction to Interactive Session). In Proceedings of the International Conference on Software Quality, Vienna, Austria, 19–21 January 2021; Springer: Cham, Switzerland, 2021. [Google Scholar]
- Adedeji, O.; Wang, Z. Intelligent Waste Classification System Using Deep Learning Convolutional Neural Network. Procedia Manuf. 2019, 35, 607–612. [Google Scholar] [CrossRef]
- Ahmad, K.; Khan, K.; Al-Fuqaha, A. Intelligent Fusion of Deep Features for Improved Waste Classification. IEEE Access 2020, 8, 96495–96504. [Google Scholar] [CrossRef]
- Aishwarya, A.; Wadhwa, P.; Owais, O.; Vashisht, V. A Waste Management Technique to detect and separate Non-Biodegradable Waste using Machine Learning and YOLO algorithm. In Proceedings of the 2021 11th International Conference on Cloud Computing, Data Science & Engineering (Confluence), Noida, India, 28–29 January 2021; IEEE: Piscataway, NJ, USA, 2021. [Google Scholar]
- Aral, R.A.; Keskin, S.R.; Kaya, M.; Haciomeroglu, M. Classification of trashnet dataset based on deep learning models. In Proceedings of the 2018 IEEE International Conference on Big Data (Big Data), Seattle, WA, USA, 10–13 December 2018; IEEE: Piscataway, NJ, USA, 2018. [Google Scholar]
- Bolya, D.; Zhou, C.; Xiao, F.; Lee, Y.J. Yolact: Real-time instance segmentation. In Proceedings of the IEEE/CVF International Conference on Computer Vision, Seoul, Korea, 27–28 October 2019. [Google Scholar]
- Lecun, Y.; Haffner, P.; Bottou, L.; Bengio, Y. Object Recognition with Gradient-Based Learning. In Shape, Contour and Grouping in Computer Vision; Springer: Berlin/Heidelberg, Germany, 1999; Volume 1681, pp. 319–345. [Google Scholar]
- LeCun, Y.; Bengio, Y.; Hinton, G. Deep learning. Nature 2015, 521, 436–444. [Google Scholar] [CrossRef]
- Spencer, B.F., Jr.; Hoskere, V.; Narazaki, Y. Advances in computer vision-based civil infrastructure inspection and monitoring. Engineering 2019, 5, 199–222. [Google Scholar] [CrossRef]
- Shin, Y.; Heo, S.; Han, S.; Kim, J.; Na, S. An Image-Based Steel Rebar Size Estimation and Counting Method Using a Convolutional Neural Network Combined with Homography. Buildings 2021, 11, 463. [Google Scholar] [CrossRef]
- Tejesh, B.S.S.; Neeraja, S. Warehouse inventory management system using IoT and open source framework. Alex. Eng. J. 2018, 57, 3817–3823. [Google Scholar] [CrossRef]
- Na, S.; Paik, I. Application of Thermal Image Data to Detect Rebar Corrosion in Concrete Structures. Appl. Sci. 2019, 9, 4700. [Google Scholar] [CrossRef] [Green Version]
- Bulut, A.; Singh, A.K.; Shin, P.; Fountain, T.; Jasso, H.; Yan, L.; Elgamal, A. Real-time nondestructive structural health monitoring using support vector machines and wavelets. In Advanced Sensor Technologies for Nondestructive Evaluation and Structural Health Monitoring; International Society for Optics and Photonics: Bellingham, WA, USA, 2005. [Google Scholar]
- Koch, C.; Georgieva, K.; Kasireddy, V.; Akinci, B.; Fieguth, P. A review on computer vision based defect detection and condition assessment of concrete and asphalt civil infrastructure. Adv. Eng. Inform. 2015, 29, 196–210. [Google Scholar] [CrossRef] [Green Version]
- Son, H.; Seong, H.; Choi, H.; Kim, C. Real-Time Vision-Based Warning System for Prevention of Collisions between Workers and Heavy Equipment. J. Comput. Civ. Eng. 2019, 33, 04019029. [Google Scholar] [CrossRef]
- Jeong, E.; Seo, J.; Wacker, J. Literature Review and Technical Survey on Bridge Inspection Using Unmanned Aerial Vehicles. J. Perform. Constr. Facil. 2020, 34, 04020113. [Google Scholar] [CrossRef]
- Chen, G.; Liang, Q.; Zhong, W.; Gao, X.; Cui, F. Homography-based measurement of bridge vibration using UAV and DIC method. Measurement 2021, 170, 108683. [Google Scholar] [CrossRef]
- Reagan, D.; Sabato, A.; Niezrecki, C. Feasibility of using digital image correlation for unmanned aerial vehicle structural health monitoring of bridges. Struct. Health Monit. 2018, 17, 1056–1072. [Google Scholar] [CrossRef]
- Weng, Y.; Shan, J.; Lu, Z.; Lu, X.; Spencer, B.F. Homography-based structural displacement measurement for large structures using unmanned aerial vehicles. Comput.-Aided Civ. Infrastruct. Eng. 2021, 36, 1114–1128. [Google Scholar] [CrossRef]
- Xu, Y.; Zhou, Y.; Sekula, P.; Ding, L. Machine learning in construction: From shallow to deep learning. Dev. Built Environ. 2021, 6, 100045. [Google Scholar] [CrossRef]
- Yang, Q.; Shi, W.; Chen, J.; Lin, W. Deep convolution neural network-based transfer learning method for civil infrastructure crack detection. Autom. Constr. 2020, 116, 103199. [Google Scholar] [CrossRef]
- Akinosho, T.D.; Oyedele, L.O.; Bilal, M.; Ajayi, A.O.; Delgado, M.D.; Akinade, O.O.; Ahmed, A.A. Deep learning in the construction industry: A review of present status and future innovations. J. Build. Eng. 2020, 32, 101827. [Google Scholar] [CrossRef]
- Jahanshahi, M.R.; Masri, S.F.; Padgett, C.W.; Sukhatme, G.S. An innovative methodology for detection and quantification of cracks through incorporation of depth perception. Mach. Vis. Appl. 2013, 24, 227–241. [Google Scholar] [CrossRef]
- Xu, Y.; Li, Y.; Liu, M.; Wang, Y.; Lai, M.; Chang, E.I. Gland Instance Segmentation by Deep Multichannel Side Supervision. In Proceedings of the International Conference on Medical Image Computing and Computer-Assisted Intervention, Athens, Greece, 17–21 October 2016. [Google Scholar]
- Yang, L.; Zhang, Y.; Chen, J.; Zhang, S.; Chen, D.Z. Suggestive Annotation: A Deep Active Learning Framework for Biomedical Image Segmentation. In Proceedings of the International Conference on Medical Image Computing and Computer-Assisted Intervention, Quebec City, QC, Canada, 10–14 September 2017. [Google Scholar]
- Litjens, G.; Kooi, T.; Bejnordi, B.E.; Setio, A.A.A.; Ciompi, F.; Ghafoorian, M.; van der Laak, J.A.W.M.; van Ginneken, B.; Sánchez, C.I. A survey on deep learning in medical image analysis. Med. Image Anal. 2017, 42, 60–88. [Google Scholar] [CrossRef] [PubMed] [Green Version]
- Wynants, L.; Van Calster, B.; Collins, G.S.; Riley, R.D.; Heinze, G.; Schuit, E.; Bonten, M.M.J.; Dahly, D.L.; Damen, J.A.; Debray, T.P.A.; et al. Prediction models for diagnosis and prognosis of Covid-19: Systematic review and critical appraisal. BMJ 2020, 369, m1328. [Google Scholar] [CrossRef] [PubMed] [Green Version]
- Roberts, M.; Covnet, A.; Driggs, D.; Thorpe, M.; Gilbey, J.; Yeung, M.; Ursprung, S.; Aviles-Rivero, A.I.; Etmann, C.; McCague, C.; et al. Common pitfalls and recommendations for using machine learning to detect and prognosticate for COVID-19 using chest radiographs and CT scans. Nat. Mach. Intell. 2021, 3, 199–217. [Google Scholar] [CrossRef]
- Lynn, N.C.; Kyu, Z.M. Segmentation and Classification of Skin Cancer Melanoma from Skin Lesion Images. In Proceedings of the 2017 18th International Conference on Parallel and Distributed Computing, Applications and Technologies (PDCAT), Taipei, Taiwan, 18–20 December 2017; IEEE: Piscataway, NJ, USA, 2017. [Google Scholar]
- Zeebaree, D.Q.; Haron, H.; Abdulazeez, A.M.; Zebari, D.A. Machine Learning and Region Growing for Breast Cancer Segmentation. In Proceedings of the 2019 International Conference on Advanced Science and Engineering (ICOASE), Zakho-Duhok, Iraq, 2–4 April 2019; IEEE: Piscataway, NJ, USA, 2019. [Google Scholar]
- Brünger, J.; Gentz, M.; Traulsen, I.; Koch, R. Panoptic instance segmentation on pigs. arXiv 2020, arXiv:2005.10499. [Google Scholar]
- Li, Y.; Qi, H.; Dai, J.; Ji, X.; Wei, Y. Fully Convolutional Instance-Aware Semantic Segmentation. In Proceedings of the IEEE Conference on Computer Vision and Pattern Recognition, Honolulu, HI, USA, 21–26 July 2017. [Google Scholar]
- Zhao, Z.Q.; Zheng, P.; Xu, S.T.; Wu, X. Object detection with deep learning: A review. IEEE Trans. Neural Netw. Learn. Syst. 2019, 30, 3212–3232. [Google Scholar] [CrossRef] [Green Version]
- He, K.; Gkioxari, G.; Dollár, P.; Girshick, R. Mask R-CNN. In Proceedings of the IEEE International Conference on Computer Vision, Honolulu, HI, USA, 21–26 July 2017. [Google Scholar]
- Zhaojin, H. Mask Scoring R-CNN. In Proceedings of the IEEE/CVF Conference on Computer Vision and Pattern Recognition, Long Beach, CA, USA, 16–20 June 2019. [Google Scholar]
- Liu, S.; Qi, L.; Qin, H.; Shi, J.; Jia, J. Path Aggregation Network for Instance Segmentation. In Proceedings of the IEEE Conference on Computer Vision and Pattern Recognition, Salt Lake City, UT, USA, 18–23 June 2018. [Google Scholar]
- Fu, C.-Y.; Shvets, M.; Berg, A.C. RetinaMask: Learning to predict masks improves state-of-the-art single-shot detection for free. arXiv 2019, arXiv:1901.03353. [Google Scholar]
- Heo, S.; Han, S.; Shin, Y.; Na, S. Challenges of Data Refining Process during the Artificial Intelligence Development Projects in the Architecture, Engineering and Construction Industry. Appl. Sci. 2021, 11, 10919. [Google Scholar] [CrossRef]
- Cheng, G.; Yang, J.; Gao, D.; Guo, L.; Han, J. High-Quality Proposals for Weakly Supervised Object Detection. IEEE Trans. Image Process. 2020, 29, 5794–5804. [Google Scholar] [CrossRef] [PubMed]
- Cheng, G.; Han, J.; Zhou, P.; Xu, D. Learning Rotation-Invariant and Fisher Discriminative Convolutional Neural Networks for Object Detection. IEEE Trans. Image Process. 2018, 28, 265–278. [Google Scholar] [CrossRef]
- Lin, T.Y.; Maire, M.; Belongie, S.; Bourdev, L.; Girshick, R.; Hays, J.; Perona, P.; Zitnick, C.L.; Dollár, P. Microsoft Coco: Common Objects in Context. In European Conference on Computer Vision 2014; Springer: Cham, Switzerland, 2014. [Google Scholar]


| Iteration | User | All | 0.50 | 0.55 | 0.60 | 0.65 | 0.70 | 0.75 | 0.80 | 0.85 | 0.90 | 0.95 | |
|---|---|---|---|---|---|---|---|---|---|---|---|---|---|
| 10,000 | Professional | Box | 41.02 | 59.97 | 59.20 | 58.18 | 57.02 | 54.27 | 49.51 | 39.31 | 23.87 | 7.95 | 0.89 |
| Mask | 37.27 | 55.28 | 53.66 | 52.43 | 50.85 | 47.49 | 41.94 | 34.53 | 23.70 | 10.65 | 2.16 | ||
| Non-Professional | Box | 62.77 | 78.41 | 78.41 | 78.41 | 77.59 | 76.51 | 73.86 | 67.00 | 50.06 | 33.19 | 14.27 | |
| Mask | 63.74 | 78.41 | 78.03 | 77.53 | 76.79 | 75.93 | 73.02 | 70.33 | 60.13 | 36.34 | 10.83 |
| Regularly Shaped Object | Semi-Regularly Shaped Object | ||
|---|---|---|---|
| bicycle | kite | bed | person |
| car | baseball bat | dining table | traffic light |
| motorcycle | baseball glove | toilet | bird |
| airplane | skateboard | TV | cat |
| bus | surfboard | laptop | dog |
| train | tennis racket | mouse | horse |
| truck | bottle | remote | sheep |
| boat | wine glass | keyboard | cow |
| fire hydrant | cup | cell phone | elephant |
| stop sign | fork | microwave | bear |
| parking meter | knife | oven | zebra |
| bench | spoon | toaster | giraffe |
| backpack | bowl | sink | sandwich |
| umbrella | banana | refrigerator | hot dog |
| handbag | apple | book | pizza |
| tie | orange | clock | donut |
| suitcase | broccoli | vase | cake |
| Frisbee | carrot | scissor | |
| skis | chair | teddy bear | |
| snowboard | couch | hair drier | |
| sports ball | potted plant | toothbrush | |
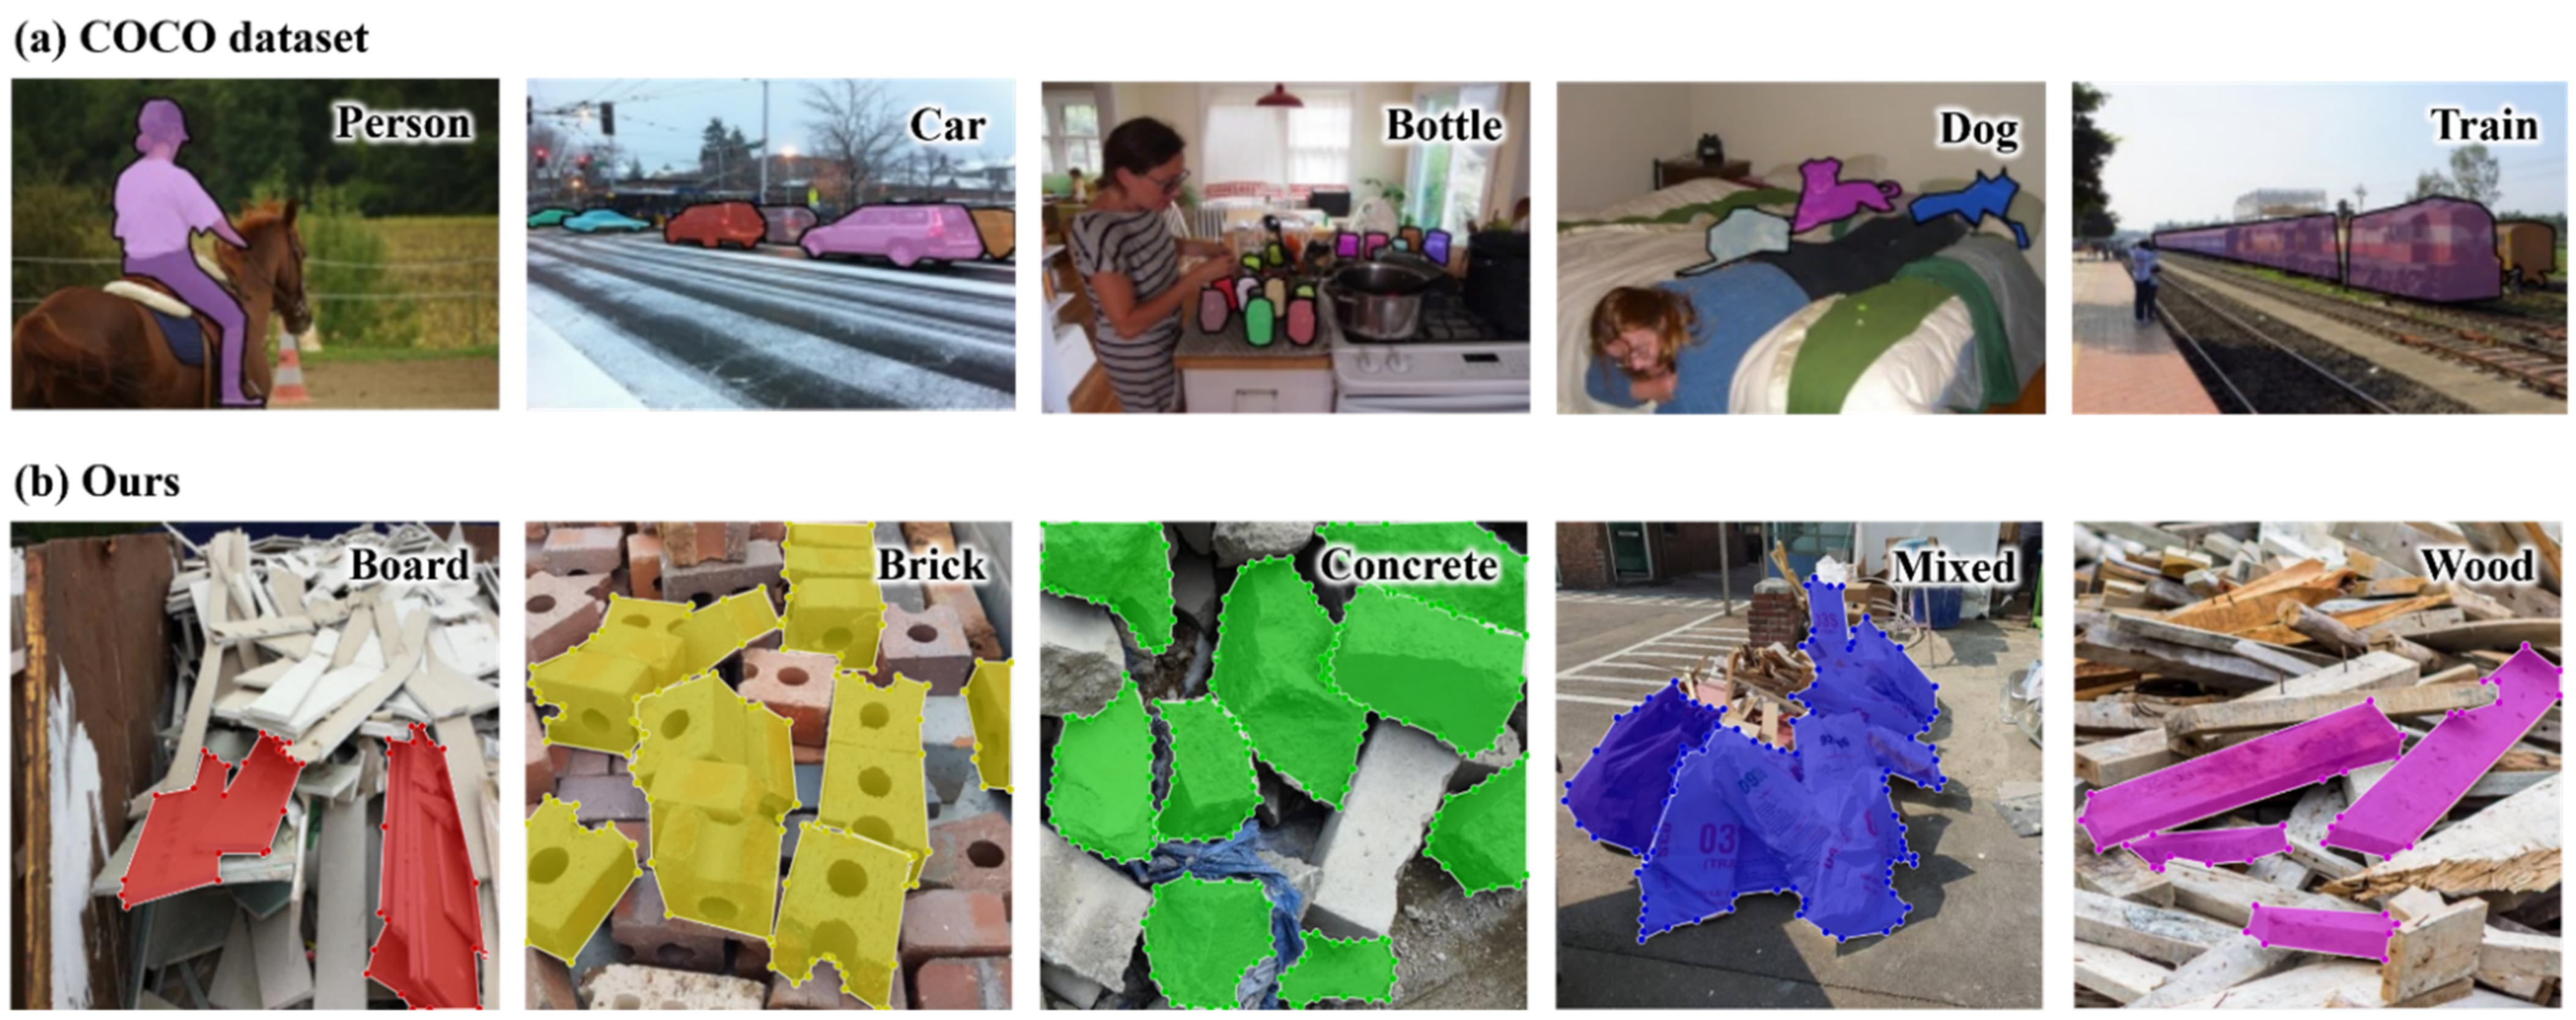
| (a) MS COCO dataset | Person | Car | Bottle | Dog | Train |
| 10,777 | 1918 | 1013 | 218 | 190 | |
| (b) Ours | Board | Brick | Concrete | Mixed | Wood |
| 126 | 112 | 113 | 109 | 139 |
Publisher’s Note: MDPI stays neutral with regard to jurisdictional claims in published maps and institutional affiliations. |
© 2022 by the authors. Licensee MDPI, Basel, Switzerland. This article is an open access article distributed under the terms and conditions of the Creative Commons Attribution (CC BY) license (https://creativecommons.org/licenses/by/4.0/).
Share and Cite
Sunwoo, H.; Choi, W.; Na, S.; Kim, C.; Heo, S. Comparison of the Performance of Artificial Intelligence Models Depending on the Labelled Image by Different User Levels. Appl. Sci. 2022, 12, 3136. https://doi.org/10.3390/app12063136
Sunwoo H, Choi W, Na S, Kim C, Heo S. Comparison of the Performance of Artificial Intelligence Models Depending on the Labelled Image by Different User Levels. Applied Sciences. 2022; 12(6):3136. https://doi.org/10.3390/app12063136
Chicago/Turabian StyleSunwoo, Hyobin, Wonjun Choi, Seunguk Na, Cheekyeong Kim, and Seokjae Heo. 2022. "Comparison of the Performance of Artificial Intelligence Models Depending on the Labelled Image by Different User Levels" Applied Sciences 12, no. 6: 3136. https://doi.org/10.3390/app12063136
APA StyleSunwoo, H., Choi, W., Na, S., Kim, C., & Heo, S. (2022). Comparison of the Performance of Artificial Intelligence Models Depending on the Labelled Image by Different User Levels. Applied Sciences, 12(6), 3136. https://doi.org/10.3390/app12063136