Featured Application
The research presented in this paper is related to the implementation of a universal, relatively easy to manufacture, and inexpensive attachment in the form of a device that would work with any conventional ultrasound B-mode scanner. This device would enable rapid (about a minute), non-invasive, safe, operator-independent, automatic, and reproducible three-dimensional ultrasound imaging of tissue structure throughout the entire volume of the female breast in vivo, in water immersion condition. This imaging could be significantly helpful for diagnostic physicians in detecting breast cancer lesions. It is also possible to use this attachment, for example, for the lower and upper extremities, to monitor after injuries and trauma.
Abstract
Three-dimensional automated breast ultrasound (ABUS) systems seem to offer excellent results in breast cancer screening tests and its early detection, comparable to handheld ultrasound B-mode scanning, with the benefit of saving physician time and reducing handheld ultrasound issues. Nevertheless, the ABUS systems are not very popular, due to the cost and very narrow application. The multi-angle conventional 3D ultrasound compound imaging method (MACUI) is intended for use with standard B-mode scanners in order to reduce cost but preserve the advantages of ABUS systems. The rotational probe movement is utilized in order to collect images for the three-dimensional reconstruction of the scanned tissue’s anatomy. The authors evaluate the capabilities to increase the scanned volume and quality of reconstructions, which are limited in current MACUI implementations, with a probe tilt and shift. The study shows and discusses the results of the imaging using different probes available for SmartUs Telemed B-Mode scanner at different scanning geometry in order to determine the capabilities of such an ultrasound imaging system. The results discussed in the paper highlight the benefits in quality improvement and scanning area obtained with tilted and shifted probes, as well as the advantages of using a relatively simple convex probe that does not incorporate software beam steering over more advanced devices.
1. Introduction
Disability-adjusted life years (DALY) lost due to breast cancer outnumber any other type of cancer among women. Over the last five years, 7.8 million women have been diagnosed with breast cancer, of which 2.8 million in 2020. These numbers rank breast cancer as the most widespread cancer, affecting women of any age. Early detection of breast cancer is one of the major factors in reducing mortality and has been proven successful in high-income countries [1]. Mammography (MMG) has been widely used as a screening technique in the prevention of breast cancer. However, even if its overall sensitivity is relatively high and can reach 85%, there are significant trade-offs, such as cost, radiation exposure, and a significant drop in sensitivity in the case of women with dense breasts. The possibilities of early detection of breast malignancy can then be limited due to the decreased sensitivity of a system. It is particularly important because women with dense breasts have an increased risk of developing cancer and have a worse prognosis of interval cancer by screen-detected cancer [2,3]. Mammographic screening also has limitations, such as overdiagnosis and overtreatment, [4] and, although it is the only screening method, is being phased out in many countries due to its low effectiveness [5]. Recently, a new mammographic test called 3D mammography (tomosynthesis) has been introduced. The test shows higher sensitivity compared to traditional mammography (2D). However, the method is very similar because it is based on X-rays and therefore has the same contraindications. Standard handheld ultrasound (HHUS) B-mode examinations can reveal mammographically occult breast lesions. Due to its nature as a non-invasive and non-ionizing modality that does not cause additional radiation exposure, ultrasound imaging (USI) can be used as a complementary screening modality and is recommended for women with dense breast tissue in order to improve the sensitivity of screening tests [6]. In addition, magnetic resonance imaging (MRI) is the preferred method of breast examination in women at high risk of developing cancer. This imaging modality has high sensitivity and moderate specificity for tumor masses larger than 5 mm, including ductal carcinoma in situ (DCIS) [7]. Magnetic resonance imaging provides qualitative and quantitative data on tumor vascularization and allows the differentiation of benign from malignant masses, with the ability to analyze breast morphology. Furthermore, several other imaging modalities can be used, and are currently in the interest of researchers, to create a more comprehensive representation of breast tissue structure [8], in addition to the most widely used breast imaging diagnostic exams (MMG, HHUS, and MRI). There is no doubt that in order to improve breast cancer detection, new non-invasive, painless, and safe imaging modalities are needed that combine the advantages of MMG, HHUS, and MRI, while allowing the imaging of the three-dimensional structure of the interior of the whole breast in vivo as rapidly, accurately, reproducibly, and operator-independently as possible. The use of ultrasonic waves for this purpose seems particularly promising.
The subject of interest of the authors of this paper is the possibility of 3D breast ultrasound examination using an especially designed, universal, relatively easy to manufacture, and inexpensive device that would work with any conventional ultrasound B-mode scanner. Currently, 3D automated breast ultrasound represents an innovative technology that has received FDA (Food and Drug Administration) approval for the screening or early detection of breast cancer in the United States, particularly in women with dense glandular tissue [9]. Manufacturers already offer several certified 3D supine automated ultrasound (SAUS) systems of the breast on the market, as follows: 3D automated breast ultrasound (LOGIQ, Invenia ABUS, somo∙v ABUS–trademark of the General Electric Healthcare company) and 3D automated breast volume scanning (ACUSON S2000 ABVS trademark of Siemens company, SOFIA trademark of Hitachi). ABUS systems are available in the following two designs, due to the way the breast is scanned: supine (women lie on the back) [9,10] and prone (women lie on the abdomen) [11,12].
The latest devices for ABUS in supine patient position consist of an articulated arm with a long array of ultrasonic transducers, a touchscreen monitor, and a dedicated workstation for image interpretation. Transducers are automatically adjusted to an operating frequency of approximately 5–15 MHz, depending on the selected depth (range) of breast tissue scanning. Once the ultrasound probe is placed on the breast, the breast tissue is scanned in an inferior (from the direction of the legs) to a superior direction (toward the head) to obtain an image. The ultrasound probe used in ABUS systems is approximately 15 cm long [13]. In comparison, the high-resolution ultrasound probe used for scanning in conventional B-mode HHUS scanners is much shorter (approximately 6 cm). The advantage of using a long transducer array is the ability to obtain a wide imaging field, which allows the visualization of a much wider range of breast tissue during a single scanning motion. The resulting 3D datasets contain hundreds of images per acquisition in ~2 mm slices, without overlap. The technical advancement of ABUS systems lies in the use of special software that enables optimized image quality with high resolution and uniformity through advanced reconstruction algorithms and auto-adjustment of settings, such as frequency, gain compensation, and speckle reduction [14].
The diagnostic approach in the ABUS in prone patient position is different [11]. In this case, the breast is compressed by the patient’s body weight. The bed has a small recess in which a linear ultrasound probe, about 10 cm long, is placed beneath. The probe is under a glass layer, on which ultrasound gel is applied. The woman is placed so that the breast fills the cavity. Thus, the breast changes shape and flattens when it touches the recess walls and their glass base, which are covered with the ultrasound gel. Automatic breast scan is activated by the touch screen monitor when the patient is placed properly with the nipple in the center of the bed recess. The ultrasound probe rotates clockwise around an axis passing near the extreme end of its length until a full 360° breast scan is completed. During the full rotation of the probe, the entire breast volume is scanned in less than a minute. It is possible to reach into the breast tissue to a depth of 6 cm. After scanning is complete, 3D images are reconstructed and can be visualized in all planes (e.g., sagittal, transverse, coronal, and radial).
ABUS (or ABVS), compared to HHUS, is still under clinical investigation for the detection and characterization of breast cancer lesions, diagnostic efficacy, sensitivity, and specificity [15,16]. There are studies available in the literature on a relatively small number of patients that show similar results in terms of the sensitivity and specificity of ABUS compared to HHUS [17,18,19,20]. The results of the comparative study between MRI, HHUS, and ABVS presented by Girometti et al. in [21], with respect to the prediction of breast cancer size on histology, confirm the superiority of MRI. However, ABVS was slightly more accurate than MRI in the subgroup of lesions of ≤2 cm. In contrast, ABVS showed better histological agreement than HHUS, especially for intraductal tumors and lesions of >2 cm. Both of the techniques showed significant or near perfect agreement in evaluating the sonographic characteristics of breast lesions. The study [21] concluded that ABVS was better than HHUS, and similar to MRI, in assessing the size of breast cancer. In the paper [22], Wojcinski et al. compared the concordance of ABVS with HHUS using the Kappa statistic, which is frequently used to estimate inter-rater reliability [23]. Cohen’s Kappa value was κ = 0.37, indicating good agreement. In conclusion, they stated that ABVS should still be considered as an experimental technique of breast ultrasound, which definitely needs further evaluation studies. However, the literature also shows results that confirm that ABUS was more accurate than HHUS in assessing the extent of the disease and the average size of the lesion [24], the larger diameter [25], and the total volume [26] are important in the preoperative field to assess the real extension of the lesion. Compared to HHUS, ABUS allows the better detection of architectural distortions and hyperechoic rims in the coronal plane [27,28]. The complete data acquired from the entire breast volume enable the better determination of the 3D location of a lesion with less inter-observer variability. This allows for more reproducible and less operator-dependent examination in an optimized reading environment [27,28,29,30,31]. Furthermore, digital data enable computer-aided detection (CAD) and quantitative texture analysis of breast lesions [32]. Another interesting application is the possibility of correlating the imaging features obtained with ABUS with the molecular subtypes of breast cancer. Zheng et al. [33], in a study of malignant breast tumors, showed a strong correlation between the “retraction phenomenon” and molecular subtypes. Therefore, compared to HHUS, ABUS is a valuable additional tool, not only in screening, but also in the clinical field, in the characterization and diagnostic accuracy of breast lesions. In general, it can be concluded that ABUS offers a valuable impact on the detection and differentiation of malignant from benign breast lesions, with higher inter-observer agreement. The use of this technique, both in screening, as an adjunct to MMG, and in clinical practice, appears to offer excellent results, not worse than the traditional HHUS examination, with the benefit of great savings in physician time and a reduction in some of the most common problems associated with HHUS [34]. ABUS and digital tomosynthesis are currently thought to be the most promising candidates to supplement population-based breast cancer screening in women with heterogeneous and extremely dense breasts who do not meet the high-risk criteria for MRI screening [9]. The presumed incremental cancer detection rates of approximately 2 per 1000, in addition to mammography, for both modalities are in the same range. However, ABUS is a tomographic method that does not have the adverse effects of ionizing radiation and detects a spectrum of invasive cancers different from that of tomosynthesis. Moreover, due to its characteristics, ABUS is particularly promising for research using artificial intelligence and radiomics, opening up new and fascinating research scenarios in the diagnostic field [15]. However, there are also some major limitations of ABUS, such as the exclusion of the axillary region from the field of view and the lack of tools to assess vascularity and tissue elasticity [35].
In view of the above analysis regarding ABUS systems, their specialized application, and their significant purchase costs, they are not very popular. A significant number of medical centers and physicians currently use freehand examinations for breast diagnosis, performed with more versatile conventional B-mode ultrasound (HHUS) scanners. Thus, there is a rationale and a market need to design a less expensive and more versatile system for the three-dimensional visualization of the structure of the entire breast system that is capable of working with any B-mode scanner and ultrasound probe. It may be expected that the availability of non-expensive primary or secondary screening techniques enabling 3D ultrasound imaging can widen the accessibility of screening tests supported by more comprehensive 3D breast structure reconstruction for women and increase their sensitivity accompanying MMG. Multi-angle conventional ultrasound imaging (MACUI) aims to fit into this area. The system has previously been proposed and evaluated by the authors of this paper [36]. Recently, a similar approach has been presented and tested by Lucass et al. [37]. Existing and developing models and prototypes of MACUI devices assume the use of linear ultrasound transducers mounted strictly horizontally under the breast tank in such a way that their rotation is performed accurately around the first piezoelectric element of the multi-element array B-mode probe.
The novelty and essence of the MACUI system developed by the authors of this paper is to increase the volume scanning area of the breast, as well as to improve the quality and resolution of 3D ultrasound imaging of the breast structure by appropriately tilting the mid-length ultrasound B-mode probe relative to the horizontal plane and placed outside the rotation axis (Figure 1a). This can be motivated by the widening imaging area, which can cover entire transversal and sagittal sections, even for a large size. Additionally, the free space on the rotation axis surrounding leaves the space for the breast holder used for the stretching the female breast submerged in water and stabilizing the position during scanning [38]. The tilt of the probe allows for improved contrast and imaging resolution by using a method of superimposing and averaging images over a large area (compound imaging-CI) that are acquired at opposite angles (Figure 1a). In this way, it is possible to use somewhat lower ultrasound frequencies in order to increase the range without significant deterioration of the imaging quality. The spatial CI method is also used as an additional imaging modality in conventional HHUS, in the configuration shown in Figure 1b [39]. The essence of CI is to acquire multiple image frames at different angles, which are then digitally superimposed in accordance with the angle of scanning, e.g., by the proper averaging of pixels. The ultrasound beam is steered by a different set of predetermined angles (usually between three and seven), typically within 20 degrees of the perpendicular. The significant advantages of CI imaging include [40] the following: reduction in spots and noise (speckles), which improves tissue differentiation and increases the clarity of low contrast pathological changes; reduction in multiple reflections affecting the clear visualization of cyst content, better detection of microcalcifications, increasing the depth at which useful data are visualized; continuity of structures reflecting the ultrasonic wave affecting the highlighting of the outlines of cysts, canals, and connective tissue, better visualization of systems of linear striations in fat and muscles, improved presentation of the internal architecture of hard lesions; keeping the central acoustic shadow and acoustic amplification behind shading structures enabling the recognized diagnostic criteria for cysts and nodules; reduction in refractive shadows enabling rapid identification of suspicious shadows and improving the visibility of structures located, for example, behind the ligaments. With all of these advantages, CI imaging can be very useful for detecting and distinguishing between malignant and benign lesions in breast tissue in women. It should also be mentioned that another configuration of scanning the breast in the horizontal plane using FASCI (full-angle spatial compound imaging) allows the best results of 3D breast imaging in terms of visualization of quality of coronal sections (Figure 1c). However, when using a single B-mode ultrasound scanner with an ultrasound probe, it is necessary to rotate the probe around and move along the water-submerged breast, significantly prolonging and complicating the diagnostic scanning procedure [41,42]. It is also possible to use multiple B-mode probes together with separate probes and beamforming systems [43,44] or a specially designed multi-element ultrasonic ring array with an ultrasound tomography scanner system, which can switch the sectors of the reflection imaging array. The sectoral images are then automatically reconstructed using the CI method or the synthetic aperture focusing technique (SAFT) [41,45,46]. However, such methods are very complicated, and the devices that use them are specialized and very expensive medical diagnostic equipment.
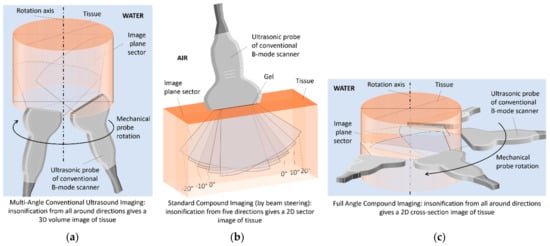
Figure 1.
Scanning methods for different ultrasound compound imaging (CI) configurations: (a) in MACUI, (b) in HHUS, (c) in FASCI.
The research presented in this paper is focused on the evaluation of the capabilities of different types of standard B-mode ultrasound probes used in MACUI to acquire breast sections. Each of these probes uses a different method of steering the ultrasound beam, which also involves different folding of the imaging lines using RF signals and different sizes of the imaging area, which in turn is important in the CI method. Studies in this context have not been presented in the literature before and are essential in terms of the universal applications and the wider use of this method in clinical practice. The probes that are used in the work are linear, convex, and phased array probes and are highly available standard probes used in HHUS imaging.
2. Materials and Methods
2.1. Imaging System
Multi-angle conventional ultrasound imaging is the method under evaluation within this work. MACUI uses conventional B-mode ultrasound imaging to acquire ultrasound scans that are used to reconstruct the 3D structure of breast tissue. In the method, the probe is rotated around the Z-axis of the imaging system with the probe placed radially. Breast sections are acquired in the full 360° range with a certain angle step selected to obtain the desired spatial resolution.
The use of B-mode ultrasound renders the method virtually probe-agnostic. There is no special need to create a specialized ultrasound transducer or to develop new preprocessing steps. All the advantages of handheld ultrasound examinations can be applied to obtain the best possible individual breast scans. In addition to the standard ultrasound frequency ranges used in HHUS, high- and even ultra-high-frequency ultrasound probes can be used. All pre-processing and even post-processing steps, such as beam steering, digital filtering, or noise reduction to improve image quality, may be applied depending on needs. Taking into account a high attenuation, high- and ultra-high-frequency ultrasound could be utilized, that is, for examination of skin and near-skin tissues [47,48], however, the authors have not evaluated this. In theory, any standard B-mode probe and ultrasound system enabling external software control can be used in the MACUI method if the probe holder in the scanning equipment is adjusted accordingly. However, the possibility of use is not equal to the usefulness. Many B-mode ultrasound probes have a different range of frequencies, shapes, focusing, and imaging area. In this work, the linear L15-7L40H-5, the convex array C6-2R50HI-5, and the phased P5-1L15SI-6 transducers are evaluated. These probes represent a range of different probes available for the Telemed SmartUS ultrasound imaging system, which is a typical and widely available PC-based ultrasound system for medical evaluation. The frequencies used by each probe were 7.5 MHz, and 6 MHz, 5 MHz, accordingly. Only one of the available frequencies of each probe was used during measurement, but the probes have a range of different frequencies available and, with dedicated EchoWave II imaging software, provide tissue harmonic imaging (THI). These options have not been covered in this work.
The MACUI method is intended to be used in the configuration, in which the patient lies on an examination bed that includes the water tank with the rotational mechanism below. In this configuration, the breast is submerged in water, and the ultrasound probe placed below can scan the breast at different angles, being attached to the rotational mechanism. To mimic such a system, the Universal Robots UR-3 e-Series cobot has been used to move the probe attached to the arm in the desired manner (Figure 2).
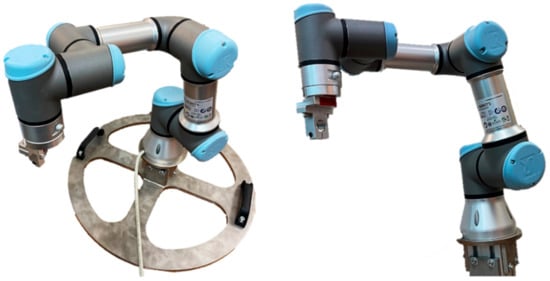
Figure 2.
Photo of the UR-3 e-series cobot by Universal Robots.
The UR3 compact cobot is a six-articulated precision industrial small robot with a built-in safety system. It is force sensitive and can be set to stop immediately when it encounters resistance of as little as 50 N. It weighs only 11 kg, but has a payload of 3 kg, ±360° rotation ability of 360° on all joints, and an unlimited rotation capability on the end joint. It operates in a range of up to 500 mm. The repeatability of the position of the arm tip is ±0.1 mm. Maximum speeds for the wrist joints are 360°/s and for the other joints 180°/s. The maximum tool speed is 1 m/s. Figure 3 shows the UR-3 robotic arm equipped with a specially developed holder for the ultrasonic probe of a conventional B-mode ultrasound scanner, which allows it to be automatically positioned and repositioned according to arbitrarily programmed 3D trajectories.
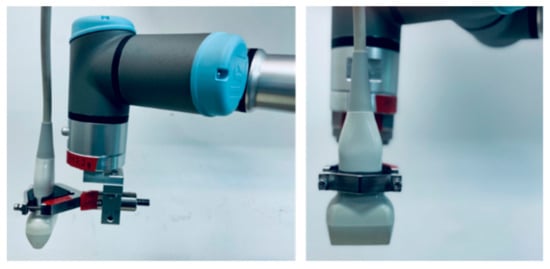
Figure 3.
The ultrasonic probe of a conventional B-mode ultrasound scanner attached to the robotic arm.
The Telemed SmartUS works with EchoWave II scanning software. The system can be automated using the windows WM_COPYDATA messages, while the UR-3 robot can communicate with the software in several different ways. In the test system, communication through the XML-RPC server has been used. XML-RPC is remote procedure call and allows calling the function implemented on the controller side and exchange data with the robot. Using these two methods of communication, the UR-3 Robot Program has been written, so the robot could communicate with the XML-RPC server and call proper functions that allowed it to initialize the system, collect data from the user, and acquire images. The use of this solution is convenient in terms of synchronization, as the robot waits until the function called via the server is finished. The XML-RPC server can be implemented in many modern programming languages. The Python program has been created to control and synchronize the Telemed EchoWave II Imaging software and the UR-3 robot using WM_COPYDATA and XML-RPC capabilities. Software communication is schematically shown in Figure 4.
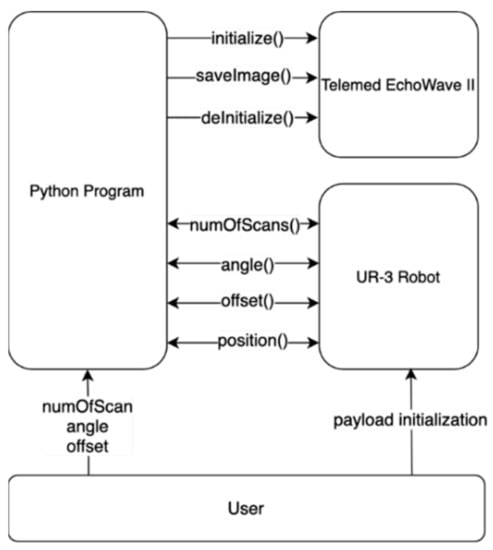
Figure 4.
UR-3 robot and EchoWave II control software communication scheme.
The program has been designed to allow for controlling the position of the probe with respect to the center of the system geometry, the angle of the probe relative to the Z-axis, and the number of images. The UR-3 Robot program has been written so the robot could communicate with the XML-RPC server to call proper functions on the server side (Python program). This allows us to initialize system with the number of scans to be acquired (numOfScans()), angle of which the probe is adjusted (angle()), and offset of the probe from the center (offset()). Data gathered from the user are received by the robot being returned by those functions. The image in a certain position is acquired by calling the position() function by the robot, which sends a message to the EchoWave II to save the current image to a file, and the function returns the next position of the robot. Robot payload initialization has to be performed manually by the user before measurement starts.
2.2. Breast Phantoms
To evaluate the imaging system using different ultrasound transducers, two medical breast phantoms were used (Figure 5).
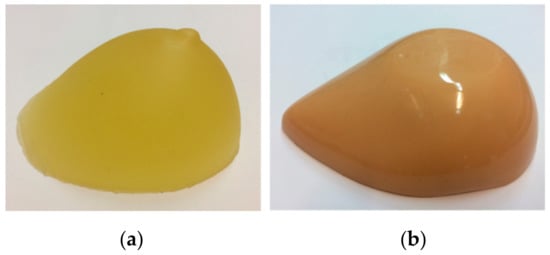
Figure 5.
Breast phantoms used in measurements: (a) ATS Laboratories Model BB-1, (b) CSDS Blue Phantom Breast Masses.
One is the ATS Laboratories Model BB-1, the breast biopsy phantom that mimics the appearance, touch, and acoustic properties of the human breast. It is mainly designed to train biopsy-assisted ultrasound imaging. The base material of the phantom is urethane rubber that mimics breast tissue. It has randomly embedded cyst and nodule inclusions, three with a size of 5 mm and five with a size of 10 mm, simulating ultrasound targets, such as cysts and compact tissue masses. The second is CSDS Blue Phantom Breast Masses designed to develop and practice the skills necessary to become proficient in the use of ultrasound-guided fine needle breast biopsy procedures. Blue Phantom contains a variety of hyperechoic, hypoechoic, and echolucent masses, allowing users to gain experience in handling a wide range of lesions as they would in a clinical setting. Each model contains 14 masses, ranging in size from 4 to 11 mm. Phantoms were placed in the water tank on the ultrasound absorbent material to minimize reflections from the bottom of the tank.
2.3. Imaging Geometry and Reconstruction
Previous preliminary studies have shown that placing the probe outside the center of the imaging system allows us to expand the imaging area and leaves space in the imaging device to install the holder responsible for keeping the breast in the same position during the examination procedure [36]. The widening of the imaging area is important in the context of smaller-size ultrasonic probes or those without the capabilities to create a sectoral image. However, moving the probe outside the vertical axis has limitations. Even if the sectoral view is used, the amount by which the probe can be moved depends on the width of the probe, the maximum angle of scanning, and the distance of the breast from the probe surface. If the situation occurs when the object is too close to the ultrasound probe surface and its part is not visible on the reconstructed image, the probe can be adjusted by an angle to cover this area. This situation is shown in Figure 6.
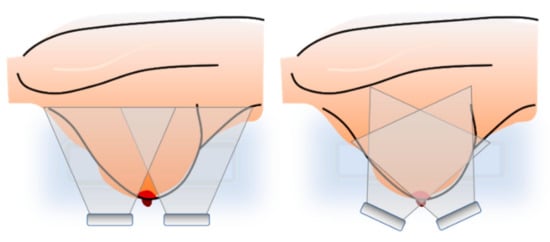
Figure 6.
Limitation of the probe offset and the probe adjustment to cover object area.
When taking into account the above facts, the placement of the probes has been taken arbitrarily, and the same for each probe, to present the results for different probes in the situation where the mounting point of the probe is fixed. The positions of the center of the probe and its angle have been set to the following pairs: (3 cm, 0°), (4 cm, 10°), (5 cm, 20°). Later in the text, these positions will be marked as (3, 0), (4, 10), and (5, 20) for simplicity. The number of scans on the circle has been set to 5°, resulting in 72 scans available for reconstruction. In the present study, due to the examination of submerged breast phantoms in a water tank using a robotic arm, and to simplify the scanning procedure, ultrasound probes were placed inversely, from the water surface.
Reconstruction of the 3D image using the MACUI method is a straightforward operation. As the probe is placed radially and rotates around the vertical axis, the polar coordinates of the individual scans can be simply converted to cartesian coordinates. However, a simple concatenation of the opposite images may exhibit artifacts in the center of the image, especially when the sectoral scan is used. In such a situation, the ultrasound beam reaches the structure through different acoustic paths and incidents with it at different angles. The case has been studied by the authors and different compounding methods have been evaluated to minimize unwanted effects [49]. The proposed weighted average method has been used in this work during reconstruction. Having the polar coordinates converted to cartesian, all values can be converted into the stack of images that can be subsequently reconstructed using software, such as 3D Slicer, or converted to DICOM format and evaluated by any software that supports DICOM, i.e., Onis Viewer. The 3D Slicer has been used to present the results. Figure 7 presents an example 3D view of the reconstructed structure from the data collected for this study.
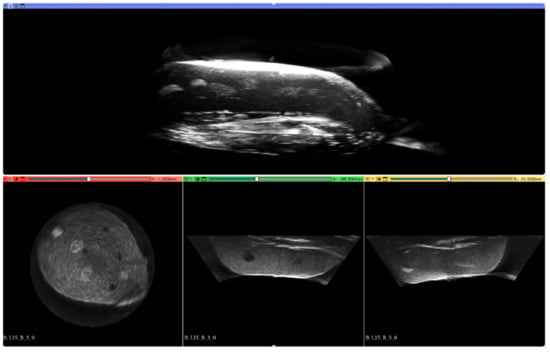
Figure 7.
Example 3D reconstruction of the imaged structure of Blue Phantom Breast Masses.
2.4. Objective Assessment
To perform the objective assessment of the reconstructed images obtained with different probes in each position, the regions of interest (ROI) were chosen on the reconstructed coronal plane representing the same inclusions of the structures. An example of the chosen planes with drawn ROIs obtained with the convex probe is shown in Figure 8. These ROI areas in the images obtained with three ultrasound probes for the examined breast phantoms that were selected for analysis in the paper. All ROIs are of the same size, 300 × 300 pixels.
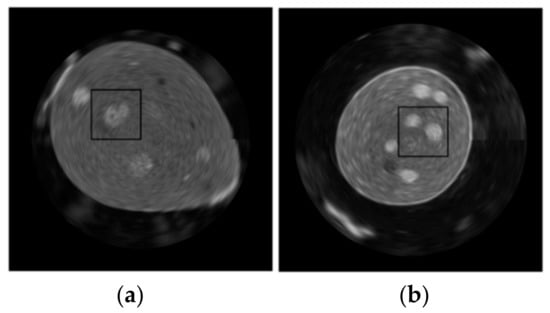
Figure 8.
Chosen region of interest for both examined breast phantoms: (a) Blue, (b) ATS BB-1.
The objective parameters of the images selected to support the evaluation of the images were the histogram, the mean value of pixels outside the structure, the standard deviation of the values within the inclusion inside the ROI, as well as the surrounding tissue mimicking structure, and the contrast-to-noise ratio (CNR).
The mean values outside the structure have been calculated for the appropriately masked images. This parameter helps to evaluate the amount of artifacts generated by the probe that arose as a result of reflection from the border of the structure. In addition to the number of artifacts outside the structure, this parameter can also suggest the possibility of forming unwanted artifacts inside the structure due to reflection on the tissue border parallel to the breast skin in the examination position. The mask example used, and the masked image are shown in Figure 9.
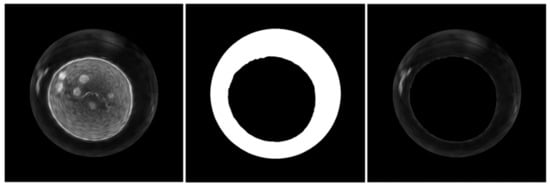
Figure 9.
Masking presentation for the calculation of the output value of the mean pixels. Images from left to right: original image, binary mask, masked image.
CNR values have been calculated according to the following equation:
where is the mean value of pixels within the inclusions area in ROI, while is the mean value of surrounding pixels and is the standard deviation of the inclusion pixels. Standard deviation and histograms were calculated using the standard functions available in the MATLAB software.
3. Results
3.1. Objective Assessment
Figure 10 shows the selected reconstructed planes obtained with the C6-2R50HI-5, L15-7L40H-5, and P5-1L15SI-6 ultrasound probes accordingly for three different fixed positions relative to both of the measured breast phantoms, Blue and BB-1.
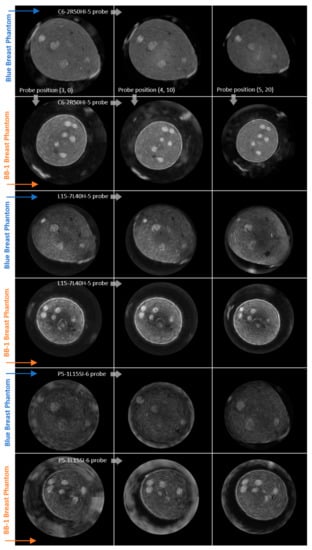
Figure 10.
Planes under evaluation acquired with 3 different types of probe (rows) in 3 different positions (columns) relative to 2 measured breast phantoms: Blue and BB-1, as indicated along the arrows.
In each subfigure of Figure 10, the planes of the left column were acquired at the probe position (3, 0), the middle (4, 10), and the right at position (5, 20). From each of the coronal sections presented of the reconstructed phantoms, the regions of interest were taken as presented in Figure 8. The planes are similar in terms of the viewer’s ability to distinguish the inclusion. Nevertheless, not all of the inclusions are visible at the same time, that is, the reconstructed plane of the Blue Phantom in position (5, 20) does not have visible all of the inclusions from another reconstruction in the first row of Figure 10. This is a result of a different geometry of the system. However, what is clearly visible is the amount of artifacts generated outside of the structure and the decrease at the higher angles of imaging. For the phased array (P5-1L15SI-6), the outer edge of the phantom has been covered with artifacts in some cases, while this effect could be minimized at a certain angle. The shape of inclusion in the reconstructed plane is also affected by different positions of the probe during measurement.
3.2. ROIs
The ROI images are shown in Figure 11. The arrangement of ROIs is exactly the same as for the reconstructed planes above.
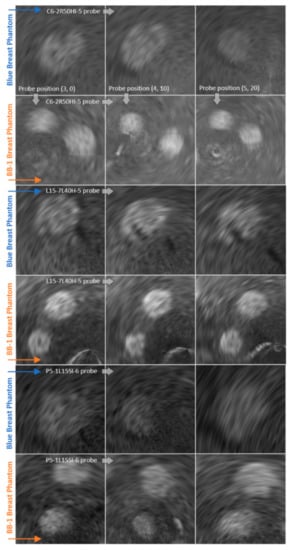
Figure 11.
ROIs under evaluation acquired with 3 different types of probe (rows) in 3 different positions (columns) relative to 2 measured breast phantoms: Blue and BB-1, as indicated along the arrows.
3.3. Histograms of ROIs
The calculated histograms seen in Figure 12 represent the intensity of the distribution of the pixels inside the ROIs under evaluation.
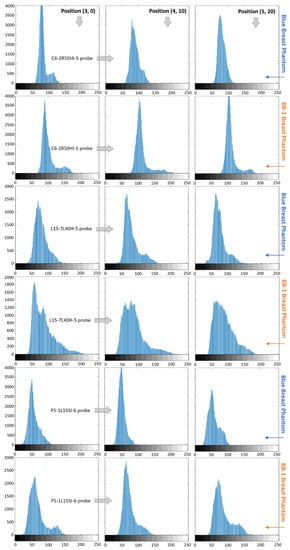
Figure 12.
Histogram of ROI of the planes obtained with 3 different types of probe (rows) in 3 different positions (columns) relative to 2 measured breast phantoms: Blue and BB-1, as indicated along the arrows.
The calculated ROI histograms allow visualizing and assessing the distribution of the intensity of pixels. As we can observe from the ROIs in Figure 11 and histograms presented in Figure 12, for the Blue Phantom and C6-2R50HI-5 probe, there is a visible differentiation between the background (lower intensity pixels) and the inclusions (higher intensity pixels) for probe positions (3, 0) and (4, 10). In the (5, 20) probe position, all of the pixels in the histogram are concentrated within a single wide peak. This corresponds to a lower subjective contrast and a blurrier inclusion in ROI corresponding to this position. However, the inclusion can still be relatively easily differentiated from background. Analyzing the same results for the ATS BB-1 phantom (Figure 11 and Figure 12), the differentiation between the different intensity pixels groups is possible at all three positions. However, in position (5, 20), the two peaks on the histograms are more clearly outlined than in the other positions.
On histograms corresponding to the imaging of the L15-7L40H-5 probe (Figure 12), we can also see a clear differentiation of the different intensity groups in position (4, 10) and (5, 20) for the Blue Phantom. The results are less obvious to analyze for the ATS BB-1 phantom. In each position, the low-intensity pixels are significantly wider, with a considerable amount of pixels with intensities between 150 and 200 in value.
The P5-1L15SI-6 probe histograms (Figure 12) present a significant amount of higher density pixel only at position (5, 20). In positions (3, 0) and (4, 10), the pixels are concentrated within a single peak for the Blue Phantom. This corresponds to a very low subjective contrast inside those ROIs. The different groups of pixels intensity are better defined in histograms corresponding to the ATS BB-1 phantom.
3.4. Contrast to the Noise Ratio
Table 1 shows the values of the contrast-to-noise ratio calculated for all of the ROIs. C1, L1, and P1 correspond to the Blue Phantom acquired with convex, linear, and phased array accordingly. The C2, L2, and P2 values are the ROI CNR values for the ATS BB-1 phantom. The same marking of the parameters is used in Table 2.

Table 1.
CNR values.

Table 2.
Mean value of pixels outside the structure.
The highest values are usually in positions other than (3, 0) for each probe and both phantoms, as can be seen in Table 1. These are not of a great difference between the different probes for each phantom, taking into account the best positions.
3.5. Mean Value of Pixels Outside Structure
The mean value of the pixels outside of the structure is gathered in Table 2.
According to the table, most of the lowest values for specific probe-phantom combinations (see table columns) are not for the (3, 0) positions. The exception is the L2 values; nevertheless, the difference between the other positions is not as great as it is in most of the other combinations. The convex probe is characterized by the lowest amount of artifact outside of the structure (see Figure 10 and Figure 11). It is the only probe that does not include the software beam steering to control the imaging area.
3.6. Standard Deviation
Table 3 and Table 4 contain the standard deviation values of the pixels calculated for the inclusions and the surrounding structures inside the ROIs.

Table 3.
Standard deviation of the pixels of inclusions.

Table 4.
Standard deviation of the pixels of the inclusion backgrounds.
The standard deviations of the backgrounds’ pixels are closer to each other within the different probe-phantom pairs than the inclusion values. In Table 3 we can observe that the lowest values are in all of the columns outside the position (3, 0), except L1. The values between the probes are ordered in the same way for the inclusion and background standard deviation (in sequences C, P, and L), if we choose the smallest value from each column. This is probably correlated with the specific probe used.
4. Discussion
The use of an advanced robot in this study to move various ultrasonic probes in a versatile manner in any geometry enables good 3D imaging results. All of the probes used for the purpose of this work allowed us to obtain the reconstructed structure with visible inclusions placed inside the phantom. Subjective contrast and edge blur are connected with the ability to recognize a different group of pixels’ intensity on the histogram. When two different groups can be simply distinguished in a histogram, the different structures are recognizable in the reconstructed image. However, even with a wide enough distribution of the intensity to hide another structure in a histogram, it can still be recognized in the ROI.
Considering the calculated CNR, the mean value of pixels outside of the structure, and the standard deviation in terms of the position of probes, it can be seen that the best values are usually not in the position of the probe moved 3 cm from the center and being placed perpendicular to the tank bottom. It is especially visible for the mean value of the pixels outside of the structure, where the reflection from the breast phantom surface may cause significant artifacts, which can be even more pronounced in a water tank with the surface being close enough to generate secondary reflection. Furthermore, this artifact may also be present inside of the breast tissue at the border parallel to the skin surface at the examination position. This suggests the need for an angled probe mounting with respect to the vertical axis of the system.
In terms of the probe used, the convex array probe does not use any software beam steering. The linear array uses beam steering to expand the area of the image. The phased array is a small probe that utilizes complicated beamforming algorithms to create the desired imaging area. The phased array probe performed better in terms of standard deviation analysis and gave slightly better CNR results than the linear array. Nevertheless, it performs significantly worse in terms of artifacts arising from reflection. The convex array generally outperforms the other probes used in the study. Additionally, it enables a wide visualization angle, a large CI area, and a long range. The inclination of the active surface of the probe relative to the horizontal plane is also important.
In principle, there are no additional limitations beyond those that exist for conventional ultrasound B-mode scanners and other 3D ultrasound imaging systems built on HHUS (see Introduction). However, it should be noted that the resolution of 3D images obtained with the MACUI method additionally depends on the number of scanning angles during the rotation of the ultrasound probe. If we assume that the 3D scan of the entire breast volume is performed in time, for example 60 s, and the number of acquired HHUS image frames is 10 fps (e.g., due to additional methods and scanner options incorporated in order to improve the imaging quality), it can be calculated that the maximum angular resolution of MACUI may then be 0.6 degrees per frame of the image. At an imaging rate of 30 fps, this would, in turn, be 0.2 degrees per frame, allowing for a high spatial resolution. For comparison, a 5° angular step of ultrasound probe rotation was used to obtain the phantom images using the MACUI method in this paper.
5. Conclusions
The presented results prove that the different types of ultrasound probe that are widely available for standard handheld ultrasound evaluation can be successfully used as the imaging device in the multi-angle conventional ultrasound imaging method. However, limitations and possible artifacts that are different for the different probes depending on their shape, size, and beam-creation method must be taken into account during the design of the MACUI equipment. The geometry of the system, including the offset and angle of the probe, should be adjusted to the specific probe in order to fully exploit the imaging systems.
Especially interesting is the fact that a relatively simple convex probe gives better 3D imaging results compared to the more advanced probes with beam-steering capabilities. So far, we have not encountered anywhere in the literature the use of a convex probe in the MACUI method. As the MACUI method aims to be a relatively non-expensive method of the 3D ultrasound breast imaging modality, the design of the device must take into account the modular approach that enables the adjustability of the system without cost-generating customization. This approach is possible with the use of a water tank that allows the breast to be scanned from below with universally attached conventional B-mode ultrasound probes. In order to adjust the size of the scanning area to the breast and position the ultrasound probe under the bottom of the tank as close to the nipple as possible, a sliding tank bottom can be constructed. This allows the examination of both very small (short when vertically immersed in water) and large (long) breasts. Additionally, to minimize the unwanted effects of ultrasound reflection inside the water tank, the internal surface should be designed with a proper ultrasound absorption policy.
The biggest advantage of using the MACUI method is the possibility of applying any conventional B-mode ultrasound probe for 3D breast imaging, depending on the needs and capabilities. Moreover, it is possible to use any existing B-mode ultrasound scanner and all of the additional imaging capabilities that it offers (e.g., conventional CI, THI, ultrasound-coded transmission, SAFT, and others). We can also choose any of the available ultrasound frequencies. However, it should be noted that high frequencies increase imaging resolution but limit range due to increased ultrasound attenuation with frequency. In order to improve the quality of the MACUI images, we can also use image processing methods, i.e., a fuzzy preprocessor based on geometric formulations that can be easily implemented, even on hardware for any real-time applications [50].
It is important, from a cost-wise point of view, that less advanced equipment may serve breast diagnostics very effectively.
Author Contributions
Conceptualization, M.S. and K.J.O.; investigation, M.S. and K.J.O.; methodology, M.S. and K.J.O.; software, M.S.; validation, M.S. and K.J.O.; resources, M.S. and K.J.O.; data curation, M.S.; writing—original draft preparation, M.S.; writing—review and editing, K.J.O.; visualization, M.S. and K.J.O.; supervision, K.J.O. All authors have read and agreed to the published version of the manuscript.
Funding
This research received no external funding.
Institutional Review Board Statement
Not applicable.
Informed Consent Statement
Not applicable.
Data Availability Statement
Data is available upon request to the authors.
Conflicts of Interest
The authors declare no conflict of interest.
Abbreviations
The following abbreviations are used in this manuscript:
| ABUS | Automated Breast Ultrasound |
| ABVS | Automated Breast Volume Scanning |
| CAD | Computer-Aided Detection |
| CNR | Contrast-to-Noise Ratio |
| DALYS | Disability-adjusted life years |
| DICOM | Digital Imaging and Communications in Medicine |
| FASCI | Full Angle Spatial Compound Imaging |
| FDA | Food and Drug Administration |
| HHUS | Handheld Ultrasound |
| MACUI | Multi-Angle Conventional Ultrasound (Compound) Imaging |
| MMG | Mammography |
| MRI | Magnetic Resonance Imaging |
| ROI | Region of Interest |
| SAFT | Synthetic Aperture Focusing Technique |
| SAUS | Supine Automated Ultrasound |
| THI | Tissue Harmonic Imaging |
| USI | Ultrasound Imaging |
References
- World Health Organization, Breast Cancer. Available online: https://www.who.int/news-room/fact-sheets/detail/breast-cancer (accessed on 24 August 2021).
- Brem, R.F.; Lenihan, M.J.; Lieberman, J.; Torrente, J. Screening Breast Ultrasound: Past, Present, and Future. AJR 2015, 204, 234–240. [Google Scholar] [CrossRef] [PubMed]
- Boyd, N.F.; Guo, H.; Martin, L.J.; Sun, L.; Stone, J.; Fishell, E.; Jong, R.A.; Hislop, G.; Chiarelli, A.; Minkin, S.; et al. Mammographic density and the risk and detection of breast cancer. N. Engl. J. Med. 2007, 356, 227–236. [Google Scholar] [CrossRef] [PubMed]
- Gøtzsche, P.C. Mammography screening is harmful and should be abandoned. J. R. Soc. Med. 2015, 108, 341–345. [Google Scholar] [CrossRef] [PubMed]
- Biller-Andorno, N.; Jüni, P. Abolishing Mammography Screening Programs? A View from the Swiss Medical Board. N. Engl. J. Med. 2014, 370, 1965–1967. [Google Scholar] [CrossRef]
- Thigpen, D.; Kappler, A.; Brem, R. The Role of Ultrasound in Screening Dense Breasts-A Review of the Literature and Practical Solutions for Implementation. Diagnostics 2018, 8, 20. [Google Scholar] [CrossRef]
- Warren, R.M.; Pointon, L.; Thompson, D.; Hoff, R.; Gilbert, F.J.; Padhani, A.; Easton, D.; Lakhani, S.R.; Leach, M.O. Reading protocol for dynamic contrast-enhanced MR images of the breast: Sensitivity and specificity analysis. Radiology 2005, 236, 779–788. [Google Scholar] [CrossRef][Green Version]
- Jaglan, P.; Dass, R.; Duhan, M. Breast Cancer Detection Techniques: Issues and Challenges. J. Inst. Eng. B 2019, 100, 379–386. [Google Scholar] [CrossRef]
- Mundinger, A. 3D Supine Automated Ultrasound (SAUS, ABUS, ABVS) for Supplemental Screening Women with Dense Breasts. J. Breast Health 2016, 12, 52–55. [Google Scholar] [CrossRef]
- Brem, R.F.; Tabár, L.; Duffy, S.W.; Inciardi, M.F.; Guingrich, J.A.; Hashimoto, B.E.; Lander, M.R.; Lapidus, R.L.; Peterson, M.K.; Rapelyea, J.A.; et al. Assessing improvement in detection of breast cancer with threedimensional automated breast US in women with dense breast tissue: The SomoInsight study. Radiology 2015, 274, 663–673. [Google Scholar] [CrossRef]
- Farrokh, A.; Erdönmez, H.; Schäfer, F.; Maass, N. SOFIA: A novel automated breast ultrasound system used on patients in the prone position: A pilot study on lesion detection in comparison to handheld gray scale ultrasound. Geburtshilfe Frauenheilkd 2018, 78, 499–505. [Google Scholar] [CrossRef]
- O’Flynn, E.A.M.; Fromageau, J.; Ledger, A.E.; Messa, A.; D’Aquino, A.; Schoemaker, M.J.; Schmidt, M.; Duric, N.; Swerdlow, A.J.; Bamber, J.C. Ultrasound tomography evaluation of breast density: A comparison with noncontrast magnetic resonance imaging. Investig. Radiol. 2017, 52, 343–348. [Google Scholar] [CrossRef]
- Karst, I.; Henley, C.; Gottschalk, N.; Floyd, S.; Mendelson, E.B. Three-dimensional Automated Breast US: Facts and Artifacts. RadioGraphics 2019, 39, 913–931. [Google Scholar] [CrossRef] [PubMed]
- Vourtsis, A. Three-dimensional automated breast ultrasound: Technical aspects and first results. Diagn. Interv. Imaging 2019, 100, 579–592. [Google Scholar] [CrossRef] [PubMed]
- Nicosia, L.; Ferrari, F.; Bozzini, A.C.; Latronico, A.; Trentin, C.; Meneghetti, L.; Pesapane, F.; Pizzamiglio, M.; Balesetreri, N.; Cassano, E. Automatic breast ultrasound: State of the art and future perspectives. Ecancer 2020, 14, 1062. [Google Scholar] [CrossRef]
- Allajbeu, I.; Hickman, S.E.; Payne, N.; Moyle, P.; Taylor, K.; Sharma, N.; Gilbert, F.J. Automated Breast Ultrasound: Technical Aspects, Impact on Breast Screening, and Future Perspectives. Curr. Breast Cancer Rep. 2021, 13, 141–150. [Google Scholar] [CrossRef]
- Wang, H.Y.; Jiang, Y.X.; Zhou, Q.L.; Zhang, J.; Dai, Q.; Liu, H.; Lai, X.-J.; Sun, Q. Differentiation of benign and malignant breast lesions: A comparison between automatically generated breast volume scans and handheld ultrasound examinations. Eur. J. Radiol. 2012, 81, 3190–3200. [Google Scholar] [CrossRef] [PubMed]
- Wang, Z.L.; Xw, J.H.; and Li, J.L.; Huang, Y.; Tang, J. Comparison of automated breast volume scanning to hand-held ultrasound and mammography. Radiol. Med. 2012, 15, 9101–9105. [Google Scholar] [CrossRef]
- Lin, X.; Wang, J.; Han, F.; Fu, J.; Li, A. Analysis of eighty-one cases with breast lesions using automated breast volume scanner and comparison with handheld ultrasound. Eur. J. Radiol. 2012, 81, 873–878. [Google Scholar] [CrossRef]
- Kim, S.H.; Kang, B.J.; Choi, B.G.; Choi, J.J.; Lee, J.H.; Song, B.J.; Choe, B.J.; Park, S.; Kim, H. Radiologists’ performance for detecting lesions and the interobserver variability of automated whole breast ultrasound. Korean J. Radiol. 2013, 14, 154–163. [Google Scholar] [CrossRef]
- Girometti, R.; Zanotel, M.; Londero, V.; Linda, A.; Lorenzon, M.; Zuiani, C. Automated breast volume scanner (ABVS) in assessing breast cancer size: A comparison with conventional ultrasound and magnetic resonance imaging. Eur. Radiol. 2018, 28, 1000–1008. [Google Scholar] [CrossRef]
- Wojcinski, S.; Farrokh, A.; Hille, U.; Wiskirchen, J.; Gyapong, S.; Soliman, A.A.; Degenhardt, F.; Hillemanns, P. The Automated Breast Volume Scanner (ABVS): Initial experiences in lesion detection compared with conventional handheld B-mode ultrasound: A pilot study of 50 cases. Int. J. Womens Health 2011, 3, 337–346. [Google Scholar] [CrossRef] [PubMed]
- McHugh, M.L. Interrater reliability: The kappa statistic. Biochem. Med. 2012, 22, 276–282. [Google Scholar] [CrossRef]
- Li, N.; Jiang, Y.X.; Zhu, Q.L.; Zhang, J.; Dai, Q.; Liu, H.; Yang, Q.; Wang, H.-Y.; Lai, X.-J.; Sun, Q. Accuracy of an automated breast volume ultrasound system for assessment of the pre-operative extent of pure ductal carcinoma in situ: Comparison with a conventional handheld ultrasound examination. Ultrasound Med. Biol. 2013, 39, 2255–2263. [Google Scholar] [CrossRef]
- Huang, A.; Zhu, L.; Tan, Y.; Liu, J.; Xiang, J.; Zhu, Q.; Bao, L. Evaluation of automated breast volume scanner for breast conservation surgery in ductal carcinoma in situ. Oncol. Lett. 2016, 12, 2481–2484. [Google Scholar] [CrossRef] [PubMed][Green Version]
- Xu, C.; Wei, S.; Xie, Y.; Guan, X.; Yang, B. Three-dimensional assessment of automated breast volume scanner compared with handheld ultrasound in pre-operative breast invasive ductal carcinomas: A pilot study of 51 cases. Ultrasound Med. Biol. 2016, 42, 2089–2096. [Google Scholar] [CrossRef]
- Wojcinski, S.; Gyapong, S.; Farrokh, A.; Soergel, P.; Hillemanns, P.; Degenhardt, F. Diagnostic performance and inter-observer concordance in lesion detection with the automated breast volume scanner (ABVS). BMC Med. Imaging 2013, 13, 36. [Google Scholar] [CrossRef]
- Zheng, F.Y.; Yan, L.X.; Huang, B.J.; Xia, H.S.; Wang, X.; Lu, Q.; Li, C.X.; Wang, W.P. Comparison of retraction phenomenon and BI-RADS-US descriptors in differentiating benign and malignant breast masses using an automated breast volume scanner. Eur. J. Radiol. 2015, 84, 2123–2129. [Google Scholar] [CrossRef]
- Shin, H.J.; Kim, H.H.; Cha, J.H. Current status of automated breast ultrasonography. Ultrasonography 2015, 34, 165–172. [Google Scholar] [CrossRef]
- Golatta, M.; Baggs, C.; Schweitzer-Martin, M.; Domschke, C.; Schott, S.; Harcos, A.; Scharf, A.; Junkermann, H.; Rauch, G.; Rom, J.; et al. Evaluation of an automated breast 3D-ultrasound system by comparing it with handheld ultrasound (HHUS) and mammography. Arch. Gynecol. Obstet 2015, 291, 889–895. [Google Scholar] [CrossRef]
- Kim, Y.W.; Kim, S.K.; Youn, H.J.; Choi, E.J.; Jung, S.H. The clinical utility of automated breast volume scanner: A pilot study of 139 cases. J. Breast Cancer 2013, 16, 329–334. [Google Scholar] [CrossRef] [PubMed]
- Tan, T.; Mordang, J.J.; van Zelst, J.; Grivegnée, A.; Gubern-Mérida, A.; Melendez, J.; Mann, R.M.; Zhang, W.; Platel, B.; Karssemeijer, N. Computer-aided detection of breast cancers using Haar-like features in automated 3D breast ultrasound. Med. Phys. 2015, 42, 1498–1504. [Google Scholar] [CrossRef] [PubMed]
- Zheng, F.Y.; Lu, Q.; Huang, B.J.; Xia, H.-S.; Yan, L.-X.; Wang, X.; Yuan, W.; Wang, W.-P. Imaging features of automated breast volume scanner: Correlation with molecular subtypes of breast cancer. Eur. J. Radiol. 2017, 8, 267–275. [Google Scholar] [CrossRef] [PubMed]
- Boca, B.I.; Ciurea, A.I.; Ciortea, C.A.; Dudea, S.M. Pros and Cons for Automated Breast Ultrasound (ABUS): A Narrative Review. J. Pers. Med. 2021, 11, 703. [Google Scholar] [CrossRef] [PubMed]
- Kaplan, S.S. Automated whole breast ultrasound. Radiol. Clin. N. Am. 2014, 52, 539–546. [Google Scholar] [CrossRef] [PubMed]
- Sabiniok, M.; Opieliński, K.J.; Lis, S. Analysis of using multi-angle ultrasound scanning for efficient 3D object imaging. Arch. Acoust. 2019, 44, 396. [Google Scholar] [CrossRef]
- Luccas, V.A.S.; Azimbagirad, M.; Cabrelli, L.C.; Grillo, F.W.; Pavan, T.Z.; Murta, L.O.; Elias, J.; Carneiro, A.A.O. 3D automated breast ultrasound imaging: Equipment and image reconstruction. Res. Biomed. Eng. 2021, 37, 519–533. [Google Scholar] [CrossRef]
- Forte, S.; Dellas, S.; Stieltjes, B.; Bongartz, B. Multimodal ultrasound tomography for breast imaging: A prospective study of clinical feasibility. Eur. Radiol. Exp. 2017, 1, 27. [Google Scholar] [CrossRef]
- Wilhjelm, J.E.; Jensen, M.S.; Jespersen, S.K.; Sahl, B.; Falk, E. Visual and Quantitative Evaluation of Selected Image Combination Schemes in Ultrasound Spatial Compound Scanning. IEEE Trans. Med. Imaging 2004, 23, 181–190. [Google Scholar] [CrossRef]
- Entrekin, R.; Jackson, P.; Jago, J.R.; Porter, B.A. Real Time Spatial Compound Imaging in breast ultrasound: Technology and early clinical experience. Medica-Mundi 1999, 43, 35–43. [Google Scholar] [CrossRef][Green Version]
- Opieliński, K. Full angle ultrasound spatial compound imaging. In Proceedings of the Forum Acusticum, Krakow, Poland, 7–12 September 2014. [Google Scholar]
- Camacho, J.; Medina, L.; Cruza, J.F.; Moreno, J.M.; Fritsch, C. Multimodal Ultrasonic Imaging for Breast Cancer Detection. Arch. Acoust. 2012, 37, 253–260. [Google Scholar] [CrossRef]
- Medina, L.; Camacho, J.; Fritsch, C. A Characterization of Ultrasonic Full Angle Spatial Compounding as a Possible Alternative for Breast Cancer Screening. Arch. Acoust. 2015, 40, 301–310. [Google Scholar] [CrossRef]
- Malik, B.; Terry, R.; Wiskin, J.; Lenox, M. Quantitative transmission ultrasound tomography: Imaging and performance characteristics. Med. Phys. 2018, 45, 3063–3075. [Google Scholar] [CrossRef] [PubMed]
- Duric, N.; Littrup, P. Breast Ultrasound Tomography. In Breast Imaging; Kuzmiak, C.M., Ed.; IntechOpen: Rijeka, Croatia, 2018. [Google Scholar] [CrossRef]
- Opieliński, K.J.; Pruchnicki, P.; Szymanowski, P.; Szepieniec, W.K.; Szweda, H.; Świś, E.; Jóźwik, M.; Tenderenda, M.; Bułkowski, M. Multimodal ultrasound computer-assisted tomography: An approach to the recognition of breast lesions. Comput. Med. Imaging Graph. 2018, 65, 102–114. [Google Scholar] [CrossRef]
- Izzetti, R.; Vitali, S.; Aringhieri, G.; Nisi, M.; Oranges, T.; Dini, V.; Ferro, F.; Baldini, C.; Romanelli, M.; Caramella, D.; et al. Ultra-High Frequency Ultrasound, A Promising Diagnostic Technique: Review of the Literature and Single-Center Experience. Can. Assoc. Radiol. J. 2020, 72, 418–431. [Google Scholar] [CrossRef] [PubMed]
- Izzetti, R.; Oranges, T.; Janowska, A.; Gabriele, M.; Graziani, F.; Romanelli, M. The Application of Ultra-High-Frequency Ultrasound in Dermatology and Wound Management. Int. J. Low Extrem. Wounds 2020, 19, 334–340. [Google Scholar] [CrossRef] [PubMed]
- Sabiniok, M.; Opieliński, K. Comparison of the Image Compounding Methods for the Multi-Angle 3-D Ultrasound Imaging. Vib. Phys. Syst. 2019, 30, 1–8. [Google Scholar]
- Versaci, M.; Calcagno, S.; Morabito, F.C. Image Contrast Enhancement by Distances Among Points in Fuzzy Hyper-Cubes. In Proceedings of the CAIP 2015 Proceedings, Part II, the 16th International Conference on Computer Analysis of Images and Patterns, Valletta, Malta, 2–4 September 2015; pp. 494–505. [Google Scholar] [CrossRef]
Publisher’s Note: MDPI stays neutral with regard to jurisdictional claims in published maps and institutional affiliations. |
© 2022 by the authors. Licensee MDPI, Basel, Switzerland. This article is an open access article distributed under the terms and conditions of the Creative Commons Attribution (CC BY) license (https://creativecommons.org/licenses/by/4.0/).