1. Introduction
The effects of explosions were studied more extensively after World War II, mainly because many explosives were developed during this period and are still in use today. For many explosives, demands are made for high stability, safety and effectiveness. Most aromatic nitrolates and a much smaller number of nitric acid esters and nitroamines meet these criteria. The most commonly used explosive is the well-known Trinitrotoluene (tritol or TNT).
To estimate or calculate the response of an object or structure to the effects of an explosion, it is necessary to know the explosion parameters. Of these parameters needed to determine the response, the most important are usually the peak overpressure, the positive phase duration and the positive phase impulse. The positive phase impulse can usually be calculated from the blast curve and is dependent on the overpressure and positive duration. Knowledge of the blast parameters then defines the basic load of buildings or structures. A variety of methods can be used to determine explosion parameters. These can be based on empirical (or analytical), semi-empirical or numerical methods. Empirical methods are essentially correlations with experimental data. Most of these approaches are limited by the range of experiments carried out. The accuracy of all empirical correlations decreases with distance to the source of the explosion. Semi-empirical methods are based on simplified models of physical phenomena. They try to use the essential physical processes in a simplified way. These methods rely on extensive experimental data. Their predictive accuracy is generally better than that of empirical methods.
Numerical methods are based on mathematical equations that describe the basic laws of the phenomena being solved. These methods consider the conservation of mass, momentum and energy, or the physical behaviour of materials by means of constitutive relations. It is the empirical methods in the initial assessment of objects in the context of prevention or severe consequence assessment that can be a very useful tool. When rapid estimates of explosion parameters are needed, often for a large number of objects, these methods are essential. For a more in-depth analysis of the load of a building or to refine the initial load values of a structure, numerical methods are much more suitable.
During the second half of the 20th century, a considerable number of experimental and theoretical studies were conducted to understand the effects of blast on buildings and structures [
1,
2,
3,
4,
5]. The aim was first to study the behaviour of air blast waves including the determination of their characteristics and then to investigate the dominant factors influencing the incident waves. Another objective was to investigate the response of the building structure to blast load [
6,
7], based on the analysis of several experimental data, which presented the formulae to compute peak positive overpressure, positive phase duration and positive phase impulse [
2,
4], and utilised both experimental and theoretical means to obtain the parameters of the blast wave such as overpressure, positive phase duration, blast wave arrival time and positive phase impulse [
1]. In 1984, Kingery and Bulmash presented the parameters for air burst in terms of high order polynomials [
4,
8] and presented the same results as were produced by Kingery, in terms of simplified polynomials functions.
The use of empirical laws has been extensively studied and has been applied in various recommendations, mostly proposed by military authorities. In particular, the two most commonly used empirical models are based upon different but related studies of the U.S. Army Corps of Engineers (USACE): the document [
9], containing the model CONWEP, and the Technical Manual TM5-1300 [
10], completed by successive documents [
11]. In 2013, the Joint Research Centre of the European Union produced a Technical Report [
12], substantially referring to these two last documents and to another Technical Report of the U.S. Army [
4]. In [
12], all the empirical laws of [
10] are reproduced using the International System of Units. Most available publications concerning the effects of an explosion on a civil structure regard reinforced concrete structures, and usually the geometries considered are really simple, normally a squared building [
13,
14,
15,
16,
17,
18], or in some cases bridges, e.g., [
19]. Analyses of complex and structurally advanced objects are not published to any great extent. These analyses require the use of sophisticated computational software, usually based on CFD or FEM methods. These methods require a high level of computational expertise and are also very time consuming, both in terms of model building and computational time.
2. Materials and Methods
2.1. Ideal Blast Wave Characteristics
An explosion is a physical phenomenon in which there is a sudden, very rapid release of energy. The phenomenon lasts only some milliseconds, and it results in the production of very high temperatures and pressures. During detonation the hot gases that are produced expand in order to occupy the available space, leading to wave-type propagation through space that is transmitted spherically through an unbounded surrounding medium. Along with the produced gases, the air around the blast (for air blasts) also expands and its molecules pile-up, resulting in what is known as a blast wave and shock front. The blast wave contains a large part of the energy that was released during detonation and moves faster than the speed of sound [
20].
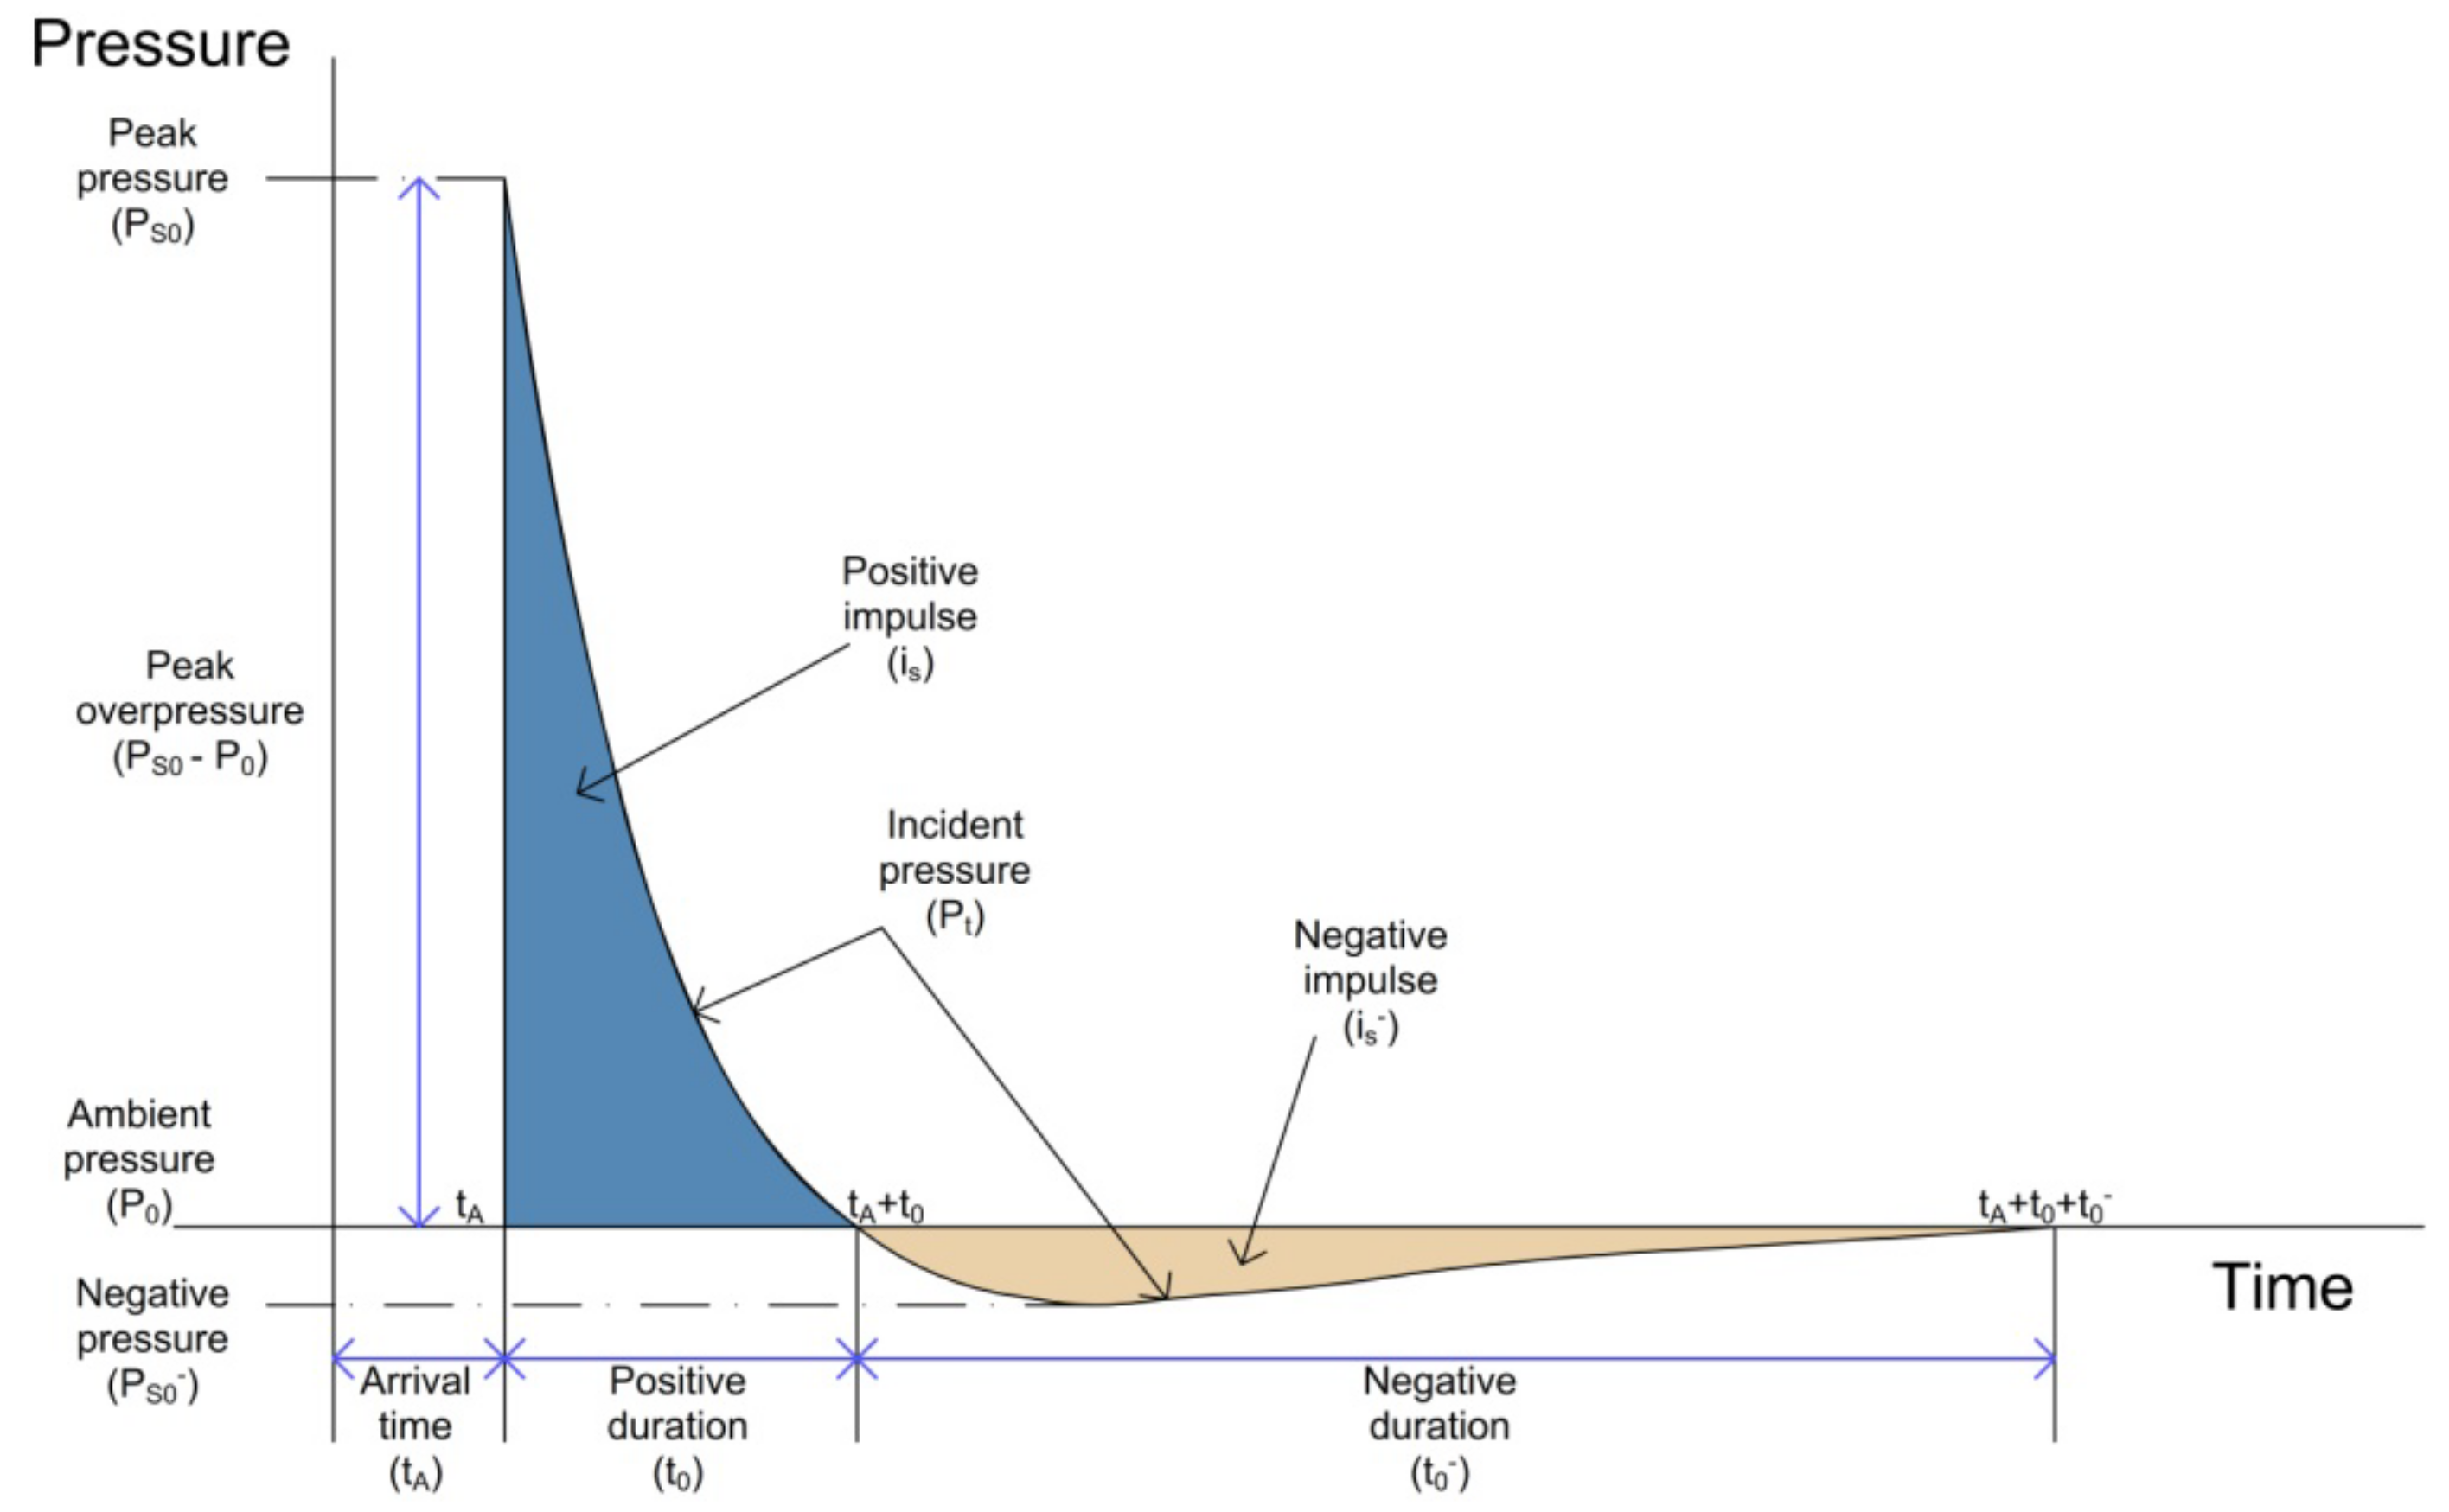
Figure 1 illustrates the idealised profile of the pressure in relation to time for the case of a free air blast wave, which reaches a point at a certain distance from the detonation. The pressure surrounding the element is initially equal to the ambient pressure
P0, and it undergoes an instantaneous increase to a peak pressure
PS0 at the arrival time
tA, when the shock front reaches that point. The time needed for the pressure to reach its peak value is very small and for design purposes it is assumed to be equal to zero. The peak pressure
PS0 is also known as side-on overpressure. The peak overpressure
PS0 −
P0 is marked as
Pti in the following sections. The value of the peak overpressure as well as the velocity of propagation of the shock wave decrease with increasing distance from the detonation centre. After its peak value, the pressure decreases with an exponential rate until it reaches the ambient pressure at
tA +
t0, where
t0 is called the positive phase duration. After the positive phase of the pressure–time diagram, the pressure becomes smaller (referred to as negative) than the ambient value, and finally returns to it. The negative phase is longer than the positive one, its minimum pressure value is denoted as
PS0− and its duration as
t0−. During this phase the structures are subjected to suction forces, which is the reason why sometimes during blast loading glass fragments from failures of facades are found outside a building instead of in its interior. This specific type of failure is usually due to a primary failure of the glass filling by the positive phase, or a situation may occur where the negative phase has a significantly higher negative impulse value
is− [
21].
2.2. Positive Phase/Shock Wave
The positive (expanding) phase of a shock wave is created when the very hot expanding gases produced by the detonation compress the surrounding air. These compressed layers of air are sometimes visible as white, rapidly expanding rings called a shock front. The width of the shock front is only very small and represents that part of the atmosphere which is compressed just before it sets itself in motion and thus becomes part of the positive or expanding phase of a shock wave. If a strong shock front hits a solid obstacle, it is reflected or passes through (when the obstacle is destroyed), but its energy is reduced [
22].
2.3. Experiments
A set of 20 tests was made in the experiments carried out, with five measurements (repeated trials) for each charge. During the measurements, the propagation of the shock wave was recorded, and the individual explosive parameters were evaluated based on the observed propagations. These were mainly peak overpressure and positive phase duration. Charges of 100, 200, 300 and 400 g were used in the experiments. The charges were placed at a height of 1.25 m above the ground surface (terrain). With respect to the air shock wave, this is a hemispherical blast, which occurs when the charge is placed on or near the ground surface.
To prevent the shock wave from being affected (e.g., by obstacles), the charge was suspended. The ignition coil was attached to the charge along the suspension (from above). The atmospheric conditions during the experiments carried out are shown in
Table 1.
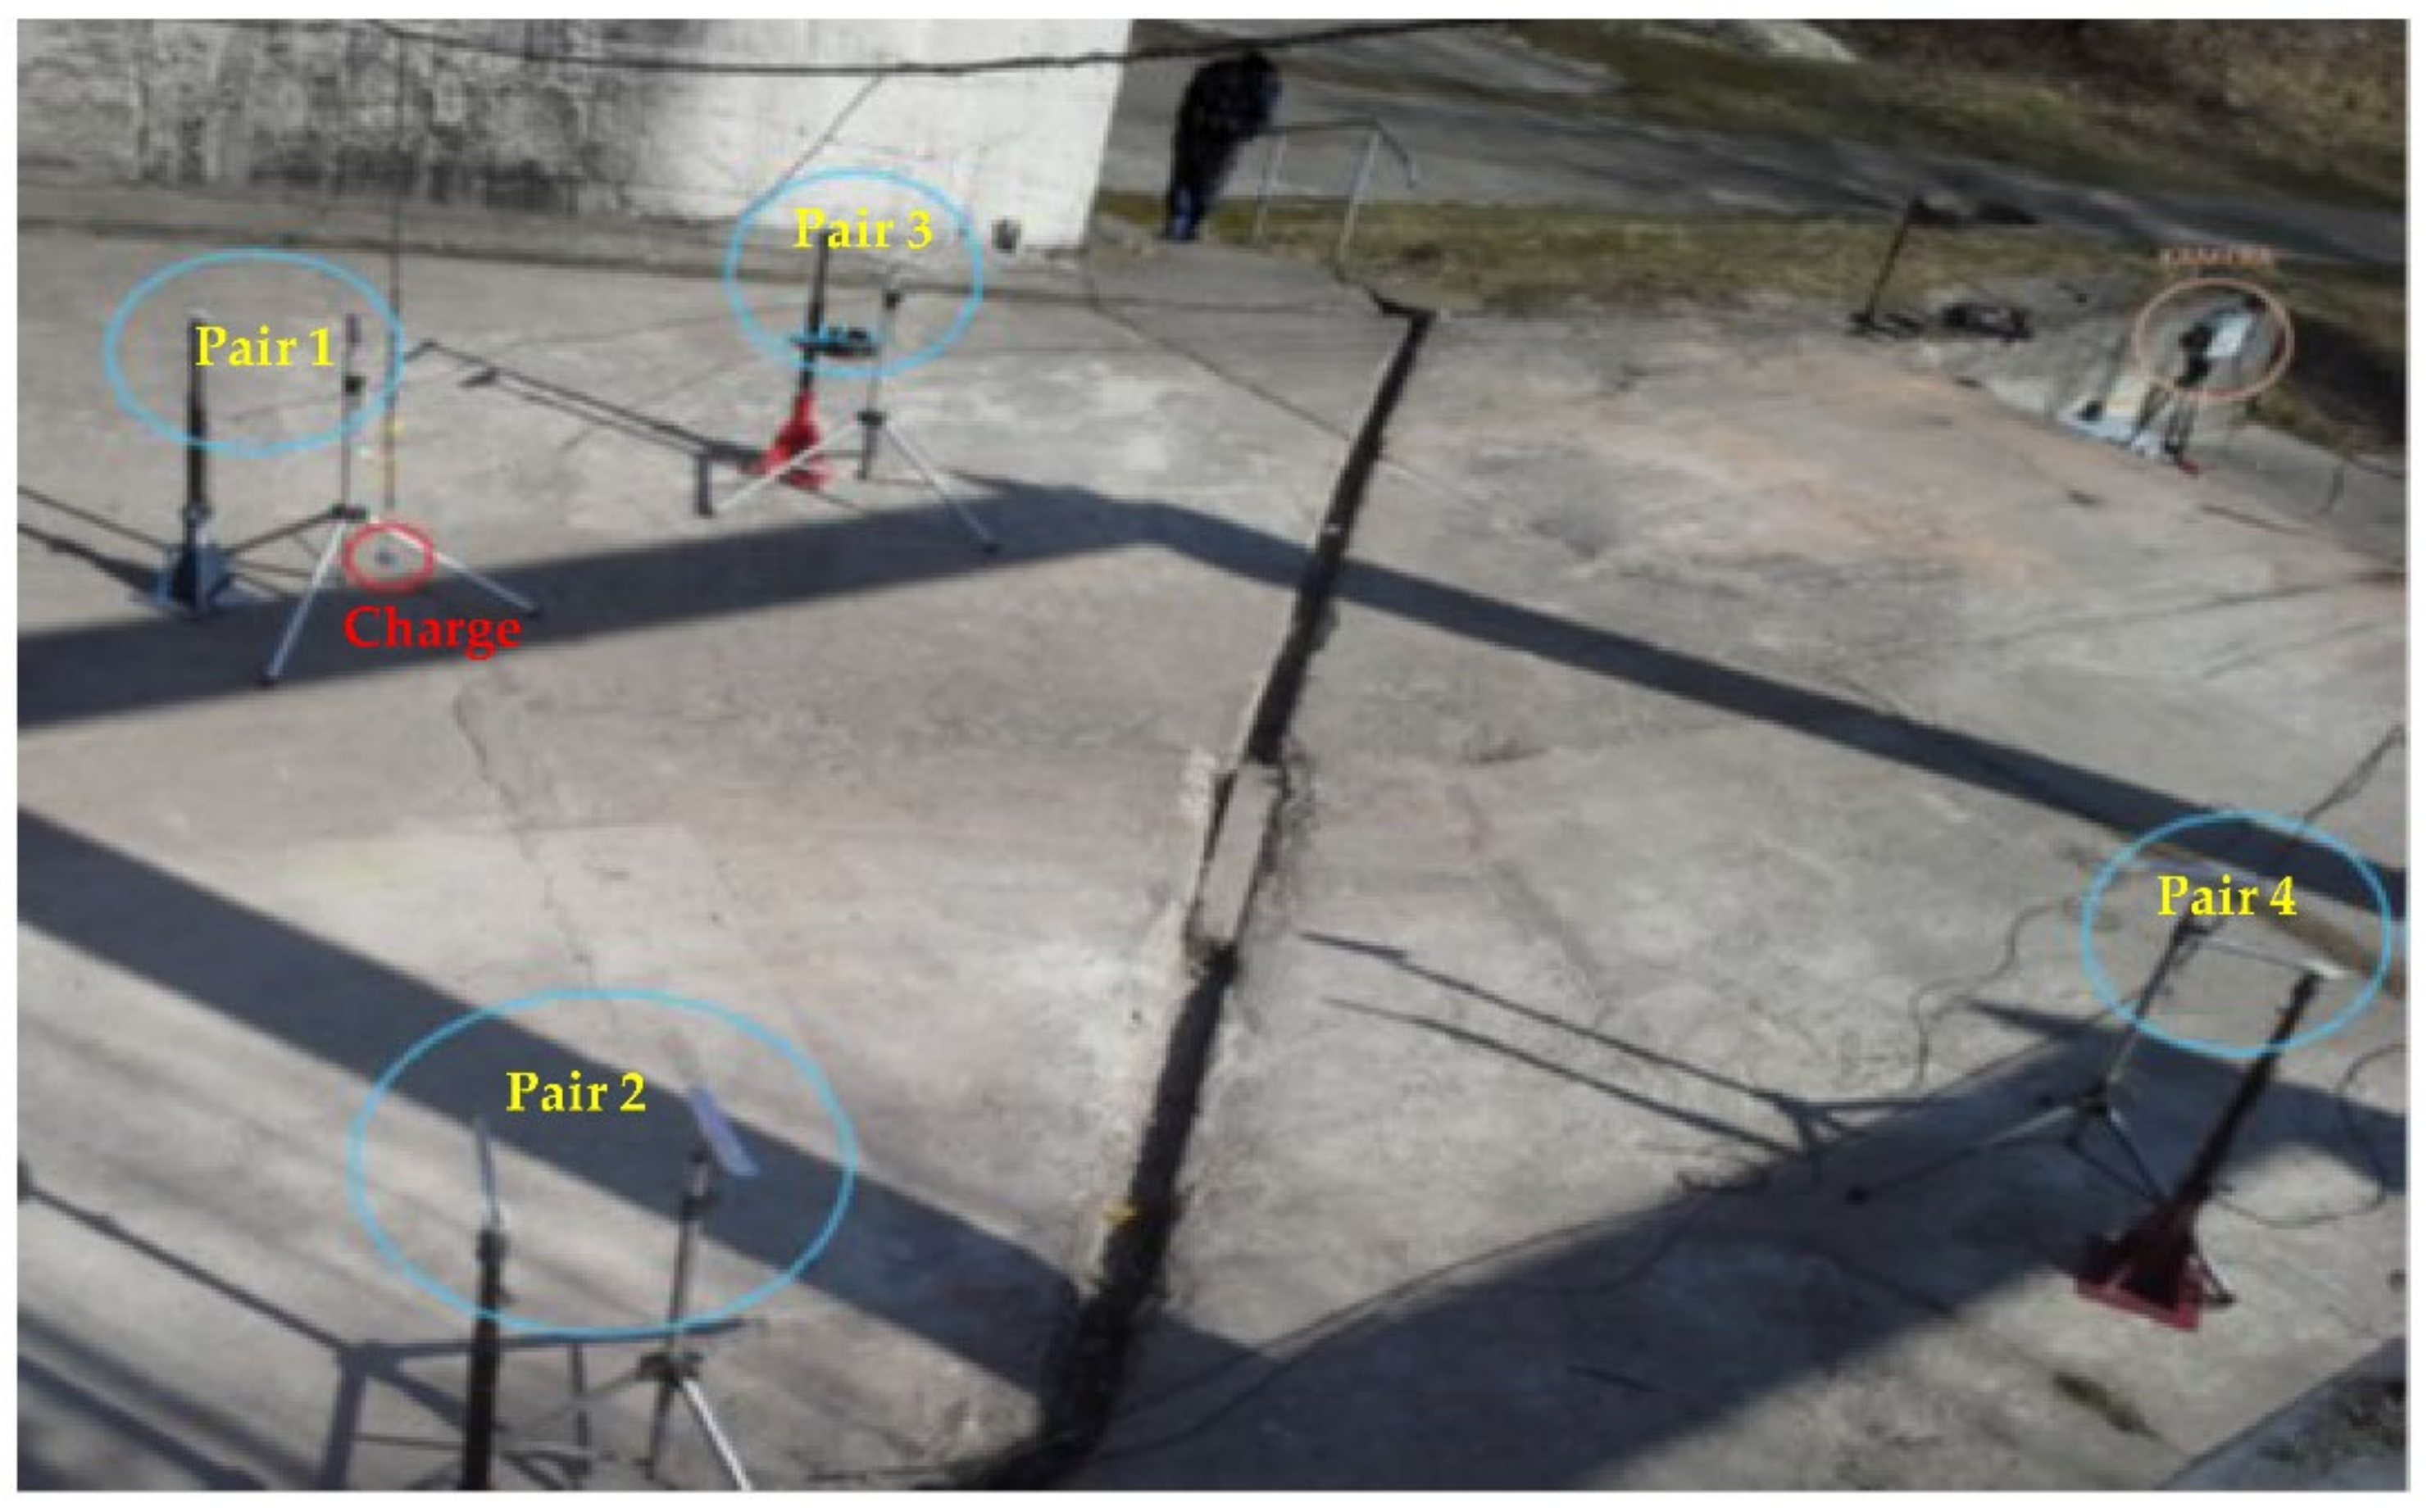
The recording of the blast wave was carried out using two types of transducers. PCB Piezotronics type 113B28 transducers in pencil probe or knife probe design were used. The transducers have a measuring range of 344.7 kPa, rise time less than 1 μs and natural frequency greater than 500 kHz. Pressure transducers were arranged in pairs (pencil and knife probes) around the charge at predetermined distances so as not to interfere with the measurements of the other pairs. The measurement distances were set at 2, 3, 4 and 5 m. The transducers were placed at the same height above the ground as the charge, i.e., 1.25 m. The arrangement of the pairs of transducers and their distances are presented in
Figure 2 (the pairs of transducers are marked as pair). The positions of the suspended charge and the HS camera are also seen in the figure.
2.4. The Explosive Used
The explosive used in the experiments was labelled Semtex 10-SE. Semtex 10-SE is a plastic, industrial waterproof white explosive that is classified as a special purpose explosive. This type of Semtex contains a non-explosive plasticizer. Highly explosive pentrite (PETN) is its main and effective component. It is supplied in a leaf charge form. It is mainly used for blast hardening of metallic materials. Selected parameters of the explosive are specified in
Table 2.
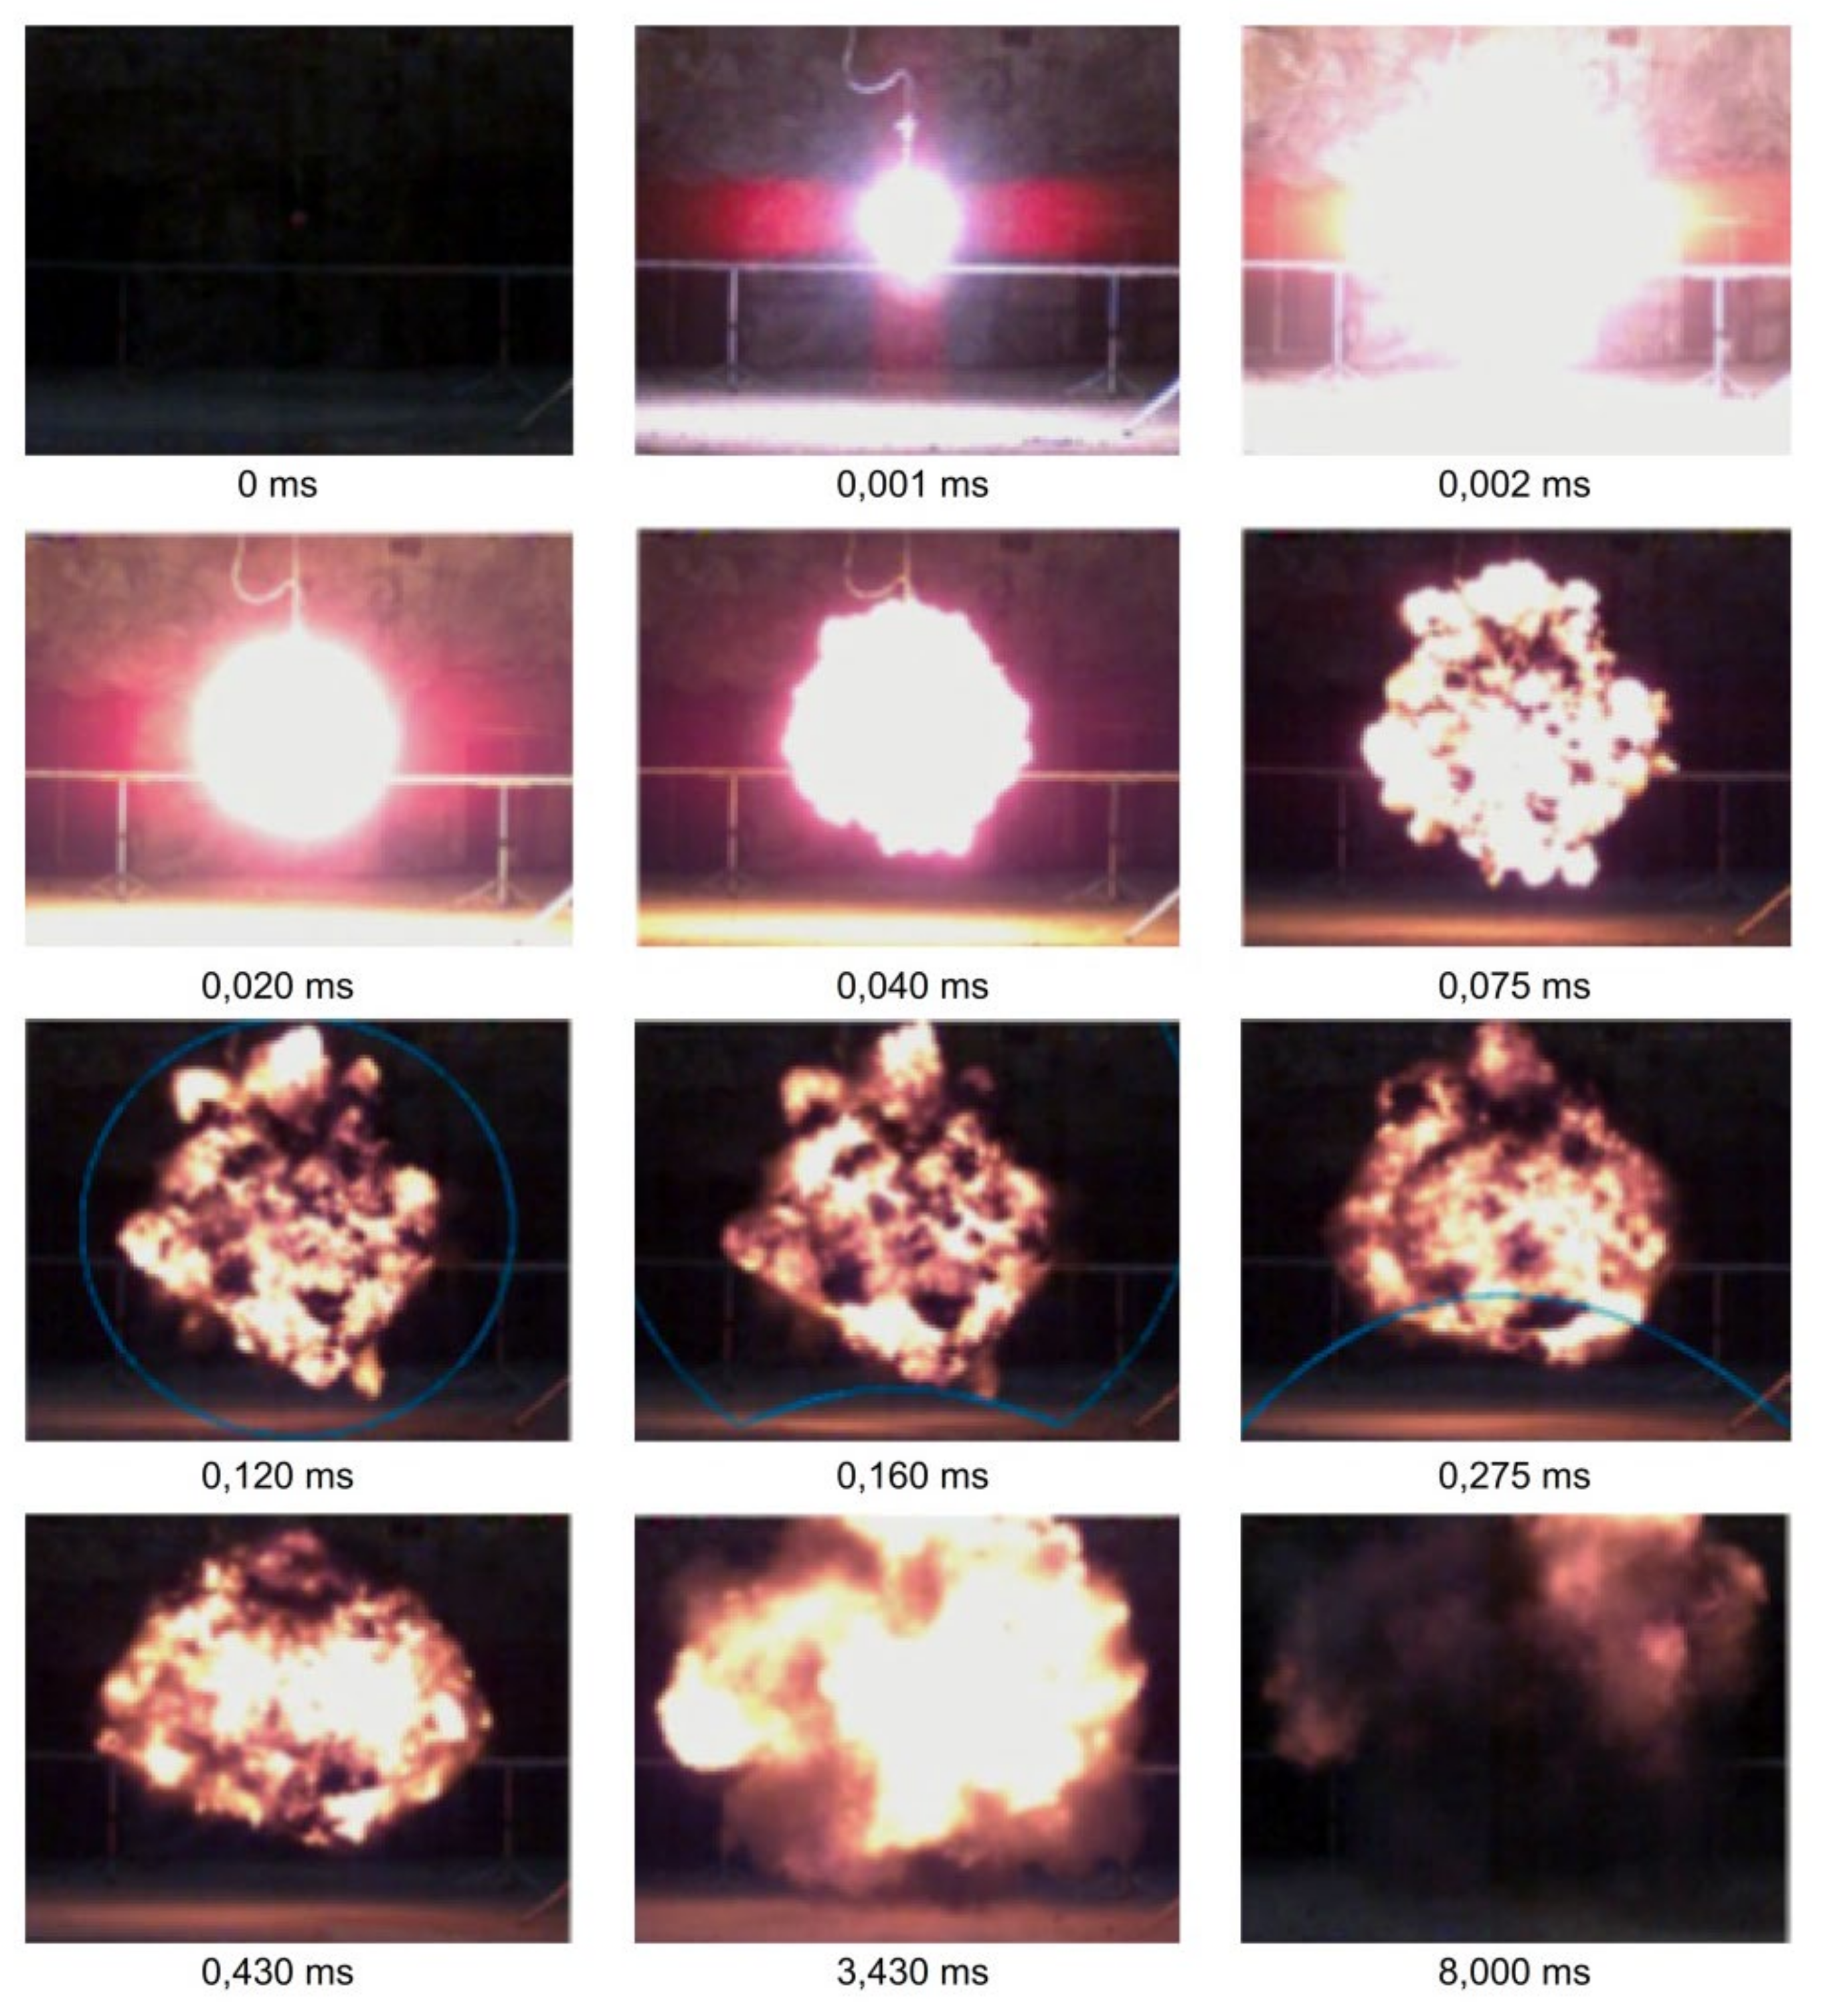
The initiation of the charges was carried out with an electric detonator marked 0-ZB-S from the manufacturer Austin Detonator, which is instantaneous with medium resistance to the effects of external sources of electricity. The tube material is copper. The primary charge is quicksilver. The secondary charge of the detonator is 720 mg (PETN). It has a relatively high initiating capability. The Semtex 10-SE charges used were shaped into spheres of 100, 200, 300 and 400 g. The design of the experiment was based on the authors’ interest in detecting near-field blast effects. The course of the explosive transformation when using a 300 g charge in defined time periods is presented in
Figure 3. In addition, the propagation of the shock wave including the reflection from the ground level (blue line) is shown.
2.5. Predictive Models
This section deals with predictive calculation methods for individual shock wave parameters. Based on many literature sources, there are a large number of computational relationships for individual parameters of blast. To verify their applicability to the case of small near-field charges, the most appropriate ones have been selected.
The concept of reducing the distance is based on the complexity of determining the values of shock wave effects. In the case of one type of explosive, it would be necessary to measure the parameters for all explosive masses at different distances in the experiment, which would be very difficult for large charges, for example. It can therefore be assumed that, at the same reduced distance, the magnitude of a particular shock wave parameter induced by a particular type of explosive is the same for all explosive masses. The reduced distance makes it possible to determine the correlation between the different distances and masses of explosives and to simplify the possibilities of determining their explosion parameters [
22,
23].
Thus, the reduced distance is a basic calculation relationship that is used to derive shock wave parameters based on the knowledge of the explosive mass and the distance between the point of exposure to the shock wave and the epicentre of the explosion, as given in Relation (1).
In this relationship, Z represents the reduced distance in m·kg−1/3, R is the actual distance of the charge in m, and W is the mass of the charge, usually the equivalent mass of TNT in kilograms.
2.5.1. Kingery and Bulmash
A single polynomial function is applied for calculations of all shock wave parameters. The calculation of the corresponding parameter consists in the appropriate assignment of the corresponding constants to the specified coefficients. These constants differ from each other according to the type of the parameter to be searched and belong to the corresponding interval of reduced distances. The general notation of the polynomial function according to Kingery and Bulmash is provided by Relation (2) [
4].
In this relation,
f is the result variable of the calculation, characterising the parameter being searched for. This relation can be used to calculate the peak overpressure
PS0, the arrival time of the shock wave
tA, the duration of the positive phase
t0, the shock wave velocity
v, the positive impulse of the explosion
is, the reflected pressure
pr and the reflected impulse of the explosion
ir.
A,
B,
C,
D,
E,
F and
G are the coefficients to which values from the constants corresponding to the parameter of interest are assigned. The values of these coefficients can be found in
Table 3.
This relation is suitable due to its complexity, as many parameters can be determined using it. In addition, it enables calculation for a relatively wide range of reduced distances, especially for peak overpressure (0.2–198.5 m·kg−1/3).
2.5.2. Kinney and Graham
The Kinney and Graham relations were chosen as one of the alternative calculation relations, which provide the calculation of the maximum overpressure, impulse and the positive phase duration [
1]. The individual relations are not constrained by the range of reduced distances. For comparison purposes, only the relationships for peak overpressure (Relation (3)) and positive phase duration (Relation (4)) are presented:
2.5.3. Henrych and Major
The calculation relations according to Henrych and Major are not intended for such large ranges of reduced distances as the relations of Kingery and Bulmash, but they provide possibilities of calculation of certain parameters of shock waves for the range of sufficiently low reduced distances, when the Kingery and Bulmash relations in some cases (e.g., peak overpressure) do not allow the calculation [
2].
As with the other relationships, these relationships allow the calculation of peak overpressure, positive phase impulse and the positive phase duration. In order to apply each formula, the condition that the reduced distance must fall within a specified interval for which the relation holds, must be met—as it is found in Relations (5)–(7).
Only one formula is defined for the positive phase duration, Relation (8).
2.5.4. PECH
The derived PECH calculation relation does not primarily use reduced distance values and is applicable to a wide range of actual distances. The calculation relation allows only the peak overpressure (Relation (9)) to be determined. A formula for the positive phase duration has not yet been derived.
The above computational relations were used to determine selected explosion parameters (peak overpressure and the positive phase duration of the explosion) during the initiation of charges with varying mass. To verify the applicability of the computational relations, a comparison with experimentally determined values was made. Based on the comparison, it was then possible to deduce the most suitable computational procedure for the required shock wave parameters under the given conditions of the realised experiments.
3. Results
The experimental measurements included five repeated trials for each charge weight. The charge weights were determined in the range of 100 to 400 g.
Table 4 presents the values of selected explosion parameters (peak overpressure and positive phase duration) for each charge weight and scaled distance. Since the peak overpressure values from the repeated trials for each charge varied only slightly (only in tenths of kPa), the averaged values are presented. In the case of the positive phase duration values, the variations were quite negligible.
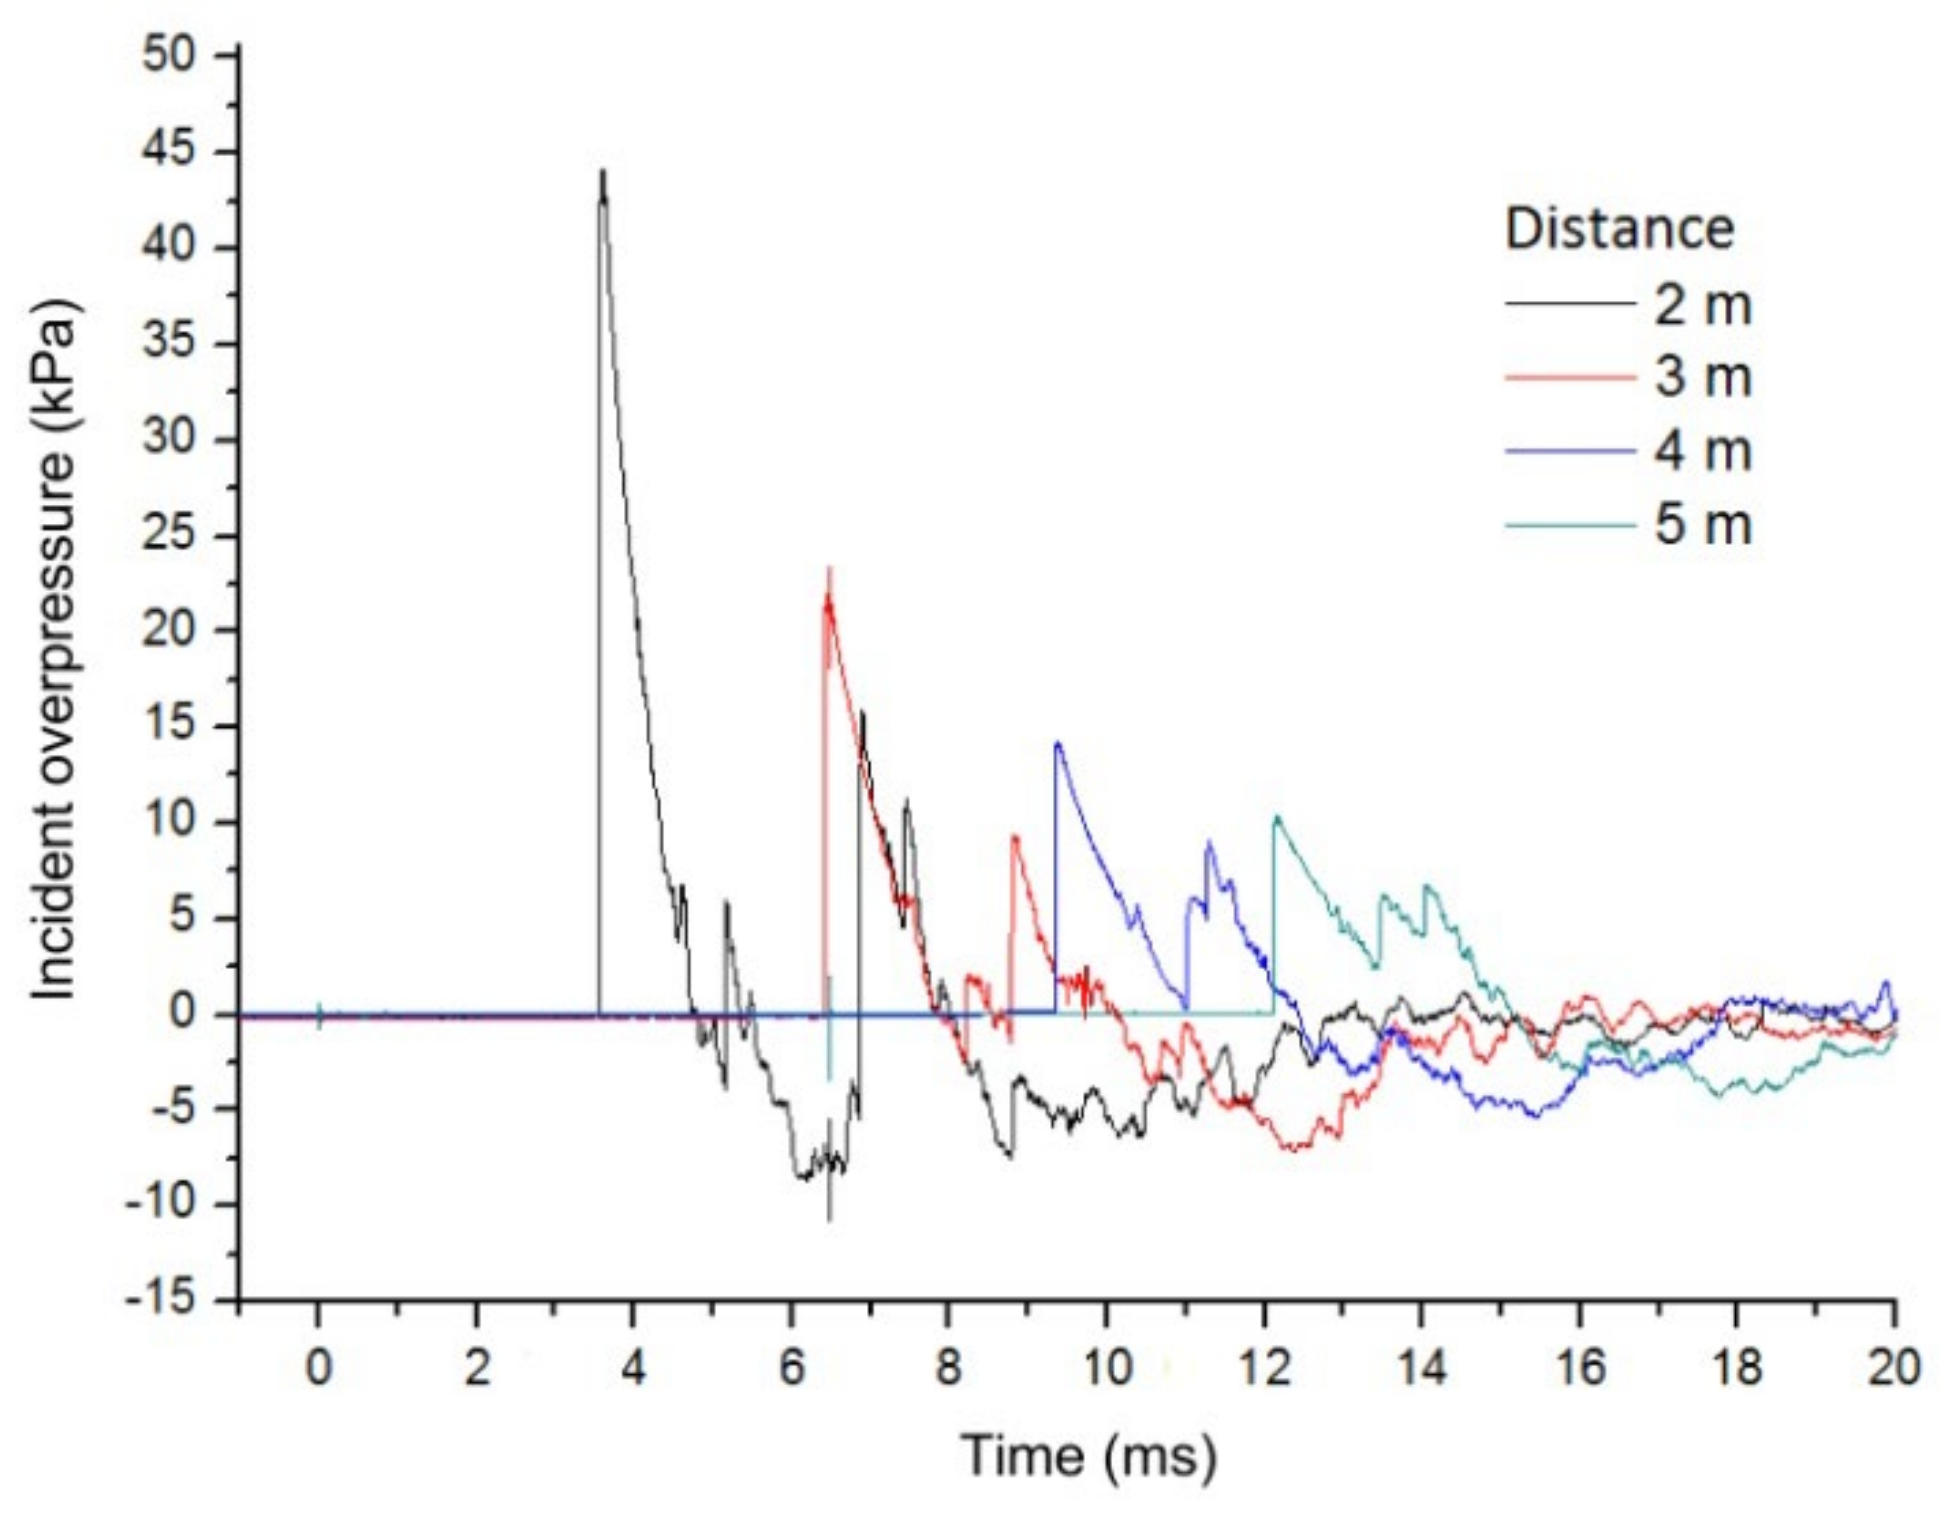
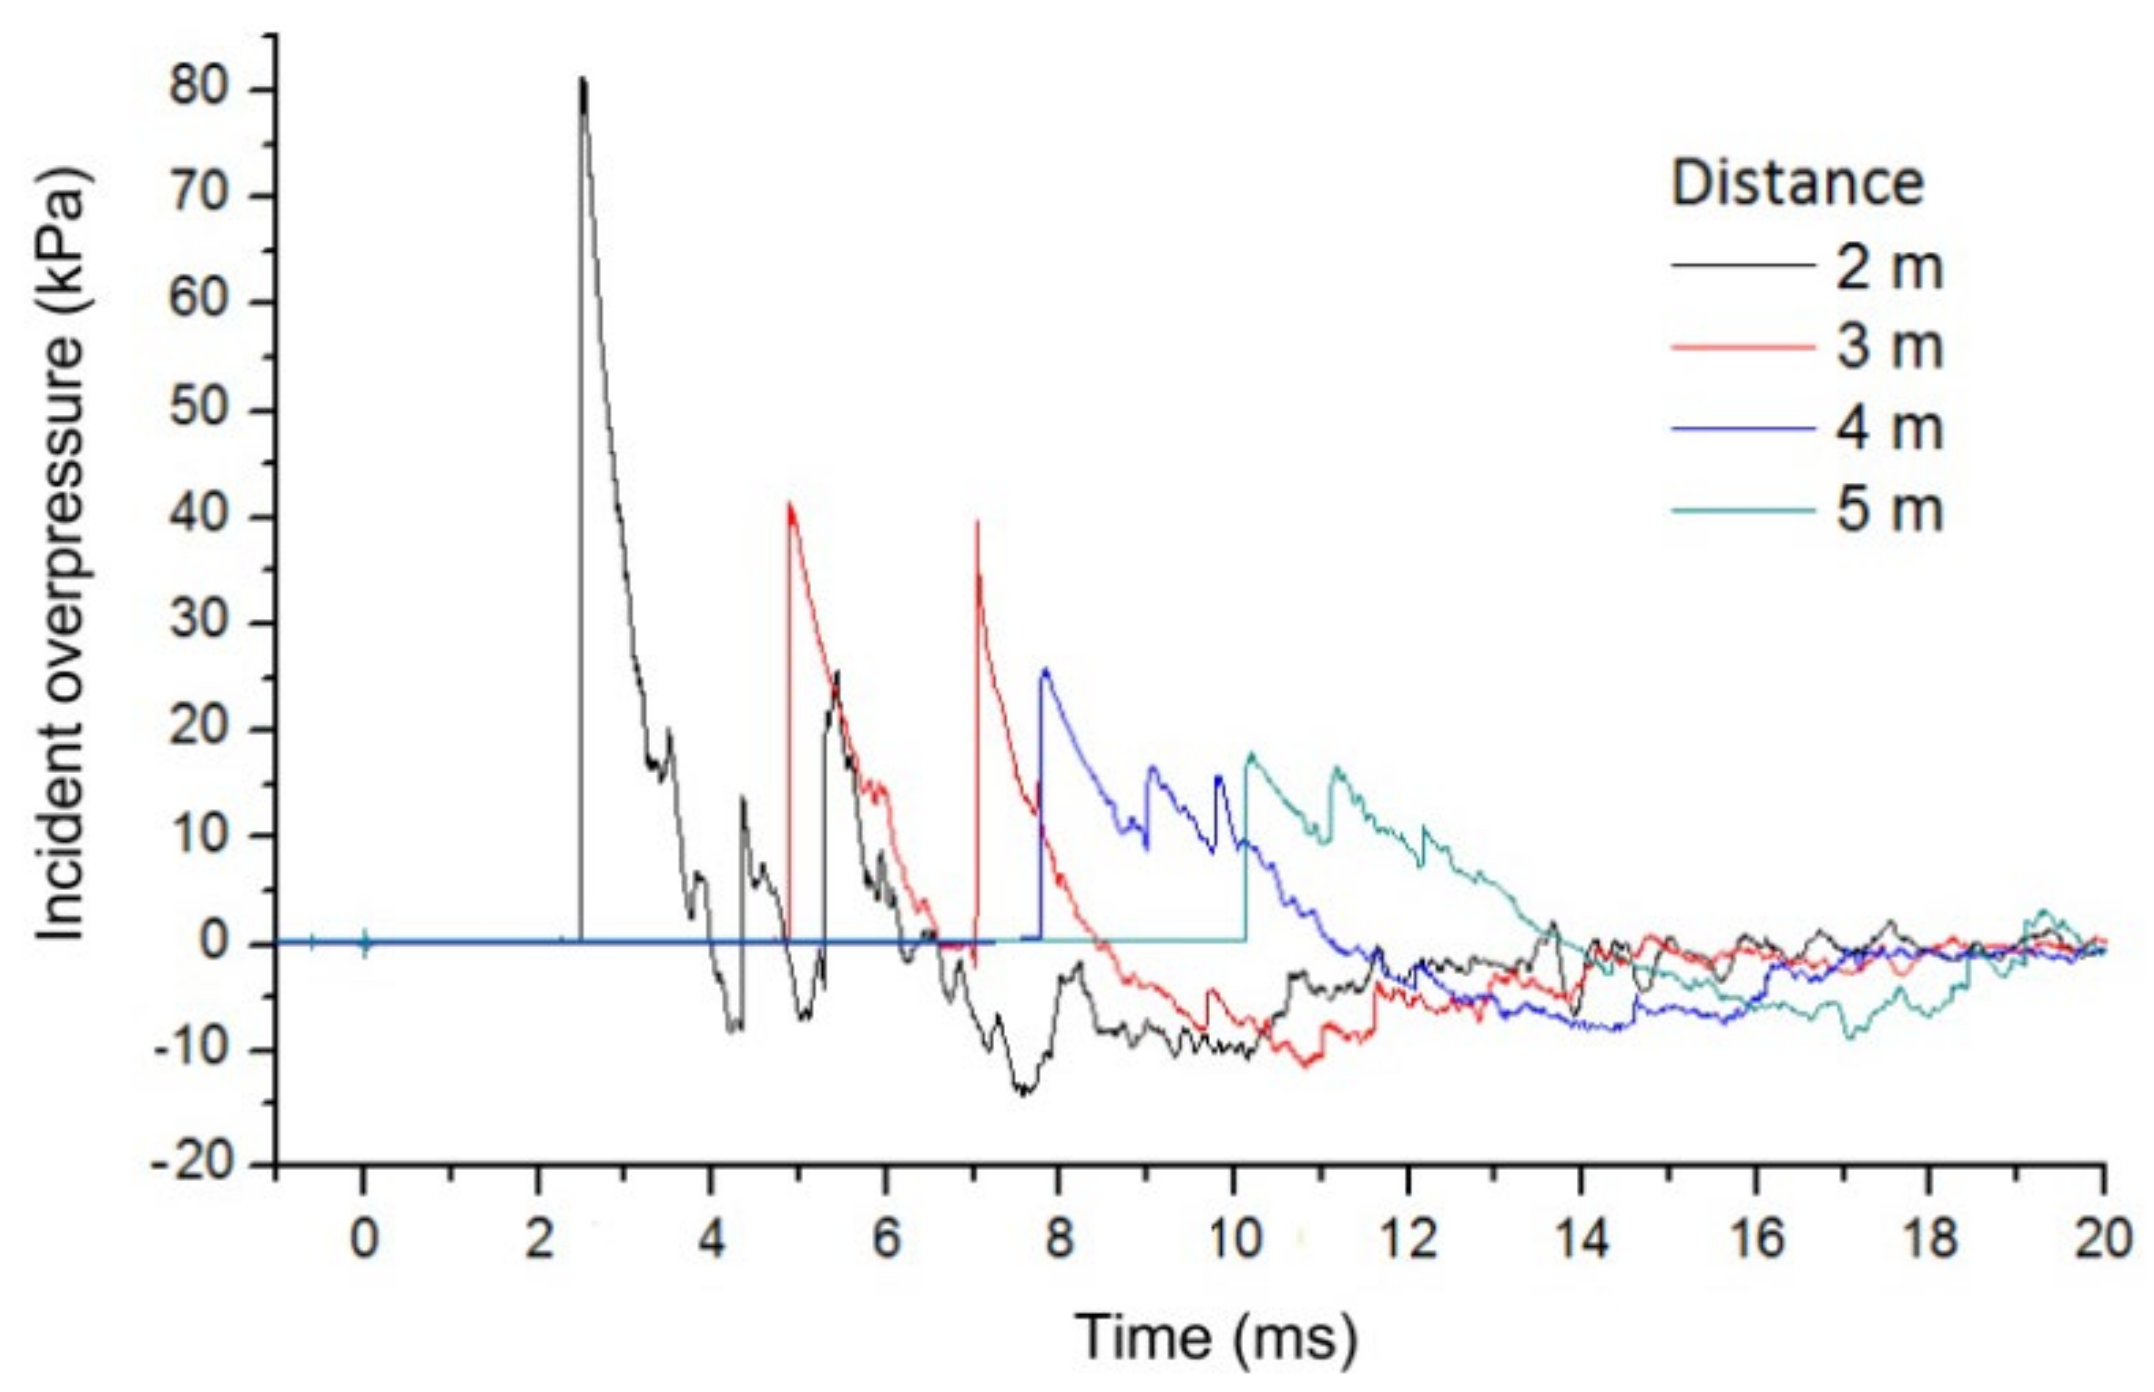
Figure 4 shows the blast curves for each distance for a 100 g charge. From the graph it is possible to read the values of peak overpressure, positive phase duration and possibly other explosion parameters. The value “0” on the horizontal axis indicates the moment of initiation of the charge.
The values calculated according to the individual predictive models for a 100 g charge are provided in
Table 5. For some models, it was not possible to calculate positive phase duration values, either because the scaled distance values were outside the range of applicability of the formulas, or the method used did not allow this calculation.
Table 6 summarises the relative deviations of the calculated and measured values for a charge of 100 g. The relative deviations are calculated for the individual scaled distances for both blast parameters. Positive values of the relative deviations indicate an overestimation of the blast parameters compared to the experimentally determined values, and conversely, negative values of the relative deviations indicate an underestimation. For a more comprehensive evaluation of the applicability of the computational relationships, all relative deviations were averaged within one model, separately for each observed explosion parameter.
Figure 5 illustrates the blast curves for each distance for a 200 g charge.
The values calculated according to the individual predictive models for a 200 g charge are presented in
Table 7.
Table 8 lists the relative deviations of the calculated and measured values for a 200 g charge.
Figure 6 gives the blast curves for each distance for a 300 g charge.
The values calculated according to the individual predictive models for a 300 g charge are shown in
Table 9.
Table 10 contains the relative deviations of the calculated and measured values for a 300 g charge.
Figure 7 represents the blast curves for each distance for a 400 g charge.
The values calculated according to the individual predictive models for a 400 g charge are presented in
Table 11.
Table 12 sets out the relative deviations of the calculated and measured values for a 400 g charge.
4. Discussion
When evaluating the results of experiments carried out with Semtex 10-SE spherical charges, which differed in mass, the assumption that the peak overpressure increases with increasing charge mass was confirmed. This is verified by theoretically calculated and experimentally obtained results. Based on the comparison of experimentally measured and theoretically calculated values of peak overpressures, it can be concluded that the different predictive calculation models are applicable for load estimation, but the degree of uncertainty varies from one relation to another. Percentage relative deviations, following the authors’ calculation formulas, were interpreted in
Table 6,
Table 8,
Table 10 and
Table 12. From the average values of the relative deviations between the calculated and measured values, it can be concluded that the calculated values according to Kinney and Graham, Henrych and Major and PECH are always on average lower than the experimentally measured values. On the other hand, the calculated results according to Kingery and Bulmash are in all cases larger than the measured values.
All the calculations of peak overpressures mentioned so far are roughly the same in comparison with the measured values, with differences of units or a few tens of percent at most (the most extreme difference found was in the case of comparison of the Kingery and Bulmash result with the measured value at a distance of 2 m for a 400 g Semtex charge, which was 48.3%). The largest differences occurred in the case of the Kingery and Bulmash calculations, with differences in the tens of percent range. It appears that as the distance from the charge reduces and the mass of the charge increases, higher differences between the measured and calculated values arise. This is due to the lower sensitivity of the computational relations for the close surroundings of the explosive. From a practical point of view, this is not a major complication, since the parameters of the explosive loads are usually more relevant for larger distances, where the accuracy of the calculation relations is already considerably higher. The overall intercomparison of the results of these relations with measured values shows that the smallest average differences between the theoretical calculations and experimentally measured values of peak overpressures are in the case of using the PECH calculation relation.
Theoretical calculations of positive phase duration show that this time increases with increasing mass of the explosive and with increasing distance from the explosion site. Although some increase is evident from the graphs and from the indicative positive phase durations within the measurement results for a given mass, there are exceptions where the duration decreases or does not change. These variations may arise from the passing of a shock wave related to the measuring equipment used. The measurement of these values was already at the limit of the accuracy of the measuring setup used, which could have affected values in the order of hundredths of milliseconds. The same phenomenon was observed in the case of increasing mass of the explosive used, where some increase in the positive phase duration is noticeable, but inconsistent with the theoretical results.
In general, the measured positive phase durations are roughly around similar values, but this results in increasing average percentage differences between the measured and calculated values according to Kingery and Bulmash. The calculations according to Kinney and Graham were initially lower than the measured values, therefore the average difference in values first decreases and then increases again with increasing mass of the charge. In the case of the calculation of the duration of the positive phase according to Henry and Major, the values could not be determined because the values of the reduced distances were outside the range of validity of the calculation relationship. From the above facts it follows that the calculation relations for the positive phase durations are of limited applicability in the context of the experimental conditions.
5. Conclusions
The subject of the investigation of the magnitude of the explosive load on objects or building structures was the chosen type of explosive, namely the industrial explosive Semtex, which, due to its known properties, served as a reference sample in this case. At the theoretical level of determining the selected blast wave parameters, there are many different calculation relationships. The calculations by these different relations differ from each other; this is due to the differences in the conditions for which the calculation relation was constructed. In general, one of the most important blast wave parameters is the peak overpressure, since it is the parameter that has a major influence on the action of the pressure wave on the building structure. Based on extensive research, predictive relationships have also been traced that can be applied more universally. The limitations for these relationships arise from their applicability to specific situations. Due to the applicability of the computational relations, only the relations for peak overpressure and positive phase duration were used in the theoretical calculations of blast wave parameters.
Two types of pressure probes were used in the experimental measurements, but with the same pressure transducers used. The values of the measured overpressures differed only minimally between the single transducers at the same distance (in the same pair), within a maximum of one percent. From the recorded blast curves, the peak overpressure and the duration of the positive phase can be read off, as well as other important blast wave parameters. The overpressure curves also showed the reflection of the blast wave from the bedrock (or other obstacles), which can affect their course and distort the measured values under certain circumstances.
Comparing the experimentally measured and theoretically calculated peak overpressures, it was found that the smallest differences occurred in the case of using the predictive model according to PECH, whose deviations from the measured values differed at most in units of percent. On this basis, it can be determined that this was the most appropriate computational relationship under the conditions of the experiment.
Author Contributions
Conceptualization, A.F. and M.M.; methodology, M.M.; software, A.F. and M.M.; validation, M.M., A.F. and R.Z.; formal analysis, A.F. and M.M.; investigation, M.M. and A.F.; resources, M.M.; data curation, A.F.; writing—original draft preparation, M.M.; writing—review and editing, A.F.; visualization, A.F.; supervision, R.Z.; project administration, R.Z.; funding acquisition, A.F. and R.Z. All authors have read and agreed to the published version of the manuscript.
Funding
This research was funded by University of Calabria, SMART Lab (Structural Monitoring, Structural Advanced Materials, Structural Rehabilitation, Structural Testing Laboratory).
Institutional Review Board Statement
Not applicable.
Informed Consent Statement
Not applicable.
Data Availability Statement
The article provides all data used in this research.
Acknowledgments
Special thanks for organizing and conducting the experimental studies is given to the Faculty of Safety Engineering, VŠB Technical University of Ostrava, Czech Republic.
Conflicts of Interest
The authors declare no conflict of interest.
References
- Kinney, G.F.; Graham, K.J. Explosive Shocks in Air; Springer: Berlin, Germany, 1985. [Google Scholar]
- Henrych, J. The Dynamics of Explosion and Its Use; Elsevier: Amsterdam, The Netherland, 1979. [Google Scholar]
- Mills, C.A. The design of concrete structures to resist explosions and weapon effects. In Proceedings of the 1st International Conference on Concrete for Hazard Protections, Edinburgh, UK, 27–30 September 1987. [Google Scholar]
- Kingery, C.N.; Bulmash, G. Airblast Parameters from TNT Spherical Air Burst and Hemispherical Surface Burst; Technical Report ARBRL-TR-02555; U.S. Army BRL: Aberdeen Proving Ground, MD, USA, 1984.
- Sadovskiy, M.A. Mechanical effects of air shockwaves from explosions according to experiments. In Geophysics and Physics of Explosion; Selected Works; Sadovskiy, M.A., Ed.; Nauka Press: Moscow, Russia, 2004. [Google Scholar]
- Beshara, F.B. Modelling of blast loading on aboveground structures—I. General phenomenology and external blast. Comput. Struct. 1994, 51, 585–596. [Google Scholar] [CrossRef]
- Brode, H.L. Numerical Solution of Spherical Blast Waves; American Institute of Physics: New York, NY, USA, 1955. [Google Scholar]
- Swisdak, M.M., Jr. Simplified Kingery Airblast Calculations. In Minutes of the Twenty Sixth DOD Explosives Safety Seminar; DTIC Document; U.S. Department of Defense, Explosives Safety Board: Indian Head, MD, USA, 1994. [Google Scholar]
- U.S. Department of the Army. Design and Analysis of Hardened Structures to Conventional Weapons Effects; Technical Manual 5-855-1; U.S. Department of the Army: Arlington, VA, USA, 1986.
- U.S. Department of the Army. Structures to Resist the Effects of Accidental Explosions; Technical Manual 5-1300; U.S. Department of the Army: Arlington, VA, USA, 1990.
- U.S. Department of the Army. Structures to Resist the Effects of Accidental Explosions; Technical Report UFC 3-340-02; U.S. Department of the Army: Arlington, VA, USA, 2008.
- Karlos, V.; Solomos, G. Calculation of Blast Loads for Application to Structural Components; JRC Technical Report, EUR 26456EN; European Union: Luxembourg, 2013. [Google Scholar]
- Remennikov, A.M. A review of methods for predicting bomb blast effects on buildings. J. Battlef. Technol. 2003, 6, 5–10. [Google Scholar]
- Ngo, T.; Mendis, P.; Gupta, A.; Ramsay, J. Blast Loading and Blast Effects on Structures—An Overview; EJSE Special Issue: Loading on Structures; The University of Melbourne: Parkville, VIC, Australia, 2007. [Google Scholar]
- Koccaz, Z.; Sutcu, F.; Torunbalci, N. Architectural and structural design for blast resistant structures. In Proceedings of the 14th World Conference on Earthquake Engineering, Beijing, China, 12–17 October 2008. [Google Scholar]
- Draganić, H.; Sigmund, V. Blast loading on structures. Teh. Vjesn. 2012, 19, 643–652. [Google Scholar]
- Ding, Y.; Zhang, X.; Shi, Y.; Zhang, H. Prediction of far-field blast loads from large TNT-equivalent explosives on gabled frames. J. Constr. Steel Res. 2022, 190, 107120. [Google Scholar] [CrossRef]
- Shirbhate, P.A.; Goel, M.D. A Critical Review of Blast Wave Parameters and Approaches for Blast Load Mitigation. Arch. Comput. Methods Eng. 2021, 28, 1713–1730. [Google Scholar] [CrossRef]
- Birhane, T.H. Blast Analysis of Railway Masonry Bridges. Master’s Thesis, University of Minho, Braga, Portugal, 2009. [Google Scholar]
- Baker, W.E. Explosions in Air; University of Texas Press: Austin, TX, USA, 1973. [Google Scholar]
- Baker, W.E.; Cox, P.A.; Westine, P.S.; Kulesz, J.J.; Strehlow, R.A. Explosion Hazards and Evaluation; Elsevier Scientific Publishing Company: New York, NY, USA, 1983. [Google Scholar]
- Hopkinson, B. British Ordnance Board Minutes; Report 13565; British Ordnance Office: London, UK, 1915. [Google Scholar]
- Cranz, C. Lehrbuch der Ballistic; Springer: Berlin, Germany, 1926. [Google Scholar]
| Publisher’s Note: MDPI stays neutral with regard to jurisdictional claims in published maps and institutional affiliations. |
© 2022 by the authors. Licensee MDPI, Basel, Switzerland. This article is an open access article distributed under the terms and conditions of the Creative Commons Attribution (CC BY) license (https://creativecommons.org/licenses/by/4.0/).


