Abstract
Pavement distresses are induced by mechanistic responses in pavement structure subjected to dynamic loads of moving vehicles. Pavement surface evenness deteriorates as pavement distresses propagate, which results in dynamic axle loads and faster pavement deterioration. It is vital to consider the dynamic axle load spectra to predict pavement deterioration using traffic-monitoring data. This study aimed to evaluate the effect of dynamic loads and overweight traffic on asphalt pavement overlay performance using mechanistic–empirical (M–E) pavement analysis. The relationship between dynamic load coefficients (DLCs), axle loads, and international roughness index (IRI) was obtained for accurate quantification of dynamic axle loads. Then the dynamic axle load spectra were derived by shifting the static axle load spectra in weigh-in-motion (WIM) data, given the DLC value. AASHTOWare Pavement ME software was used to analyze pavement performance with static and dynamic axle load spectra, and the impact of overweight traffic on asphalt pavement overlay performance. The impact of dynamic loads on reflective fatigue cracking was distinguished at an early stage of the service period and eliminated after the 10-year analysis period, when the propagation of reflective cracking reached a specific level. On the other hand, the consideration of dynamic axle loads increased the impact of overweight truck traffic on pavement distresses, and pavement structures of major highways tend to be more sensitive to overweight traffic because of greater DLC excitement at higher operational speeds.
1. Introduction
Pavement distress is an accumulated result of mechanistic responses in pavement structure subjected to dynamic loads of moving vehicles and climatic conditions. Pavement surface evenness deteriorates as pavement distress propagates. The variance of dynamic loads on rougher pavement surface condition leads to even faster pavement deterioration. It is vital to consider vehicle–pavement interaction to estimate pavement distress in pavement design. In the Mechanical–Empirical Pavement Design Guide (MEPDG), the principles of engineering mechanics are applied to calculate pavement response under traffic loading. The empirical transfer functions are then used to predict long-term pavement performance through local calibrations. The axle load spectra obtained from weigh in motion (WIM) is utilized as traffic inputs in MEPDG. The WIM system captures gross vehicle weights, individual axle loads, and axle spacing when trucks are passing over the station [1]. In general, raw data collected by the WIM system need to be calibrated by comparing field measurements of static scales to guarantee the required accuracy [2]. Therefore, WIM data indicate static axle load spectra, which may not reflect the variation of dynamic loads on real pavements due to surface roughness.
Previous studies have evaluated the impact of dynamic loads on flexible pavement deterioration and service life. Navarrina et al. found that the service life of asphalt pavement was shortened by 40% after taking dynamic loads into consideration [3]. Bilodeau, Gagnon, and Dore concluded that pavement life could be reduced by 29% due to fatigue cracking and by 20% due to rutting after considering dynamic loads [4]. Gillespie et al. introduced the distribution of dynamic loads under the wheel with a mean value equal to static load and a standard deviation, which follows normal distribution [5]. Hu et al. evaluated the pavement damage around manholes and suggested that the maximum of dynamic load was 1.29 times that of the static load, which increased the pavement damage coefficient up to 2.12 times that of the static load [6]. To investigate the impact of dynamic loads on pavement surface conditions, the dynamic loading coefficient (DLC) was defined as a ratio by dividing the standard deviation of dynamic loads by the mean value. Regression models were developed to correlate DLC with contributing factors such as vehicle speed and pavement roughness conditions [7,8,9]. Misaghi et al. found that pavement life decreased from 1.31 million to 0.63 million passes for a terminal rut depth of 15 mm, while pavement life decreased from 1.07 million to 0.64 million passes for a terminal of 40% at a vehicle speed of 90 km/h [10]. However, limited studies have taken the influence of axle loads on the DLC into consideration.
Limited studies have considered dynamic loads induced by vehicles on rough pavement in pavement design. International roughness index (IRI) is a standard scale for roughness according to the response of a generic motor vehicle subjected to road surface roughness and determined by the measurement of road profile, simulation of vehicle responses, and accumulation of suspension travel [11]. It is quantified by measuring vertical deviations over a road section by response-type road measuring systems such as road meters and profilometers [12]. Rys considered dynamic loads in the determination of axle load spectra in the M–E pavement design by including the static axle load spectra and distribution of dynamic loads from specific axle load intervals. It was indicated that the cracked area and rut depth in medium pavement structure increased by 67% and 8% under dynamic loads when the IRI was 4 m/km [13]. The constant value of DLC was utilized in the transformation. However, axle loads were expected to have an influence on the variance of dynamic loads and DLC [14,15]. In addition, Rys and Burnos found that the effect of random error in axle load spectra arises from dynamic loads on predicted traffic, and overweight percentage needs to be considered if random error was not low and the coefficient was greater than 0.05 [16].
The new asphalt overlay shows a similar cracking pattern which matches the cracking in the existing asphalt layer after opening to traffic. The cracking propagation from the existing asphalt concrete (AC) layer into and through the new AC overlay is called reflective cracking. The effect of dynamic loads on reflective fatigue cracking of AC overlay on asphalt pavement can be quantified by transforming static axle load spectra to dynamic axle load spectra in M–E design. Since DLC values tend to change with axle load intervals designated by MEPDG in axle load spectra, it is essential to establish a correlation between DLC and axle loads to obtain the accurate dynamic axle load spectra. Besides, the change in axle load spectra arising from dynamic loads on the overweight percentage needs to be considered, and the impact of overweight traffic on the propagation of reflective fatigue cracking in AC overlay can be quantified by considering dynamic loads induced on rough pavement surface.
2. Objective and Scope
This study aims to quantify the impact of dynamic traffic loading on the pavement distress of AC overlay on asphalt pavement. DLCs were calculated for each axle type, and nonlinear regression models were fitted with respect to axle loads and pavement roughness levels. The dynamic loads excited by rough pavement surface condition were considered by transforming the static axle load spectra to dynamic axle load spectra in MEPDG. Two representative pavement structures on major and minor highways were selected to investigate the impact of dynamic loads on pavement distresses using M–E pavement design. The impact of overweight traffic loading on pavement distresses was quantified by considering dynamic axle load spectra.
3. Consideration of Dynamic Loads in Axle Load Spectra
3.1. Pavement Profiles and Vehicle Models
Quarter-car models, two-freedom systems consisting of the wheel, suspension system, and a quarter of vehicle mass, have been widely adopted to simulate vehicle behavior and investigate the influence of pavement evenness on dynamic tire forces [3,17,18,19]. Taking advantage of advanced software (such as MATLAB), multibody dynamic truck models were developed to simulate dynamic characters of vehicles considering comprehensive vehicle system components [4,20]. TruckSim, a multi-body dynamic model with multiple freedoms, is capable of simulating dynamic behaviors of various truck configurations. Multiple bodies can be simulated on the basis of the database embedded for a truck, including the steering system, suspension system, power train, and sprung mass [21,22]. Previous research has used TruckSim to simulate dynamic tire forces of moving vehicles with various truck configurations, considering a wide range of vehicle speeds and pavement roughness levels [23,24].
The dynamic tire forces of different axle configurations excited by pavement surface profiles at specific operational speeds were calculated using the TruckSim software. Figure 1 illustrates the axle configuration of Class 5, Class 7, and Class 9 trucks used in the study. The dynamic tire forces under single, tandem, and tridem axles were evaluated using the selected representative truck configurations. The spring rates of the tires were computed according to static load deflection measurements and applied in the previous study related to vehicle dynamics simulation [25]. For the steering axle (Axle 1), a single tire was equipped. The tire width was 275 mm, with a spring rate of 932 N/mm. For the drive axles (Axle 2, 3, 4, and 5), a dual tire assembly was equipped. The tire width was 275 mm, with a spring rate of 829 N/mm.
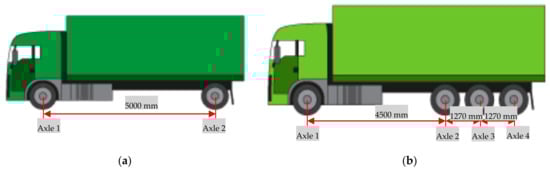
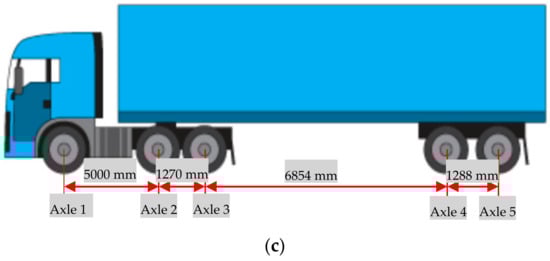
Figure 1.
Illustration of axle configurations (schematic indication) for (a) Class 5; (b) Class 7; and (c) Class 9 trucks [26].
The Long-Term Pavement Performance (LTPP) program was founded to collect pavement performance data by the Strategic Highway Research Program (SHRP). The LTPP program consisted of two fundamental categories of studies, and some smaller studies to quantify specific pavement-related details that have significant influence on pavement performance. The two categories of studies are the General Pavement Study (GPS) and Specific Pavement Studies (SPS). Pavement profile data of select pavement sections in New Jersey were extracted from the LTPP database [27]. The moving average window of profile measurements was 0.3 m (0.98 ft), and the pavement surface elevation data were recorded at an interval of 0.15 m (0.49 ft). The total length of the individual pavement segment was 152.4 m (500 ft), and it consisted of 1017 surveyed points. Totally, 13 pavement profiles of five pavement sections (SHRP_ID = 341003, 341030, 341031, 341033, and 341034) on minor highways and 11 pavement profiles of five pavement sections (SHRP_ID = 340501, 340502, 340503, 340506, and 340560) on major (Interstate) highways were extracted. The measurements were conducted through 1997–2007 on the pavement sections of GPS-6S, GPS-2, and SPS-5. Figure 2 illustrates the profiles of the select pavement sections with average IRI values measured in different years. The range of IRI values of the selected major routes was 0.73–2.78 m/km (46–176 inch/mile). A wide range of IRI values from 0.73 m/km (46 inch/mile) to 4.73 m/km (300 inch/mile) was considered for minor routes. The pavement sections with similar IRI values might have totally different surface profiles, such as pavement sections of 340503, 340507, and 340560. In the pavement management system, the IRI values of 1.50 m/km (95 inch/mile) and 2.68 m/km (170 inch/mile) were usually set as the thresholds of pavement conditions ranging from fair to good and poor to fair ratings, respectively [28].
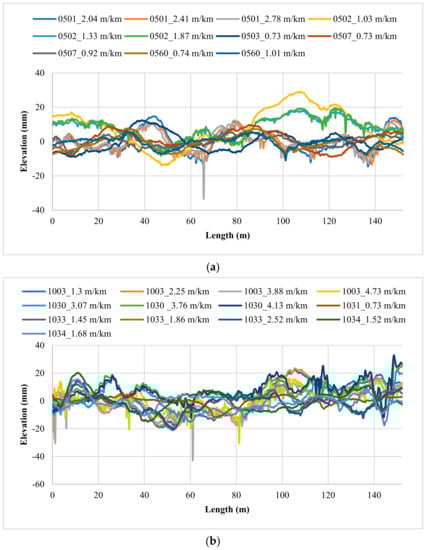
Figure 2.
Selected pavement profiles: (a) major highways; (b) minor highways (legend: SHRP_ID_IRI value).
3.2. Dynamic Load Coefficients
To investigate the impact of pavement surface conditions on dynamic loads, DLC was defined as a ratio by dividing the standard deviation of dynamic loads by the mean value [5]. It is well accepted that pavement roughness conditions and vehicle speed are influential factors to DLC. Hassan and McManus [12] and Bilodeau, Gagnon, and Dore [4] related DLC to pavement roughness conditions, while Misaghi, Nazarian, and Carrasco [8] developed regression models of IRI in terms of pavement roughness conditions and vehicle speeds. Few studies have considered the effect of static axle loads on DLC. Elischer et al. [7] and Múčka [14] predicted the DLC values in unladen and laden loading scenarios, respectively. Thus, in this study, DLCs of dynamic loads of single, tandem, and tridem axles estimated by the multi-body dynamic models in TruskSim were calculated for each pavement profile considering a wide range of static axle loads. The two vehicle speeds of 80 km/h (50 mph) and 104 km/h (65 mph) were set for minor and major highways, respectively. Figure 3 shows the effects of IRI and static axle loads on DLCs on minor and major highways. It indicates that DLCs tend to increase as pavement roughness levels increase, and decrease with an increase in static axle loads.
Figure 3.
Change of DLC with IRI and axle loads: (a) single axle (minor); (b) tandem axle (minor); (c) tridem axle (minor); (d) single axle (major); (e) tandem axle (major); and (f) tridem axle (major).
Based on the calculated DLCs, a nonlinear regression model was fitted with respect to axle load and pavement roughness for each axle type, as expressed by Equation (1). The vehicle speed was not included as a continuous variable in the regression model since two different speeds were considered for major and minor highways, respectively.
where, is dynamic loading coefficient of axle type (i = 1 for single, 2 for tandem, and for tridem); is static axle load (kips); IRI is international roughness index of pavement profile (m/km); and a, b, and c are fitting coefficients.
Table 1 presents the parameters of regression model in Equation (1) for major and minor highways. Regression models were derived for single, tandem, and tridem axle loads with the acceptable R-squared values. Taking advantage of these models, the DLCs of specific static axle loads could be predicted for determination of dynamic axle load spectra, given the axle load interval.

Table 1.
Parameters of regression model of DLC with respect to IRI and axle load.
3.3. Dynamic Axle Load Spectra
Dynamic load distribution should consider the impact of deviation of axle loads from static magnitudes. The discrete distribution of axle loads is determined by the percentage of axle passes falling into a set of axle load intervals. The Dynamic Axle Loads Spectrum includes both static axle load spectra and distribution of dynamic loads coming from different axle load intervals [13]. The percentage of dynamic loads in the interval j comes from dynamic loads induced by axles with static loads of . The dynamic axle load spectra, the total percentage of all axle loads in a given load interval j, is calculated as a sum of dynamic loads from all the static axle load spectra intervals k. The percentage of dynamic loads is computed using Equation (2).
where, are the percentage of dynamic loads; are dynamic loads (kips); and are the percentage of number of axles with static load determined from WIM data.
It was assumed that dynamic loads can be characterized as normal distribution with the average value in the middle of a given interval and standard deviation, which has been proved and applied in previous works [6,13]. The DLC values in the formula would change with pavement roughness levels and axle load intervals designated by MEPDG. Figure 4 illustrates the comparison of static axle load spectra and dynamic axle load spectra on major and minor highways. The axle load spectra were extracted from measured data in the long-term pavement performance (LTPP) database at two WIM sites on one major and one minor highway in NJ, respectively, which were considered as the reference loads on smooth pavement. The dynamic loads at three different IRI values of 1 m/km (63 in/mile), 2 m/km (126 in/mile) and 3 m/km (190 in/mile) were compared with the static loads on smooth pavement surface. The spikes in the distribution of axle loads were flatten after transformation because of the greater deviation of dynamic loads of vehicles. The increase in DLCs led to a reduction in the percentage of lighter loads but increase in the percentage of heavier loads. The heavier axle loads were expected to accelerate pavement deterioration in the M–E pavement design. The distinction of load distribution on tandem and tridem axles were more obvious, especially for the IRI value of 3 m/km.
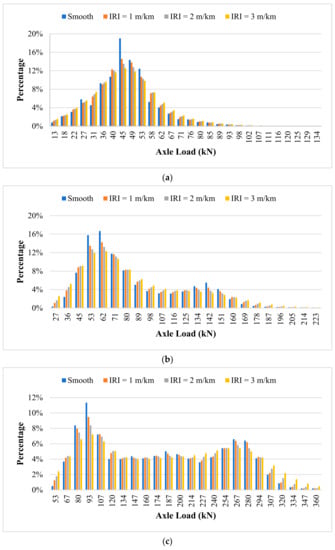
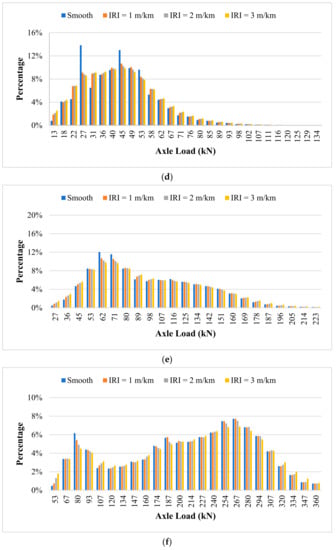
Figure 4.
Static and dynamic axle load spectra: (a) single axle (major); (b) tandem axle (major); (c) tridem axle (major); (d) single axle (minor); (e) tandem axle (minor); and (f) tridem axle (minor).
4. Mechanistic–Empirical Pavement Analysis Considering Dynamic Axle Loads
4.1. Analysis Inputs and Assumptions
Asphalt overlay is commonly used for rehabilitating asphalt pavements with or without milling part of original surface layer. In this study, two AC overlays with different thicknesses of existing AC layers (254 mm and 152.4 mm) were designed as representative pavement structures of major and minor highways in M–E pavement design. The thickness of the new AC layers was 50.8 mm. Table 2 shows the inputs of material property, traffic, and climate. Figure 5 presents the dynamic modulus of asphalt mixture in overlay at different temperatures and loading frequencies, which was set as the Level 1 input in MEPDG. The material properties of mixture in AC overlay were obtained from producer at construction, while the default material properties of mixture were designated for the existing AC layer. For both pavement structures, a 254-mm base layer and a 254-mm subbase layer were laid on the subgrade, and the typical material properties in NJ were designated for the base layer, subbase layer, and subgrade.
Table 2.
Pavement structure and material inputs for Pavement ME.
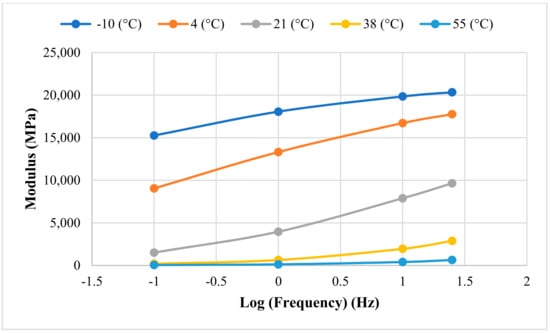
Figure 5.
Dynamic modulus of asphalt mixture for overlay.
The dynamic axle load spectra were modified using Equation (2) based on the estimated DLC by Equation (1) and static axle load spectra from WIM data in LTPP database. Vehicle class distribution and axles per trucks were updated according to the modified axle load spectra. The default monthly adjustment factor was used. The two-way annual average daily traffic (AADT) of minor and major highways was 1575 and 2202, respectively. The operational speeds of minor and major highways were 80 km/h (50 mph) and 104 km/h (65 mph), respectively. Environmental data were required to perform an analysis in the MEPDG. Climate data at the station US NJ-144169 (latitude: 40.05; longitude: −74.4) in Jackson Township, NJ, were applied for pavement structures on major and minor highways using M–E pavement design. The default parameters in transfer functions were applied for M–E analysis to quantify the impact of dynamic loads on pavement performance.
4.2. Impact of Dynamic Loads on Pavement Performance
In general, the new asphalt overlay shows similar cracking pattern, which matches the fatigue cracking in the existing asphalt layer after opening to traffic. The cracking propagation from the existing AC layer into and through the new AC overlay is known as reflective cracking. The occurrence of reflective cracking tends to cause water infiltration, rapid deterioration of the underlying pavement structure, and reduction in pavement service life. Reflective cracking is the result of strain concentration in the AC overlay due to the movement induced by shearing or bending action from traffic loading and daily/seasonal temperature changes in the existing asphalt pavement at the vicinity of cracks. Thus, reflective cracking is one of the failure criteria for asphalt overlay. Regarding AC overlay rutting, it is well accepted that rutting or permanent deformation is the combined result of densification due to the volume change of asphalt mixture, and repetitive shear deformation is the result of plastic flow without volume change. Rut depth in the AC layer is another failure criterion for AC overlay design. Rutting depth is impacted by many factors, such as binder content, binder type, mix type, temperature, load level, and initial density after compaction [29].
In M–E pavement design, reliability is a combined indicator of probability that each performance measure will be less than a specific level over the analysis period [1]. The reliability level of 90% was considered in the analysis. In the M–E analysis, initial IRI values were assumed to be 1 m/km (63 inch/mile) for both types of highway, and the terminal IRI values at the 20th year of service period were found to be 2.25 m/km (142 inch/mile) and 2.32 m/km (146 inch/mile) for major and minor highways, respectively. When the initial IRI was 2 m/km (126 inch/mile), the terminal IRI values at the 20th year of service period were 3.97 m/km (250 inch/mile) and 4.03 m/km (254 inch/mile) for major and minor highways, respectively. Besides, the initial IRI was found to have no influence on the propagation of pavement distress, except for terminal IRI value. Therefore, the IRI values of 1 m/km, 2 m/km, and 3 m/km, which included a reasonable range of IRI values during pavement service period, were applied to derive the dynamic axle load spectra and evaluate the effect of dynamic loads on pavement distresses. M–E outputs indicated that dynamic loads increased IRI, rut depth (total and AC only), and fatigue cracking (reflective) during the pavement service period. The effect of dynamic loads on reflective fatigue cracking was relatively more significant.
Figure 6 illustrates the comparison of reflective fatigue cracking and rut depth under the static and dynamic loads in pavement structures on major highway. Reflective fatigue cracking of AC overlay pavement sections includes reflective cracking and bottom-up cracking in AC layer. The AC overlay shows a similar cracking pattern which matches existing cracking. Reflective fatigue cracking increased rapidly after a 2-year service period, and approached a specific value after a 10-year analysis period. The rut depth in the AC layer accumulated slowly over time. It indicated that the impact of dynamic loads on reflective cracking varied during the cracking propagation. The influence became more significant from the 3rd to 7th year, while a slight influence was observed at the end of the cracking propagation. The impact of dynamic loads on rut depth was found to slightly increase with the accumulation of rut depth with pavement age, but the overall impact was not significant.
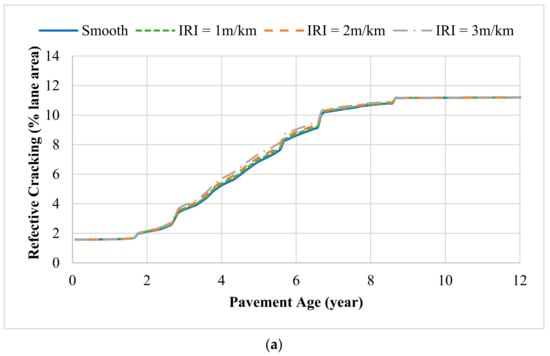
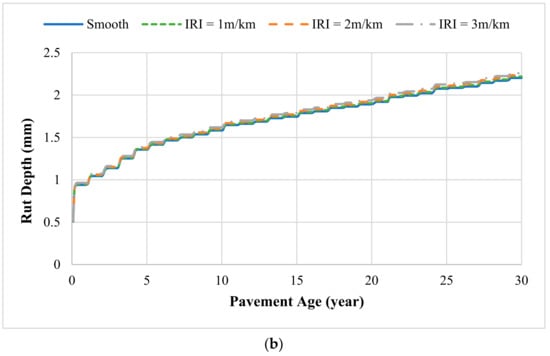
Figure 6.
(a) Fatigue cracking (reflective); and (b) rut depth under the static and dynamic loads on pavement structure on major highway (10% existing cracking).
Figure 7 illustrates the reflective fatigue cracking and rut depth in pavement structure on minor highway under static and dynamic loads. Reflective fatigue cracking propagated rapidly after a 2.5-year service period and approached constant value after a 15-year analysis period. Compared to the trend of reflective fatigue cracking, the impact of dynamic loads on rut depth was relatively small. The impact of dynamic loads on reflective cracking and rut depth varied depending on pavement age, and the influence was not so significant as compared to the influence on major highways. To quantify the susceptibility of pavement distress to dynamic loads, the increasing ratio due to dynamic loads was defined by Equation (3).
where, is the increasing/decreasing ratio due to dynamic loads; is pavement distress estimated using static axle load spectra; and is pavement distress estimated using dynamic axle load spectra.
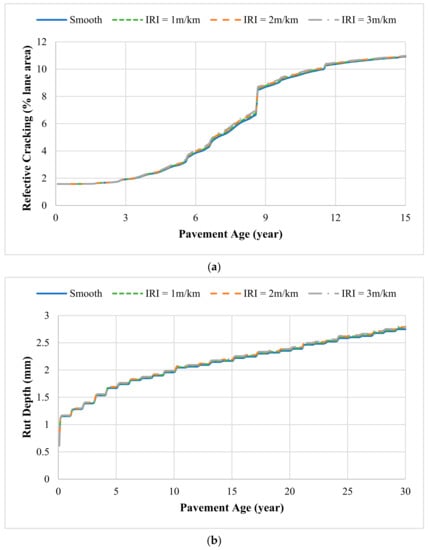
Figure 7.
(a) Fatigue cracking (reflective); and (b) rut depth under the static and dynamic loads on pavement structure on minor highway (10% existing cracking).
Fatigue cracking in the existing AC layer was a potential influential factor for cracking propagation. The cracking percentage in existing layers were set as 5%, 10%, and 15%, which covered a full-scale range observed in field inspection. Table 3 shows the increasing ratio of reflective fatigue cracking, considering different levels of existing fatigue cracking in the AC layer. As expected, the reflective cracking percentage increased with pavement roughness levels increased. Existing cracking raised the increasing ratio of reflective fatigue cracking. The ratio of reflective fatigue cracking increased, then decreased over time. For major highways with an existing fatigue cracking of 10%, the dynamic axle loads increased reflective fatigue cracking by 2.1% after a 3-year service period when the IRI of pavement profile was 1 m/km. The reflective fatigue cracking increased by 4.5% if the IRI was 2 m/km, and the reflective fatigue cracking increased by 8.2% when the IRI was 3 m/km.
Table 3.
Effect of existing cracking on increasing ratio of reflective fatigue cracking due to dynamic loads.
For minor highways with an existing fatigue cracking of 10%, the increasing ratios of reflective fatigue cracking were 2%, 3.6% and 5.4% after a 7-year service period for the IRI values of 1 m/km, 2 m/km and 3 m/km, respectively. Therefore, the influence of dynamic axle loads on the pavement structure of major highways was more significant than that of minor highways. The impact of dynamic loads on reflective fatigue cracking was distinguished at an early stage of service period, and eliminated after a 10-year analysis period when the propagation of reflective cracking reached a specific level. The impact of dynamic loads became much less significant after the pavement was fully deteriorated, which was primarily determined by the existing cracking of the overlay design. The selection of distress threshold and analysis period would dominate the increasing ratio.
4.3. Impact of Overweight Traffic on Pavement Performance under Dynamic Loads
Previous studies have proved that overweight trucks accelerate pavement deterioration and shorten pavement service life, using the M–E pavement design method [30,31]. Rys, Judycki, and Jaskula [32] quantified the fatigue life reduction of asphalt pavement caused by combined traffic on the basis of the axle load distribution and percentage of overweight vehicles. They found that an increase in percentage of overweight vehicles from 0% to 20% could induce as much as 50% reduction in the fatigue life of asphalt pavement. Titi, Coley, and Latifi [33] investigated the influence of overweight truck traffic on the pavement performance of four flexible pavement structures in Wisconsin using the M–E pavement design method and field investigation. It was suggested that the proportion of pavement damage induced by overweight trucks increased most of the pavement distresses by 0.5% to 4%. Few studies have investigated the overweight impact on pavement distresses considering dynamic loads due to rough surface conditions. In this study, the impact of overweight traffic on reflective fatigue cracking of AC overlay on asphalt pavement would be investigated using the dynamic axle load spectra in M–E pavement design.
The New Jersey Department of Transportation defined 356 kN (80 kips) as the legal limit of gross vehicle weight (note 1 kip (1000 pound force) equals to 4.45 kN). The legal weights of single axle on non-Interstate and Interstate highways are 100 kN (22.4 kips) and 89 kN (20 kips), respectively. The legal weight of tandem axle is 151 kN (34 kips) [34]. WIM data were categorized into two traffic groups. The first group included trucks within the legal weight limit and overweight trucks (total traffic), while the second group only included trucks within the legal weight limit (non-overweight traffic). The considered legal weight limits on single, tandem, tridem, and quad axles were 89 kN (20 kips), 151 kN (34 kips), 187 kN (42 kips), and 240 kN (54 kips), respectively. Figure 8 presents the static and dynamic axle load spectra of non-overweight traffic on major and minor highways. The overweight weight percentages were 5.4%, 5.8%, 6.2%, and 6.5% corresponding to the scenarios of static load on smooth pavement surface and dynamic load on rough pavement surface with IRI values of 1 m/km, 2 m/km, and 3 m/km. For minor highways, the overweight percentages were 3.5%, 3.6%, 3.7%, and 3.9% when static load and dynamic loads were induced on the rough pavement surfaces with IRI values of 1 m/km, 2 m/km, and 3 m/km.
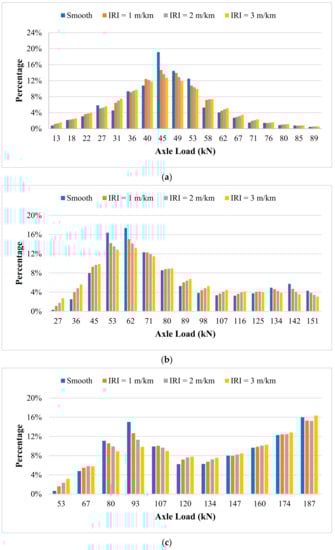
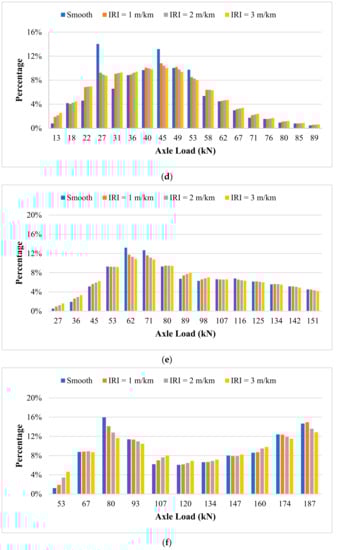
Figure 8.
Static and dynamic axle load spectra of non-overweight traffic: (a) single axle (major); (b) tandem axle (major); (c) tridem axle (major); (d) single axle (minor); (e) tandem axle (minor); and (f) tridem axle (minor).
Figure 9a illustrates reflective fatigue cracking in pavement structures on major highways under static and dynamic loads of total and non-overweight traffic. Slower propagation of reflective fatigue cracking was observed when dynamic loads were considered because of the exclusion of heavier axle loads in a non-overweight traffic scenario. The exclusion of dynamic overweight axle loads decreased reflective fatigue cracking when dynamic loads were considered. However, the terminal percentages of reflective cracking under total and non-overweight traffic were identical due to the dominant role of existing cracking in cracking development in pavement overlay design. Figure 9b presents reflective fatigue cracking in pavement structures on minor highway under static and dynamic loads of total and non-overweight traffic. Taking into account the fact that dynamic axle load spectra accelerated pavement distress under total traffic and decelerated pavement distress under non-overweight traffic, the impact of overweight traffic on pavement distress would be significant when dynamic loads are considered. It suggested that the negative influence of overweight traffic on pavement distresses was underestimated if static axle load spectra were applied in M–E design.
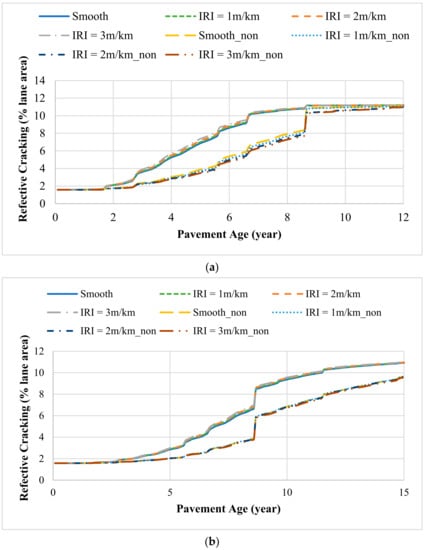
Figure 9.
Fatigue cracking (reflective) of (a) major highway and (b) minor highway under total and non-overweight traffic (10% existing cracking).
Design reliability is supposed to be selected in balance with performance criteria. The recommended reflective fatigue cracking (alligator cracking) of AC overlay on Interstate and primary highways are 10% and 20%, respectively. The recommended rut depth on Interstate and primary highways are 10.16 mm (0.4 inch) and 12.7 mm (0.5 inch), respectively. The recommended reliability level of principal arterials is 90% [35]. The considered criteria of fatigue cracking were 10% and 5% due to the limit of cracking propagation, as shown in Figure 6a and Figure 7a. To quantify the effect of overweight traffic loading on pavement distress, the reduction ratio of pavement service life was defined by Equation (4).
where, is the reduction ratio of pavement service life; LT is the service period when a given level of pavement distress occurs under total traffic; and LN is the service period when a given level of pavement distress occurs under non-overweight traffic.
Since the terminal rut depth at the end of design life was much smaller than the recommended values as shown in Figure 6b and Figure 7b, the pavement service life determined by rut depth and corresponding reduction ratio due to dynamic loads were not considered in this study. Figure 10 shows the impact of overweight traffic on the reduction ratio of pavement life, considering different percentage of existing fatigue cracking in the AC layers. The considered threshold of reflective fatigue cracking was 5%. The analysis results indicated that the dynamic axle load spectra increased the impact of overweight traffic on reflective fatigue cracking, and the pavement structure on major highway tended to be more sensitive to overweight traffic loading. One of the reasons would be greater DLC values corresponding to the higher operational speed on major highways. Pavement service life was found to reduce as existing fatigue cracking increased, and the reduction ratio of pavement service life increased as existing fatigue cracking increased. The effect of existing cracking had a more significant impact on the pavement structure of major highways. The service life of the pavement structure with 15% existing fatigue cracking was reduced by an additional 12%, which increased the reduction ratio of pavement life up to 46%.
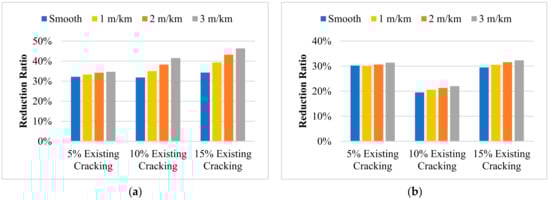
Figure 10.
Impact of overweigh traffic on reduction ratio of pavement life, considering different percentages of existing fatigue cracking: (a) major highway; and (b) minor highway.
4.4. Discussion of Findings
M–E outputs indicated that dynamic loads increased IRI, rut depth, and reflective fatigue cracking during pavement service period, as expected. The effect of dynamic loads on reflective fatigue cracking was relatively more significant as compared to the effect on rut depth. The impact of dynamic loads on reflective fatigue cracking was distinguished at an early stage of the service period, and eliminated after a 10-year analysis period when the propagation of reflective cracking reached a specific level dominated by the existing cracking in AC layer. The impact of dynamic loads on fatigue cracking was not so significant as that found in recent work [13] because of lower vehicle speed and higher level of terminal fatigue cracking. The impact of dynamic loads on rut depth was limited due to the pavement structure type.
The analysis results indicated that the dynamic axle load spectra enhanced the impact of overweight traffic on reflective fatigue cracking, and the pavement structures on major highways would be more sensitive to overweight traffic loading due to greater excitation of DLCs at higher operational speeds. Pavement service life was found to decrease with an increase in percentage of existing fatigue cracking, and the reduction ratio of pavement service life increased with an increase in existing fatigue cracking percentage. The effect of existing cracking had a more significant impact on the pavement structure of major highways.
5. Conclusions
This study quantified the impact of dynamic traffic on pavement distress of AC overlay on asphalt pavement using the M–E pavement design method. Dynamic tire forces were calculated for single, tandem, and tridem axles, considering various IRI values of pavement profiles and axle loads. The calculated DLCs of dynamic tire forces increased as IRI values increased but decreased when axle loads increased. The nonlinear regression models of DLC with respect to IRI and axle loads were derived to predict the DLC values given any axle load interval designated by MEPDG. The dynamic loads excited by rough pavement surface condition were considered by transforming the static axle load spectra to dynamic axle load spectra. After the modification, the spikes in the distribution of axle loads were flattened because of the greater deviation of dynamic loads. The increase in DLCs led to a decrease in the percentage of lighter loads but increase in the percentage of heavier loads.
The impact of dynamic loads on reflective fatigue cracking was distinguished at an early stage of the service period and eliminated after a 10-year analysis period, when the propagation of reflective cracking reached a specific level dominated by the existing cracking in the AC layer. The dynamic axle load spectra enhanced the impact of overweight traffic on reflective fatigue cracking, and the pavement structures on major highways tend to be more sensitive to overweight traffic loading because of greater excitation of DLCs at higher operational speeds on major highways.
A methodology was proposed to quantify the dynamic axle load spectra on the performance of an AC overlay on a flexible pavement, considering the pavement’s longitudinal unevenness, and typical pavement structures of a major route and a minor route were illustrated in the case study. The proposed method could be extensively applied to other flexible pavement structures in the MEPDG. In future study, the results of this analysis need to be verified based on field pavement performance subjected to dynamic loads and static loads that might be difficult to capture in a field survey now.
Author Contributions
Conceptualization, H.W.; methodology, H.W. and J.C.; formal analysis, J.Z.; writing—original draft preparation, J.Z.; writing—review and editing, H.W. and P.L.; supervision, H.W.; funding acquisition, P.L. All authors have read and agreed to the published version of the manuscript.
Funding
Mountain-Plains Consortium at North Dakota State University.
Institutional Review Board Statement
Not applicable.
Informed Consent Statement
Not applicable.
Data Availability Statement
All the data reported have been included in the paper.
Acknowledgments
The authors acknowledge the financial support provided by North Dakota State University and the Mountain-Plains Consortium (MPC), a university transportation center funded by the U.S. Department of Transportation.
Conflicts of Interest
The authors declare no conflict of interest.
References
- Jasim, A.; Wang, H.; Bennert, T. Evaluation of Clustered Traffic Inputs for Mechanistic-Empirical Pavement Design: Case Study in New Jersey. Transp. Res. Rec. 2019, 2673, 332–348. [Google Scholar] [CrossRef]
- ASTM E1318-09. Standard Specification for Highway Weigh-In-Motion (WIM) Systems with User Requirements and Test Methods; ASTM International: West Conshohocken, PA, USA, 2009. [Google Scholar]
- Navarrina, F.; Ramírez, L.; París, J.; Nogueira, X.; Colominas, I.; Casteleiro, M.; Fernández-de-Mesa, J.R. Comprehensive model for fatigue analysis of flexible pavements considering effects of dynamic axle loads. Transp. Res. Rec. 2015, 2524, 110–118. [Google Scholar] [CrossRef]
- Bilodeau, J.P.; Gagnon, L.; Doré, G. Assessment of the relationship between the international roughness index and dynamic loading of heavy vehicles. Int. J. Pavement Eng. 2017, 18, 693–701. [Google Scholar] [CrossRef]
- Gillespie, T.D. Effects of Heavy-Vehicle Characteristics on Pavement Response and Performance; Transportation Research Board of the National Academies: Washington, DC, USA, 1992. [Google Scholar]
- Hu, W.; Zhao, Q.; Liu, Y.; Li, Z.; Kong, X. Damage Evaluation of the Paving around Manholes under Vehicle Dynamic Load. Adv. Mater. Sci. Eng. 2020, 2020, 6510439. [Google Scholar] [CrossRef]
- Elisher, M.; Trevorrow, N.; Callaway, L.; Blanksby, C. Measurement and Analysis of Dynamic Wheel Loads; Austroads: Sydney, Australia, 2012. [Google Scholar]
- Misaghi, S.; Nazarian, S.; Carrasco, C.J. Impact of Truck Suspension and Road Roughness on Loads Exerted to Pavements; Report FHWA-RD-07-1008-02; The University of Texas at El Paso: El Paso, TX, USA, 2010. [Google Scholar]
- Hassan, R.; McManus, K. Estimating dynamic loading of pavements from surface profile properties. Road Transp. Res. 2001, 10, 3. [Google Scholar]
- Misaghi, S.; Tirado, C.; Nazarian, S.; Carrasco, C.J. Impact of pavement roughness and suspension systems on vehicle dynamic loads on flexible pavements. Transp. Eng. 2021, 3, 100045. [Google Scholar] [CrossRef]
- Gillespie, T.D. Everything You Always Wanted to Know about the IRI, But Were Afraid to Ask! In Proceedings of the Road Profile Users Group Meeting, Lincoln, NE, USA, 22–24 September 1992; Available online: http://citeseerx.ist.psu.edu/viewdoc/summary?doi=10.1.1.21.9365 (accessed on 6 February 2022).
- Sayers, M.W.; Gillespie, T.D.; Queiroz, C.A.V. The international road roughness experiment: A basis for establishing a standard scale for road roughness measurements. Transp. Res. Rec. 1986, 1084, 76–85. [Google Scholar]
- Rys, D. Consideration of dynamic loads in the determination of axle load spectra for pavement design. Road Mater. Pavement Des. 2019, 22, 1309–1328. [Google Scholar] [CrossRef]
- Múčka, P. Road roughness limit values based on measured vehicle vibration. J. Infrastruct. Syst. 2017, 23, 04016029. [Google Scholar] [CrossRef]
- Zhao, J.; Wang, H. Mechanistic-empirical analysis of asphalt pavement fatigue cracking under vehicular dynamic loads. Constr. Build. Mater. 2021, 284, 122877. [Google Scholar] [CrossRef]
- Rys, D.; Burnos, P. Study on the accuracy of axle load spectra used for pavement design. Int. J. Pavement Eng. 2021. [Google Scholar] [CrossRef]
- Sun, L. Simulation of pavement roughness and IRI based on power spectral density. Math. Comput. Simul. 2003, 61, 77–88. [Google Scholar] [CrossRef]
- Sun, L. Developing spectrum-based models for international roughness index and present serviceability index. J. Transp. Eng. 2001, 127, 463–470. [Google Scholar] [CrossRef]
- Goenaga, B.; Fuentes, L.; Mora, O. A practical approach to incorporate roughness-induced dynamic loads in pavement design and performance prediction. Arab. J. Sci. Eng. 2019, 44, 4339–4348. [Google Scholar] [CrossRef]
- Ueckermann, A.; Oeser, M. Approaches for a 3D assessment of pavement evenness data based on 3D vehicle models. J. Traffic Transp. Eng. (Engl. Ed.) 2015, 2, 68–80. [Google Scholar] [CrossRef][Green Version]
- Sayers, M.W. Road characterization for the simulation of automotive vehicle dynamics. SAE Int. J. Mater. Manuf. 2011, 4, 251–262. Available online: https://www.jstor.org/stable/26273766 (accessed on 6 February 2022). [CrossRef]
- Zhao, J.; Wang, H. Dynamic pavement response analysis under wide-base tyre considering vehicle-tyre–pavement interaction. Road Mater. Pavement Des. 2021, 1–17. [Google Scholar] [CrossRef]
- Steyn, W.J.; Viljoen, N.; Popescu, L.; Du Plessis, L. Freight-Truck-Pavement Interaction, Logistics, & Economics: Final Phase 1 Report (Tasks 7–8); Report UCPRC-RR-2013-08; University of California, Pavement Research Center: Davis, CA, USA, 2013. [Google Scholar]
- Marques Almeida, A.M.; Santos, L.G.D.P. Methodological Framework for Truck-Factor Estimation Considering Vehicle–Pavement Interaction. J. Transp. Eng. 2015, 141, 04014074. [Google Scholar] [CrossRef]
- Law, E.; Janajreh, I.; Frey, N. Vehicle ride response to new widebase tires and conventional dual tires. In Proceedings of the International Truck and Bus Meeting and Exhibition, Chicago, IL, USA, 12–14 November 2001; SAE International: Detroit, MI, USA, 2002. [Google Scholar]
- Texas DOT. Traffic Recorder Instruction Manual Notice 2012-1: Vehicle Classification Using FHWA 13-Category Scheme, Appendix A. 2013. Available online: http://onlinemanuals.txdot.gov/txdotmanuals/tri/vehicle_classification_using_fhwa_13category_scheme.htm (accessed on 6 February 2022).
- Elkins, G.E.; Thompson, T.; Ostrom, B.; Simpson, A.; Visintine, B. Long-Term Pavement Performance Information Management System User Guide; Report FHWA-RD-03-088; Federal Highway Administration: McLean, VA, USA, 2016. Available online: https://infopave.fhwa.dot.gov/InfoPave_Repository/files/LTPP_IMS_USER_GUIDE_2018_FINAL.pdf (accessed on 6 February 2022).
- Wang, H.; Wang, Z.; Blight, R.J.; Sheehy, E.C. Derivation of pay adjustment for in-place air void of asphalt pavement from life-cycle cost analysis. Road Mater. Pavement Des. 2015, 16, 505–517. [Google Scholar] [CrossRef]
- Zhou, F.; Hu, S.; Hu, X.; Scullion, T. Mechanistic-Empirical Asphalt Overlay Thickness Design and Analysis System; Report FHWA/TX-09/0-5123-3; Texas Transportation Institute: College Station, TX, USA, 2009. [Google Scholar]
- Wang, H.; Zhao, J.; Wang, Z. Impact of overweight traffic on pavement life using weigh-in-motion data and mechanistic-empirical pavement analysis. In Proceedings of the 9th International Conference on Managing Pavement Assets, Washington, DC, USA, 18–21 May 2015; Available online: http://hdl.handle.net/10919/56450 (accessed on 6 February 2022).
- Wang, H.; Zhao, J. Development of overweight permit fee using mechanistic-empirical pavement design and life-cycle cost analysis. Transport 2016, 31, 156–166. [Google Scholar] [CrossRef]
- Rys, D.; Judycki, J.; Jaskula, P. Analysis of effect of overloaded vehicles on fatigue life of flexible pavements based on weigh in motion (WIM) data. Int. J. Pavement Eng. 2016, 17, 716–726. [Google Scholar] [CrossRef]
- Titi, H.H.; Coley, N.J.; Latifi, V. Evaluation of pavement performance due to overload single-trip permit truck traffic in Wisconsin. Adv. Civ. Eng. 2018, 2018, 1070653. [Google Scholar] [CrossRef]
- Federal Highway Administration. Report to Congress on Compilation of Existing State Truck Size and Weight Limit Laws. 2015. Available online: https://ops.fhwa.dot.gov/freight/policy/rpt_congress/truck_sw_laws/app_a.htm#nj (accessed on 6 February 2022).
- American Association of State Highway and Transportation Officials (AASHTO). Mechanistic-Empirical Pavement Design Guide: A Manual of Practice; MEPDG-1; AASHTO Designation: Washington, DC, USA, 2008. [Google Scholar]
Publisher’s Note: MDPI stays neutral with regard to jurisdictional claims in published maps and institutional affiliations. |
© 2022 by the authors. Licensee MDPI, Basel, Switzerland. This article is an open access article distributed under the terms and conditions of the Creative Commons Attribution (CC BY) license (https://creativecommons.org/licenses/by/4.0/).