Article

Optical Studies in Red/NIR Persistent Luminescent Cr-Doped Zinc Gallogermanate (ZGGO:Cr)

1
i3N, Department of Physics, University of Aveiro, 3810-193 Aveiro, Portugal
2
CICECO-Aveiro Institute of Materials, Department of Materials and Ceramic Engineering, University of Aveiro, 3810-193 Aveiro, Portugal
3
i3N/CENIMAT, Department of Materials Science, NOVA School of Science and Technology, Campus de Caparica, 2829-516 Caparica, Portugal
*
Authors to whom correspondence should be addressed.
Appl. Sci. 2022, 12(4), 2104; https://doi.org/10.3390/app12042104
Submission received: 5 January 2022 / Revised: 28 January 2022 / Accepted: 9 February 2022 / Published: 17 February 2022
(This article belongs to the Special Issue Women in Materials Science)

Abstract

:
Zn1+xGa2−2xGexO4 (ZGGO:Cr)-persistent phosphor, with a molar fraction, x, of x = 0.1, doped with a 0.5% molar of chromium, was synthesised via solid-state reaction at 1350 °C for 36 h. X-ray diffraction measurements and Raman spectroscopy evidence a single crystalline phase corresponding to the cubic spinel structure. Room temperature (RT) photoluminescence (PL) and afterglow decay profiles were investigated using above and below bandgap excitation. In both cases, persistent PL was observed for almost 8 h, mainly originating from a Cr3+ defect, the so-called N2 optical centre. RT PL excitation and diffuse reflectance allow identification of the best pathways of Cr3+ red/NIR emission, as well as estimation of the ZGGO bandgap energy at 4.82 eV. An in-depth investigation of the observed luminescence at 15 K and temperature-dependent PL under site-selective excitation reveals the spectral complexity of the presence of several optically active Cr3+ centres in the ZGGO host that emit in almost the same spectral region. Furthermore, the temperature dependence of the R-lines’ intensity indicates the existence of thermal populating processes between the different optical centres. Such observations well account for a wide distribution of defect trap levels available for carrier capture/release, as measured by the persistent luminescence decay, from which the carriers are released preferentially to the N2 Cr3+-related optical centre.

1. Introduction

Persistent luminescent phosphors have attracted extensive research interest due to the feasibility of their use on glow-in-the-dark applications such as anti-counterfeiting, optical information storage, night vision surveillance, photocatalysis, and optical bioimaging [1,2,3,4,5,6,7]. Since the first work of Bessière et al. [8], it is well known that Cr-doped ZnGa2O4 (ZGO:Cr) [8,9,10,11] and ZGGO:Cr [12,13,14] spinel structures give rise to Cr3+ red/near-infrared (NIR) long-lasting afterglow phosphors, with a luminescence signal that can remain up to several hours after ceasing the excitation source [7,8,9,10,11,12,13,14].
In the ZGGO with lower molar fractions, 0 < x < 0.5 , the Ge ions typically replace Ga sites in the lattice (see Figure 1) but only the single ZGO crystalline phase is expected to be present [13,14], with a cubic lattice constant of ca. 8.33 (from JCPDS data file card 38-1240). Indeed, in this case, these compounds exhibit a normal AB2O4 cubic spinel belonging to the O h 7 F d 3 ¯ m space group symmetry, with eight formula units in the unit cell [9,10]. Zn2+ ions are surrounded by a tetrahedral environment of oxygen ions, or A-sites, being placed in T d point group sites and Ga3+ ions in a six-fold distorted octahedral coordination D 3 d , or B-sites [9,10]. On the other hand, for x 0.5 , the hexagonal Zn2GeO4 phase also starts to be present and the two phases co-exist [13,14].
ZGO and ZGGO are ultra-wide bandgap semiconductors, with RT bandgap energies estimated to be around 5.0 eV [15,16,17]. These materials are suitable host lattices for the incorporation of several dopants’ energy levels, as is the case of the ones resulting from the incorporation of trivalent chromium ions. Typically, Cr3+ will replace Ga3+ sites exhibiting a preference to occupy the distorted octahedral ones [10,18]. In particular, it should be emphasised that the Cr3+ ionic radius of 0.62 matches well to the one of the Ga3+ in octahedral sites (0.62 ) [19]. With a 3d3 electronic configuration, the 4F Cr3+ ground level of the free ion is known to split into the A 4 2 t 2 3 , T 4 2 t 2 2 e , and T 4 1 t 2 2 e electronic states when in an octahedral crystal field [10,18]. The levels of the ion in the cubic field are further split by the interplay of the trigonal field strength and the spin–orbit interaction [10,18]. According to Tanabe and Sugano diagrams [20,21], under intermediate and high crystalline field strengths, the lowest excited level corresponds to the E 2 t 2 3 electronic state originated from the splitting of the G 2 free ion level. Therefore, and as a result of the electron–phonon coupling of the different states, Cr3+ in octahedral sites exhibits broad spin allowed A 4 2 F 4 T 4 2 , T 4 1 F 4 absorption bands, as well as narrow zero-phonon lines (ZPL), the so-called R-lines, due to the parity and spin-forbidden A 4 2 F 4 E 2 G 2 transition [18,22].
Besides the intraionic R-lines emission of isolated Cr3+ that occurs nearby 688 nm (~1.8 eV), complex defects involving Cr3+ and neighbouring defects (e.g., Cr3+ pairs and Cr-intrinsic defects complexes) are known to emit in the same red/NIR spectral region, resulting in the so-called N-lines [7,8,9,10,11,12,13,14]. According to van Gorkom et al. [22], the most prominent N-lines are placed at 688.9 nm/1.80 eV, 693.5 nm/1.79 eV, 700.3 nm/1.77 eV, and 704 nm/1.76 eV, corresponding to the N1-, N2-, N3-, and N4-lines, respectively. The assignment of the defects that give rise to these N-lines has been a matter of discussion in literature [10,22,23,24,25]. For the case of the N1 defect, three likely signatures have been proposed: (i) a Cr3+–VZn pair, (ii) a Cr3+–Zni pair (where VZn and Zni stand for zinc vacancy and zinc interstitial, respectively), or (iii) a Cr3+ nearby an antisite defect [10,22,24,25]. By using electron paramagnetic resonance (EPR) measurements, Gourier et al. [10] proved that the N2 line is due to the recombination of a specific type of Cr complex, involving a Cr3+ ion with antisite cationic defects (Zn at the Ga site, Zn Ga , and Ga at the Zn site, Ga Zn o ) as the first cationic neighbour [10,25]. Such a model was also corroborated by extended X-ray absorption fine structure (EXAFS) measurements [25], indicating that the antisite defects have a pronounced influence on the observation of the persistent luminescence, which is commonly related to the N2 optical centre [10,11,25]. Ab initio atomic-scale simulations performed with density functional theory (DFT) on ZGO:Cr also suggest that an antisite defect pair is formed on the first coordination shells of the Cr3+ ions [26]. The N3-line has been assigned to Cr3+–Cr3+ pairs [22].
In the field of in vivo bioimaging, the red/NIR persistent luminescence within the tissue transparency window (650–1350 nm) [27] is of particular relevance as the light attenuation is largely due to scattering (rather than absorption), penetrating deeply into the tissues [27]. Simultaneously, red/NIR persistent luminescence allows optical imaging in the absence of tissue irradiation, avoiding autofluorescence of the tissues and consequently improving the sensing sensitivity of the measurements with a superior signal-to-noise ratio, at the same time avoiding tissue damage by direct irradiation [27]. Persistent luminescence relies on the capture and release of charge carriers by the defect traps. Besides the defect trap levels, optically active centres are necessary to release light at the wavelength of interest [9,10,11,12,13,14,25,26,28,29]. While the latter are essentially related to the intraionic emission of dopants/impurities intentionally incorporated into a given host (e.g., transition metal ions and/or lanthanides), the former are usually correlated with the presence of intrinsic lattice defects [28,29]. These traps can store the excitation energy and slowly release it to the emitters. The capture of the carriers by the traps cannot promptly recombine from the trap levels and, usually, thermal energy is required to release the carriers to the emitting centre. In the case of very shallow electron traps, these can be very fastly depopulated at RT via the material’s conduction band, while deep traps require higher temperatures. Additionally, detraping can also occur via tunnelling when the trap levels are almost resonantly in energy with those of the emitting optical centre(s) [28,29]
Red/NIR-emitting Cr3+ optically active defects can be successfully achieved by in situ doping of ZGGO during the synthesis procedure by solid-state reaction. Though there are several studies on photoluminescence (PL) spectra at RT of Cr-doped ZGO and ZGGO [8,9,10,11,12,13,14,25,26,28,29], a detailed study of the intraionic emission at low temperatures and its temperature dependence is scarce [9,10,11,18,22]. Hence, in this work, we attempt to contribute to the understanding of the luminescent properties of Cr-doped ZGGO at cryogenic temperatures and their temperature dependence. A description of the samples’ preparation and their structural, morphological, and chemical characterisation using X-ray diffraction (XRD), Raman spectroscopy, scanning electron microscopy (SEM), and energy-dispersive X-ray spectroscopy (EDS) was carried out. PL and PL excitation (PLE) measurements were conducted at RT to identify the mechanisms of radiative recombination, as well as their preferential populating paths. Furthermore, to identify the presence of multiple optical centres and their influence on the red/NIR luminescence thermal quenching, we studied the dependence of the PL with temperatures (15 K to RT) and excitation energy (bandgap excitation and in the excited states of the Cr3+ ion). The experimental data corroborate that the red/NIR-emitting optical centre responsible for the persistent luminescence corresponds to a defect involving Cr ion complexes, namely the ones that give rise to the N2 lines. Compared with the ZGO:Cr, the ZGGO:Cr samples evidence an enhanced persistent luminescence that can be measured for about 8 h after switching off the excitation light.

2. Materials and Methods

2.1. Reagents

Zinc oxide (ZnO, 99.99% trace metal basis) and Germanium (IV) oxide (GeO2, 99.999% trace metal basis) were acquired from Aldrich. Chromium (III) oxide (Cr2O3, 99% metal basis) and Galium (III) oxide (Ga2O3, 99,99% metal basis) were purchased from Alfa Aesar. Absolute anhydrous ethanol was acquired from Carlo Erba.

2.2. Pellets Synthesis

The Zn1+xGa2−2xGexO4:Cr doped with 0.5% molar of chromium, x = 0 and x = 0.1, hereafter designated as ZGO:Cr and ZGGO:Cr, respectively, were synthesised via a conventional solid-state reaction with mixtures of appropriate mole ratios of 1:2:0 and 1.1:1.8:0.1 for Zn:Ga:Ge in the ZGO:Cr and ZGGO:Cr, respectively. In the case of the chromium dopant, a stoichiometric ratio of Zn/(Ga + Cr) = 0.495 (0.5 mol%) was used for both alloys, as mentioned in [11]. The synthesis method was based on the work of Allix et al. [13], in which the synthesis of ZGGO:Cr with x = 0.1 was optimised.
The precursors were mixed in an agate ball mill with ethanol for 8 h. This mixture was dried in the oven for 7 h at 70 °C to evaporate all the ethanol. Afterwards, the powder was mixed and pressed into pellets with a 13 mm diameter. The pellets were then fired at 900 °C for 2 h and then grounded and reshaped into pellets with a 1.5 t uniaxial press. These pellets suffered a sintering treatment at 1350 °C for 36 h in a ThermoLab oven (heating rate of 5 °C min−1). Additionally, a non-intentionally doped pellet with a molar fraction of x = 0.1 was produced and subjected to the same thermal treatments to evaluate the absorption properties of the matrix, for comparison purposes.
For the case of ZGO:Cr, the mixture of the three precursors with ethanol was prepared in a planetary mill for 2 h and then left to dry at RT. The pellets were produced by employing a 13 mm diameter mould with a 1.5 t uniaxial press. The pellets were then sintered at 1300 °C (heating rate of 5 °C min−1) for 6 h [11].

2.3. Characterisation

The structural properties of the synthesised powders were determined by XRD and Raman spectroscopy. The XRD patterns were measured on a Philips X’Pert MPD, employed in a θ-2θ mode with Cu Kα radiation. The Raman spectra were measured by exciting the samples with the 442 nm line of a He-Cd laser (Kimmon IK Series) and the scattered light was analysed using a Horiba Jobin Yvon HR800 spectrometer. The measurements were performed with a 50 × objective in the backscattering mode. Morphological and chemical characterisation was attained by acquiring SEM images using a field-emission-Schottky-gun (FEG-SEM) Hitachi SU-70, operated at 15 kV or 30 kV, and equipped with a Bruker EDS detector.
Diffuse reflectance (DR) of the non-intentionally and intentionally doped pellets was measured in the wavelength range 200–900 nm using a UV/Visible GBC Cintra-303 equipment in the absorbance mode, with a bandwidth of 5 nm, a speed velocity of 100 nm min−1, and a data pitch of approximately 0.520.
The steady-state PL and PLE data were obtained by a Fluorolog®-3 from Horiba Scientific. A continuous Xe lamp of 450 W was used as the excitation source, coupled to an excitation monochromator, Gemini 180, with a diffraction grating of 1200 lines mm−1 and a focal distance of 180 mm, in which it is possible to select excitation wavelengths between 250 and 660 nm. The scanning emission monochromator is an iHR550 with a diffraction grating of 1200 lines mm−1 and a focal distance of 550 mm. The detector used is a R928P PMT, which is sensitive for wavelengths in a range of 200 to 850 nm.
For the temperature-dependent PL data acquisition, a dispersive system SPEX 1074 Czerny–Turner monochromator with a diffraction grating of 1200 lines mm−1 and a focal distance of 1 m was used. This equipment was coupled to a PMT Hamamatsu R928 detector. The excitation source used was a He–Cd laser possessing two different excitation wavelengths, one at 325 and another at 442 nm. Additional excitation lines at 405 nm and 532 nm from solid-state lasers were used. The samples were placed in a cold finger of a closed-cycle He cryostat under vacuum conditions, which allowed the temperature to reach a minimum value of 15 K. The spectra acquired in both systems were corrected to the optics of the system and the detector response.
For the time-resolved PL (TRPL) measurements, the same Fluorolog®-3 system was used, now with the aid of a pulsed Xe lamp (operating at up to 25 Hz) coupled to the same monochromator and with the excitation fixed at 310 nm. The full width at half-maximum (FWHM) of each lamp pulse is 3 µs, so that lamp interference during the acquisition of decay curves is minimised. The measurement conditions were set to a sample window (duration of signal acquisition) of 10 ms and several time delays after flash were employed (from 0.05 to 50 ms).
To study the persistent luminescence, the pellets were irradiated with selected wavelengths for 5 min. with the Xe lamp (450 W, continuous). After that, the irradiation source was turned off and spectra were acquired to evaluate the signal profile of persistent luminescence. To study the evolution of the intensity of the persistent luminescence decay time, the same equipment was used in kinetics mode. For such purposes, the pellets were irradiated for 5 min. with different wavelengths, then the light was turned off and the persistent luminescence intensity was measured during 10 h, with a time increment of 10 s.

3. Results

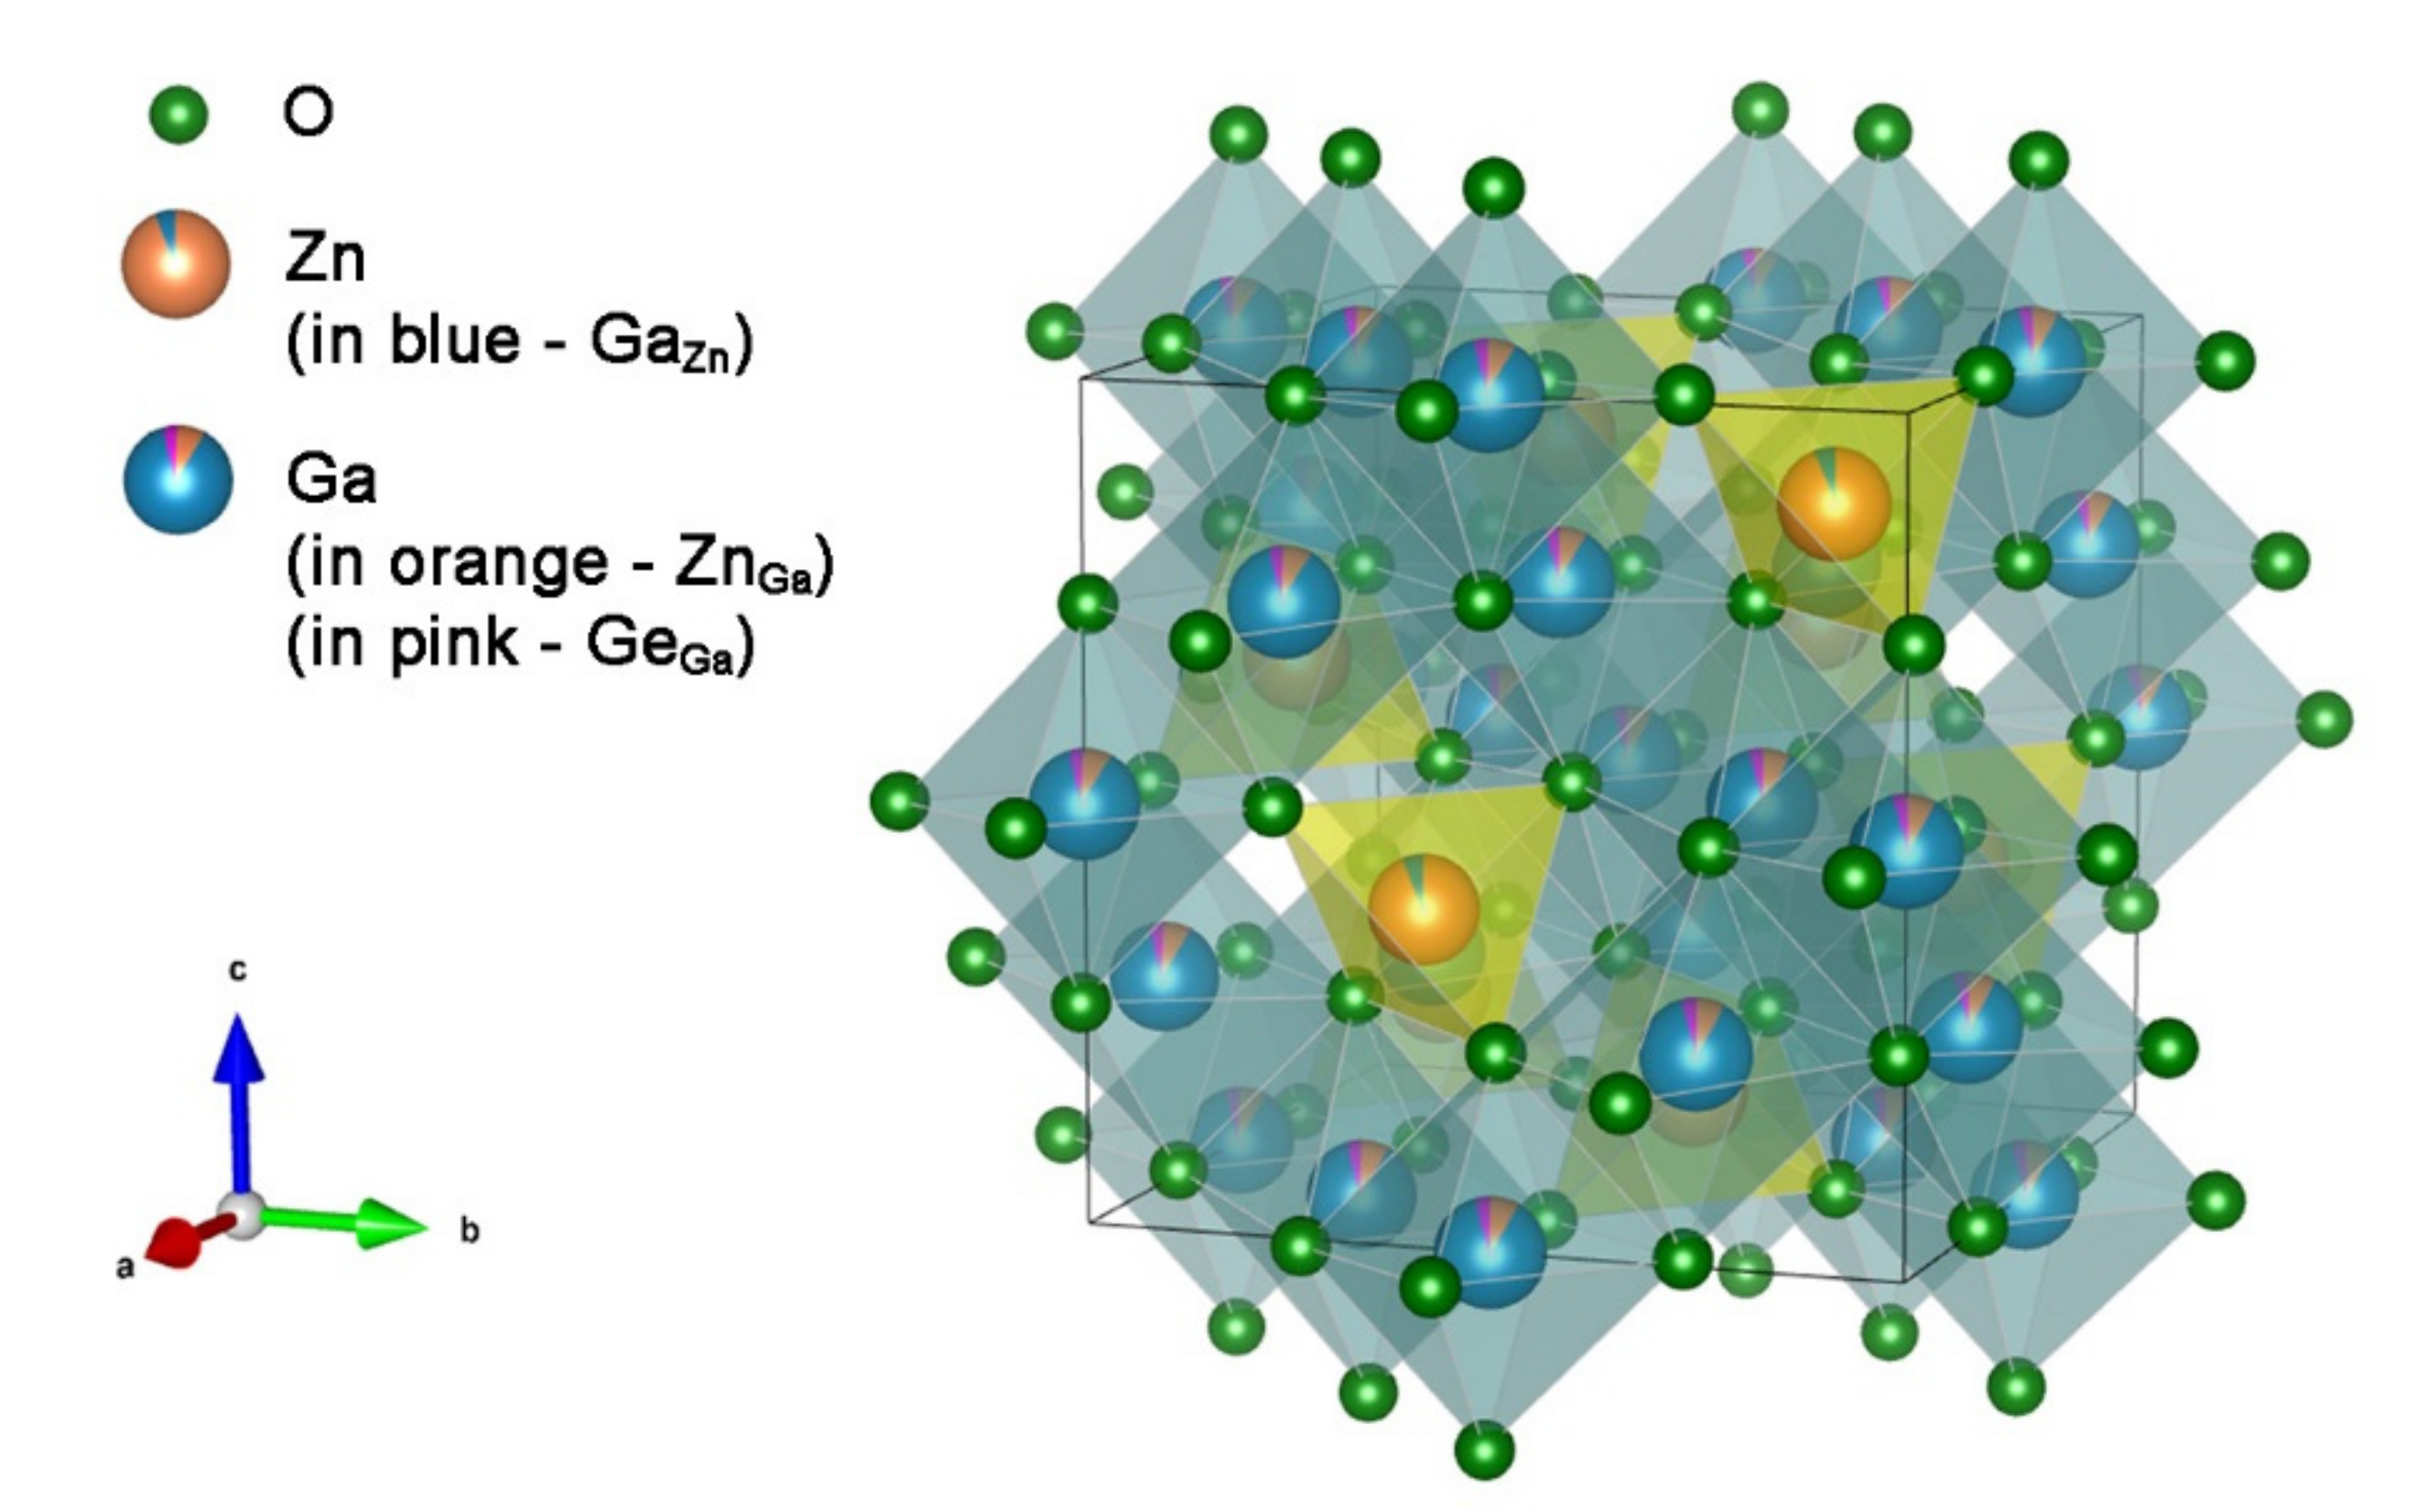
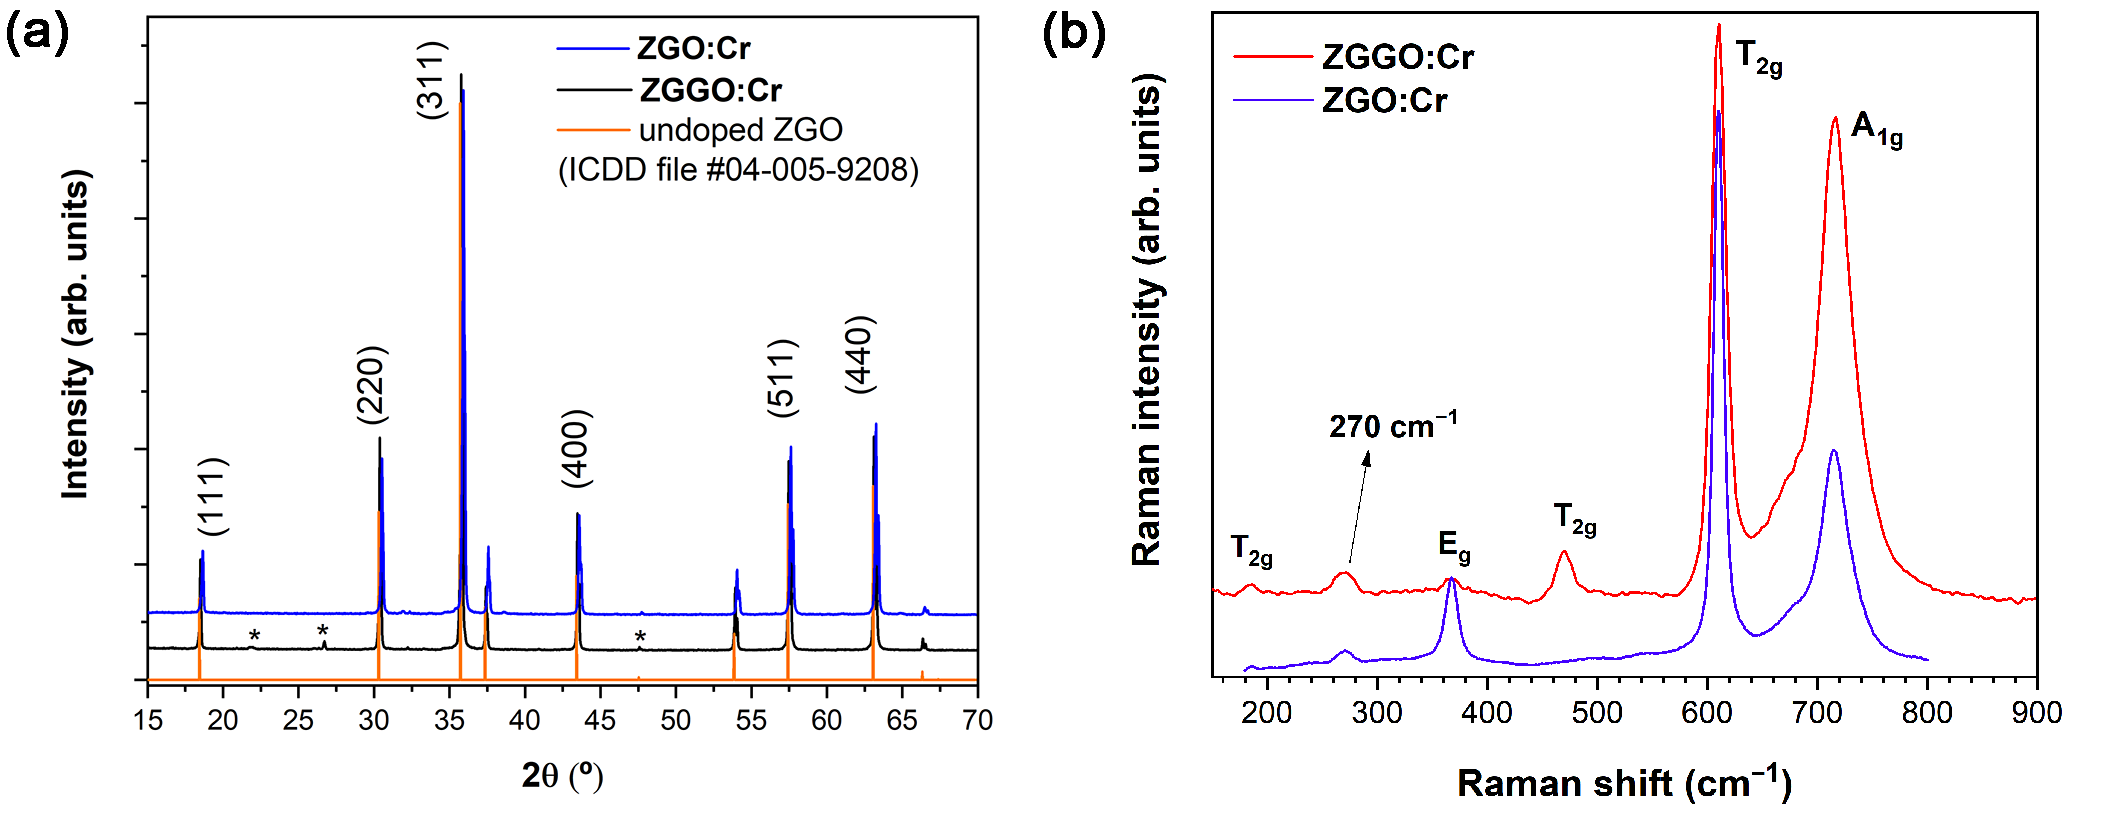
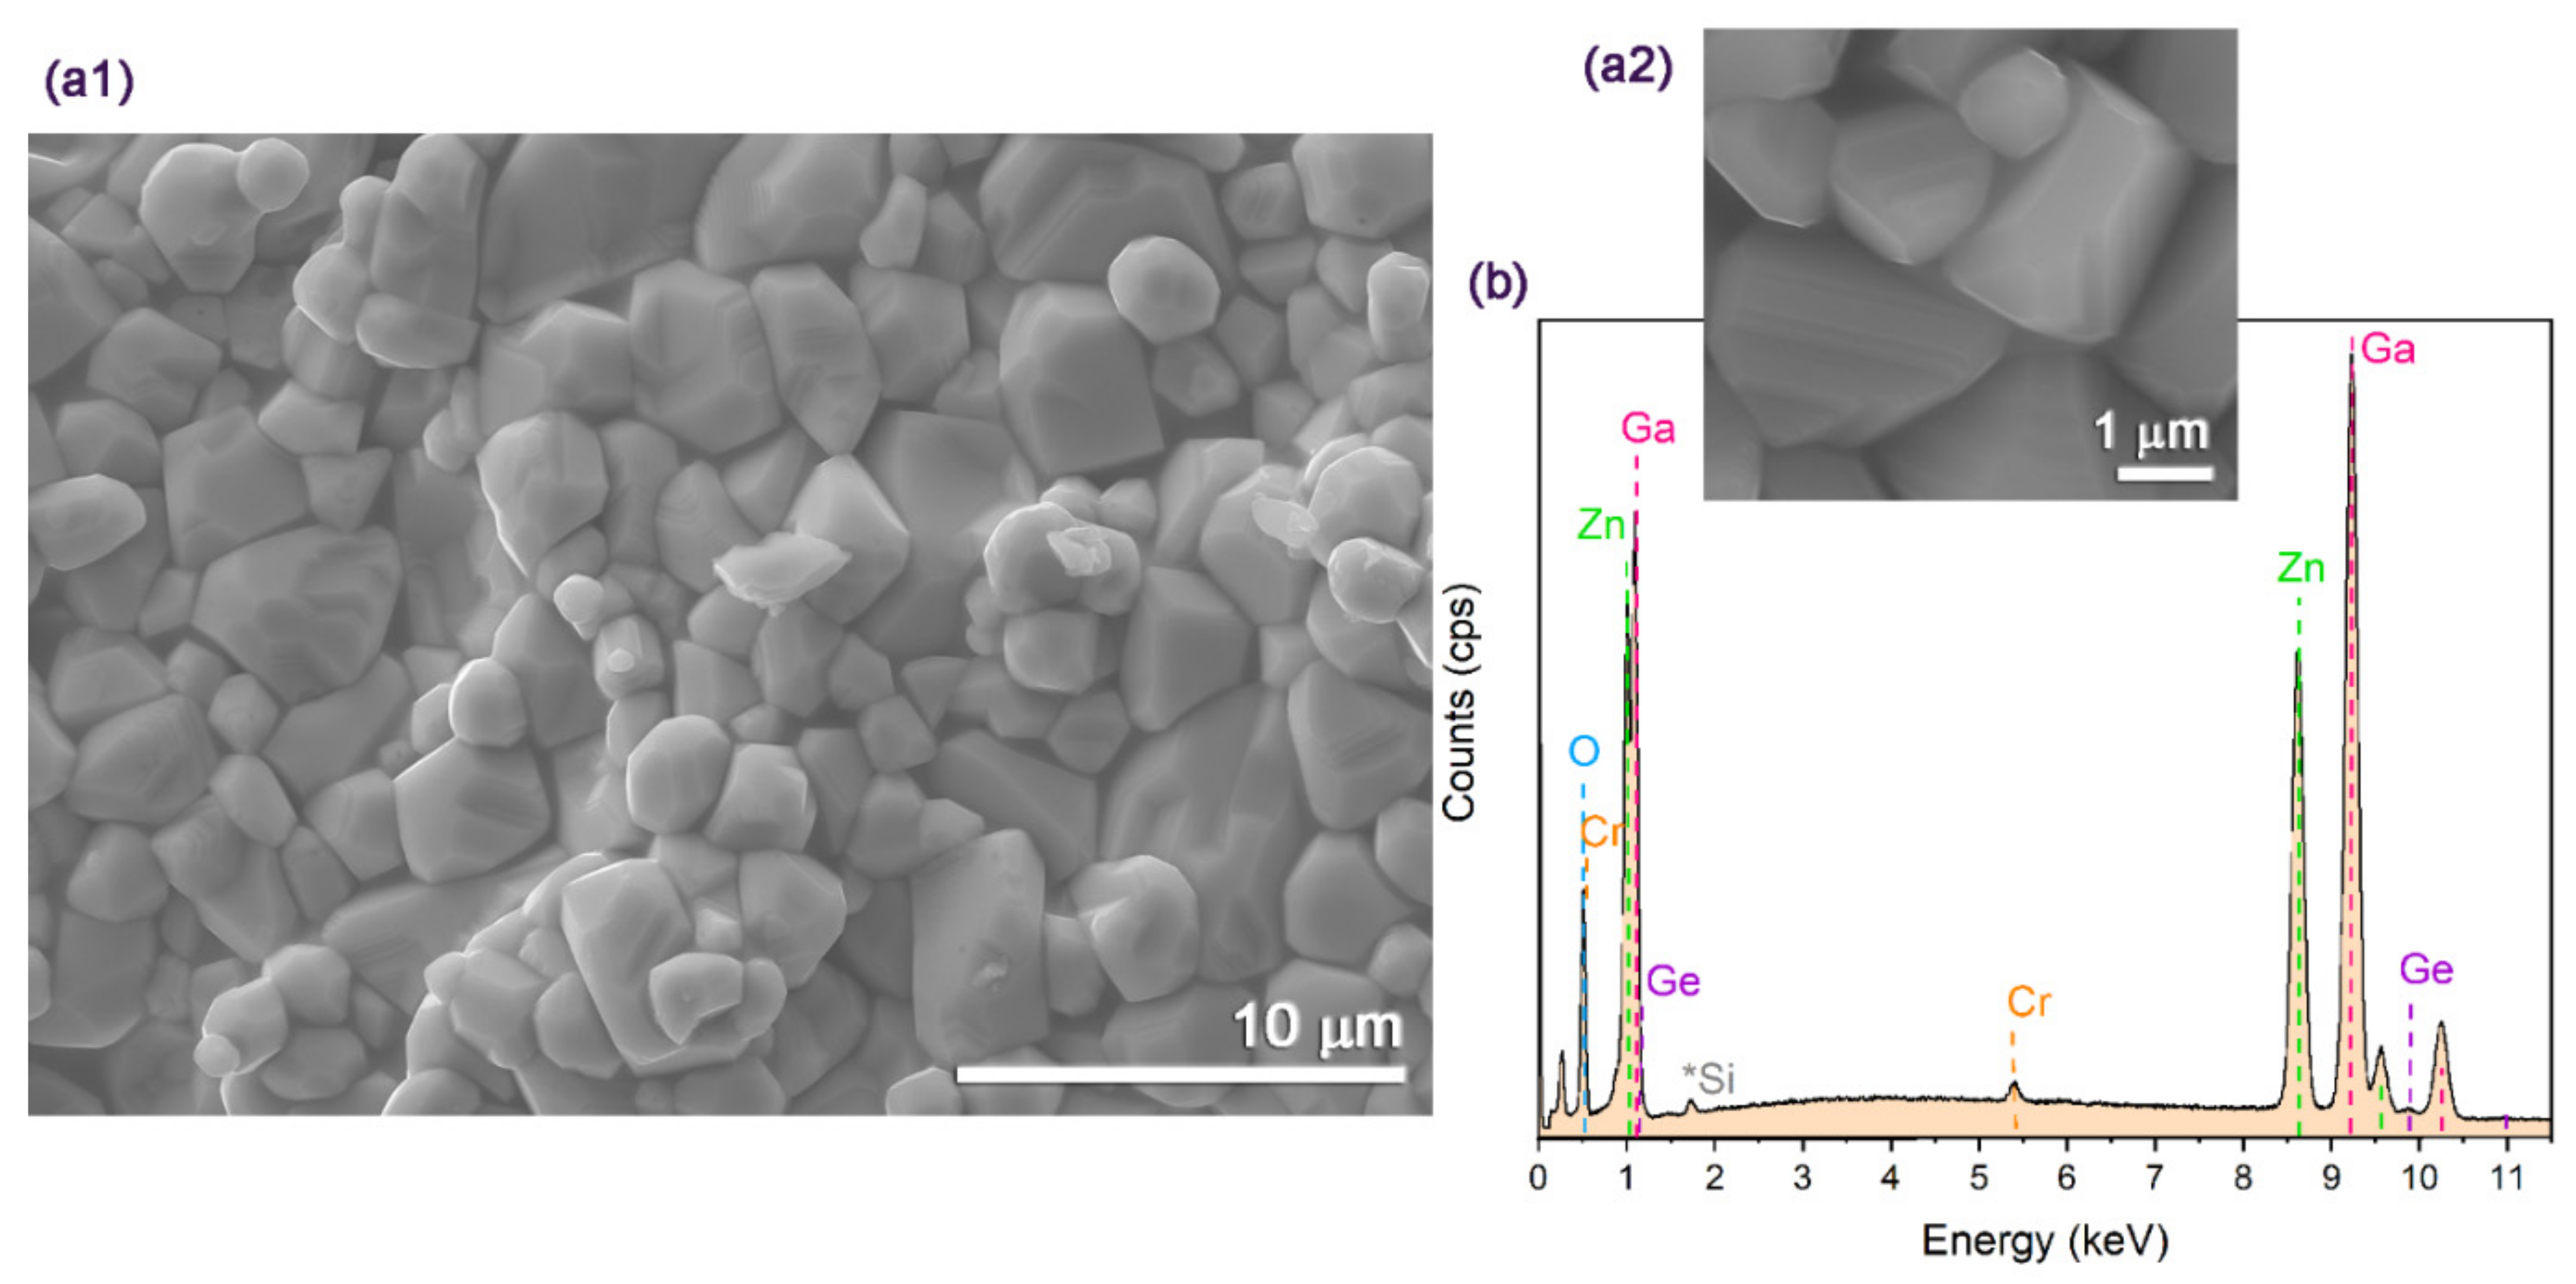
3.1. Structural, Morphological, and Chemical Analysis

Figure 2a displays typical X-ray diffractograms and Raman spectra of Cr-doped ZGO and ZGGO pellets. As identified, only the ZGO crystalline phase was observed and no other crystalline phases were present, apart from residual silica contamination likely arising from the mixing procedure of the precursors using the agate ball mill. The lattice constants of the doped spinels were estimated as 8.29   and 8.32   for the ZGO and ZGGO hosts, respectively, which are in line with the values reported in the literature [3,8,9,10,11] and close to the reference value of 8.33 from ICDD #04-005-9208 card, which is included in the Figure for comparison purposes.
The crystalline structure of the pellets was further assessed by Raman spectroscopy, as shown in Figure 2b Every pellet was measured in four different points to infer the samples’ homogeneity. As the samples were seen to be fairly homogeneous, a representative spectrum of each is presented in Figure 2b. Since ZGGO is isostructural with ZGO, as seen in the XRD results, similar vibrational modes are expected for both compounds. Consequently, the signature of the vibrational modes was based on those of the ZGO [30]. Considering the reduced cell, ZGO has two formula units, corresponding to 14 atoms. Therefore, a total of 42 vibrational modes are generated. The total number of vibrational modes at the first Brillouin zone centre described by the irreducible representation of O h point group is [30,31]: Γ = A 1 g R   + E g R   + T 1 g + 3 T 2 g R   + 2 A 2 u + 2 E u + 5 T 1 u I R   + 2 T 2 u , where the ones labelled with R and I R correspond to the modes that are active in Raman and infrared, respectively. The remaining T 1 g mode is an acoustic phonon and all the other ones are silent modes, thus not contributing to the Raman nor the IR spectra. Therefore, at k = 0 , five Raman active modes are expected: A 1 g , E g , and 3 T 2 g , with E and T modes doubly and triply degenerated, respectively [30,31]. In spinel oxides, the highest frequency vibrational mode, assigned as A 1 g , is characteristic of stretching vibrations of O atoms inside the octahedral unit GaO6 [30,32]. The lowest energy vibrations (assigned as T 2 g ) are mainly due to Zn ions (e.g., ZnO4 tetrahedrons), while the modes with intermediate frequencies ( E g , T 2 g ) are related with Zn and Ga ions, with a higher contribution from Ga ions [30]. Table 1 lists the frequency of the vibrational modes measured experimentally in this work and compares them with the theoretically calculated values reported in the literature for ZGO [30].
By comparing the frequencies of the measured modes for the ZGO:Cr and ZGGO:Cr lattices with the theoretically predicted ones, some differences can be identified: (i) the peak positions of the vibrational modes of ZGGO:Cr are shifted to lower frequencies regarding those of ZGO:Cr; and (ii) an additional mode at ca. 270 cm−1 was observed for both structures, which was not predicted by the space group analysis of the ideal spinel structure in [30]. Additional modes may appear in the spectra due to local lattice disorder effects, including those related to the inverse spinel (inversion of the cations, antisites), or local modes. For instance, for the case of ZGO, a slight inversion character of 3 % has been reported [10,13,25]. Therefore, the vibration at 270 cm−1 may be assigned to a local lattice disorder. As identified, the peak positions of some of the ZGGO:Cr vibrational modes exhibit a pronounced shift to lower frequencies when compared with ZGO:Cr, namely for symmetry modes that are likely to contain the Ga3+ cation vibrations. Thus, a likely explanation is related to the effect of the replacement of Ga ions by the heavier Ge ones that well accounts for the observed lower phonons energy.
The morphology of the ZGGO:Cr pellets was assessed by SEM. As presented in Figure 3a, a mean grain size of 1.8 ± 0.6 μm was estimated, which represents the majority of the pellet sample. However, larger grains were also observed with sizes in the order of dozens of micrometres. The EDS spectrum depicted in Figure 3b evidences the presence of all the expected elements in the sample: Ga, Zn, Ge, O, and Cr.’

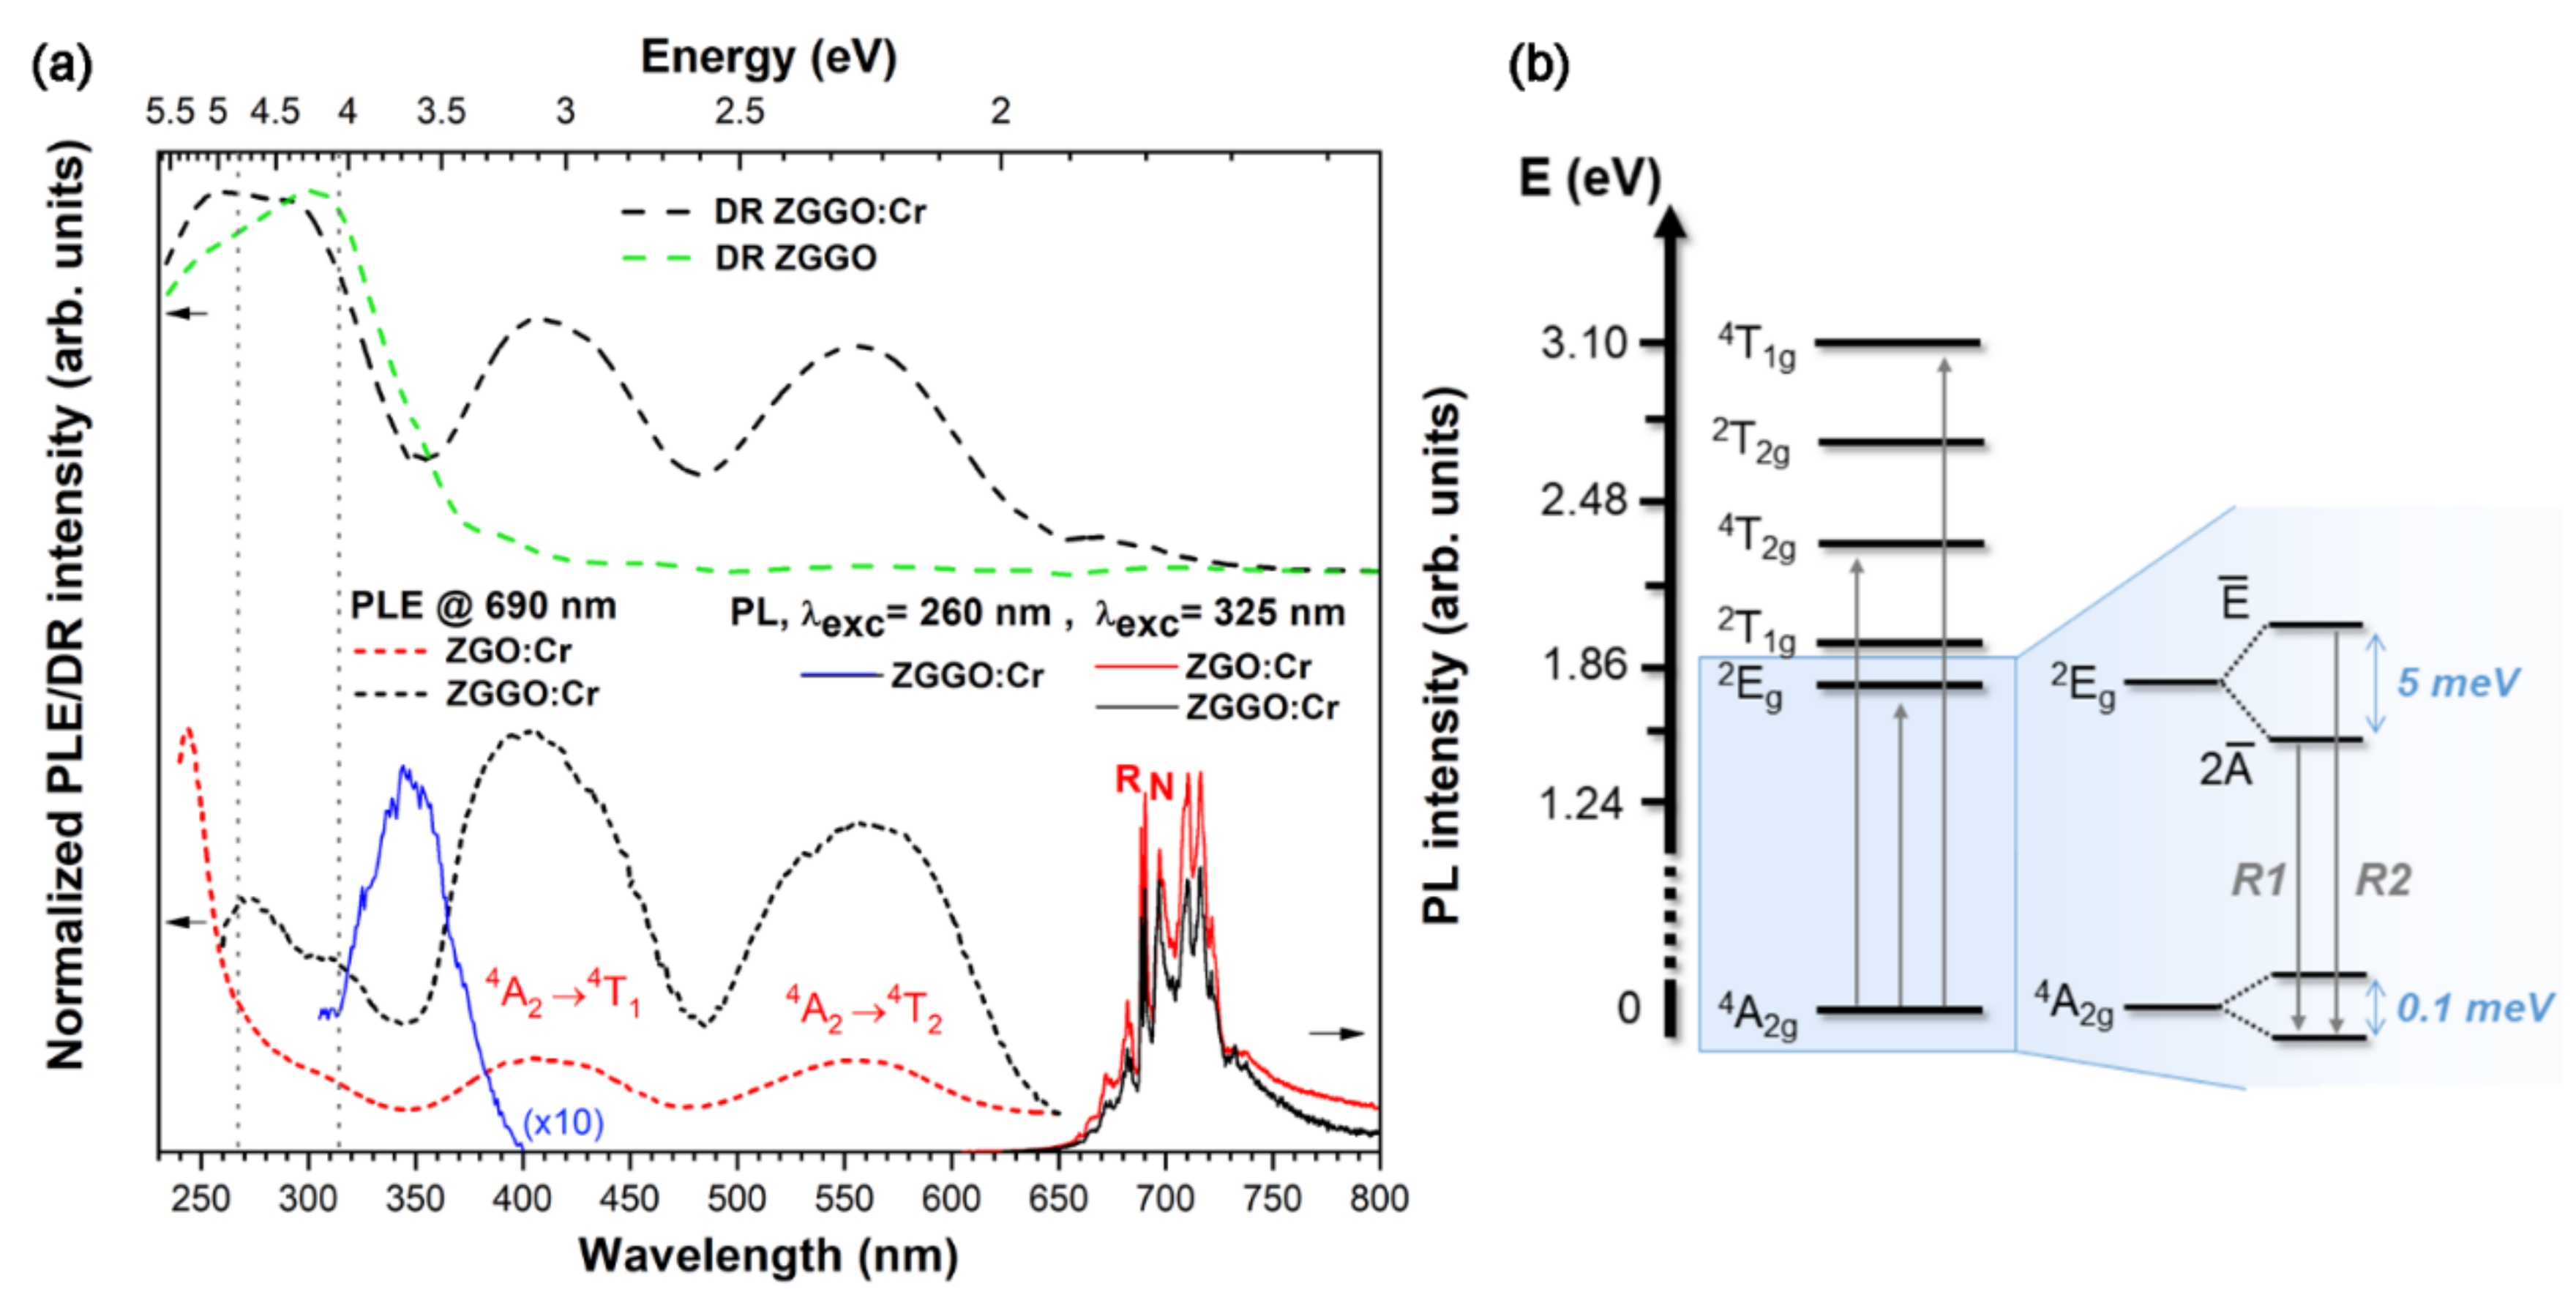
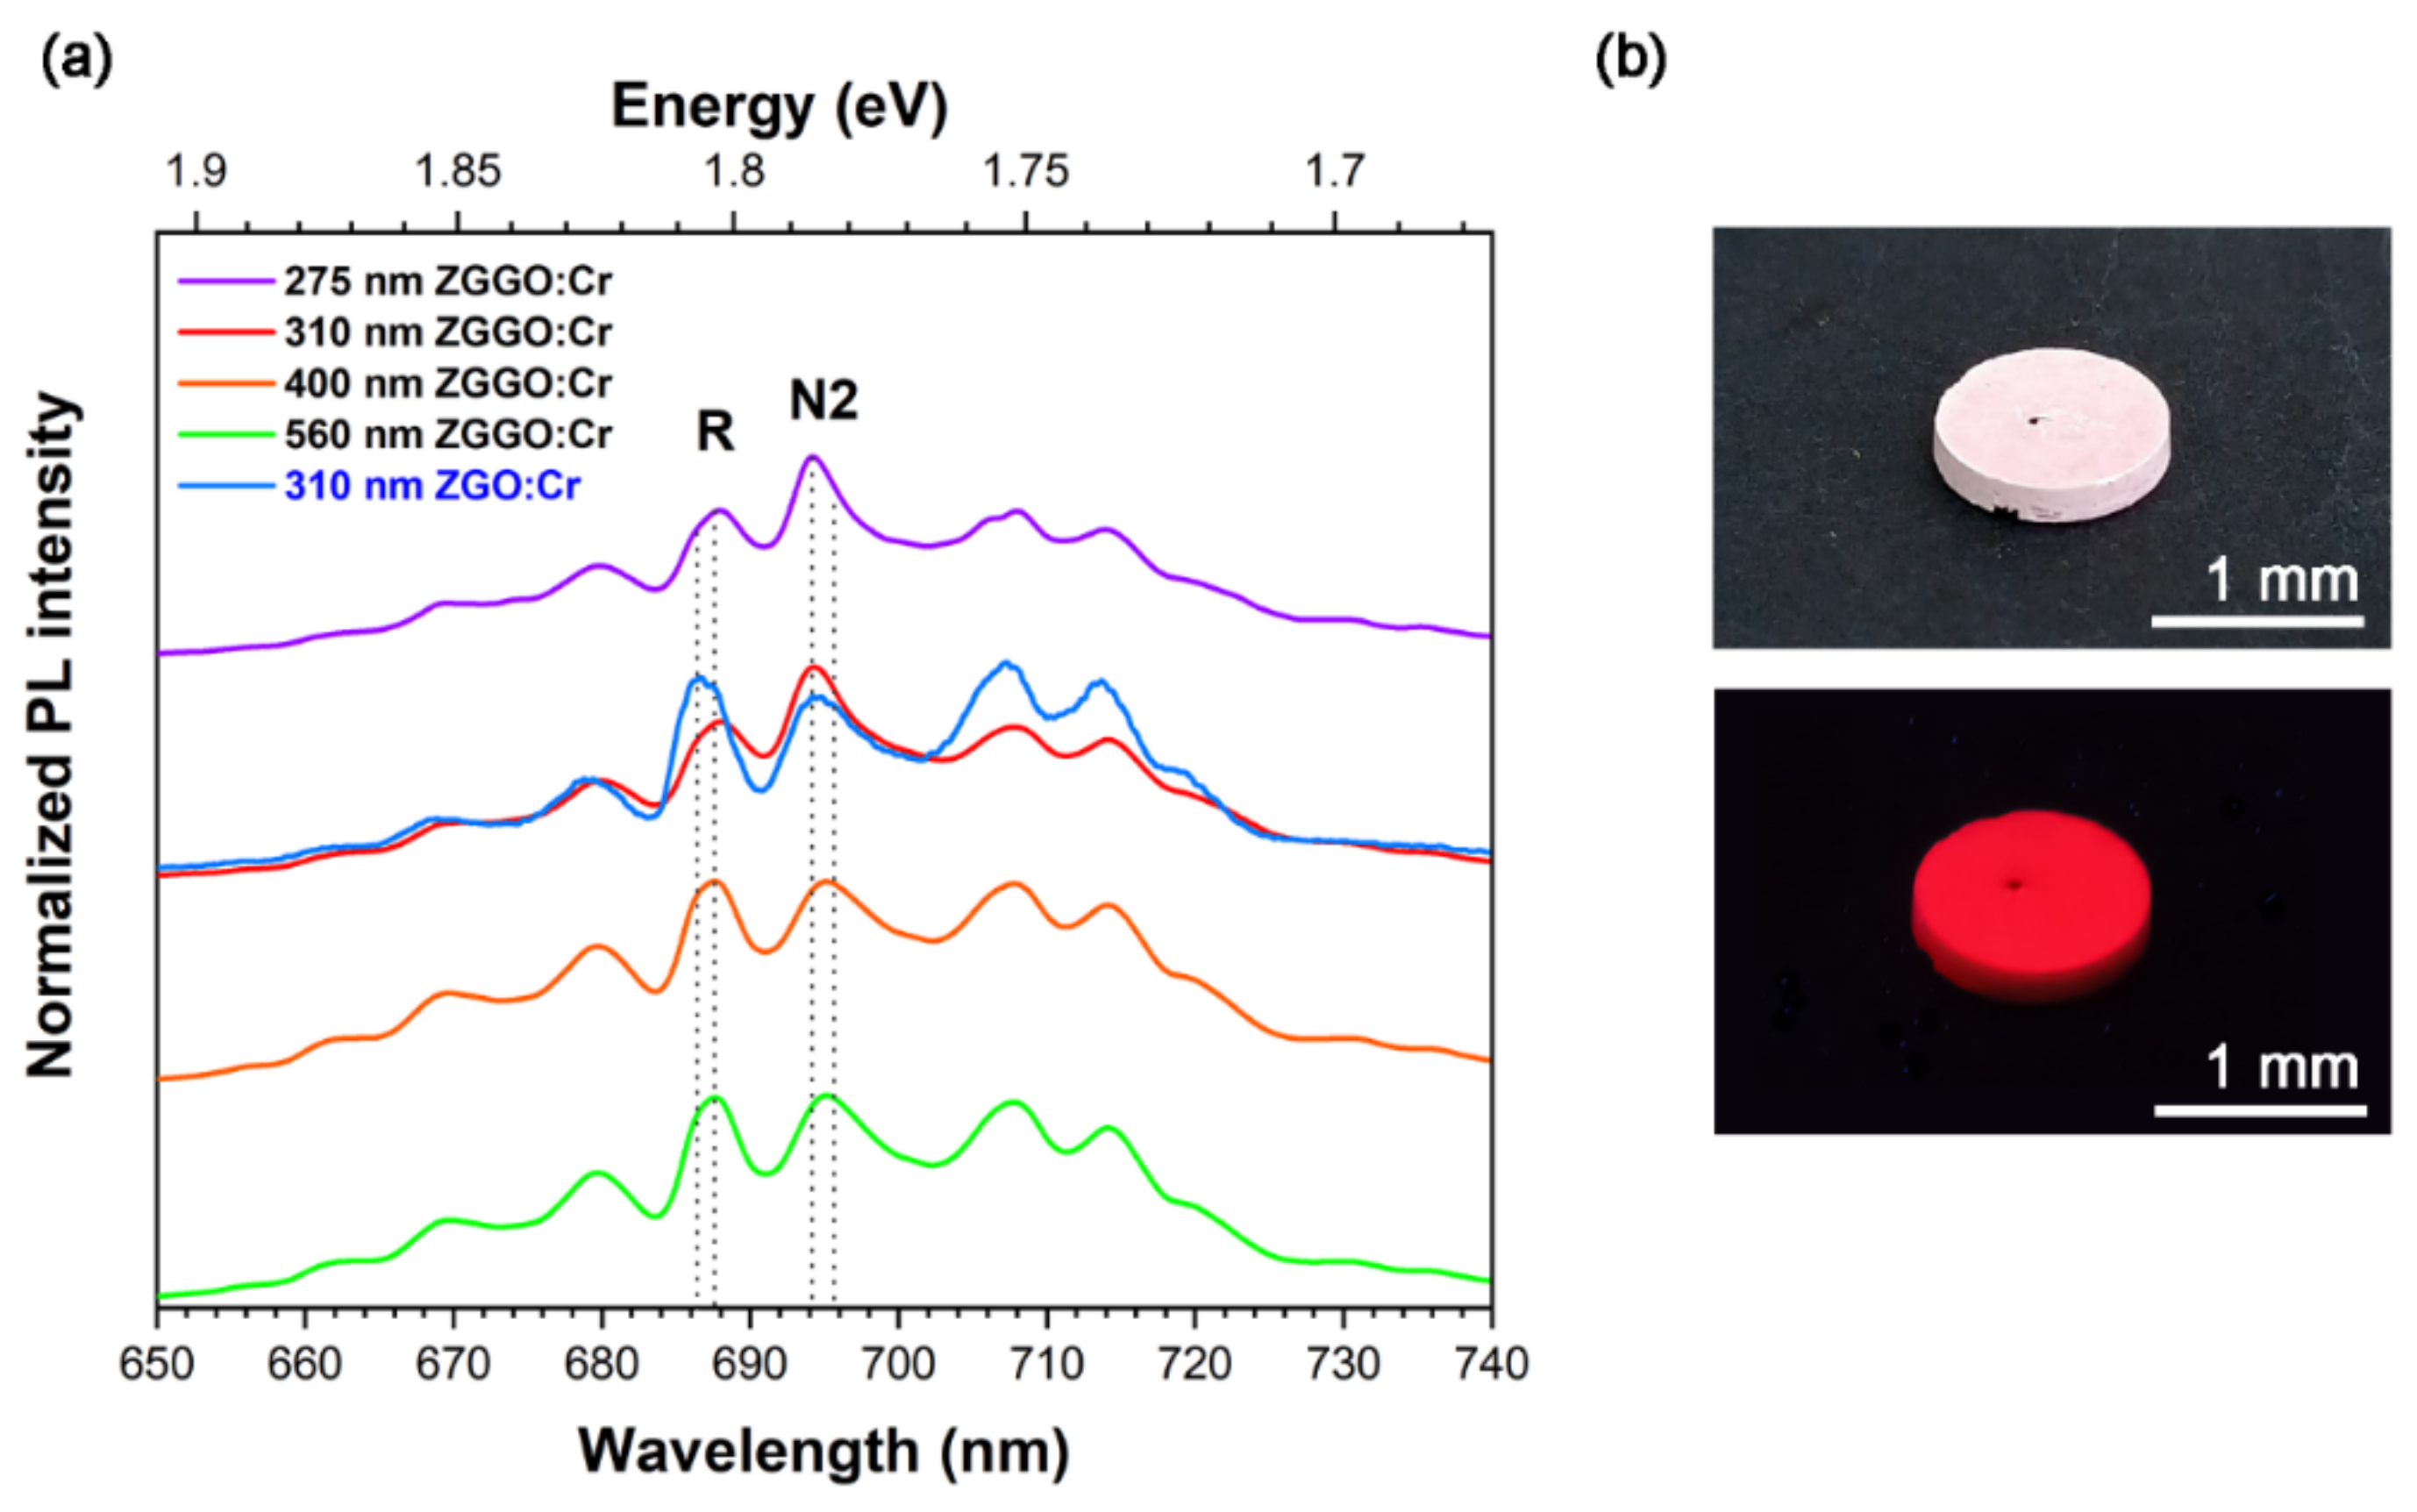
3.2. RT Photoluminescence and Photoluminescence Excitation

Figure 4a shows the normalised RT PL, PLE, and DR spectra of non-intentionally doped and chromium-doped ZGO and ZGGO samples. By exciting the samples with 325 nm/3.81 eV, the main recombination process on ZGO:Cr and ZGGO:Cr is due to the intraionic Cr3+ luminescence in the red/NIR spectral region. As mentioned in the introduction, emission lines corresponding to transitions from the first excited level, E 2 , to the fundamental one, A 4 2 , are observed. In a single configurational coordinate diagram, these electronic states exhibit a small offset, being responsible for the narrow emission lines, the R-lines (see also Figure 5). Cr3+ in the ZGO and ZGGO lattices preferentially occupy the slightly trigonal distorted Ga3+ octahedral sites [11,18,24]. By the interplay of the crystalline field and spin–orbit interaction, the E 2 electronic level is split into two electronic states E ¯ and 2 A ¯ (Figure 4b), for higher and lower energies, respectively, with an energy separation of ca. 5 meV [11,18,24,29]. Additionally, it should be also emphasised that the ground A 4 2 state is also split into two electronic states, with a zero-field splitting of ca. 0.1 meV [18,24,29]. Consequently, two ZPL are observed from the upper E ¯ and 2 A ¯ states to the fundamental one, corresponding to the R2- and R1-lines (Figure 4b) placed at higher and lower energies, respectively. In the case of the used excitation (325 nm/3.81 eV), the RT broad spectra show the peak position of the R-lines in the ZGO:Cr and ZGGO:Cr samples at 686.6 nm/1.806 eV and 688.1 nm/1.802 eV, respectively. The RT PL spectra also evidence a rich vibronic structure on the low/high energy side of the R-lines, with the former/latter corresponding to the vibrational coupled Stokes/anti-Stokes luminescence. Additionally, superimposed with the intraionic Cr3+ luminescence in substitutional sites, N emission lines due to exchange–coupled ion pairs and/or Cr-related complex defects in the presence of nearby intrinsic/extrinsic defects are observed, in line with what was reported by other authors [7,11,24,25]. As aforementioned, N-lines have been reported in ZGO:Cr [22,23,24,25] in the low energy side of the R ones, namely at 688.9 nm/1.80 eV (N1), 693.5 nm/1.79 eV (N2), 700.3 nm/1.77 eV (N3), and 704 nm/1.76 eV (N4), and their intensity was found to be dependent on the chromium concentration and excitation energy [24,25]. In the here-studied samples, the N-line with the highest intensity is the N2, and the defect from which this line originates has a major influence on the observation of red/NIR persistent luminescence, as will be further discussed.
When monitored at the R-lines, the PLE spectra (Figure 4a) are dominated by asymmetric broad excitation bands due to the spinallowed A 4 2 T 4 2 , T 4 1 transitions with maxima at 556 nm/2.23 eV and 404 nm/3.07 eV in both doped hosts. A higher energy transition ( A 4 2 T 4 1 P 4 ) is also expected to occur superimposed with the materials’ band edge and/or with a defect-related excitation band [7]. Figure 4a also displays the DR spectrum of ZGGO:Cr, showing the intraionic A 4 2 T 4 2 , T 4 1 absorption bands with similar spectral shape and peak position as the ones measured by PLE. From these data, a strong average crystal field strength was estimated as D q / B of 2.74 for ZGO and ZGGO, where D q and B stand for the crystal field and Racah parameters, respectively. The estimated values were calculated considering the mean peak energies of the A 4 2 T 4 2 and A 4 2 T 4 1 transitions, according to Henry et al. [33] and Tanabe et al. [20,21], and are in good agreement with the previously reported values [7,18]. Regardless of whether the emission is monitored in the R- or N- lines, the A 4 2 T 4 2 , T 4 1 excitation bands exhibit FWHM larger than 450 meV, suggesting a spectral overlap of the excited energy levels involved in populating the emitting ones for the different defects, as will be discussed later. A noticeable difference is observed in the PLE of the ZGO:Cr and ZGGO:Cr samples in the high energies region. In the case of ZGO:Cr, the red/NIR emission is preferentially excited by photons with wavelengths shorter than 350 nm/3.54 eV (with a maximum at 243 nm/5.1 eV, that matches with the ZGO bandgap [15,16,17]), whereas in the case of ZGGO:Cr, the emission is preferentially populated by longer wavelength photons, corresponding to the intraionic A 4 2 T 4 1 , T 4 2 absorption. Additionally, it is worthwhile to perform a comparison between the PLE and DR spectra of the non-intentionally and intentionally doped ZGGO samples. The DR spectra of both samples exhibit two main maxima at 257 nm/4.82 eV and 303 nm/4.09 eV, with the latter absorption band showing higher intensity in the non-intentionally doped sample. Therefore, it is unlikely that this band could correspond itself to the A 4 2 T 4 1 P 4 Cr3+ transition. Since the band is observed in both the non-intentionally doped and the doped samples, a more plausible explanation is to consider that it is related to other defects/impurities present in both samples (from the host material). Additionally, and as mentioned, the DR spectra of the ZGGO samples exhibit a maximum at shorter wavelengths, suggesting that the energy gap of this material occurs in the vicinity of 4.82 eV. Upon this band-to-band excitation, the ZGGO:Cr sample exhibits a broad ultraviolet emission peaked at ~348 nm/3.56 eV that partially matches the absorption energy of Cr3+ excited states and defect bands.
At RT, excitation of the ZGO:Cr and ZGGO:Cr samples into the band edge, as well as defect levels and higher excited Cr3+ levels, result in a rapid relaxation to the E 2 emitting state, as seen in the excitation-dependent PL spectra shown in Figure 5. It is noteworthy that the relative intensities of the observed lines, their peak positions, and lines’ asymmetry show a dependence on the excitation wavelength, suggesting different origins for the recombination processes superimposed in the same spectral region. This is clearlyidentified in Figure 5 for the R- and N2-lines, as highlighted by the dashed vertical lines.

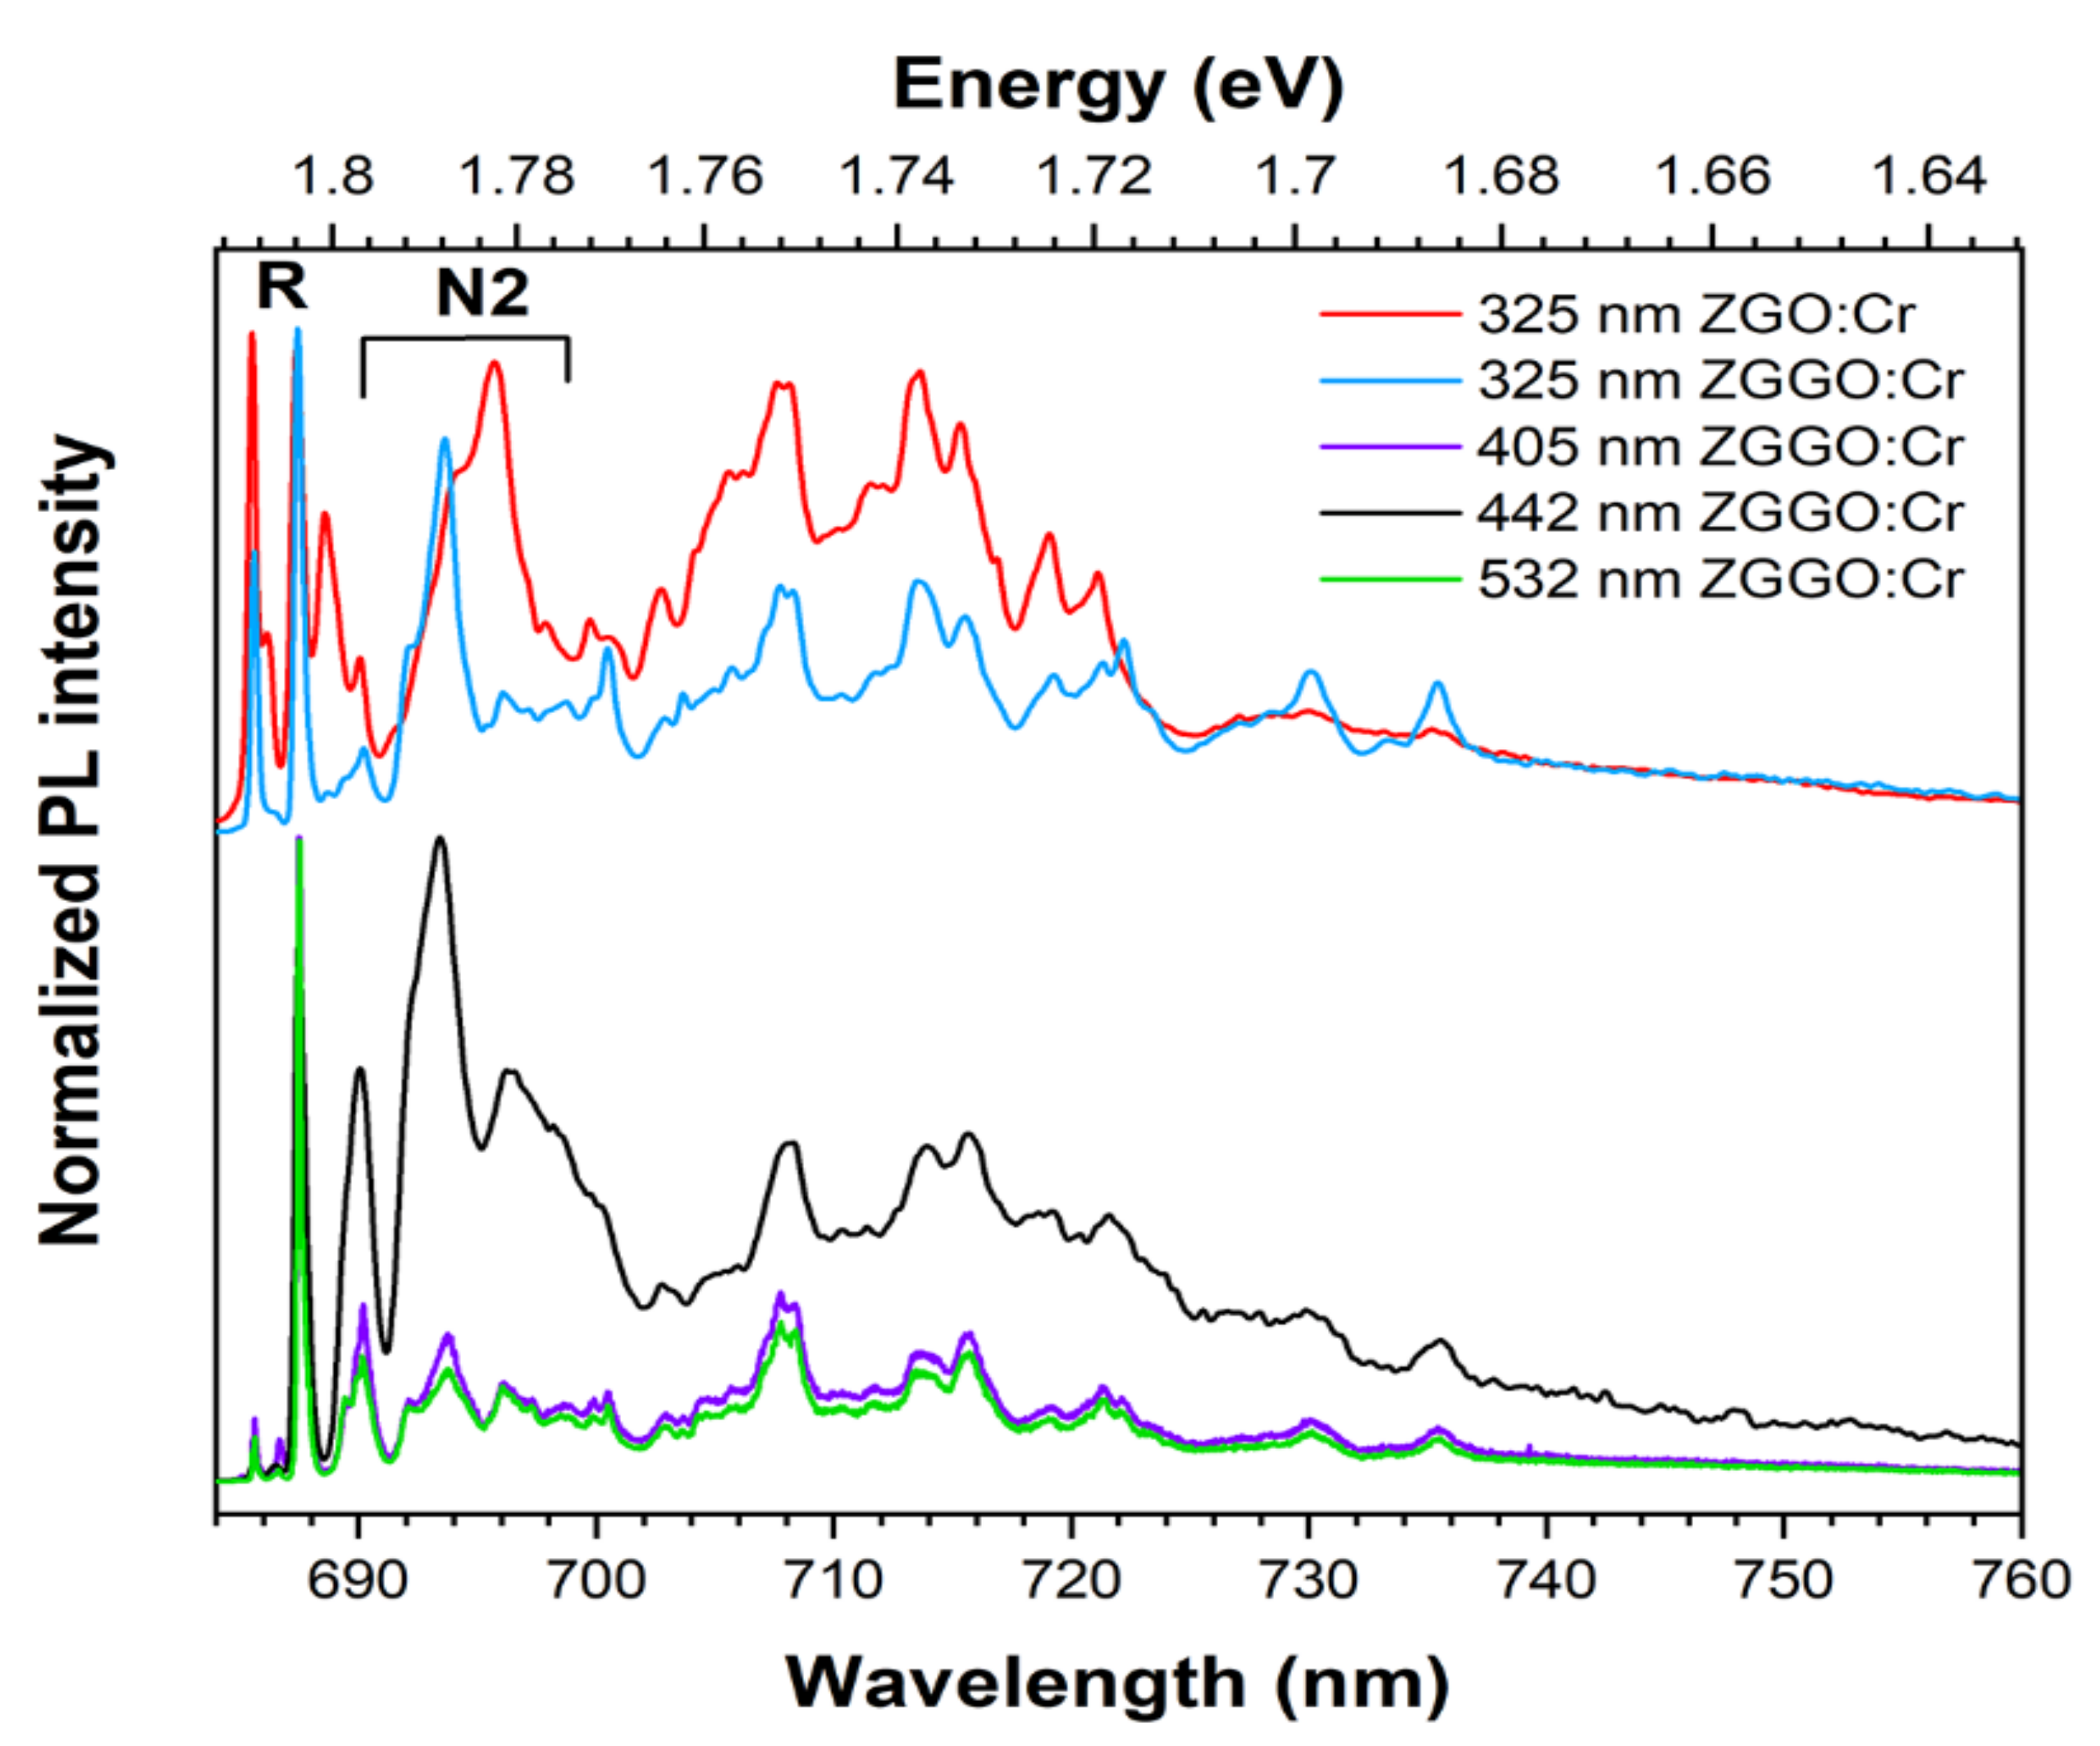
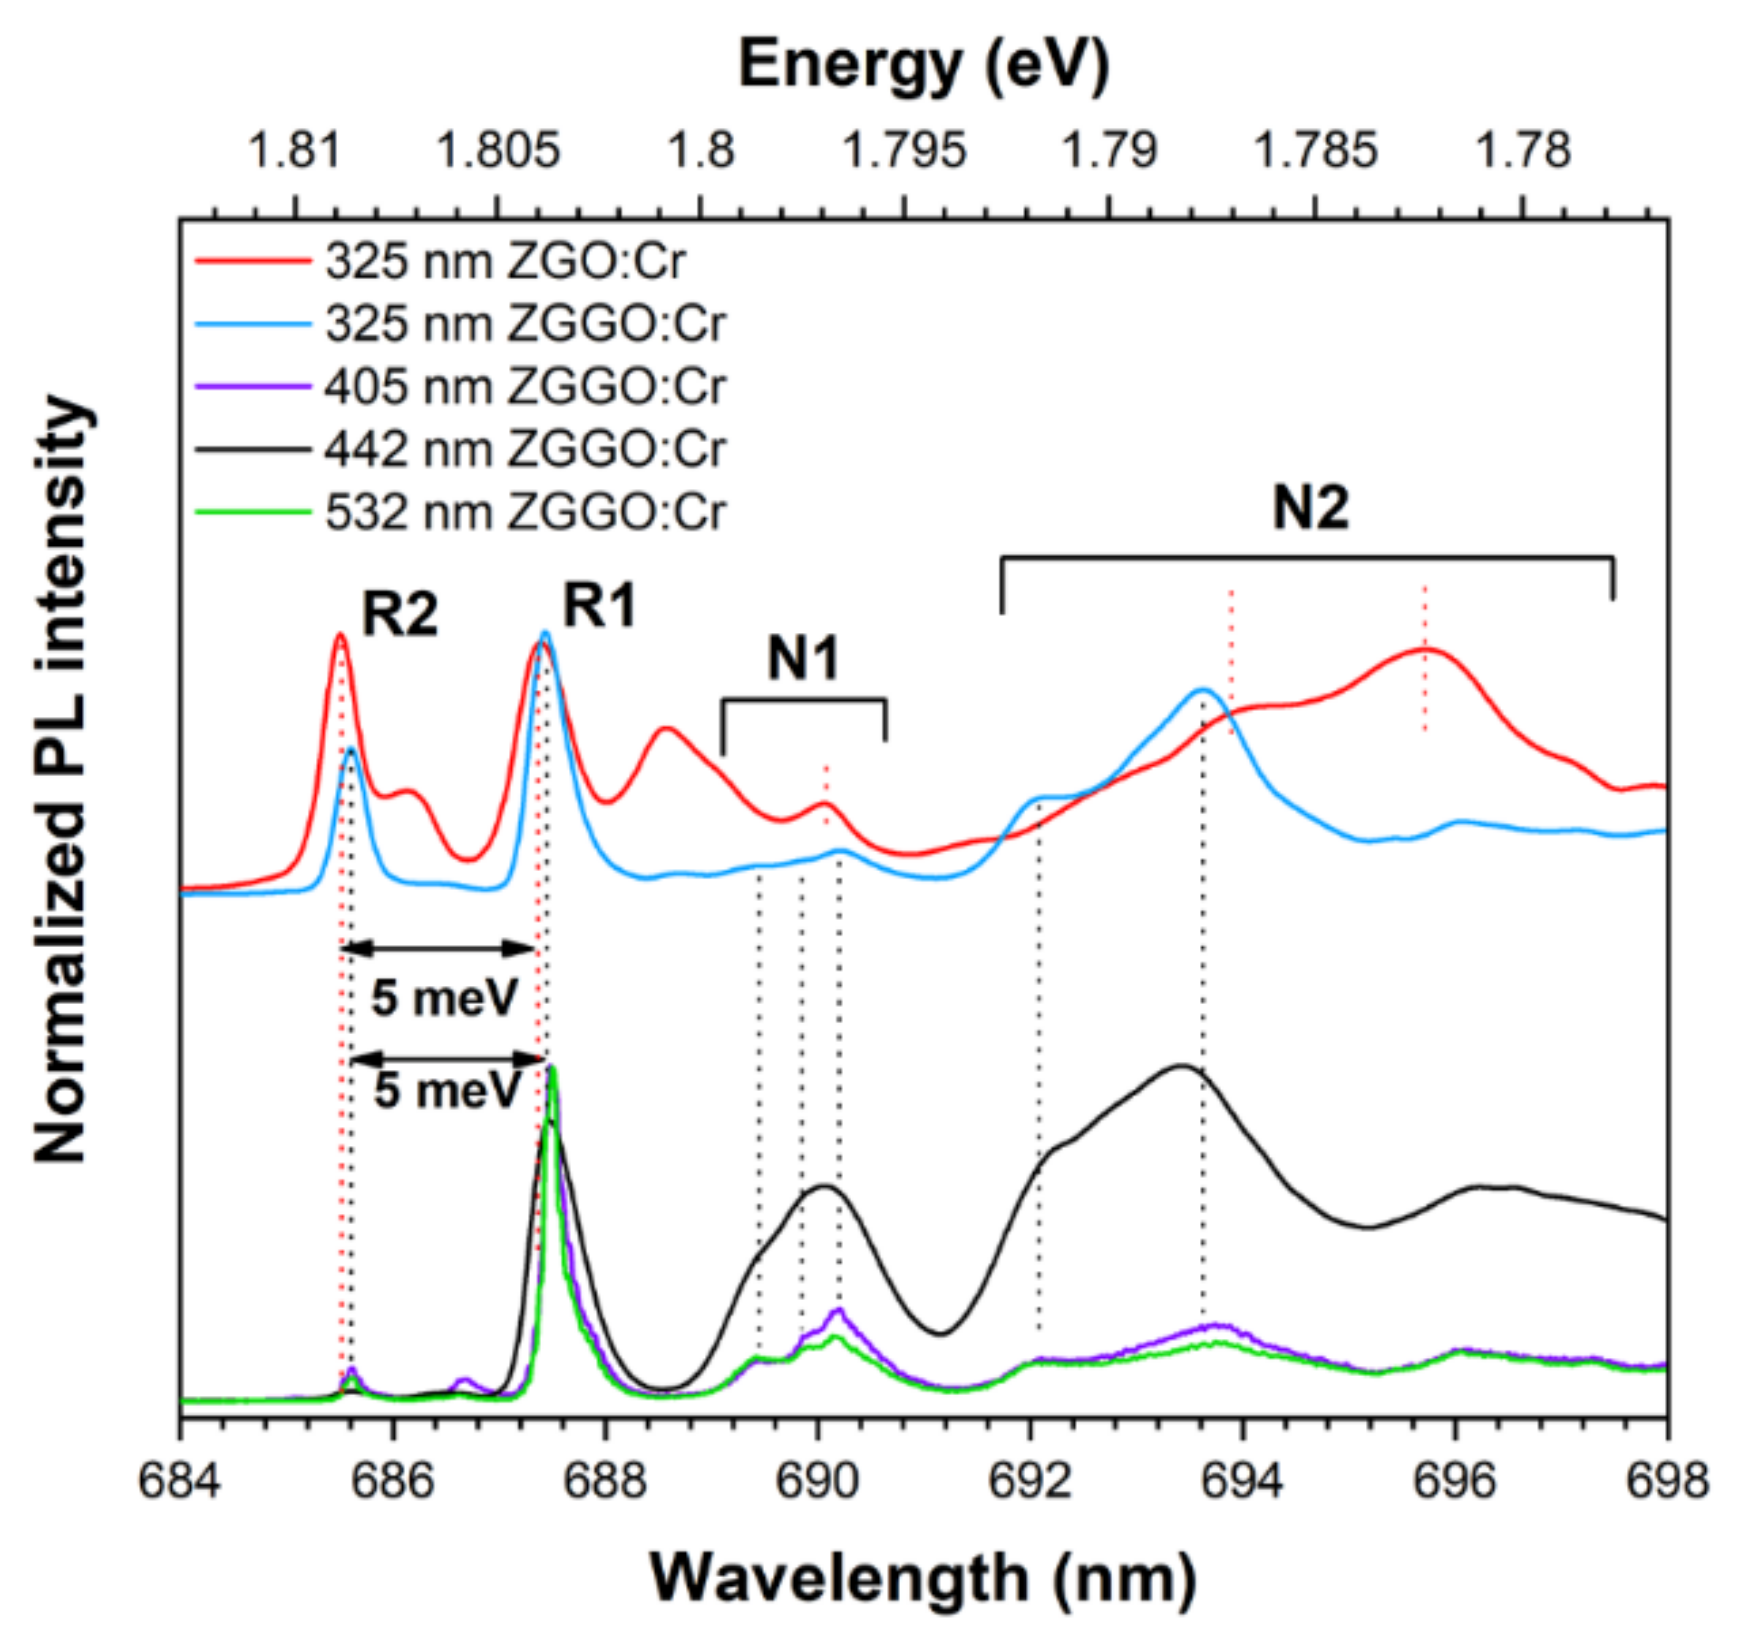
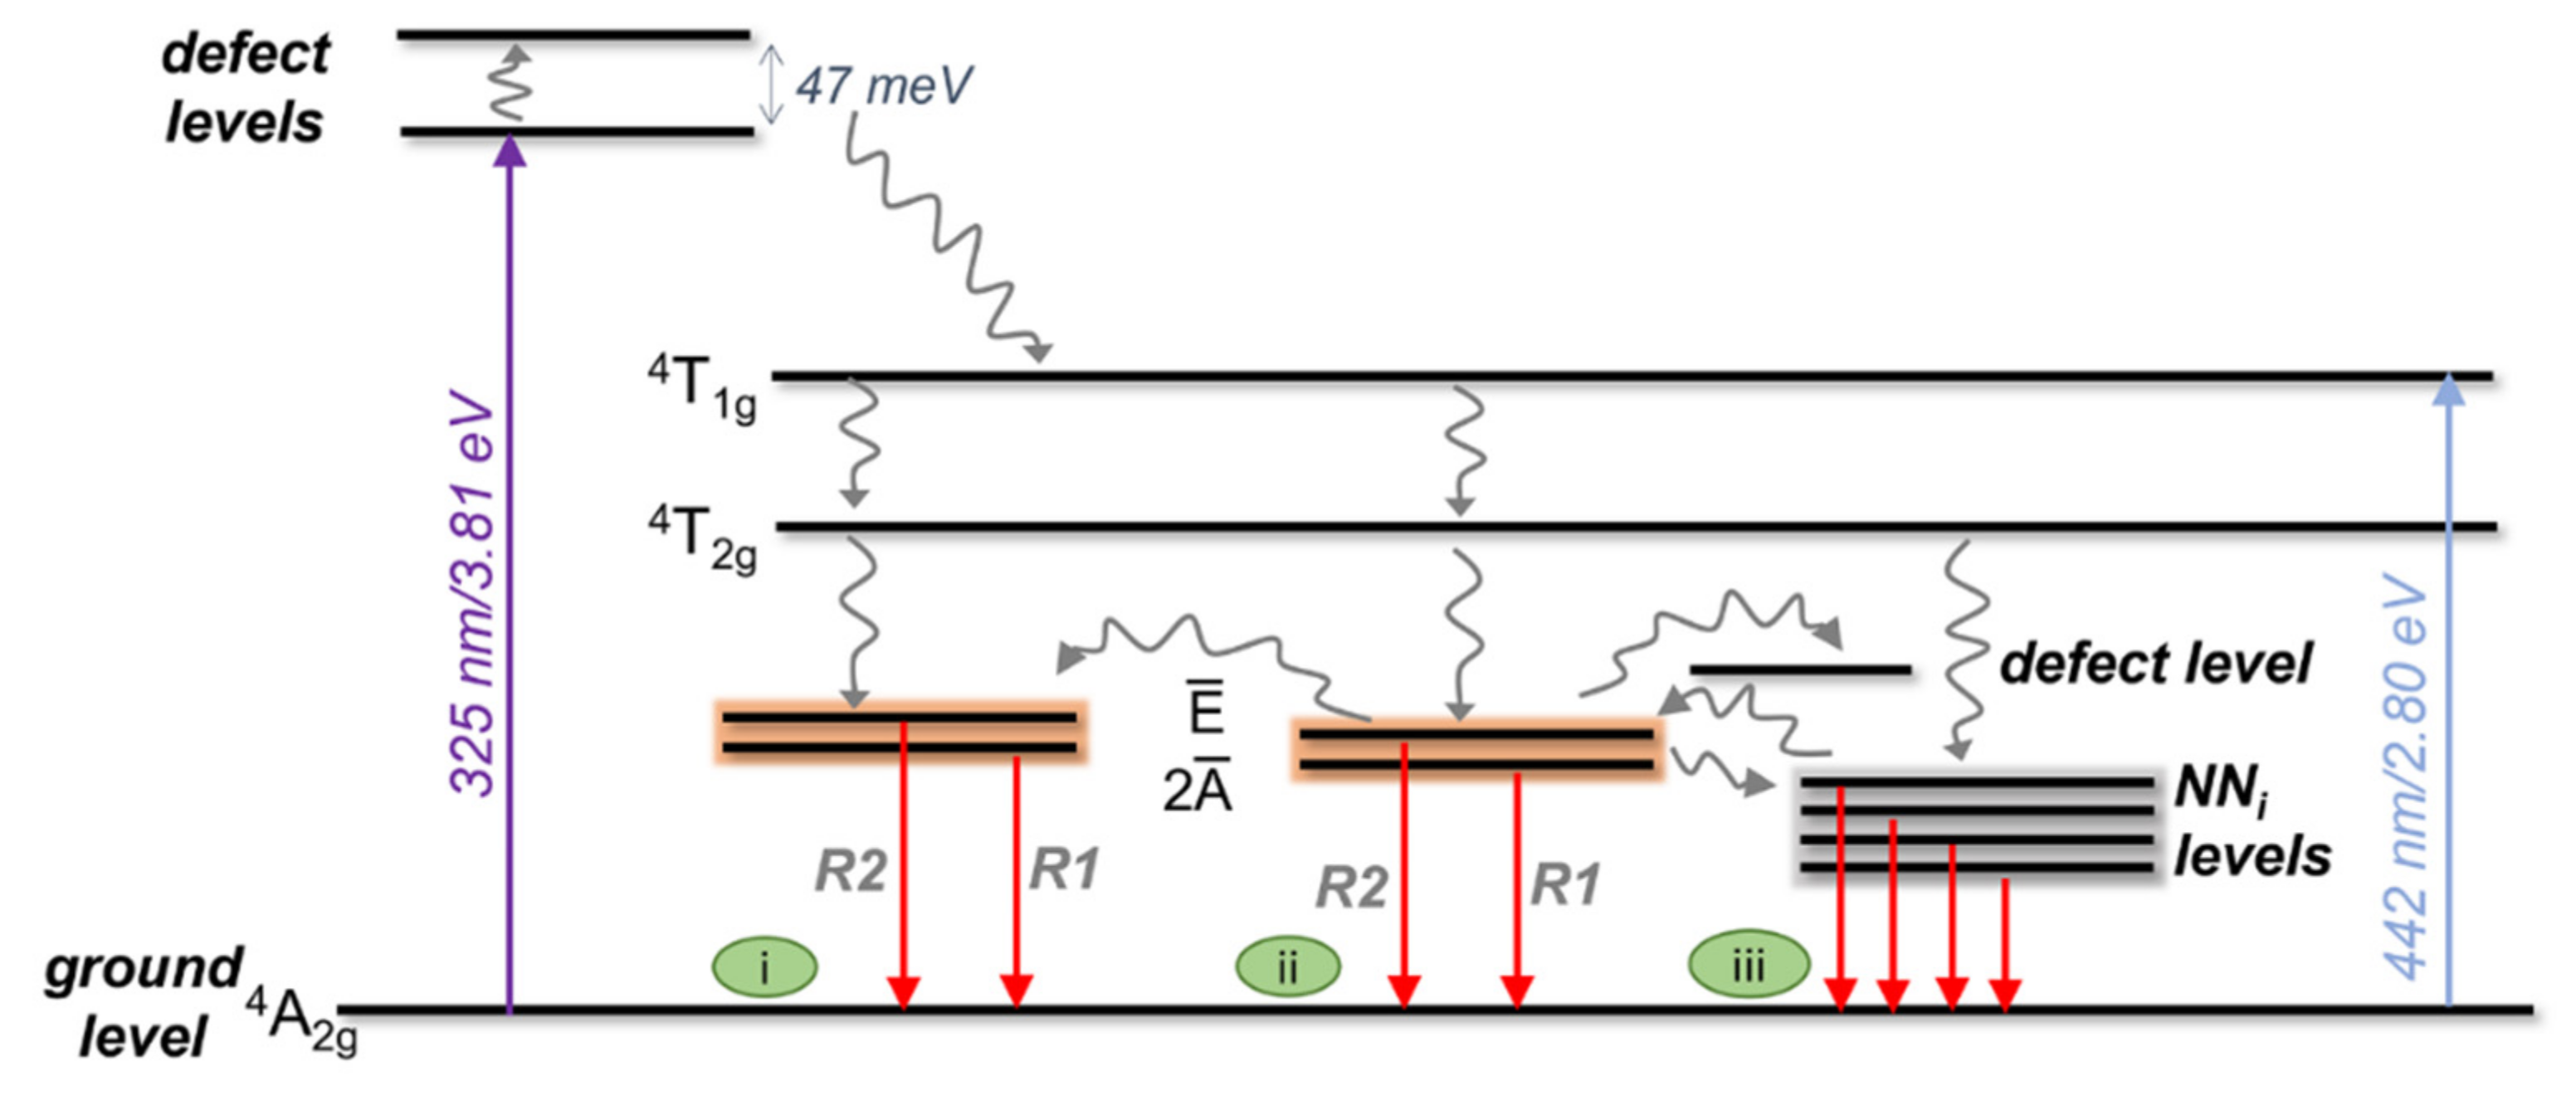
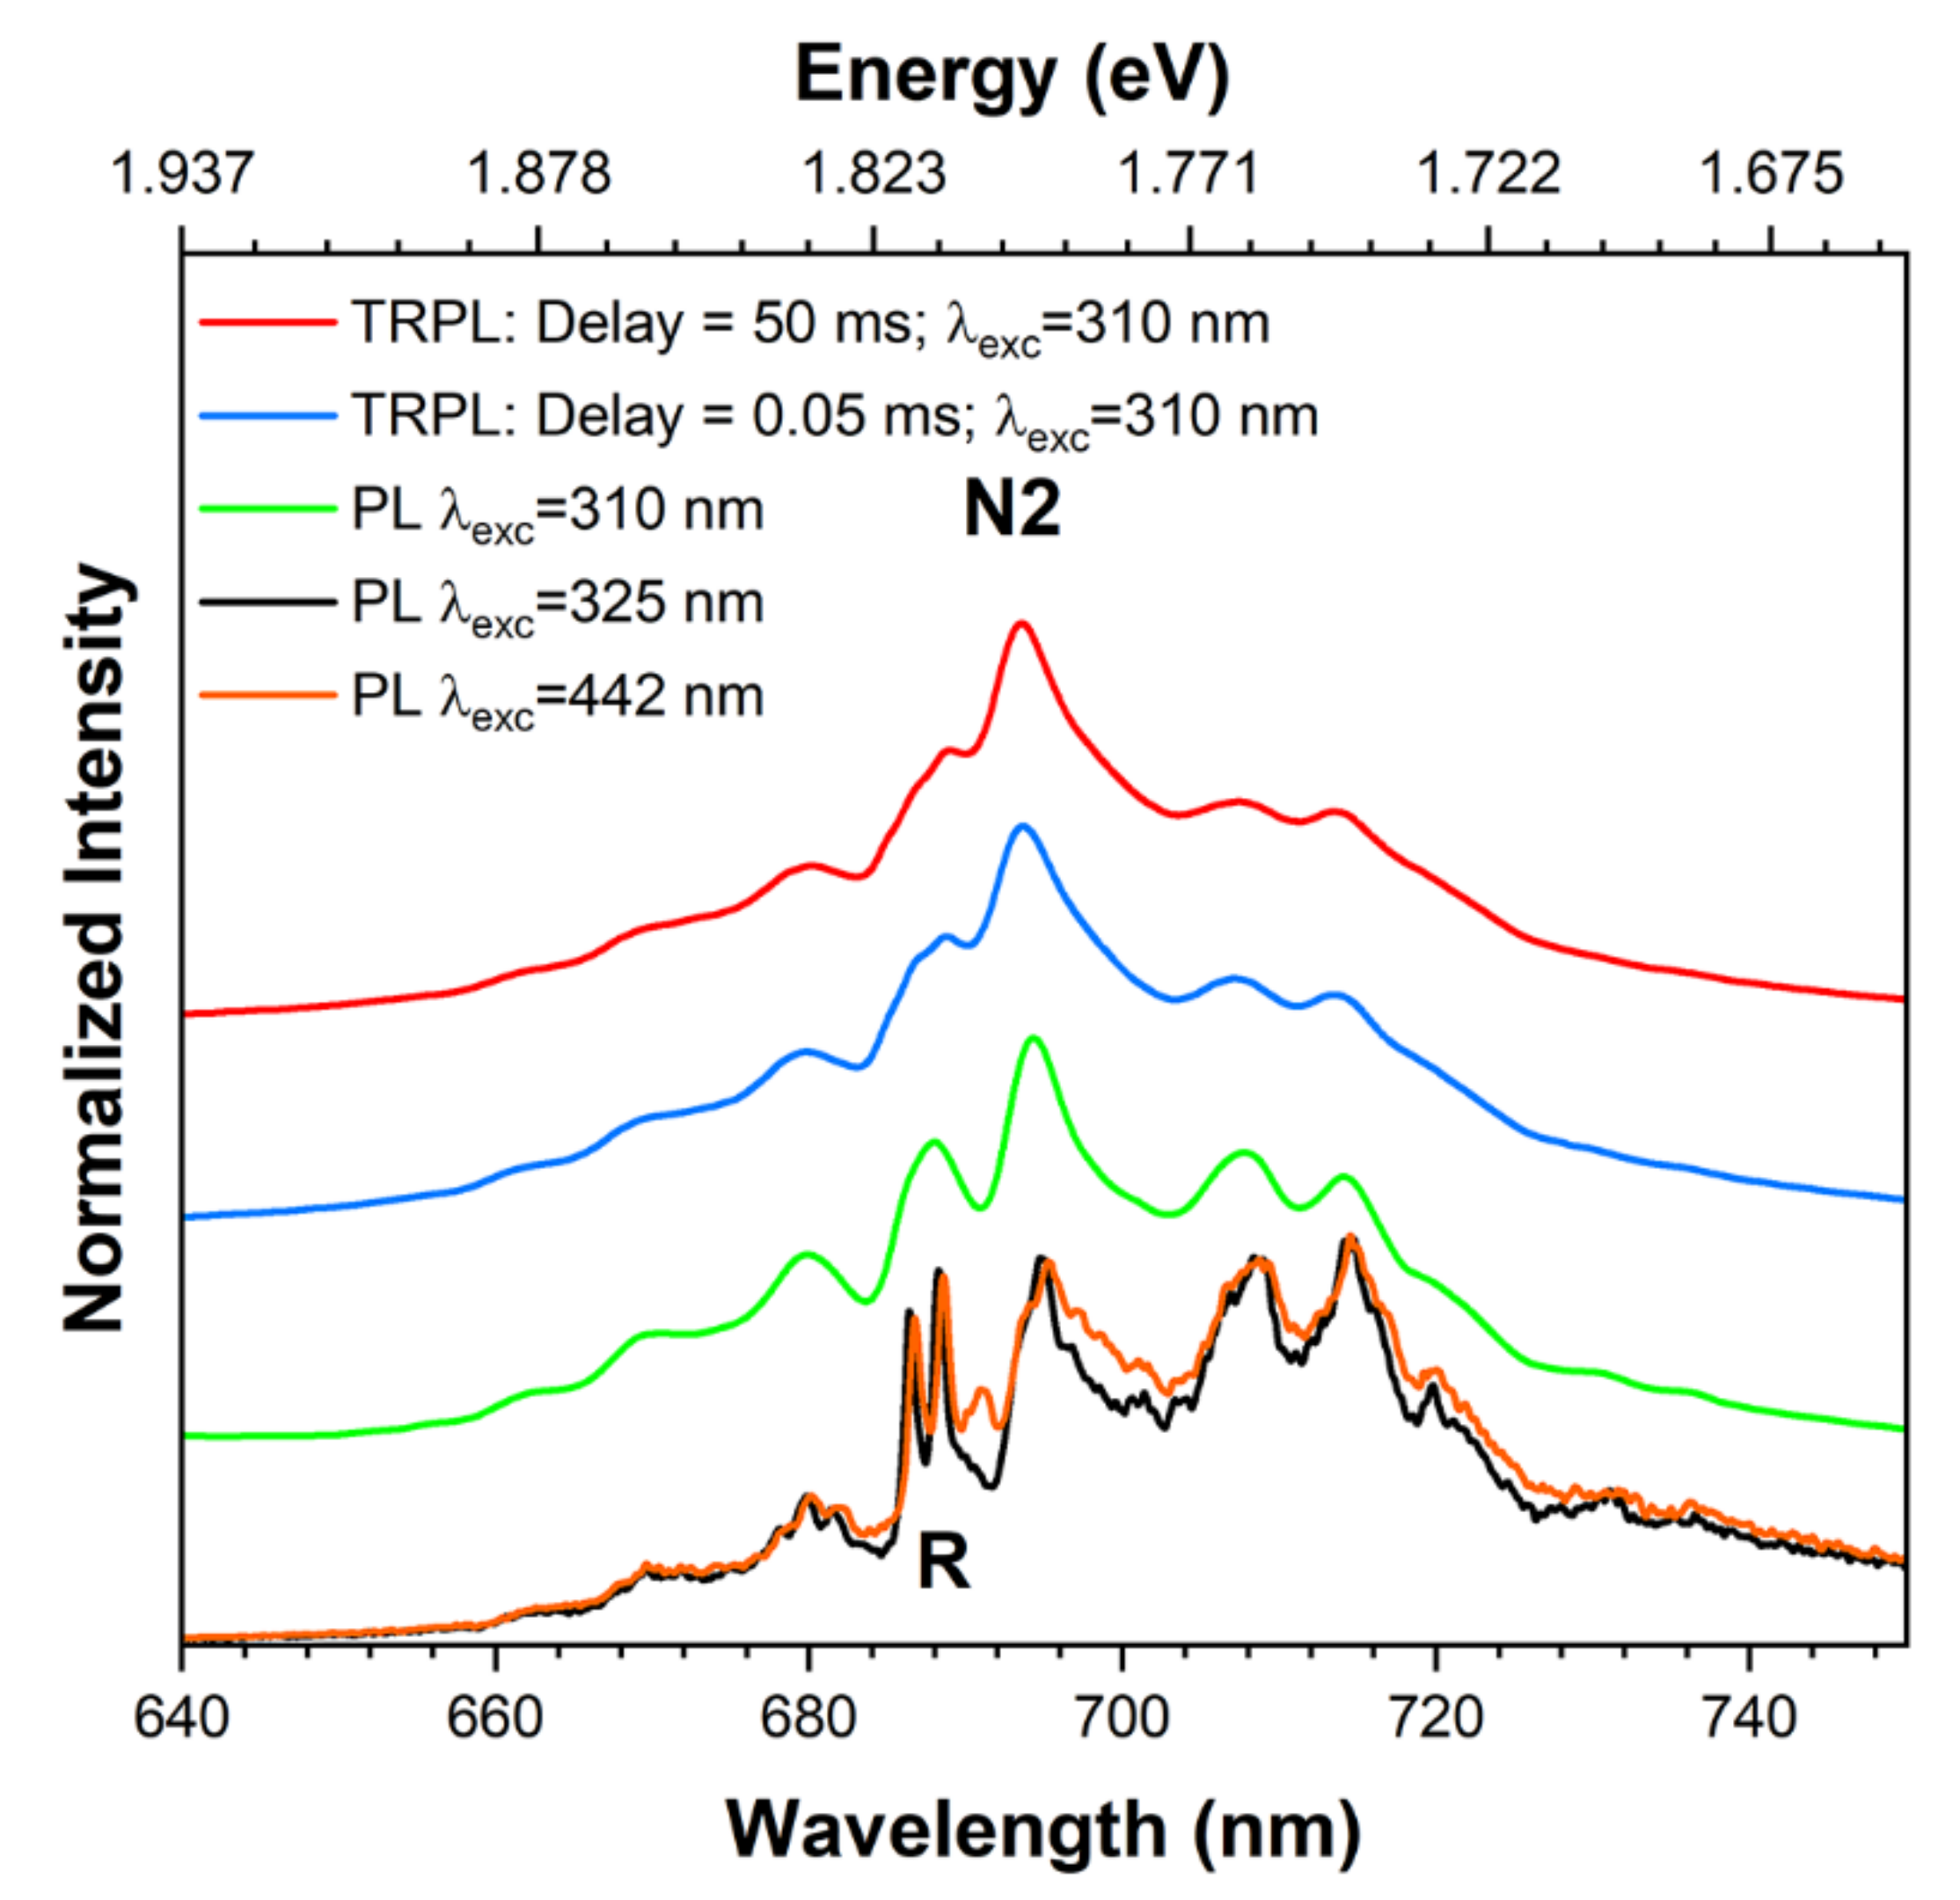
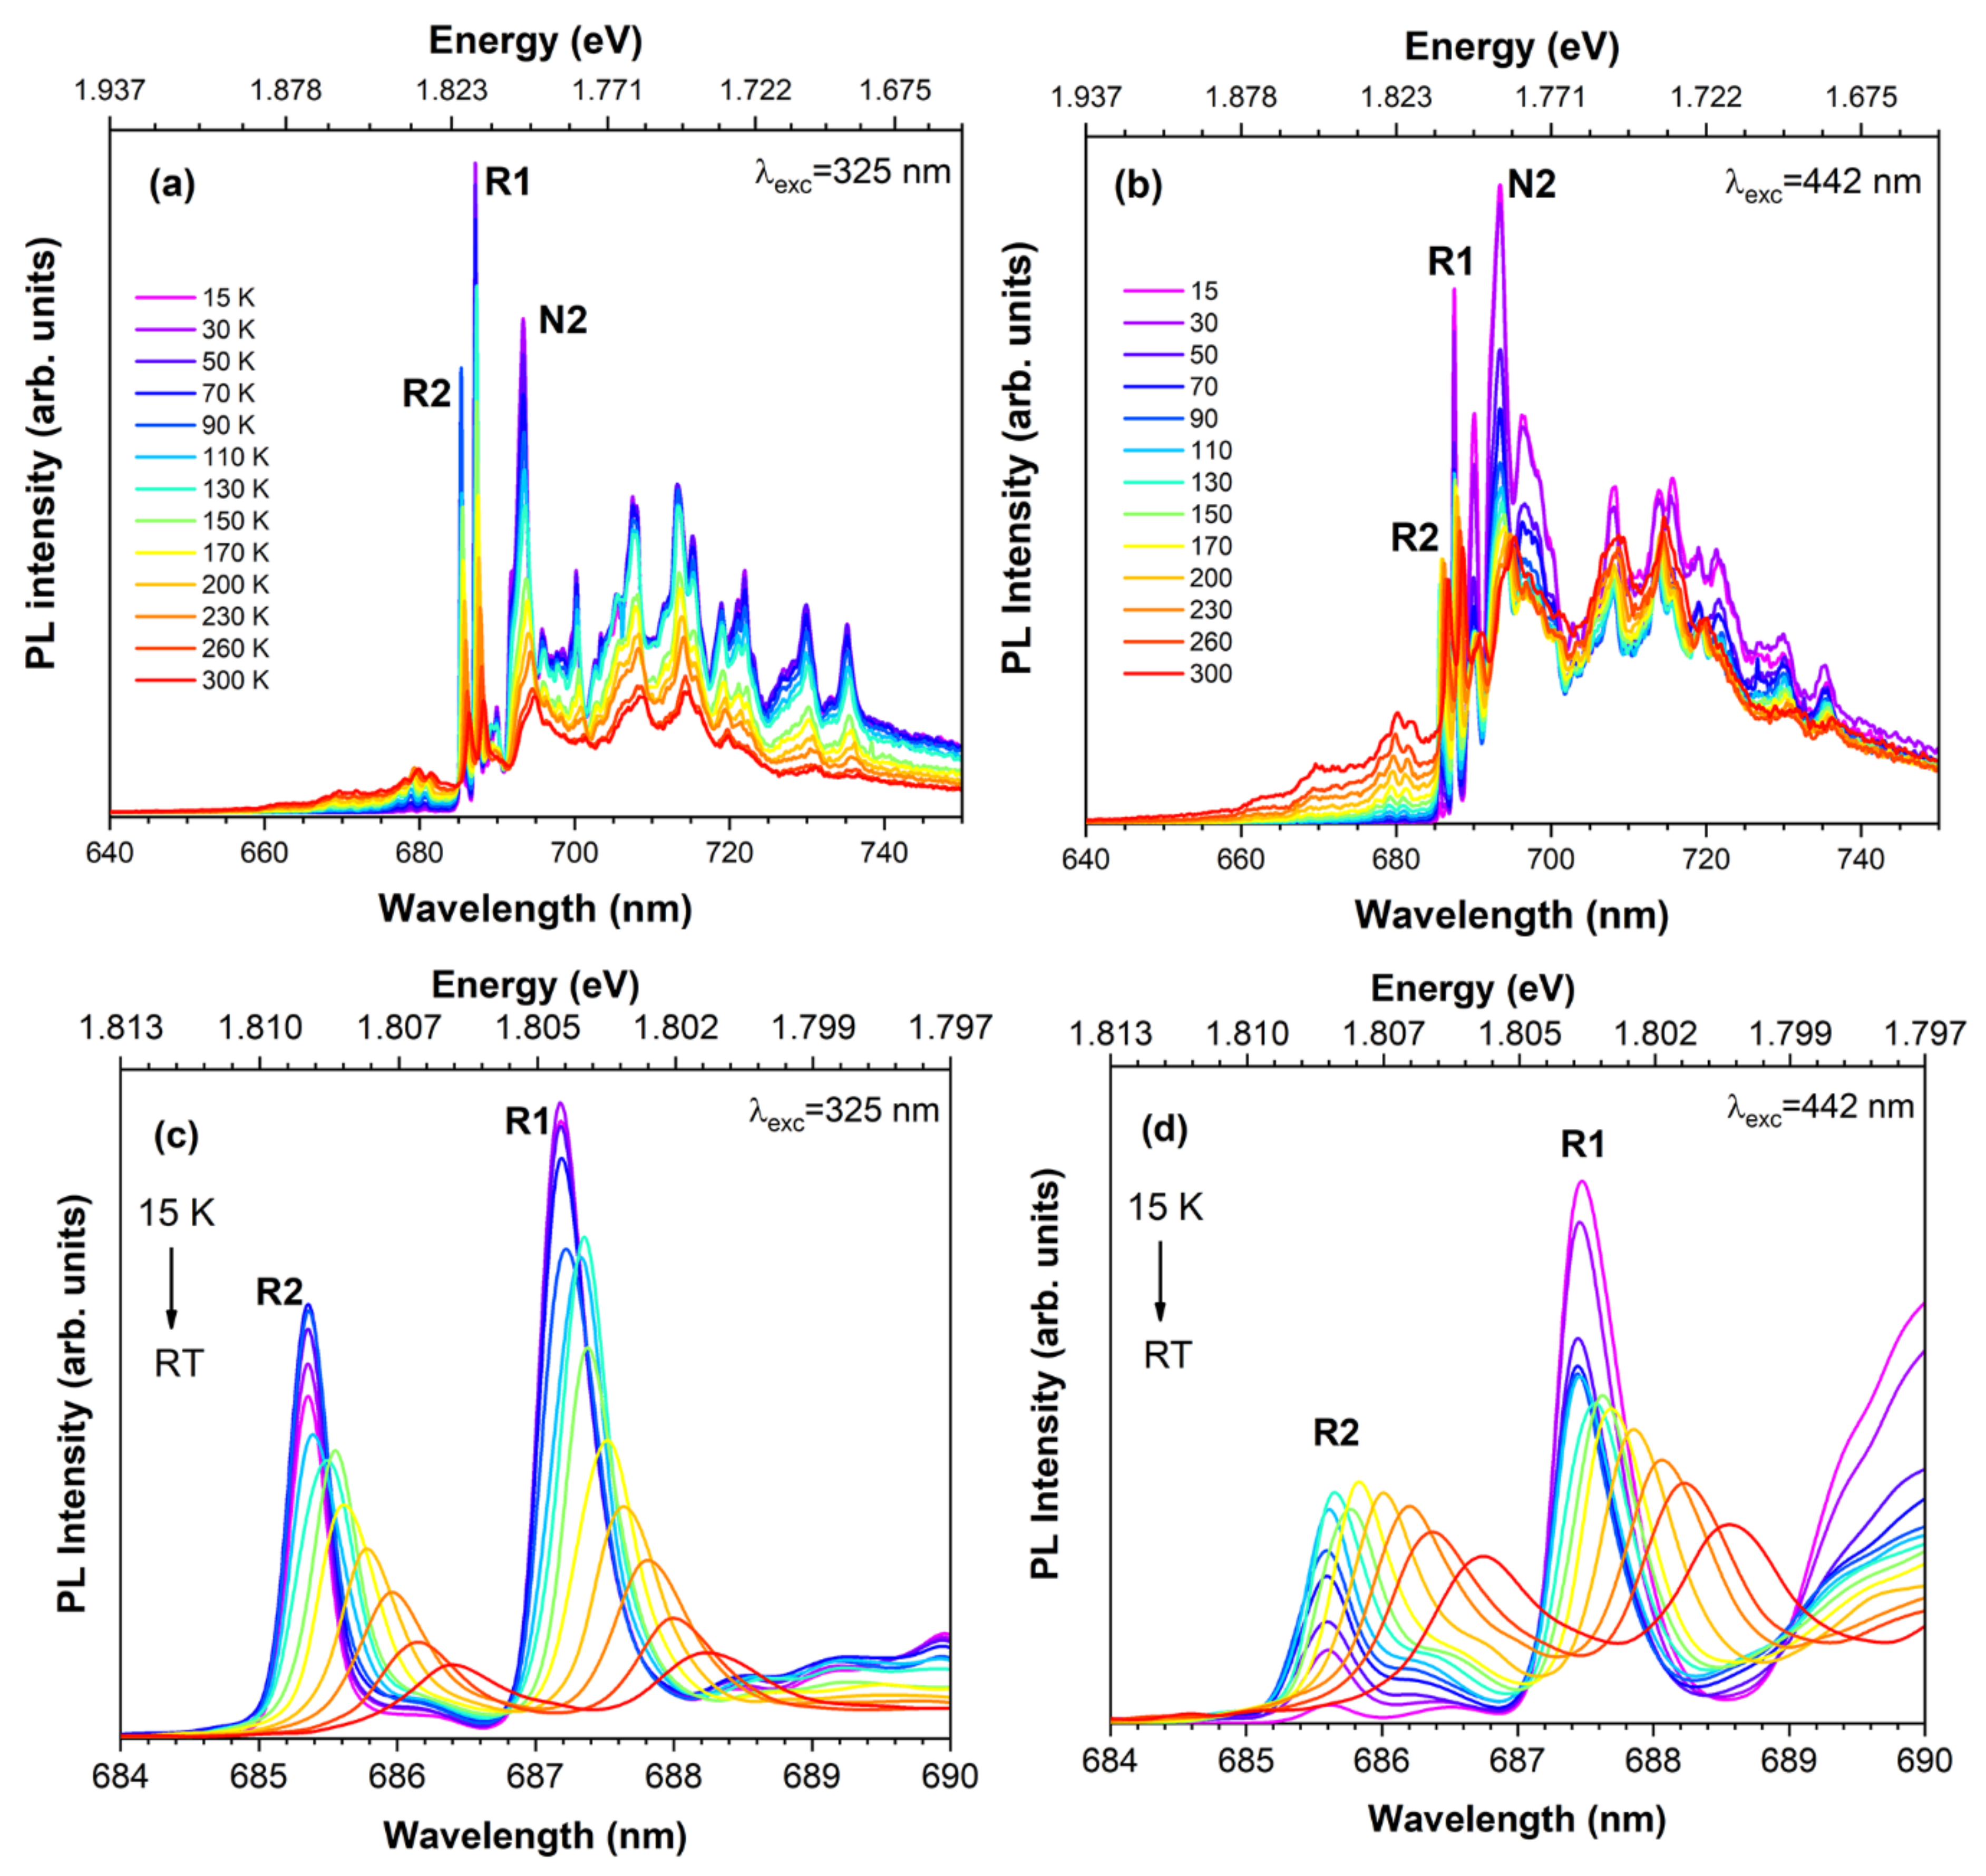
3.3. The 15 K PL: Site-Selective Excitation

Most of the recently published works on the persistent luminescence of the chromium ion in the trivalent state in the ZGO and ZGGO lattices refer to the behaviour observed at RT [7,8,9,10,11,22,23,24,25]. However, the identification of optically active centres and their correlation with intrinsic/extrinsic defects requires the use of cryogenic temperatures and only a few works have been reported so far [9,10,11,18,22]. To clarify if, in addition to the two Cr3+ environments identified at RT (by the R- and N2-lines), there are further Cr3+-related optical centres in the red/NIR spectral region, the samples were cooled down to 15 K. Figure 6 shows the low-temperature Cr3+ PL spectra obtained upon excitation with different wavelengths for the studied ZGGO:Cr sample. The spectrum acquired for the ZGO:Cr sample under 325 nm excitation was also added to the figure for comparison. Besides the R- and N2-lines, the spectra exhibit a complex vibronic structure in the lower energy region that hampers individual classification of the vibronic progression due to spectral overlapping. However, it is also identified from Figure 6 that the spectral position and relative intensity of the lines are dependent on the used excitation wavelength.
Figure 7 shows the highly resolved 15 K PL spectra in the spectral range of the R2- to N2-lines. By varying the wavelength excitation, a set of lines can be discerned that clearly show the presence of more than two optical centres in the samples under study. Firstly, and comparing the spectra of the ZGO:Cr and ZGGO:Cr samples obtained under the same excitation conditions (325 nm photons), it can be seen that the position of the R-lines in ZGGO:Cr is slightly shifted towards lower energies, as indicated in Table 2. This is a compelling indication that the environment/distortion of the Cr3+ emitting ions in ZGGO is distinct from the one observed on ZGO. Additionally, for the case of the ZGGO:Cr samples, the relative intensity of the R-lines was found to be strongly sensitive to the used wavelength excitation conditions, indicating that there are preferential excitation mechanisms of the different Cr3+-emitting centres. In all cases, the energy separation of the R-lines is ~5 meV, in agreement with previously reported values for the unfolding of the E 2 state due to the crystal field effect and spin–orbit interaction and the calculated activation energies for the lines thermalization, as described below [11,20,25]. The spectral comparison further suggests that the chromium-doped ZGGO samples also exhibit chromium optical centres with the same environment as those observed in ZGO. However, the preferential excitation mechanism of these centres is now accomplished by intraionic absorption rather than by high-energy photons, in line with the PLE measurements, as depicted in Figure 4a Besides the R-lines and vibronic progression, luminescence features peaked at the same spectral position of the N1- and N2-lines reported by van Gorkom et al. [22] were also observed.

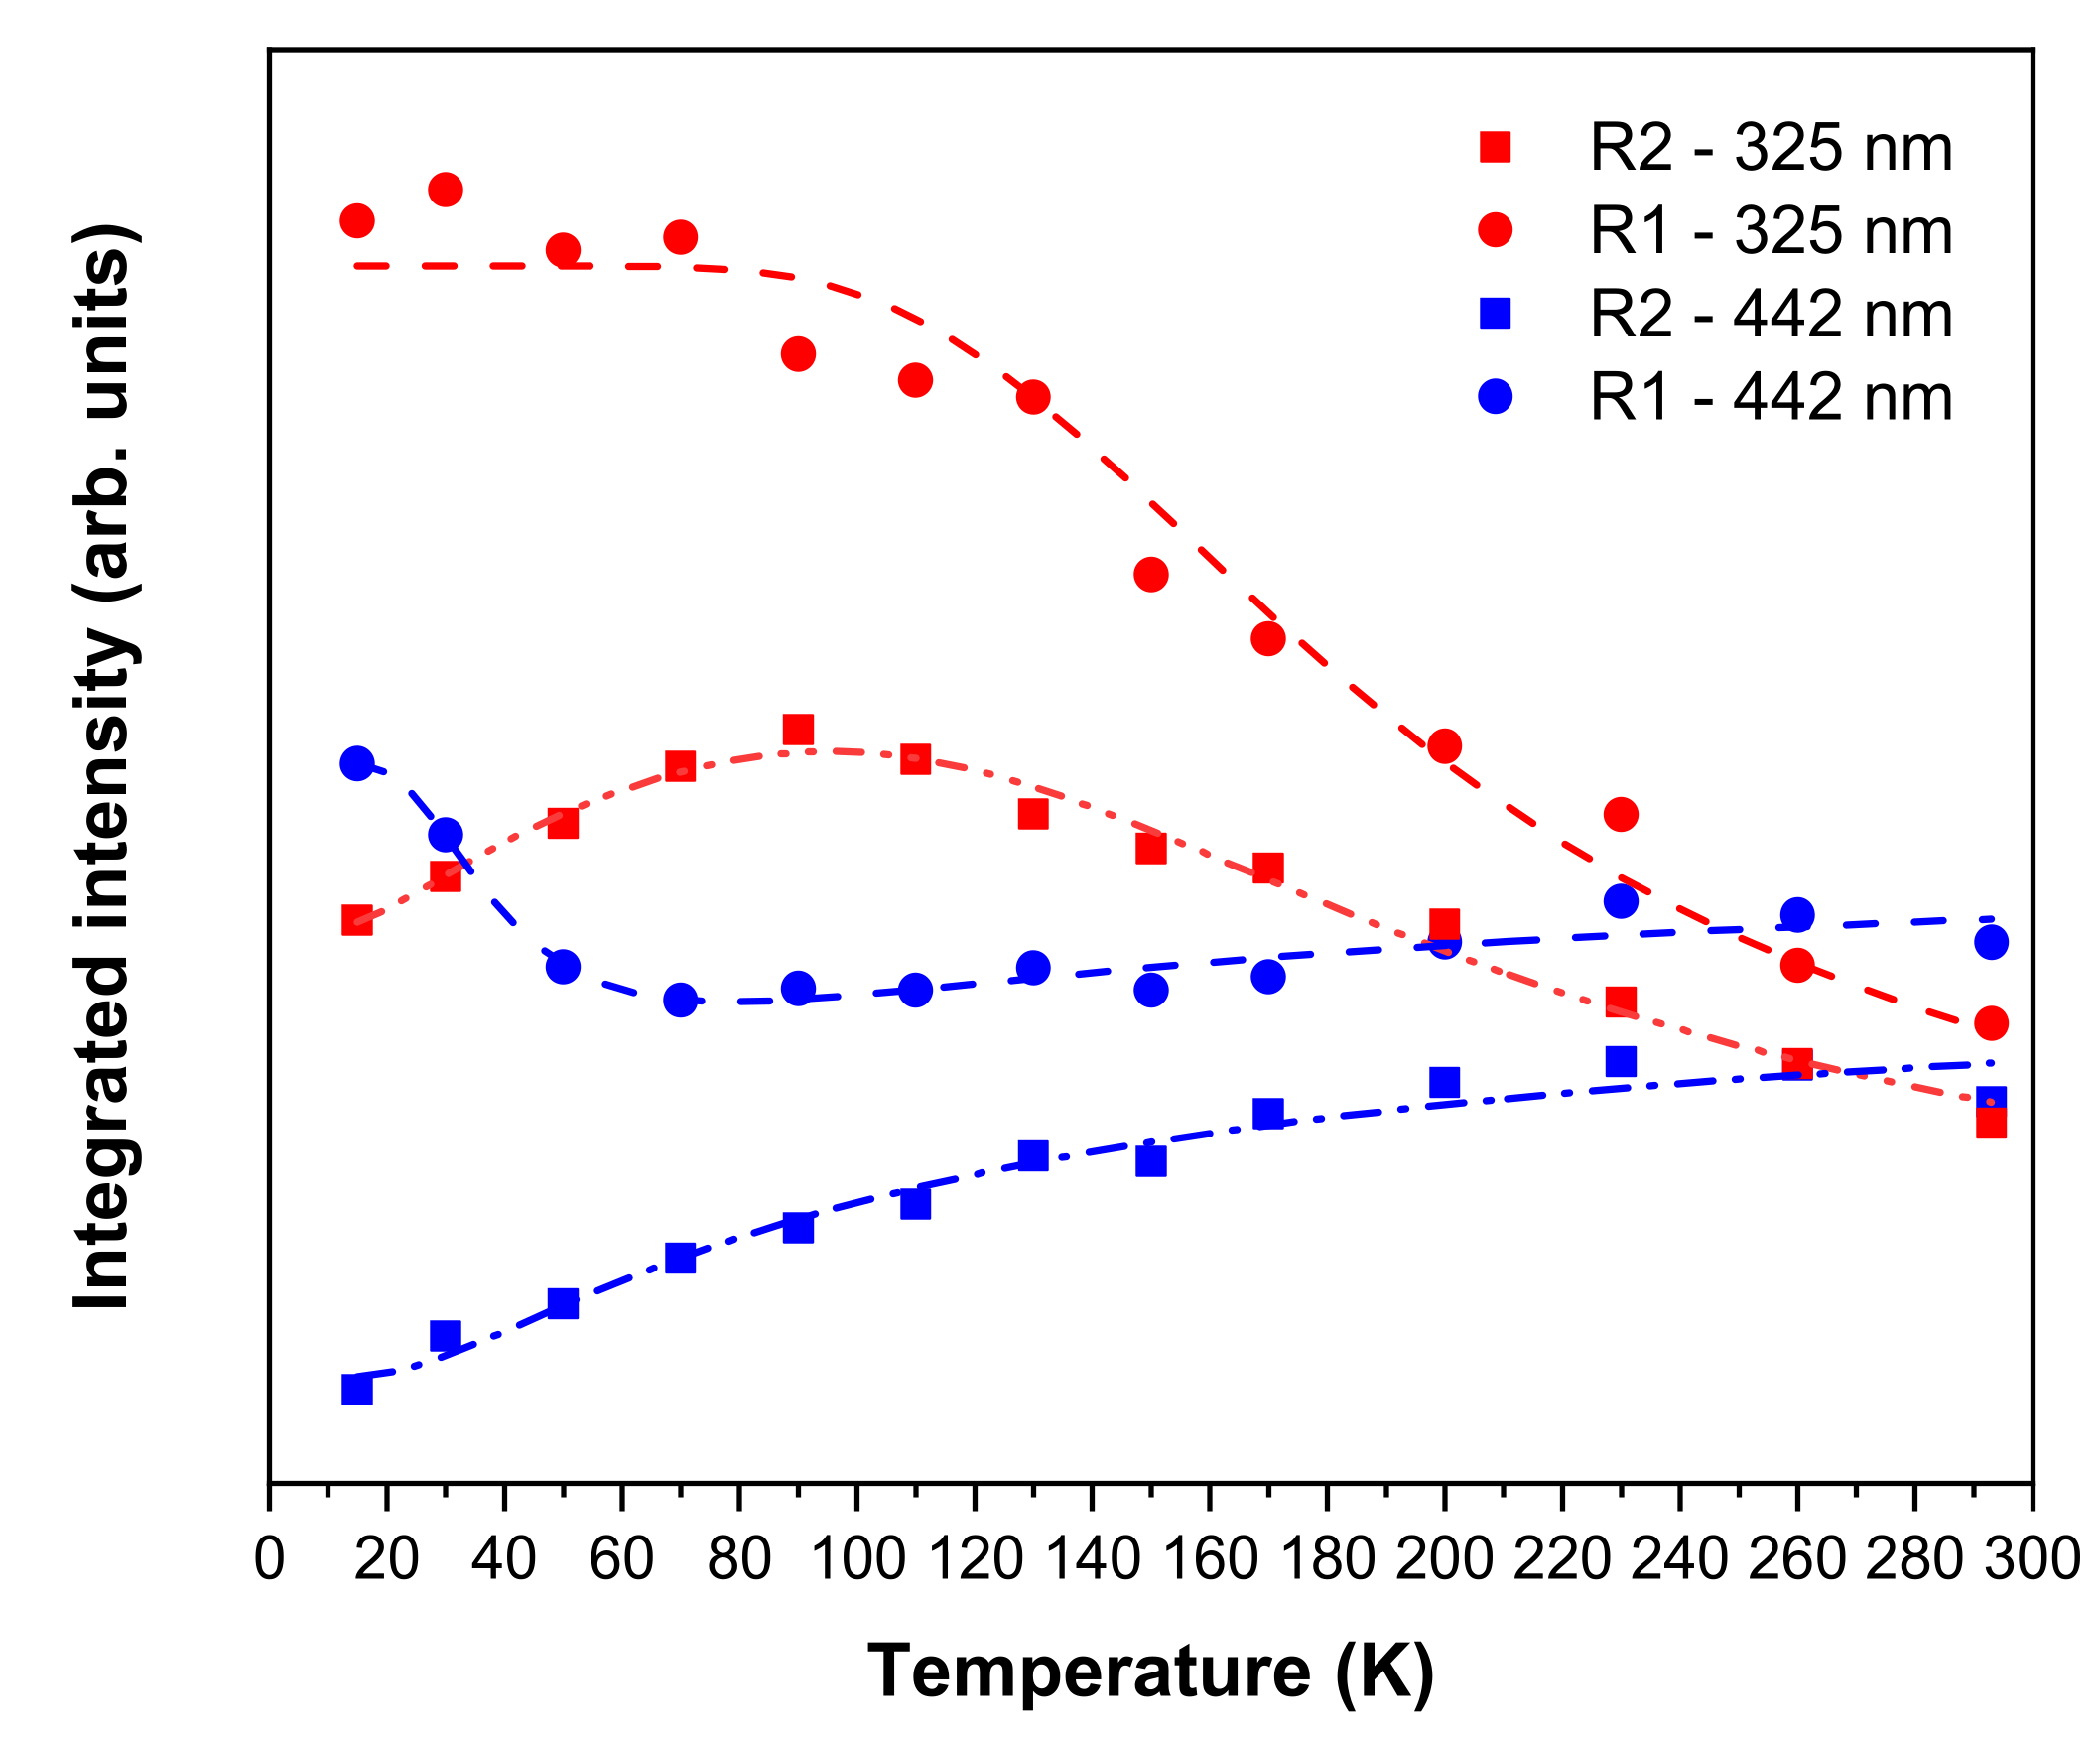
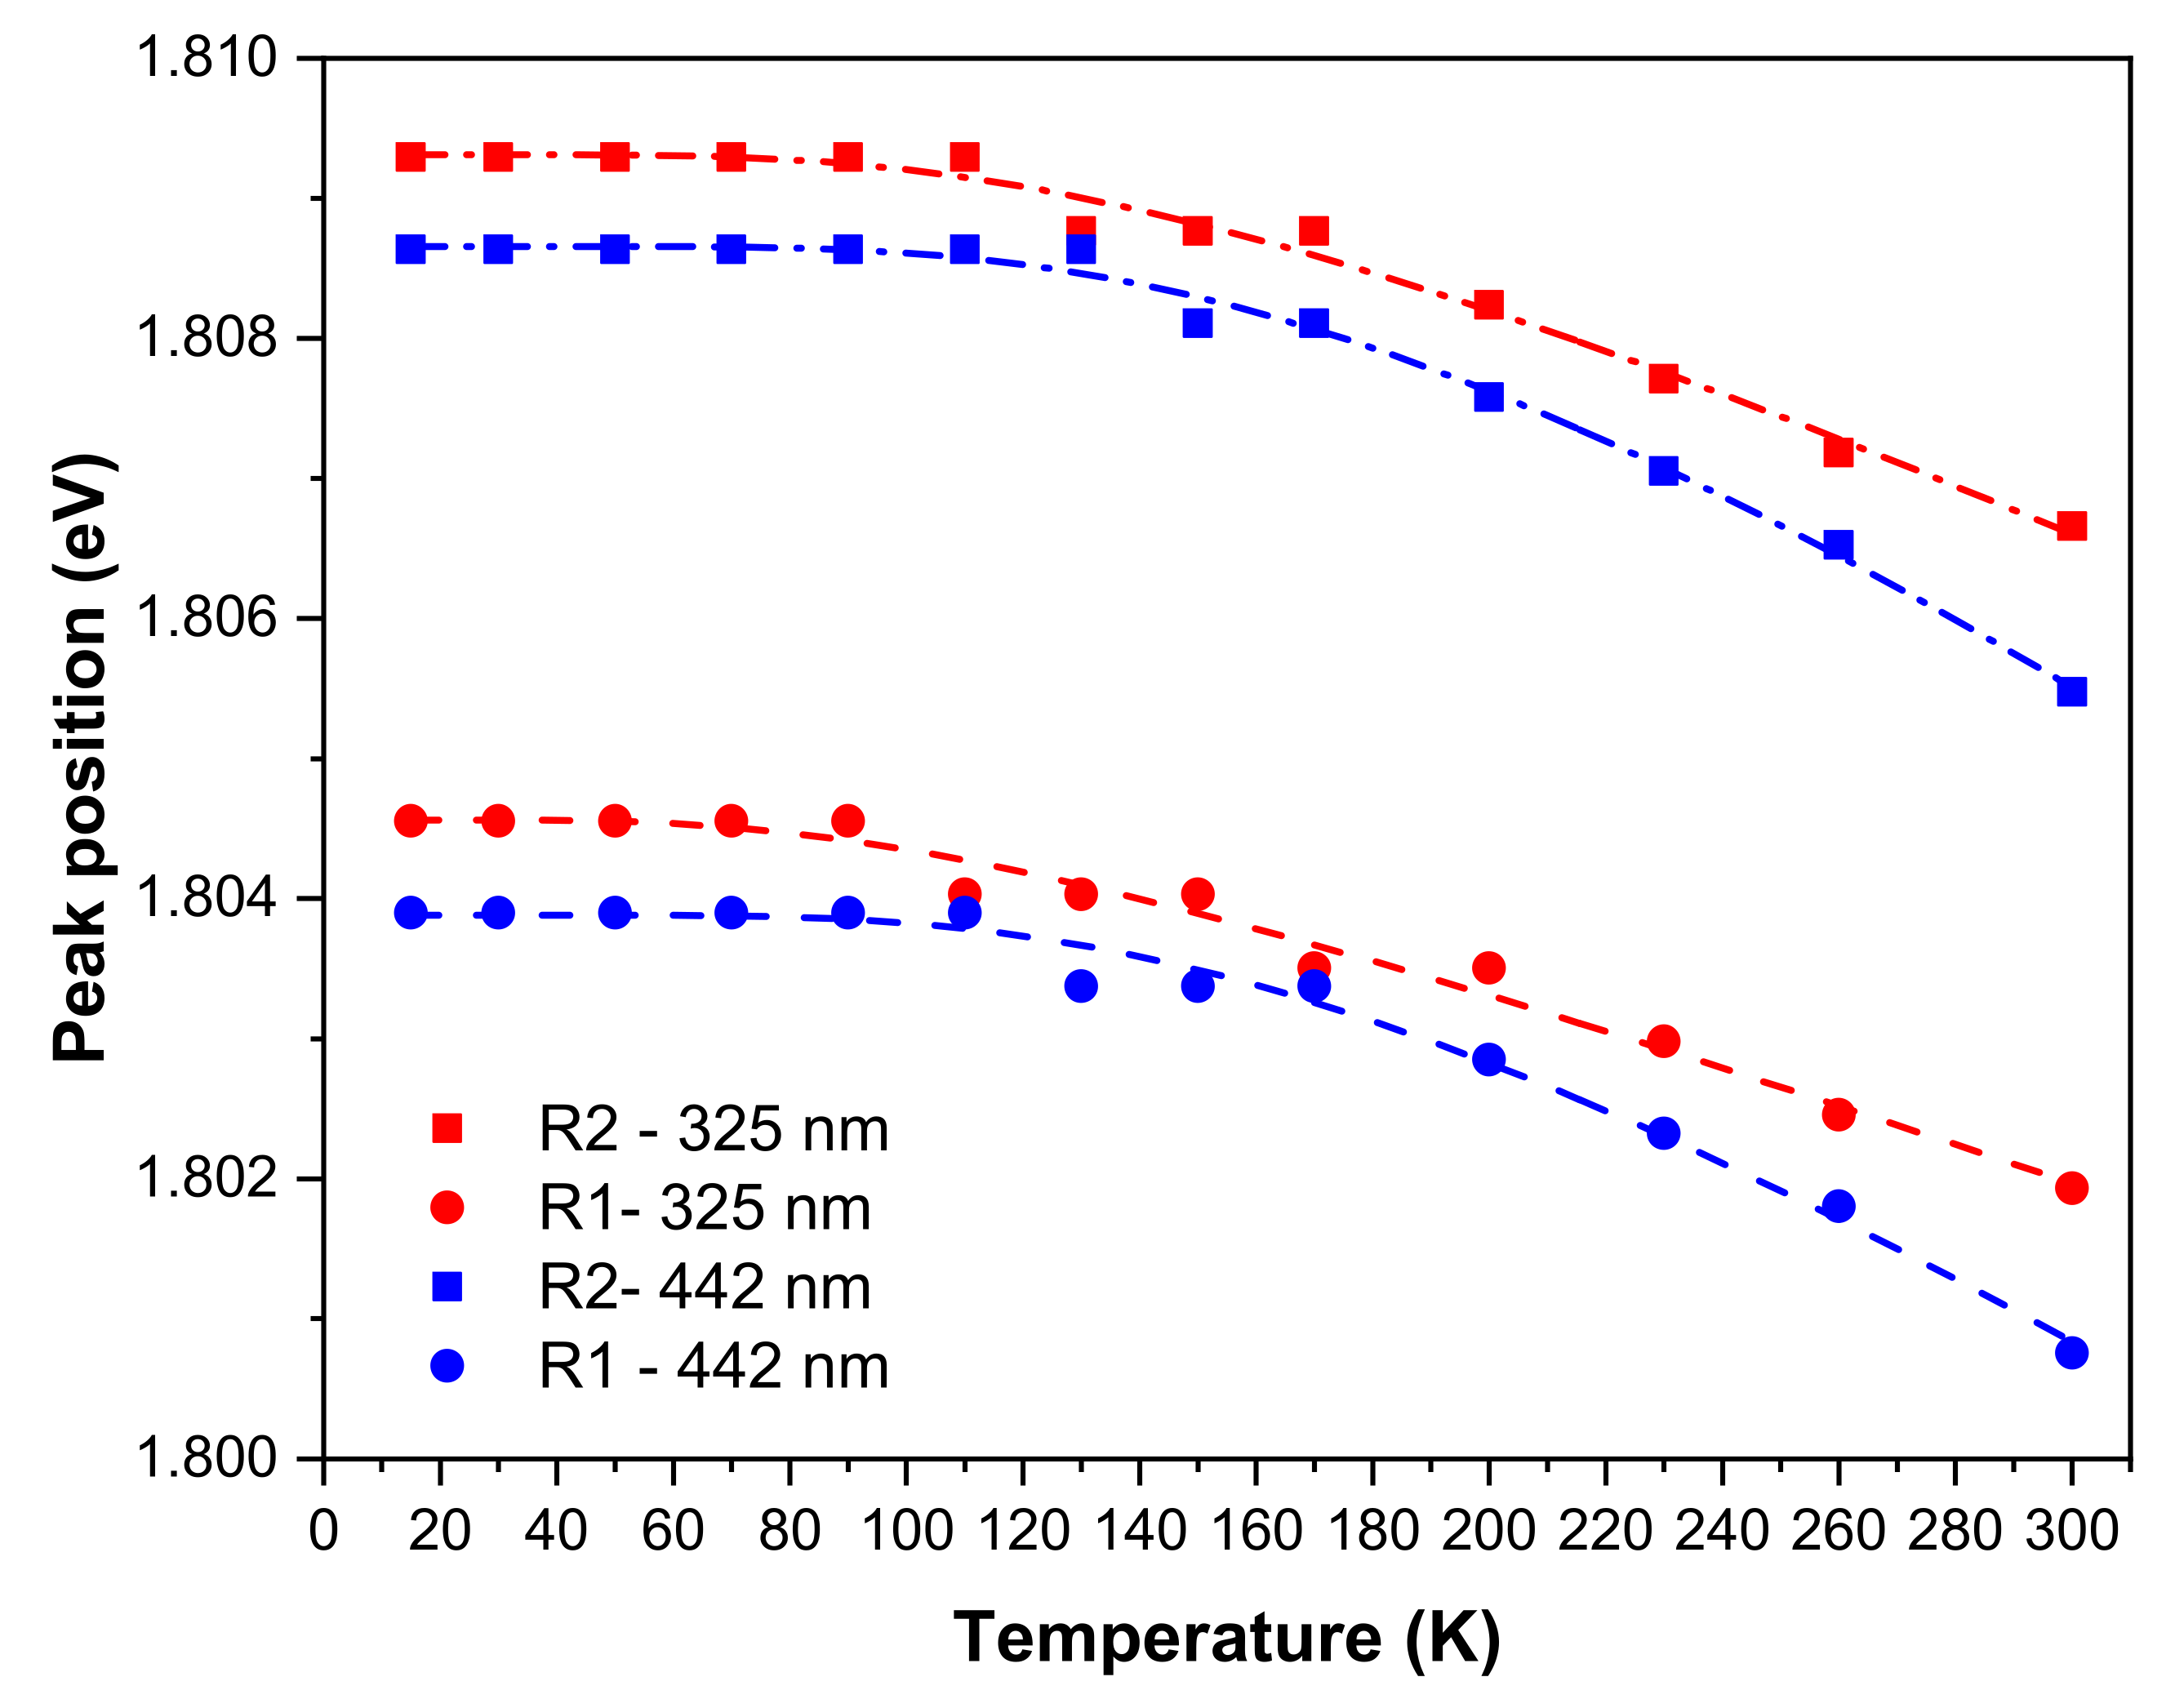
3.4. Temperature-Dependent PL

Figure 8a,b illustrate the temperature dependence of the Cr3+ emission observed in a ZGGO:Cr sample obtained upon excitation in the defect absorption band (325 nm) and intraionic A 4 2 T 4 1 transition (442 nm). For both cases, a noticed thermally populated anti-Stokes emission is observed with increasing temperature. Additionally, a low-energy shift of 2.6–3.0 meV for the R- and N-lines peak position is seen occurring with increasing temperatures from 15 K to RT, accompanied by line broadening due to the contributions of strain and impurity phonon coupling. By using 325 nm of excitation, the overall intensity of the superposed Cr3+-emitting centres decreases in the studied temperature range, reaching a RT value of 45% of its original value at 15 K. On the contrary, upon intraionic excitation on the A 4 2 T 4 1 absorption band (442 nm), the intensity of the overall emission decreases between 15 K and 90 K and then increases for higher temperatures, likely due to thermal population mechanisms. The overall intensity at RT corresponds to 95% of its original value at 15 K. This behaviour also supports the presence of multiple Cr3+-related optical centres, as well as provides information about the existence of different thermal de-excitation paths under the different wavelength excitation conditions employed. Moreover Figure 8c,d also show a distinct temperature behaviour for the integrated intensity of the R-lines when the excitation is performed either by 325 nm or 442 nm photons. In particular, and as shown in Figure 9, using 325 nm of excitation, the intensity of the R1-line decreases over the entire temperature range, while the R2-line intensity increases up to about 100 K and decreases thereafter likely due to further non-radiative processes. Under intraionic A 4 2 T 4 1 excitation (442 nm), the intensity of the R1-line decreases appreciably up to 60 K and then evidences a slight increase up to RT. At this excitation, the intensity of the R2-line always increases in the temperature range assessed. The observed behaviour reveals the spectral complexity of the presence of several optically active Cr3+ in the ZGGO host that emit in almost the same spectral region and are excited by close energies. Furthermore, the increase in the intensity of the R-lines indicates the existence of thermal populating processes between the different optical centres.
The temperature behaviour of the R1- line intensity, depicted in Figure 9 when excited with 325 nm can be well accounted for by assuming that the non-radiative competitive processes involved in its temperature dependence are described by the classical Mott model [34,35],
I T I 0 = 1 1 + C exp   E a / k B T
where T is the absolute temperature, I0 the intensity at low temperature (15 K), C corresponds to the ratio of the electronic levels’ effective degeneracies, kB is the Boltzmann constant, and Ea represents the activation energy for the non-radiative processes. On the other hand, in the case of the R2-line excited with the same wavelength, the following model should be considered [34,35],
I T I 0 = 1 + C p o p exp   E a _ p o p k B T 1 + C d e p o p exp   E a _ d e p o p / k B T
which describes both the increase and decrease of the intensity with increasing temperature. E a _ p o p corresponds to the activation energy for the population of the R2 level and E a _ d e p o p stands for the activation energy that describes the observed thermal quenching. The values obtained for the best fit to the proposed models are listed in Table 3. The value of ~4.8 meV is in good agreement with the energy separation of the R-lines mentioned above (Table 2), indicating that thermalisation occurs between the two electronic levels and thus the R2 becomes thermally populated at the expense of the R1 up to ~90 K. Above this temperature, the two levels behave as one, as attested by the similar activation energy estimated for the depopulation processes (~47 meV).
When the sample is excited with 442 nm (blue symbols in Figure 9), both lines can be accounted for by the model of Equation (2), assuming no depopulation processes in the case of the R2-line, that is, only a thermal population assuming a Boltzmann function is considered. In this case, the thermal population of the R1-line is well accounted for with an activation energy of ~15 meV, whereas it depopulates with an activation energy of ~10 meV. In the case of the R2-line, the thermal population is described by an activation energy of ~8 meV. The schematic representation in Figure 10 illustrates the phenomena occurring in these population/depopulation processes.
As mentioned before, the R-lines are seen to widen and shift their peak position to lower energies with increasing temperature, as shown in Figure 11. This effect can be described by the electron–phonon coupling between the impurity levels and the lattice phonons. Accordingly, considering a simplified model where the energy shift is proportional to the phonon population number, the temperature dependence of the peak position, E T , can be approximated to [11,34],
E T   = E R 0 β e x p ω ¯ / k B T 1
where E 0 is the line energy at 0 K, A corresponds to a proportionality factor, ω ¯ is the energy of the phonons involved, is the reduced Planck constant, k B is the Boltzmann constant, and T is the absolute temperature. Table 4 indicates the parameters obtained for R-lines best fit to Equation (3).
As a result, with 325 nm excitation, the energy of the phonons involved and β values are similar to the ones measured in ZGO:Cr pellets, being, however, reversed relatively to the R1- and R2-lines, meaning that a distinct vibrational coupling is observed in the here-studied ZGGO:Cr. The same trend is observed for the effective Debye temperature, which can be estimated by T D = ω ¯ / k B [34], resulting in 319 K and 449 K from the R1- and R2-lines behaviour, respectively. It is worth noting the increase of the fitted parameters when the sample is excited with 442 nm, resulting in much higher effective Debye temperatures, as indicated in Table 4. According to the measured Raman spectra (Figure 2b, Table 1), the effective phonon energies obtained from the R-lines shift when the sample is excited with 325 nm are closer to the energy modes, mainly due to the Zn ions vibrations (e.g., ZnO4 tetrahedrons) and to the one corresponding to a local lattice disorder (e.g., inverse spinel). On the other hand, when the sample is excited with 442 nm, the effective phonon energies well match the ones that are likely to contain the Ga3+ cation vibrations, suggesting that the observed behaviour is induced by the presence of the Ge ions in the alloy. Additionally, it should be emphasised that the studied ZGGO:Cr polycrystalline sample exhibits a wide range of crystallite sizes as indicated in Figure 3, explaining, therefore, the observation of distinct Debye temperatures.

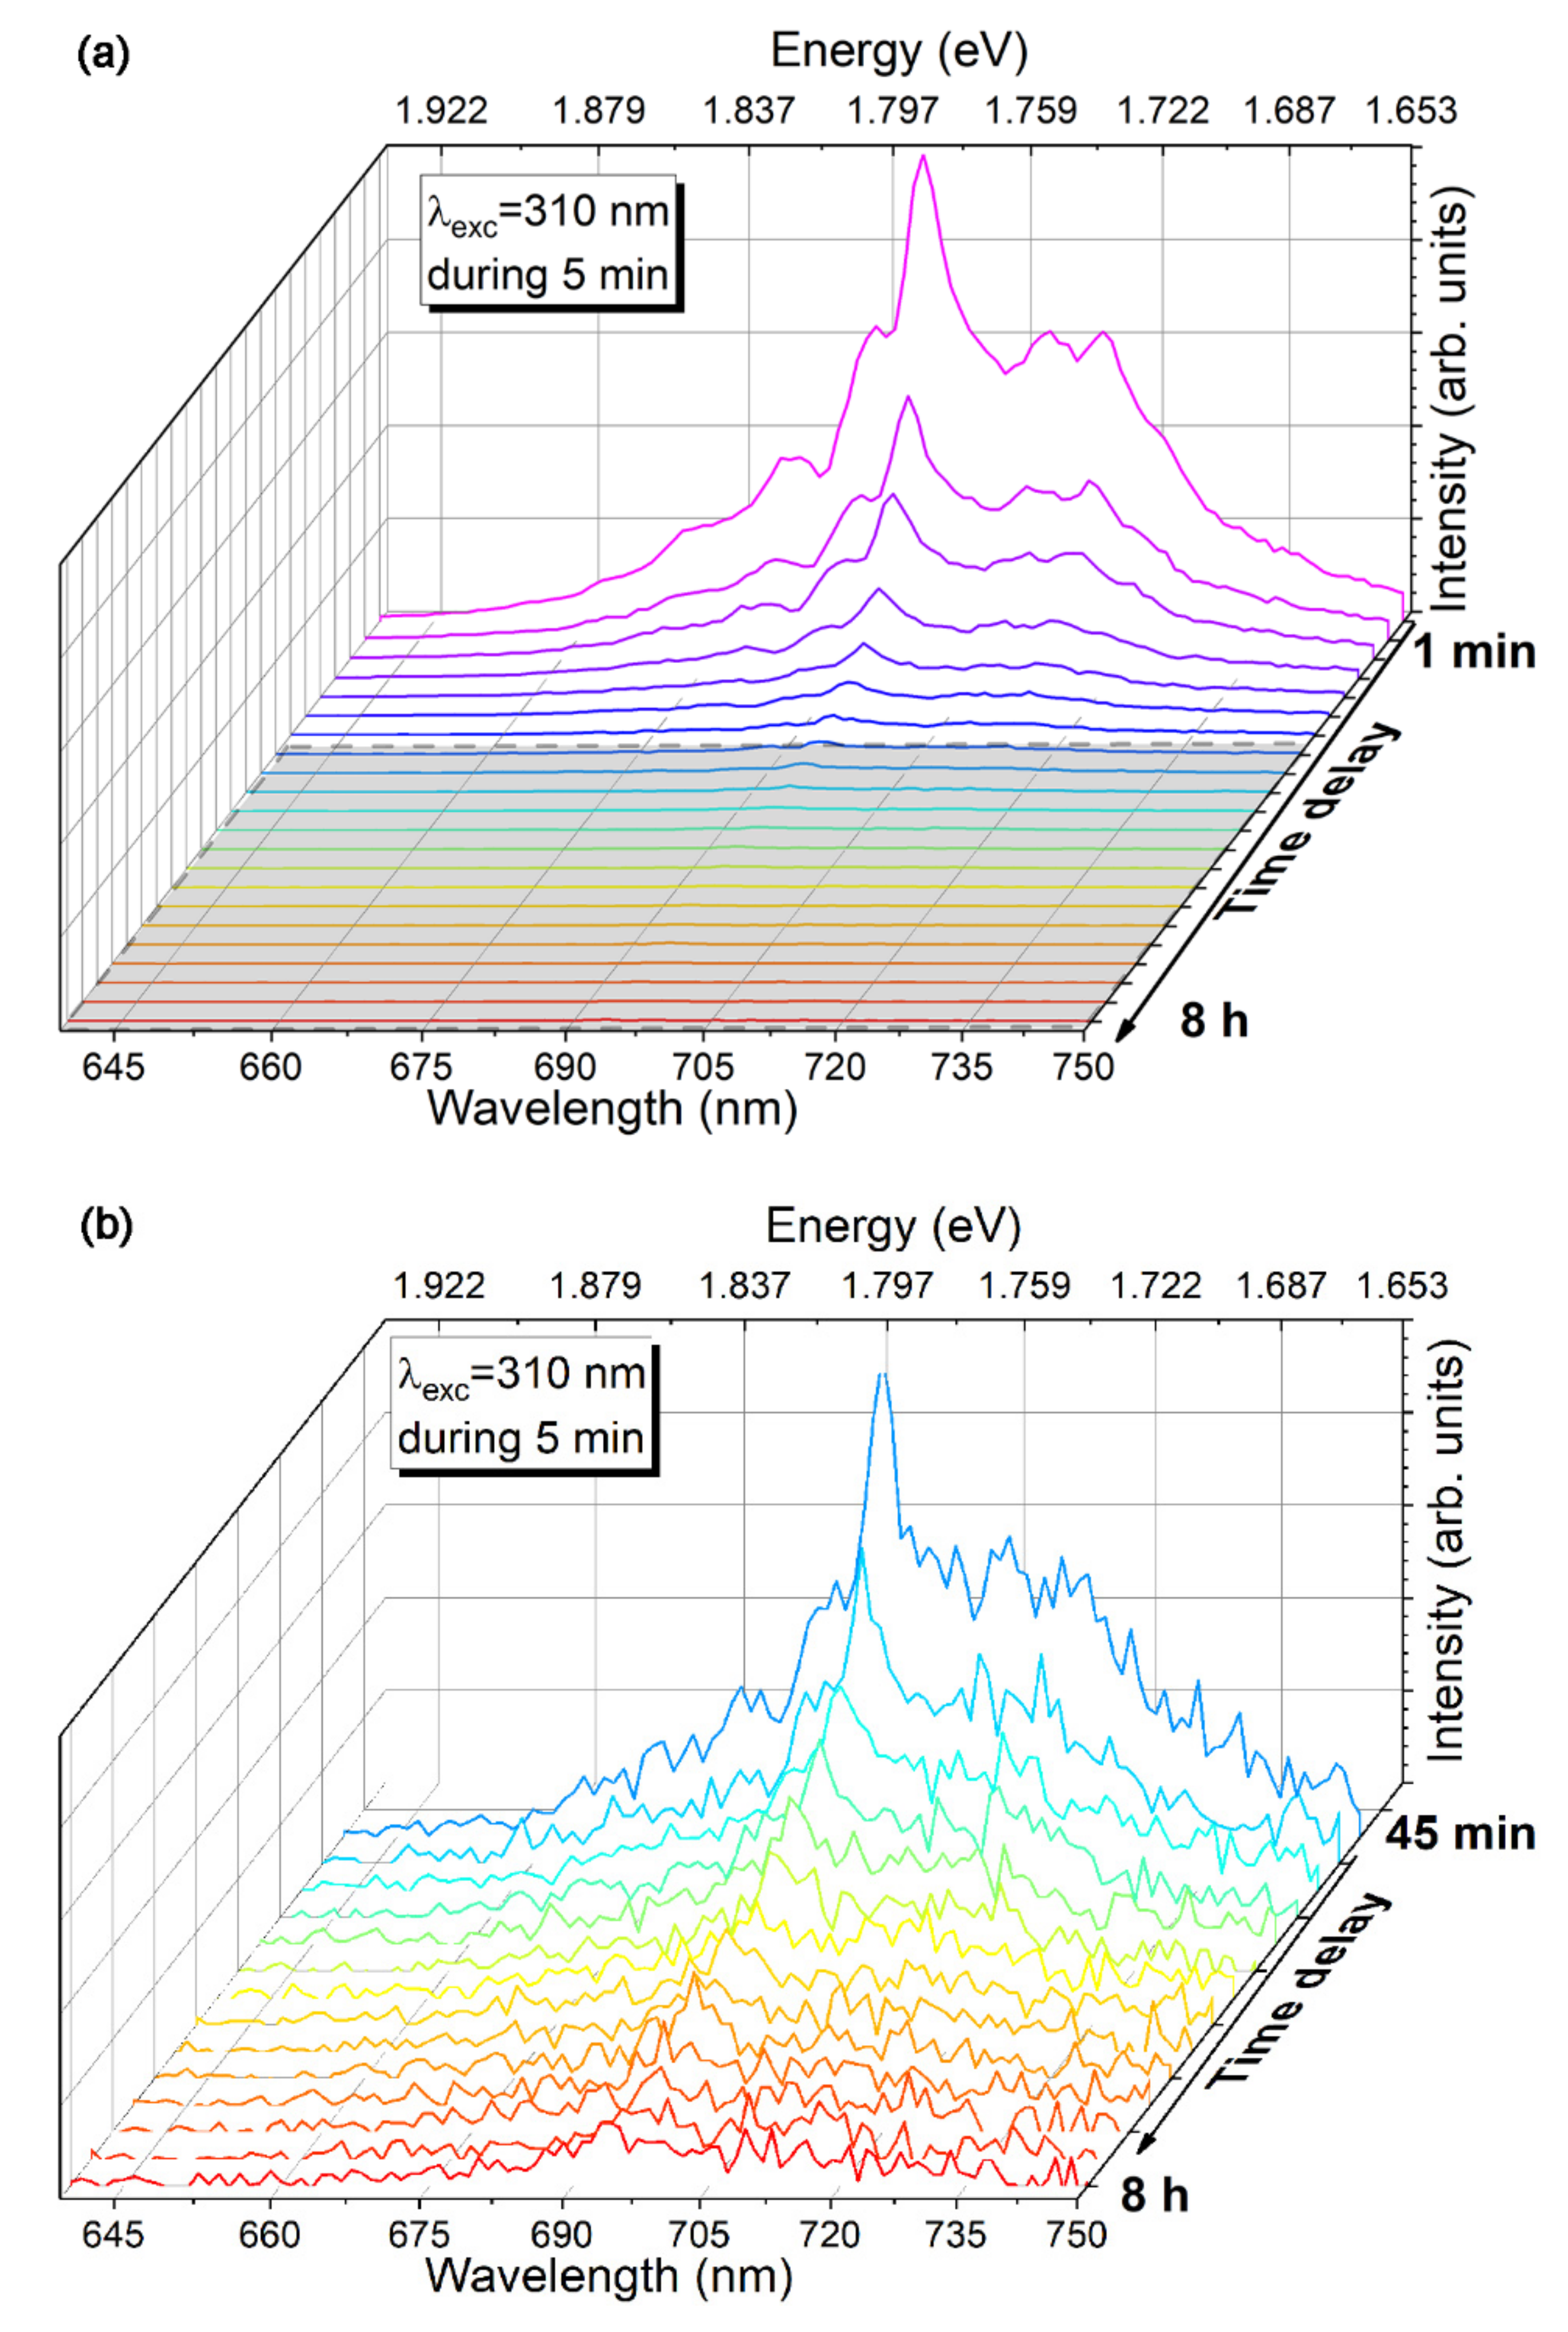
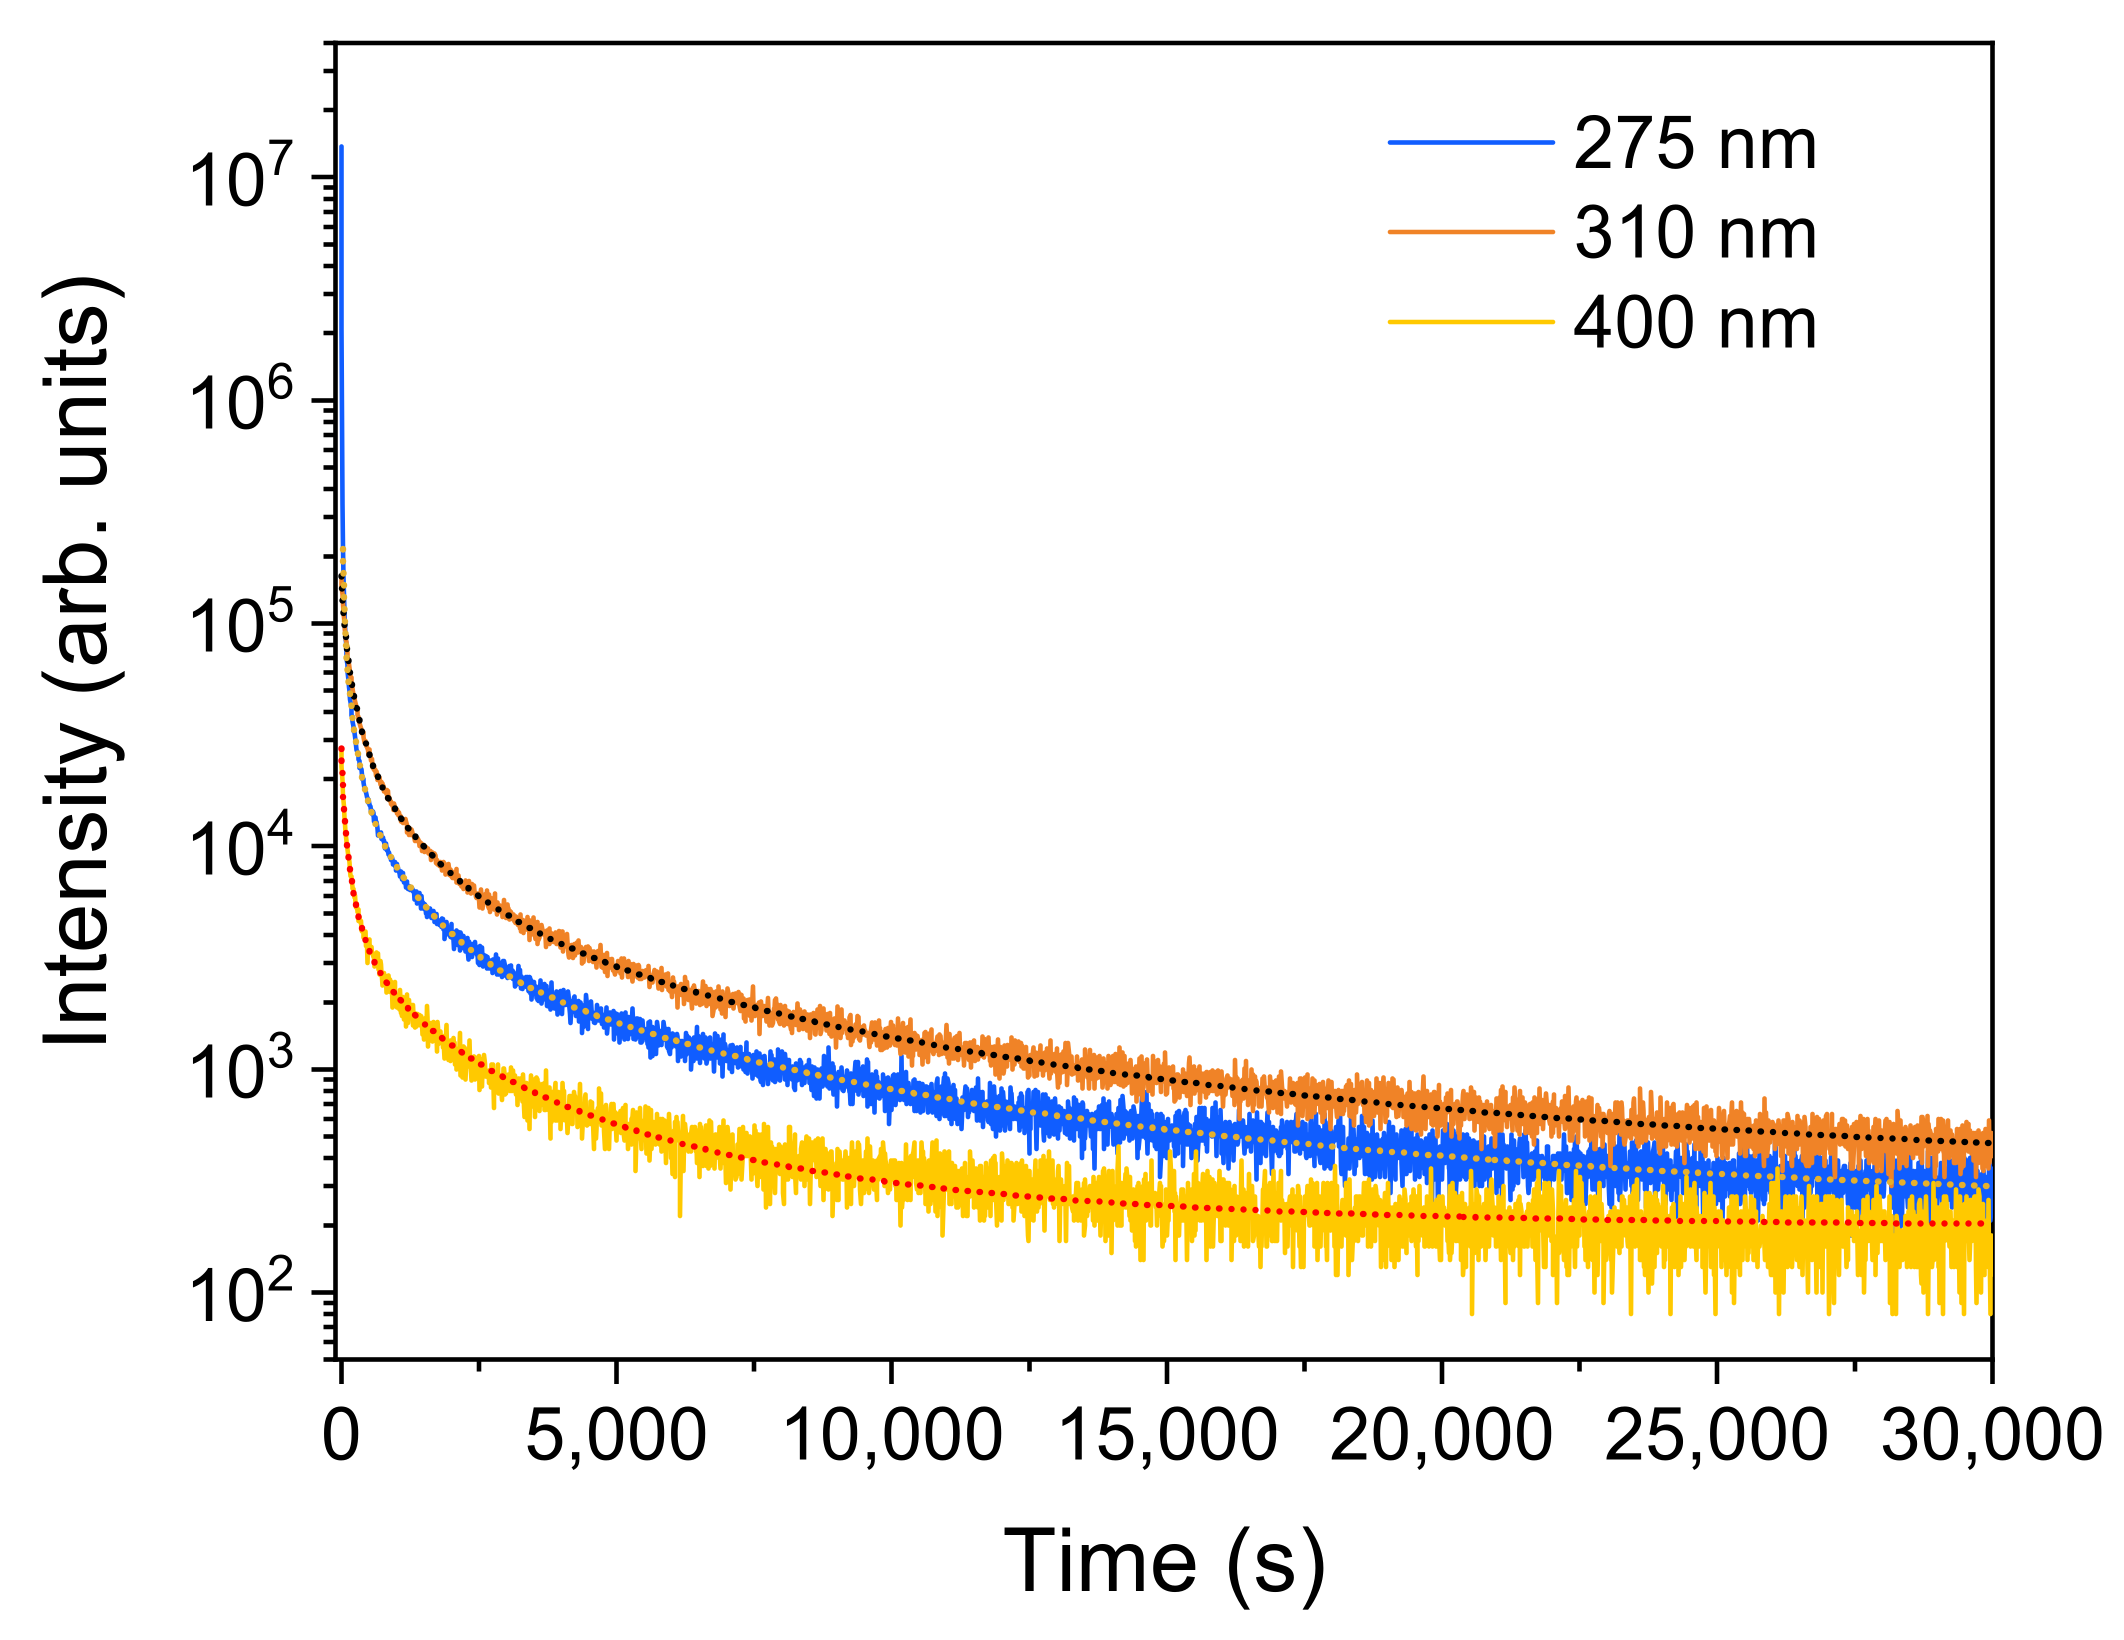
3.5. RT Persistent Luminescence

RT TRPL measurements were also conducted in the ZGGO:Cr sample to gain further insight regarding the probed emission. Figure 12 shows a comparison of the steady-state and transient PL spectra. The latter was performed using 310 nm of excitation light and delay times of 0.05 and 50 ms after the Xe pulse lamp. The transient spectra clearly evidence a longer decay time for the N2 centre than the ones that originate the R-lines.
Persistent luminescence was recorded after excitation of the sample with 310 nm of light for 5 min. Figure 13 shows the persistent luminescence spectra measured upon switching off the excitation light, indicating that the ZGGO:Cr sample emits during almost 8 h, with the N2 defect accounting for the observed red/NIR persistent luminescence.
The wavelength excitation dependence of the persistent luminescence decays for ZGGO:Cr samples is depicted in Figure 14. During the first few minutes, the persistent luminescence intensity decreases rapidly, while over time the decrease is not so pronounced. The decay curves were fitted to a combination of stretched exponentials with dispersion factors varying between 0.4 and 0.9, implying that a wide distribution of the defect trap levels is available for the carriers capture [36]. The following expression was employed for the fittings [36]
I T   = i = 1 n I i e δ i t τ i
where 0 < δ < 1 denotes the dispersion factor (δ = 1 is equivalent to the simple exponential decay) and n = 4 in the case of the decay acquired after the initial excitation with 310 nm and with 275 nm, while n = 2 for the 400 nm case.
As stated above, persistent luminescence relies upon the capture and release by the defect traps of photoexcited charge carriers. As demonstrated, a ZGGO:Cr sample can absorb photons by band-to-band transitions, as well as by defect levels and via the excited states of Cr3+. Persistent luminescence is observed under all the excitation conditions, meaning that all excitation/de-excitation processes involve traps of charge carriers that store energy, further depopulated by a thermal activation process that is able to feed the emitting levels of Cr3+. Therefore, different hypotheses should be considered. First (i), upon band-to-band excitation, an electron–hole pair is generated, resulting in the formation of a self-trapped exciton in the defective ZGGO:Cr host, giving rise to a broad emission band peaked at 348 nm/3.56 eV (see the solid blue line inFigure 4a). The released energy is resonantly transferred to the Cr3+ optical centres, exciting the electrons from the fundamental to higher excited levels, followed by non-radiative relaxation, resulting in the characteristic E 2 A 4 2 Cr3+ red/NIR intraionic emission. Additionally (ii), persistent PL was also observed using below bandgap excitation, which is likely to be due to the presence of defects and distinct Cr3+ optical centres. Therefore, under these conditions and from the measured persistent luminescence decay, it is fair to assume that the photogenerated carriers can be trapped by a wide distribution of shallow and deep trap centres, including the Cr3+ cluster defects, from which the carriers are released by a tunnelling mechanism and/or a thermally activated process, preferentially to the N2 Cr3+-related centre.

4. Conclusions

Zn1+xGa2−2xGexO4:Cr doped with 0.5% molar of chromium and with x = 0.1 synthesised by a solid-state reaction during 36 h at 1350 °C exhibits a single ZGO crystalline cubic spinel phase, as demonstrated by XRD. According to the group theory, five vibrational modes at the zone centre were identified by Raman spectroscopy for the mentioned ideal structure. An additional mode was observed at 270 cm−1 that was assigned to local lattice disorder effects, including inverse spinel. When excited with above and below bandgap excitation, the main recombination processes observed at RT in ZGGO:Cr corresponds to the red/NIR Cr3+ luminescence with the ions placed at substitutional sites and to the N2 Cr-related complex defects. An additional broad emission band peaked in the ultraviolet region was also observed upon band-to-band excitation. PLE monitored at the red emission indicates that the main population paths of the Cr3+ emission are achieved by photon energies corresponding to the ion excited levels, as well as by a defect absorption band and the band edge absorption. The width of the excitation bands suggests a spectral overlap of the excited energy levels involved in populating the emitting ones for the different defects. From the comparison of the diffuse reflectance and PLE spectra, a RT bandgap energy of 4.82 eV was estimated for ZGGO. Site-selective excitation and temperature-dependent PL (15 K to RT) reveal the spectral complexity of the presence of several optically active Cr3+ centres in the ZGGO host that emit almost in the same spectral region and are excited by close energies. Additionally, thermal populating processes between the different optical centres were identified by increasing the temperature, supporting the widespread of energy levels in the doped host that may be able to trap carriers as measured by the RT persistent luminescence decay. The peak position of the R-lines was seen to be dependent on the temperature, the behaviour of which can be further explored for temperature sensing applications. Furthermore, the obtained data are consistent with carriers released preferentially to the N2 Cr3+-related optical centre in the ZGGO:Cr host, from which a persistent luminescence can be measured for about 8 h after switching off the excitation light.

Author Contributions

Conceptualisation, M.S.B., J.R., F.M.C., S.O.P., and T.M.; methodology, M.S.B., M.S.R., J.R., and S.O.P.; formal analysis, M.S.B., J.R., S.O.P., and T.M.; investigation, M.S.B., J.R., M.S.R., J.Z., A.V.G., and S.O.P.; writing—original draft preparation, M.S.B. and T.M.; writing—review and editing, M.S.B., J.R., M.S.R., J.Z., A.V.G., A.P., F.M.C., S.O.P., and T.M.; supervision, J.R., S.O.P., and T.M. All authors have read and agreed to the published version of the manuscript.

Funding

This work was developed within the scope of the project i3N UID-B/50025/2020 & UID-P/50025/2020, and CICECO (UID-B/50011/2020+UID-P/50011/2020), financed by national funds through the FCT/MEC. This work was also developed in the scope of the project PTDC/CTM-CTM/3553/2020 (DEOFET).

Institutional Review Board Statement

Not applicable.

Informed Consent Statement

Not applicable.

Data Availability Statement

Data is available upon request.

Acknowledgments

M. S. Batista thanks i3N and FCT for the PhD grant (SFRH/50025/2021). J. Zanoni thanks the DEOFET project for the PhD grant (Ref BI 23 16124 2021). The research contract of A. V. Girão thanks the received funding by national funds, through FCT, in the framework contract foreseen in article 23 of the Decree-Law 57/2016, changed by Law 57/2017. S. O. Pereira thanks i3N for the BPD grant (BPD/UI96/5808/2017). The authors also acknowledge Celeste Azevedo and Rosário Soares from CICECO for the DR and XRD measurements, respectively.

Conflicts of Interest

The authors declare no conflict of interest.

References

  1. Jiang, T.; Zhu, Y.; Zhang, J.; Zhu, J.; Zhang, M.; Qiu, J. Multistimuli-Responsive Display Materials to Encrypt Differentiated Information in Bright and Dark Fields. Adv. Funct. Mater. 2019, 29, 1906068. [Google Scholar] [CrossRef]
  2. Zhuang, Y.; Wang, L.; Lv, Y.; Zhou, T.-L.; Xie, R.-J. Optical Data Storage and Multicolor Emission Readout on Flexible Films Using Deep-Trap Persistent Luminescence Materials. Adv. Funct. Mater. 2018, 28, 1705769. [Google Scholar] [CrossRef]
  3. Wang, B.; Chen, Z.; Li, X.; Zhou, J.; Zeng, Q. Photostimulated near-infrared persistent luminescence Cr3+-doped Zn-Ga-Ge-O phosphor with high QE for optical information storage. J. Alloys Compd. 2020, 812, 152119. [Google Scholar] [CrossRef]
  4. Zhuang, Y.; Lv, Y.; Wang, L.; Chen, W.; Zhou, T.-L.; Takeda, T.; Hirosaki, N.; Xie, R.-J. Trap Depth Engineering of SrSi2O2N2:Ln2+, Ln3+ (Ln2+ = Yb, Eu; Ln3+ = Dy, Ho, Er) Persistent Luminescence Materials for Information Storage Applications. ACS Appl. Mater. Interfaces 2018, 10, 1854–1864. [Google Scholar] [CrossRef]
  5. Shi, J.; Sun, X.; Zheng, S.; Fu, X.; Yang, Y.; Wang, J.; Zhang, H. Super-Long Persistent Luminescence in the Ultraviolet A Region from a Bi3+ -Doped LiYGeO4 Phosphor. Adv. Opt. Mater. 2019, 7, 1900526. [Google Scholar] [CrossRef]
  6. Zhang, Y.; Wang, Z.-W.; Ji, X.; Wang, T.; Yang, X.-T.; Wang, H.-F. Afterglow-Catalysis and Self-Reporting of Pollutant Degradation by Ethylenediaminetetraacetic Acid Disodium-Etched Cr:ZnGa2O4. J. Phys. Chem. C 2021, 125, 9096–9106. [Google Scholar] [CrossRef]
  7. Maldiney, T.; Bessière, A.; Seguin, J.; Teston, E.; Sharma, S.K.; Viana, B.; Bos, A.J.J.; Dorenbos, P.; Bessodes, M.; Gourier, D.; et al. The in vivo activation of persistent nanophosphors for optical imaging of vascularization, tumours and grafted cells. Nat. Mater. 2014, 13, 418–426. [Google Scholar] [CrossRef]
  8. Bessière, A.; Jacquart, S.; Priolkar, K.; Lecointre, A.; Viana, B.; Gourier, D. ZnGa2O4:Cr3+: A new red long-lasting phosphor with high brightness. Opt. Express 2011, 19, 10131. [Google Scholar] [CrossRef]
  9. Bessière, A.; Sharma, S.K.; Basavaraju, N.; Priolkar, K.R.; Binet, L.; Viana, B.; Bos, A.J.J.; Maldiney, T.; Richard, C.; Scherman, D.; et al. Storage of Visible Light for Long-Lasting Phosphorescence in Chromium-Doped Zinc Gallate. Chem. Mater. 2014, 26, 1365–1373. [Google Scholar] [CrossRef]
  10. Gourier, D.; Bessière, A.; Sharma, S.K.; Binet, L.; Viana, B.; Basavaraju, N.; Priolkar, K.R. Origin of the visible light induced persistent luminescence of Cr3+-doped zinc gallate. J. Phys. Chem. Solids 2014, 75, 826–837. [Google Scholar] [CrossRef]
  11. Relvas, M.S.; Soares, M.R.N.; Pereira, S.O.; Girão, A.V.; Costa, F.M.; Monteiro, T. Trends in Cr3+ red emissions from ZnGa2O4 nanostructures produced by pulsed laser ablation in a liquid medium. J. Phys. Chem. Solids 2019, 129, 413–423. [Google Scholar] [CrossRef]
  12. Pan, Z.; Lu, Y.-Y.; Liu, F. Sunlight-activated long-persistent luminescence in the near-infrared from Cr3+-doped zinc gallogermanates. Nat. Mater. 2012, 11, 58–63. [Google Scholar] [CrossRef] [PubMed]
  13. Allix, M.; Chenu, S.; Véron, E.; Poumeyrol, T.; Kouadri-Boudjelthia, E.A.; Alahraché, S.; Porcher, F.; Massiot, D.; Fayon, F. Considerable Improvement of Long-Persistent Luminescence in Germanium and Tin Substituted ZnGa2O4. Chem. Mater. 2013, 25, 1600–1606. [Google Scholar] [CrossRef]
  14. Ren, J.; Xu, X.; Zeng, H.; Chen, G.; Kong, D.; Gu, C.; Chen, C.; Liu, Z.; Kong, L. Novel Self-Activated Zinc Gallogermanate Phosphor: The Origin of its Photoluminescence. J. Am. Ceram. Soc. 2014, 97, 3197–3201. [Google Scholar] [CrossRef]
  15. Omata, T.; Ueda, N.; Ueda, K.; Kawazoe, H. New ultraviolet-transport electroconductive oxide, ZnGa2O4 spinel. Appl. Phys. Lett. 1994, 64, 1077–1078. [Google Scholar] [CrossRef]
  16. Chikoidze, E.; Sartel, C.; Madaci, I.; Mohamed, H.; Vilar, C.; Ballesteros, B.; Belarre, F.; del Corro, E.; Vales-Castro, P.; Sauthier, G.; et al. p-Type Ultrawide-Band-Gap Spinel ZnGa2O4: New Perspectives for Energy Electronics. Cryst. Growth Des. 2020, 20, 2535–2546. [Google Scholar] [CrossRef]
  17. Look, D.C.; Leedy, K.D.; Horng, R.-H.; Santia, M.D.; Badescu, S.C. Electrical and optical properties of degenerate and semi-insulating ZnGa2O4: Electron/phonon scattering elucidated by quantum magnetoconductivity. Appl. Phys. Lett. 2020, 116, 252104. [Google Scholar] [CrossRef]
  18. Kahan, H.M.; Macfarlane, R.M. Optical and Microwave Spectra of Cr3+ in the Spinel ZnGa2O4. J. Chem. Phys. 1971, 54, 5197–5205. [Google Scholar] [CrossRef]
  19. Shannon, R.D. Revised effective ionic radii and systematic studies of interatomic distances in halides and chalcogenides. Acta Crystallogr. Sect. A 1976, 32, 751–767. [Google Scholar] [CrossRef]
  20. Sugano, S.; Tanabe, Y. The line spectra of Cr3+ ion in crystals. Discuss. Faraday Soc. 1958, 26, 43. [Google Scholar] [CrossRef]
  21. Tanabe, Y.; Sugano, S. On the Absorption Spectra of Complex Ions. I. J. Phys. Soc. Japan 1954, 9, 753–766. [Google Scholar] [CrossRef] [Green Version]
  22. Van Gorkom, G.G.P.; Henning, J.C.M.; van Stapele, R.P. Optical Spectra of Cr3+ Pairs in the Spinel ZnGa2O4. Phys. Rev. B 1973, 8, 955–973. [Google Scholar] [CrossRef]
  23. Mikenda, W.; Preisinger, A. N-lines in the luminescence spectra of Cr3+ -doped spinels (I) identification of N-lines. J. Lumin. 1981, 26, 53–66. [Google Scholar] [CrossRef]
  24. Mikenda, W.; Preisinger, A. N-lines in the luminescence spectra of Cr3+ -doped spinels (II) origins of N-lines. J. Lumin. 1981, 26, 67–83. [Google Scholar] [CrossRef]
  25. Basavaraju, N.; Priolkar, K.R.; Gourier, D.; Sharma, S.K.; Bessière, A.; Viana, B. The importance of inversion disorder in the visible light induced persistent luminescence in Cr3+ doped AB2O4 (A = Zn or Mg and B = Ga or Al). Phys. Chem. Chem. Phys. 2015, 17, 1790–1799. [Google Scholar] [CrossRef] [Green Version]
  26. De Vos, A.; Lejaeghere, K.; Vanpoucke, D.E.P.; Joos, J.J.; Smet, P.F.; Hemelsoet, K. First-Principles Study of Antisite Defect Configurations in ZnGa2O4:Cr Persistent Phosphors. Inorg. Chem. 2016, 55, 2402–2412. [Google Scholar] [CrossRef]
  27. Smith, A.M.; Mancini, M.C.; Nie, S. Second window for in vivo imaging. Nat. Nanotechnol. 2009, 4, 710–711. [Google Scholar] [CrossRef] [Green Version]
  28. Maldiney, T.; Doan, B.-T.; Alloyeau, D.; Bessodes, M.; Scherman, D.; Richard, C. Gadolinium-Doped Persistent Nanophosphors as Versatile Tool for Multimodal In Vivo Imaging. Adv. Funct. Mater. 2015, 25, 331–338. [Google Scholar] [CrossRef]
  29. Hölsä, J. Persistent Luminescence Beats the Afterglow: 400 Years of Persistent Luminescence. Electrochem. Soc. Interface 2009, 18, 42–45. [Google Scholar] [CrossRef]
  30. López-Moreno, S.; Rodríguez-Hernández, P.; Muñoz, A.; Romero, A.H.; Manjón, F.J.; Errandonea, D.; Rusu, E.; Ursaki, V.V. Lattice dynamics of ZnAl2O4 and ZnGa2O4 under high pressure. Ann. Phys. 2011, 523, 157–167. [Google Scholar] [CrossRef]
  31. Manjon, F.J.; Tiginyanu, I.; Ursaki, V. (Eds.) Pressure-Induced Phase Transitions in AB2X4 Chalcogenide Compounds; Springer Series in Materials Science; Springer: Berlin/Heidelberg, Germany, 2014; Volume 189, ISBN 978-3-642-40366-8. [Google Scholar]
  32. Marinković Stanojević, Z.V.; Romčević, N.; Stojanović, B. Spectroscopic study of spinel ZnCr2O4 obtained from mechanically activated ZnO–Cr2O3 mixtures. J. Eur. Ceram. Soc. 2007, 27, 903–907. [Google Scholar] [CrossRef]
  33. Henry, M.O.; Larkin, J.P.; Imbusch, G.F. Luminescence from Chromium Doped Yttrium Aluminium Garnet. Proc. R. Irish Acad. Sect. A Math. Phys. Sci. 1975, 75, 97–106. [Google Scholar]
  34. Tokida, Y.; Adachi, S. Photoluminescence spectroscopy and energy-level analysis of metal-organic-deposited Ga2O3:Cr3+ films. J. Appl. Phys. 2012, 112, 063522. [Google Scholar] [CrossRef]
  35. Nico, C.; Fernandes, R.; Graça, M.P.F.; Elisa, M.; Sava, B.A.; Monteiro, R.C.C.; Rino, L.; Monteiro, T. Eu3+ luminescence in aluminophosphate glasses. J. Lumin. 2014, 145, 582–587. [Google Scholar] [CrossRef]
  36. Pelant, I.; Valenta, J. Luminescence Spectroscopy of Semiconductors; Oxford University Press Inc.: New York, NY, USA, 2012; ISBN 9780199588336. [Google Scholar]
Figure 1. Structural model of ZGO:Cr and ZGGO:Cr. When x = 0.1 Ge replaces Ga atoms, as represented by the pink portion on Ga atoms. The model was obtained using the free software VESTA and the data from Allix et al. [13].
Applsci 12 02104 g001
Figure 2. (a) X-ray diffractograms of ZGGO:Cr, ZGO:Cr, and ZGO (ICDD file #04-005-9208) with the assigned (hkl) diffracting planes of the cubic spinel structure. The * correspond to diffraction maxima due to SiO2 contamination. (b) Raman spectra of the ZGGO:Cr and ZGO:Cr pellet samples.
Applsci 12 02104 g002
Figure 3. (a1,a2) SEM images of ZGGO:Cr pellets, (a2) shows in a higher magnification image revealing the polyhedral nature of the grains. (b) EDS spectrum of ZGGO:Cr pellets showing the identification of the elements Zn, Ga, Ge, Cr, and O; the * correspond to Si contamination.
Applsci 12 02104 g003
Figure 4. (a) (top) DR spectra of non-intentionally doped (green dashed line) and chromium-doped (black dashed line) ZGGO samples; (bottom) RT PLE (@ 690 nm) and PL (λexc = 325 nm) spectra of ZGGO:Cr (black lines) and ZGO:Cr (red lines) samples, respectively; and a PL spectrum of ZGGO:Cr (blue solid line) at band-to-band excitation. (b) Schematic representation of the energy levels of Cr3+ in octahedral sites and corresponding splittings (not to scale) of the fundamental and first excited states under the interplay of a trigonal crystalline field and spin–orbit interaction.
Applsci 12 02104 g004
Figure 5. (a) RT PL spectra of ZGO:Cr and ZGGO:Cr obtained under different excitation wavelengths: onset of the band-to-band absorption (275 nm), defect absorption band (310 nm), and intraionic A 4 2 T 4 1 , T 4 2 absorption bands (400 nm and 560 nm, respectively). Besides the R- and N2-lines, the spectra are dominated by Stokes and anti-Stokes phonon sidebands for longer and shorter wavelengths. The spectra were vertically shifted for clarity. (b) Photograph of the ZGGO:Cr pellet under white light (top) and 256 nm lamp (bottom) illumination.
Applsci 12 02104 g005
Figure 6. The 15 K PL spectra of ZGGO:Cr obtained upon excitation on the defect absorption band and intraionic A 4 2 T 4 1 , T 4 2 transitions. The spectrum obtained for the ZGO:Cr under 325 nm excitation (onset of band-to-band absorption) was added for comparison purposes.
Applsci 12 02104 g006
Figure 7. The 15 K PL spectra of ZGO:Cr and ZGGO:Cr samples on the enlarged scale of the high energy spectral region of Cr3+ luminescence.
Applsci 12 02104 g007
Figure 8. Temperature-dependent PL spectra of ZGGO:Cr obtained under (a) 325 nm and (b) 442 nm of excitation. (c,d) Corresponding enlarged spectra of the R-lines region upon subtracted baseline.
Applsci 12 02104 g008
Figure 9. Temperature dependence of the R-lines’ integrated intensity obtained under 325 nm and 442 nm photon excitation and correspondent fittings according to Equations (1) and (2).
Applsci 12 02104 g009
Figure 10. Schematic representation of the mechanism for the population/depopulation processes when ZGGO:Cr is excited under 325 nm and 442 nm. The curved arrows denote non-radiative processes, while the straight red ones correspond to radiative ones. The orange rectangles involving the E ¯ and 2 A ¯ states illustrate the R2/R1 thermalisation process. i, ii, and iii indicate different Cr3+ centres present in the sample. The diagram is not to scale and it was assumed that the ground level was at the same energy location for all the Cr3+ optical centres.
Applsci 12 02104 g010
Figure 11. Temperature dependence of the R-lines’ peak position obtained with 325 nm and 442 nm photon excitation, and correspondent fittings according to Equation (3).
Applsci 12 02104 g011
Figure 12. RT-normalised PL and TRPL spectra of ZGGO:Cr. The spectra were vertically shifted for clarity.
Applsci 12 02104 g012
Figure 13. RT red/NIR persistent PL of ZGGO:Cr after illumination with 310 nm of a Xe lamp for 5 min. The grey zone in (a) is zoomed in (b).
Applsci 12 02104 g013
Figure 14. RT wavelength dependence of the red/NIR persistent luminescence decay for the ZGGO:Cr sample and correspondent fittings according to Equation (4).
Applsci 12 02104 g014
Table 1. Frequency of the vibrational modes measured experimentally in this work for ZGO:Cr and ZGGO:Cr. For comparison, the theoretical values for ZGO calculated in ref [30] are also included.
Mode
Assignment
Theoretical Calculated
ZGO (cm−1) [30]
ZGO:Cr (cm−1)
[This Work]
ZGGO:Cr (cm−1)
[This Work]
T 2 g 186 186
273270
E g 395369367
T 2 g 488476471
T 2 g 618611611
A 1 g 717717717
Table 2. Peak position of the R-lines for ZGO:Cr and ZGGO:Cr samples measured at 15 K.
Sampleλexc (nm)R2R1
ZGO:Cr325684.5 nm/1.8089 eV687.3 nm/1.8042 eV
ZGGO:Cr325685.6 nm/1.8086 eV687.4 nm/1.8039 eV
ZGGO:Cr405685.6 nm/1.8086 eV687.5 nm/1.8037 eV
ZGGO:Cr442685.6 nm/1.8086 eV687.4 nm/1.8037 eV
ZGGO:Cr532685.6 nm/1.8086 eV687.5 nm/1.8037 eV
Table 3. Activation energies obtained for the population/depopulation processes of R1- and R2-lines excited either with 325 nm or 442 nm.
λexc (nm)LinesEa_pop (meV)Ea_depop (meV)
325R1-47.1 ± 5.9
325R24.8 ± 0.247.7 ± 6.0
442R115.1 ± 1.910.6 ± 3.7
442R27.6 ± 1.2-
Table 4. Fit parameters obtained for the R1- and R2-lines’ peak position shift using Equation (3).
λexc (nm)Lines ω ¯   ( meV ) β (meV)ER(0) (eV)TD (K)
325R127.5 ± 5.14.9 ± 1.51.804 ± 6.91 ×   10 5 319.1
325R238.7 ± 4.99.4 ± 2.31.809 ± 5.26 ×   10 5 449.1
442R149.5 ± 5.317.6 ± 4.41.804 ± 5.16 ×   10 5 574.4
442R252.8 ± 4.021.1 ± 3.91.809 ± 3.78 ×   10 5 612.7
Publisher’s Note: MDPI stays neutral with regard to jurisdictional claims in published maps and institutional affiliations.

