Article

Modeling the Life Cycle Inventory of a Centralized Composting Facility in Greece

by
Panagiotis Chazirakis
1,2,
Apostolos Giannis
1,* and
Evangelos Gidarakos
1
1
School of Chemical and Environmental Engineering, Technical University of Crete, University Campus, 73100 Chania, Greece
2
Inter-Municipal Enterprise of Solid Waste Management (DEDISA), 50 Grigoriou V, 73100 Chania, Greece
*
Author to whom correspondence should be addressed.
Appl. Sci. 2022, 12(4), 2047; https://doi.org/10.3390/app12042047
Submission received: 31 December 2021 / Revised: 9 February 2022 / Accepted: 14 February 2022 / Published: 16 February 2022
(This article belongs to the Topic Sustainable Environmental Technologies)

Abstract

:

Featured Application

The life cycle inventory of a composting facility is expected to predict the fate of individual waste fragments and compost quality.

Abstract

Mechanical composting is a popular treatment method for the mechanically separated organic fraction of municipal solid wastes to stabilize the waste material and reduce its environmental impacts. The model and life cycle inventory database are created based on the existing centralized mechanical composting facility located in Chania (Crete, Greece). This study aims to assess all stages of the composting process, wherein input-output flows are comprehensively analyzed based on specific waste fragments. The transfer coefficients are calculated for each waste fragment throughout the processes. The degradation rate is measured as kg of C and N released per Mg of the treated material. The results show that process degradation rates are independent of the initial fragmental composition. This is the first study that accurately models the fate of distinctive waste fragments in a composting plant, while the developed life cycle inventory (with regard to mass and energy balances) can be applied to estimate the environmental impacts regarding mechanical composting the organic fraction of municipal solid wastes.

1. Introduction

Biowaste (BW) represents a major fraction of municipal solid waste (MSW), which is consisted of food and kitchen waste from households, HORECA (hotels, restaurants, caterers), and green waste from gardens and parks [1]. It comprises the most significant waste fraction generated by households reaching up to 44% of total household waste globally [2,3]. Recently, biowaste has received considerable attention owing to its environmental, economic, and social impacts. Future trends have shown that municipal solid biowaste (MSBW) will most likely increase due to population growth and rising consumption patterns [4].
According to data from the EU, 86 million Mg of biowaste were generated in 2017, while approximately 40% (up to 100% in some member states) were disposed of in dumpsites and landfills, with a negative impact on the environment [5]. Biowaste recovery and utilization started in the 90s with Directive 1999/31/EC [6]. This directive obliges the member states of the EU to reduce the amount of biodegradable municipal waste and aims for 65% of all MSW produced to be recycled before 2030 (while only 10% should be disposed of in landfills). A feasible approach used for the past 20 years is recovering the organic fraction of municipal solid wastes (OFMSW) from unsorted waste and used in biological processes such as composting and anaerobic treatment. Anaerobic treatment has been studied in several cases since biogas can be produced for energy recovery [7,8]. The research in mechanical closed composting systems has focused on source segregated OFMSW processes. The mechanical sorting systems vary from simple installation such as shredder, trommel, and magnet, to medium or high complexity OFMSW sorting systems to deliver various quality and purity materials [9].
Diverting OFMSW from landfills and using it as composting material has many environmental benefits (e.g., reducing greenhouse gas emissions [10]), while it can be easily integrated with material recovery facilities (MRFs). It involves the biological aerobic degradation of organic matter under controlled conditions [11], resulting in a nutrient-rich product. The process produces gas emissions composed primarily of CO2, trace amounts of methane, non-methane organic compounds (NMOC), nitrogen, and ammonia [12]. The resulting product when OFMSW originated from unsorted mixed waste is called compost-like output (CLO) [13], and its quality is related to the purity of the initial materials and the pretreatment method [14]. The compost can significantly enhance the fertility of the soil environment by increasing the soil organic carbon (SOC), total N (TN), and soil microbial biomass (SMB). At the same time, it has a positive effect on the activity of enzymes involved in the C, N, and P cycles [15]. However, the impurities and contaminants that are usually released from CLO require increased attention [10]. CLO is considered one of the primary sources of microplastics (MPs) in the agricultural environment, negatively influencing soil microbial processes or plant growth [16]. Therefore, the use of CLO in land applications is limited and regulated to restore quarries, dumping sites, or road slopes [10,13,17].
Societies have started transitioning towards a model based on source segregation of biowaste that can produce higher-quality compost with environmental impacts which are significantly reduced. At the same time, the existing facilities are adapted to accept source segregated biowaste. The evaluation of the composting systems is complicated, with many variables which must be considered. It involves numerous calculations and requires accurate data to model better the variables of each system. The use of life cycle assessment (LCA) is based on the guidelines of ISO 14040 and 14044 [18], and can provide a much-improved viewpoint on waste management by connecting materials, resources, and waste flows with potential environmental impacts. Every LCA study incorporates several available local information and data sets called the life cycle inventory (LCI). In particular, the LCI is a compilation of all mass flows and emissions associated with the activities within the waste management system as well as upstream and downstream activities linked to the management of the waste. It relies on recent, representative, and accurate data such as waste types and their individual material fractions, detailed physicochemical composition, mass balances for all relevant material fractions, energy balances for all processes and technologies, records of the emissions, and inventories of all relevant upstream and downstream processes [19]. The LCI covers all consumptions and emissions of environmental importance [18]. However, it is difficult to find case-specific data or LCI that include waste composition, energy and resource inputs, and material substitution in an LCA implementation study [20]. Establishing a relevant and high-accurate LCI is often demanding but crucial since it is the technical basis for assessing the waste management system. Existing models and software offer some assistance and databases in setting up the LCI, but it is always important to ensure relevance and consistency in the technical data of the specific study. LCA methodologies and advanced software such as EASETECH (developed by DTU) are based on fragmentation analysis to follow elemental balances throughout the processes.
Inventories on existing facilities managing the OFMSW from unsorted mixed waste are scarce [21]. In most cases, the treatment of such materials is held by private facilities, and the available data concerning full-size treatment are not published. Although several composting technologies have been studied in European countries, a few have developed LCI for composting systems treating segregated biowaste [22]. The available information about the materials of OFMSW and nutrient flows are inconsistent, making it difficult to develop alternative scenarios during urban planning [23]. Therefore, there is an increasing need for predictive models to support environmental policy and decision-making. Few studies have investigated composting of mechanically sorted OFMSW obtained at MBT plants. Thus, this research is urgently needed [24]
This study aims to create a life cycle inventory (LCI) based on the mechanical recycling and composting facility in Chania (Crete, Greece). The objectives are to model the composting unit by mapping the fragmental mass balance between its sub-processes, to monitor the release of C and N as emissions to the environment, and to record the water, electricity, and fuel consumption for the treatment of one Mg of OFMSW introduced in the facility. Two-year waste sampling and data collection are comprehensively analyzed. The outcomes from this study can be used as a tool for the waste management practitioners to foresee the outputs and cost of treating OFMSW and source segregated biowaste.

2. Methodology

The LCI model is developed using actual and local data from two-year monitoring study of the composting unit. Material flow analysis (MFA) software STAN is utilized to fill in missing and not-accessible data, while the LCA software EASETECH is used as a tool for the elemental pathway of C and N in the process. The case study facility is in Chania on the island of Crete (Greece). The composting unit is part of the integrated “Mechanical Recycling and Composting Facility—Landfill” of Chania. It serves 156,585 inhabitants [25] and annually treats approximately 91,500 Mg of urban solid waste [26]. The OFMSW is collected from the mechanical recycling facility, and the process is classified as a simplified pretreatment method [27]. Briefly, the comingled waste is fed in the mechanical sorting system, passing throw a bag opener and an automatic rotary sieve (trommel) with a 70 mm diameter mess. A conveyor then drops the undersized material to a magnet for ferrous metals removal, and the remaining is obtained as OFMSW. The oversized material exited from the trommel is driven for recyclables recovery in the facility, while the rejects are disposed of in the nearby landfill.
The system boundary for this study is shown in Figure 1. It includes the composting subsystems (aerobic composting tank, refinery unit, open windrows-maturation), which act as the operational processes after the wastes are delivered to the composting plant. The methodology is based on an in-depth analysis of all of the consisting fragments of OFMSW. The waste fragments are comprehensively characterized throughout the subprocesses until their degradation to greenhouse gas (GHG) emissions released to the environment, rejects disposed of to the landfill, or CLO production. Initially, every subprocess and flow are recognized and recorded, while the monitoring period is two years (2018–2019).
The greenhouse gases (GHG) are also considered and studied as C and N transformations along with the main waste flows. The energy is calculated in the form of electricity, fuel in diesel consumed, and the water consumed in the subprocesses. The green waste (GW) consists of tree branches collected from the municipality bulky collection system. It is shredded in the facility and used as a bulking agent in a ratio of 1:4 by volume. The functional unit is 1 Mg of wet mass OFMSW mixed with green waste entering to the composting unit.

2.1. Composting Units

The composting process is divided into three sub-units: (1) the aerobic composting tank (ACT), which is a continuous flow reactor; (2) the refinery unit (RFU); and (3) the open windrows (OPW) for compost maturation. Table 1 provides the main information about the composting conditions. The primary composting process in the ACT sustains aerobic conditions with bottom-up aeration and a leachate draining system. A deodorization system with a biofilter is connected to the air exhaust system of the ACT. The turning, water addition, and movement of the material inside the reactor are controlled by an overhead-suspended bridge system with four screw-shaped turners. A fifth screw turner at the end of the reactor transfers the composted materials to conveyor belts towards the RFU. The RFU comprises flip-flop sieves and gravimetric separators to remove bulky and non-compostable materials. The rejects are diverted for landfilling (landfill cover), and the refined material is sent for secondary composting and maturation at OPW. A hook lift truck, a backhoe loader, a wheel loader, and a compost turner handle the transportation and mixing of rejects and maturation windrows. All above vehicles are considered to use diesel (Euro 5 emission standard engines). The unit employs one (1) senior engineer as operation manager, one (1) heavy machinery operator, and two (2) workers daily, while one (1) truck driver and two maintenance technicians (electrician and mechanic) from the nearby MRF are also involved part-time.

2.2. Sample Collection and Characterization

Sampling was carried out for two consecutive years (2018–2019) and represented the average composition of each material. The samples were collected from the inputs and outputs of each sub-process, and the sampling points are shown in Figure 1. Each sample was then reduced in size using the ‘coning and quartering’ method at approximately 100 kg and subjected to fragmentation analysis in a nearby area. The samples were sorted into four major categories (biodegradable, plastics, metals, and others-not compostable) and 17 sub-categories based on the research [28] and the recovery potential at the MRF: biowaste, paper, dirty paper, cardboard, garden waste, soft plastic, hard plastic, non-recyclable plastic, aluminum foil and containers, batteries and electronic devices, food cans (tinplate/steel), rubber, leather, textiles, processed wood, glass, and other inert.
Each sample was analyzed for water content and total solids after drying at 105 °C for 24 h (CSN EN 12048), ash content, volatile solids by igniting the dried sample at 550 °C until steady weight (CSN EN 13039), and Kjeldahl Nitrogen in the dried samples using the Kjeldahl method (CSN EN 13654.01).

2.3. Life Cycle Inventory (LCI) Modeling

Material flow analysis is used to fill in the missing information. The processed weighting data are fed to the sophisticated software STAN v2.6 (Substance flow Analysis, 2.6), which is developed by the Technical University of Wien [29,30] to complete the missing stream flows and convert them in accordance with the functional unit of the study [31]. The results are fed to the EASETECH model (Environmental Assessment System for Environmental TECHnologies, v2.4.5) to calculate for each fraction the degradation factors and transfer coefficients. EASETECH is a waste-LCA model focusing on managing complex waste streams [19], and it can handle the flow of complex heterogeneous fractions in various bioprocess systems. The framework and calculation structure have been described in detail by [32]. In EASETECH software, the degradation is defined as the reduction of organic dry mass during the composting process. The degradation factor of the fragment ‘α’ for the process Df(α) is defined as the % reduction of the total mass of vs. ascribed to biogenic carbon reduction. In comparison, the transfer coefficient of fragment ‘α’ is considered the reduction of the total wet mass due to mechanical separation Tf(α).

2.4. GHG Emissions

GHG emissions related to the processes can be defined to direct emissions, indirect upstream emissions, and indirect downstream emissions. Direct emissions are linked to the composting site and its activities, including waste degradation and emissions from machinery used on the site (fuel consumption). The indirect upstream emissions are related to activities for fuel production, provision of electricity used in the site, and the construction of infrastructure and machinery. Indirect downstream avoided emissions are considered from peat substitution for fertilizer production and the carbon sequestration in the soil when compost is applied to land [12,33]. The indirect emissions related to fuel and electricity production were selected after an extensive literature review to reflect the local fuel and energy mixture. Table 2 shows the emission factors (Efs) used in this study [34,35]. Mass flow analysis was employed to calculate the gases released during the degradation of the materials for the direct and indirect downstream emission, while EASETECH software native database provided machinery emission factors based on the engine euro standard.

2.5. Site-Specific Data

Valuable data from the facility operation are also collected. They concern the primary input and output of each composting unit for the monitoring period, which include weighing data from the daily treated materials, rejects and outputs of the refinery process, daily routes, working hours, annual diesel fuel consumption (L) of every vehicle involved in the composting process, daily electricity consumption from the composting unit (kWh), and daily water consumption (L) in the composting process.
The weighting data are annually averaged for every flow and diverted to the appropriate functional unit and sub-process. The annual electricity consumption is attributed, respectively, to each sub-process and divided by the annual wet mass of the treated material of the specific sub-process. The vehicle diesel consumption is calculated by dividing the annual fuel consumption by attributing working hours and routes for the needs of the composting process. Water is attributed to each subprocess and divided by the mass of the treated materials.

2.6. Life Cycle Inventory Boundaries

The LCI boundaries assume a zero-burden approach [36,37] for the received materials at the entrance of the composting facility. Therefore, the facility environmental footprint is not included in the calculations. This excluded component includes emissions from the construction of the facility, equipment, vehicles, and post-processing of the initial material. Also, this study does not consider the environmental impacts associated with the construction of windrow composting facility (equipment and infrastructure).

2.7. Sensitivity Analysis

Sensitivity analysis is conducted to examine sensitive inputs and analyze whether the assumptions made in the model influence the results [21]. For this reason, this study uses perturbation analysis, and uncertainty propagation methodology [38,39].
Perturbation analysis identifies the most sensitive parameters of the model. The method calculates each parameter sensitivity ratio (SR) and observes the effect of low but countable changes in the results. Every parameter of the studied system is raised, one at a time by 10% (Δ parameter), the new calculated net result is referred as (Δ result). The SR is the ratio between the relative change of the result and the relative change in the parameter. It is calculated as:
SR = Δ   result initial   result Δ   parameter initial   parmeter NRS i = RS i max | RS i |
To compare the different SRs in various outputs of the model, the concept of the normalized sensitivity ratio (NSR) has been developed and calculated for each SR. NSR is defined as the ratio of one parameter in one system output divided with the maximum absolute value among all of the SRs in the same output. The concept is a modified adaptation of the methodology of NSRs introduced by [39].
Uncertainty propagation consists in propagating input uncertainties to calculate the result uncertainty. Before propagating them, the practitioner chooses a representation for these input uncertainties. The probability theory was adopted in this case study, and the sampling propagation method of Monte Carlo analysis was selected [40].

3. Results

3.1. Waste Composition

Table 3 presents the material fraction distribution of the mechanically separated organic fraction of municipal solid wastes (MS-OFMSW) and green waste received for composting. Water constitutes 52.5% of the total wet mass which is higher than MS-OFMSW in other studies [41,42]. The main compostable fragments can be categorized as biowaste (76.5%), paper-like materials (paper, dirty paper, cardboard) (12.9%), and green waste (4.64%). Since mechanical sorting is based on sizing and gravimetric properties, the presence of foreign non-biodegradable materials is justified. According to [43], paper waste and cardboard in various proportions consist of 12–27% of the dry mass of MS-OFMSW treated in similar composting facilities in Spain. Carbon content and its origins, biogenic or fossil, are taken from [44]. These estimates consider that some foreign material may be present in each fragment as suggested by the IPCC 2006 Guidelines [45]. The main greenhouse gases that contribute to global warming are CH4 and N2O, and their release depends on the technology, the waste input, and the management of the process. The above carbon origin is of immense importance in most LCA methodologies since biogenic carbon, when released in the form of CO2 to the environment, is not counted in the impacts, in contrast, when the same portion of the carbon is released in the form of methane in a landfill, for example, it is counted [46,47]. In summary, the initial material chemical composition without the green waste has a TS of 47.16%, vs. 77.03% of TS, ash content of 22.97, biogenic C of 43.82%, and TN of 2.48%. Although the above values vary compared to literature, they are within the same order [10,13]

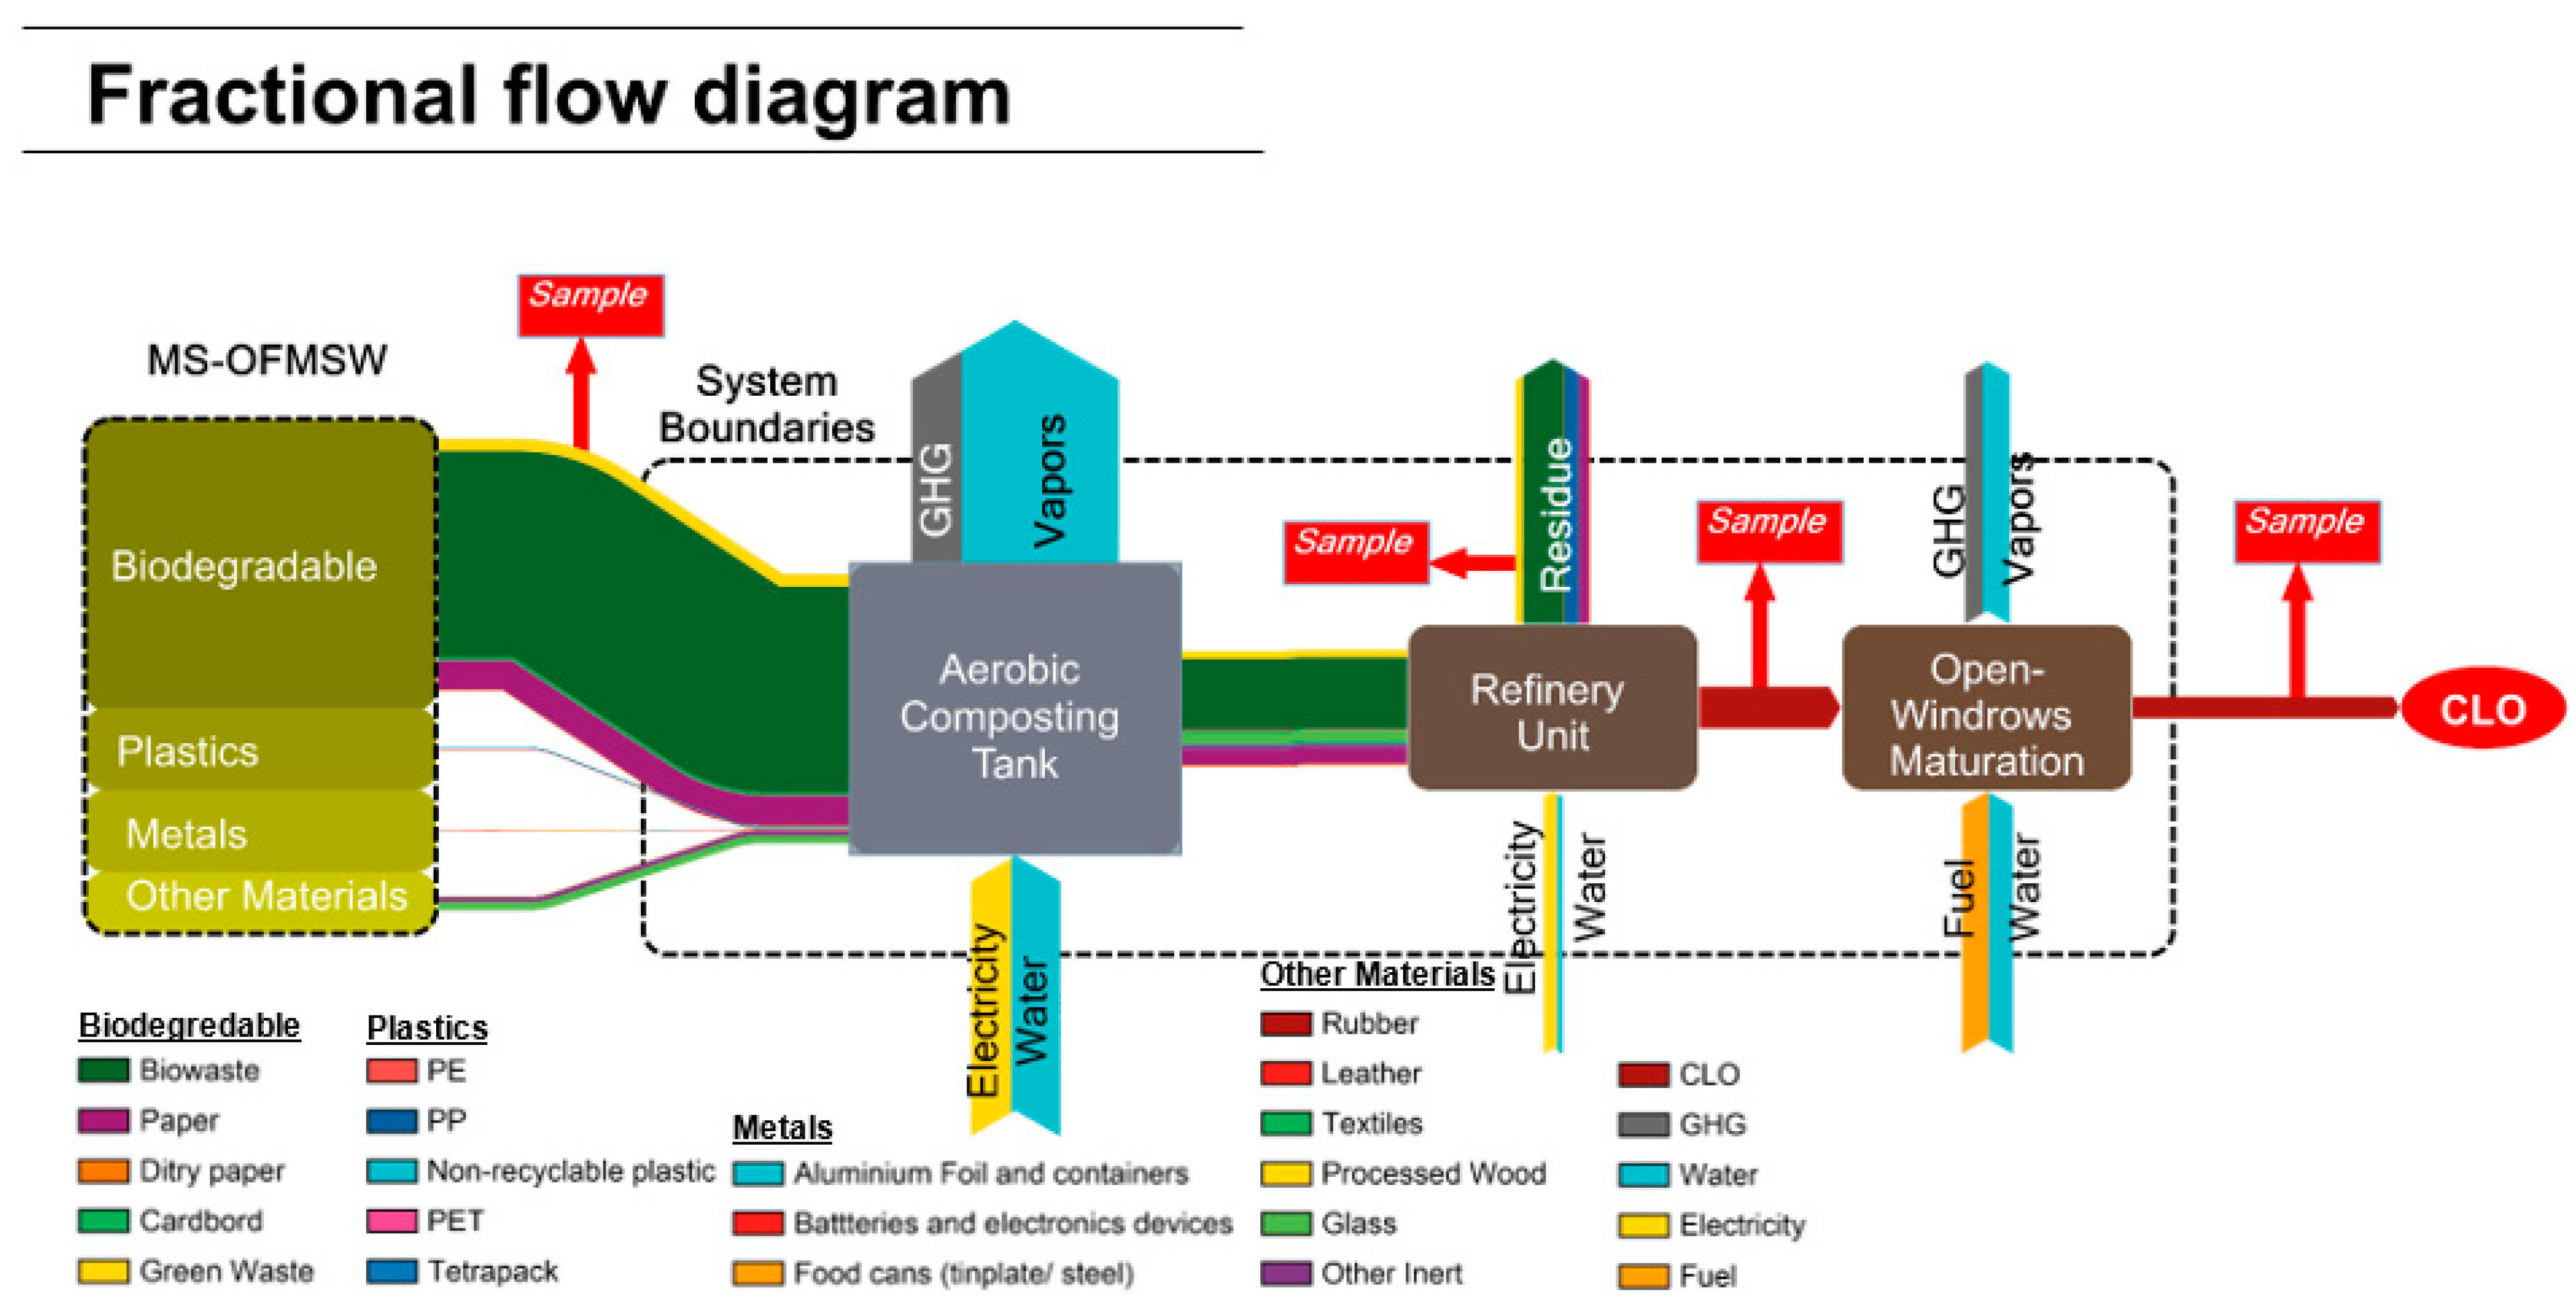
3.2. Material Flow Analysis
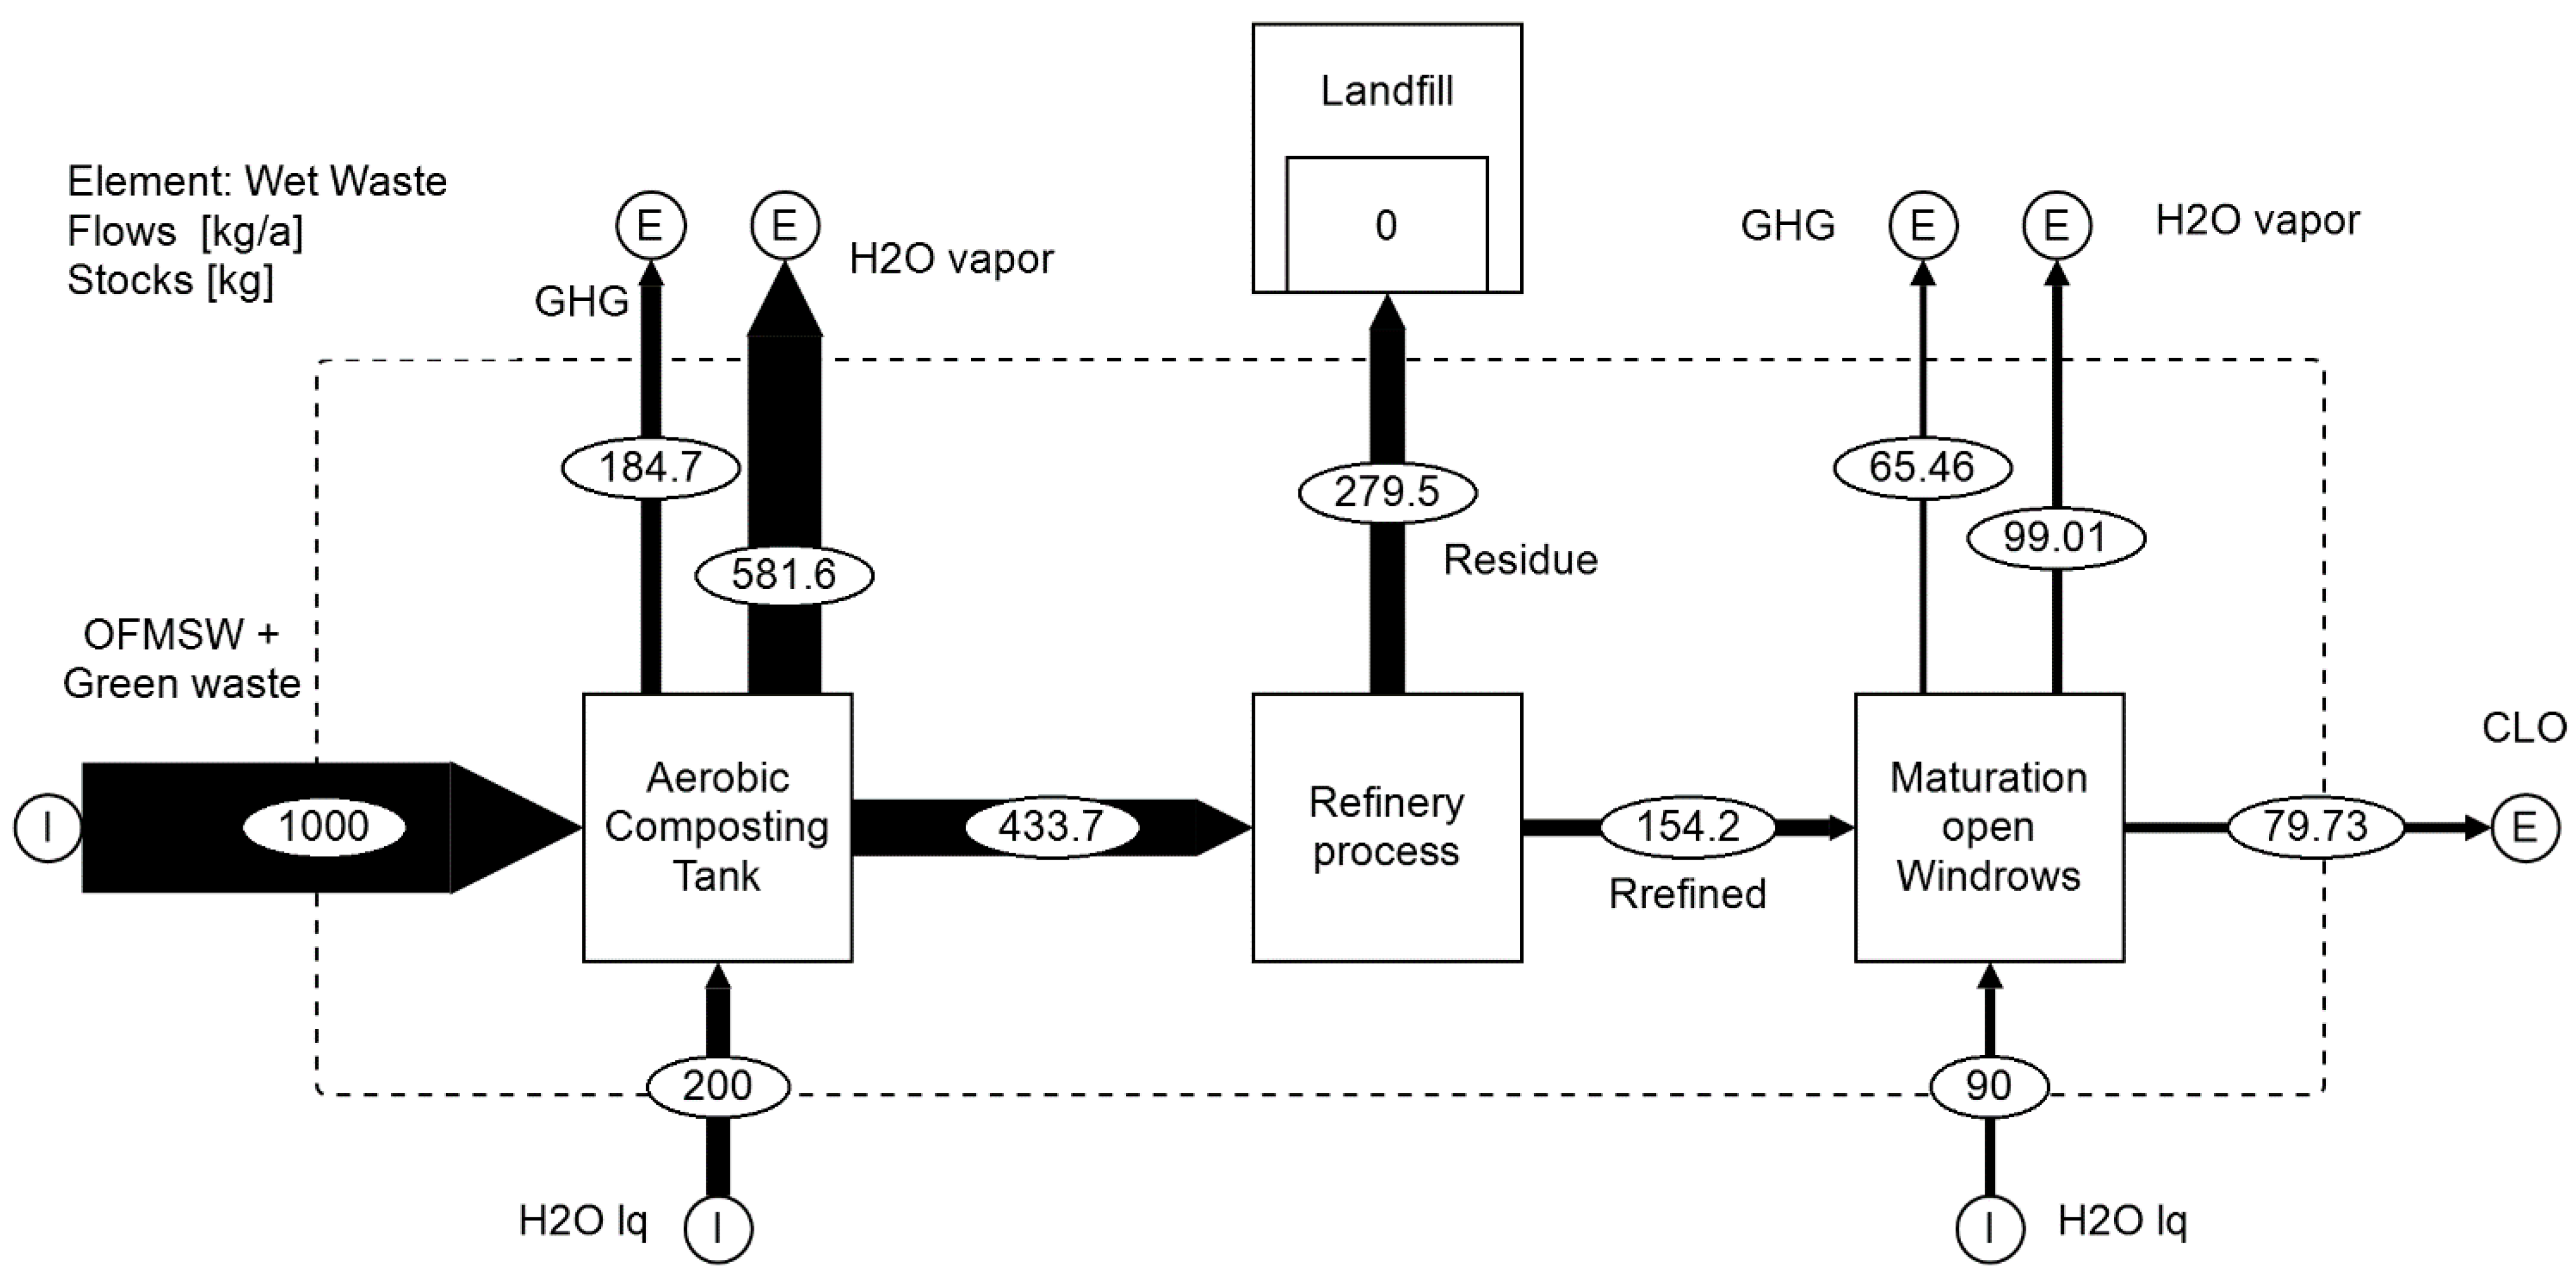
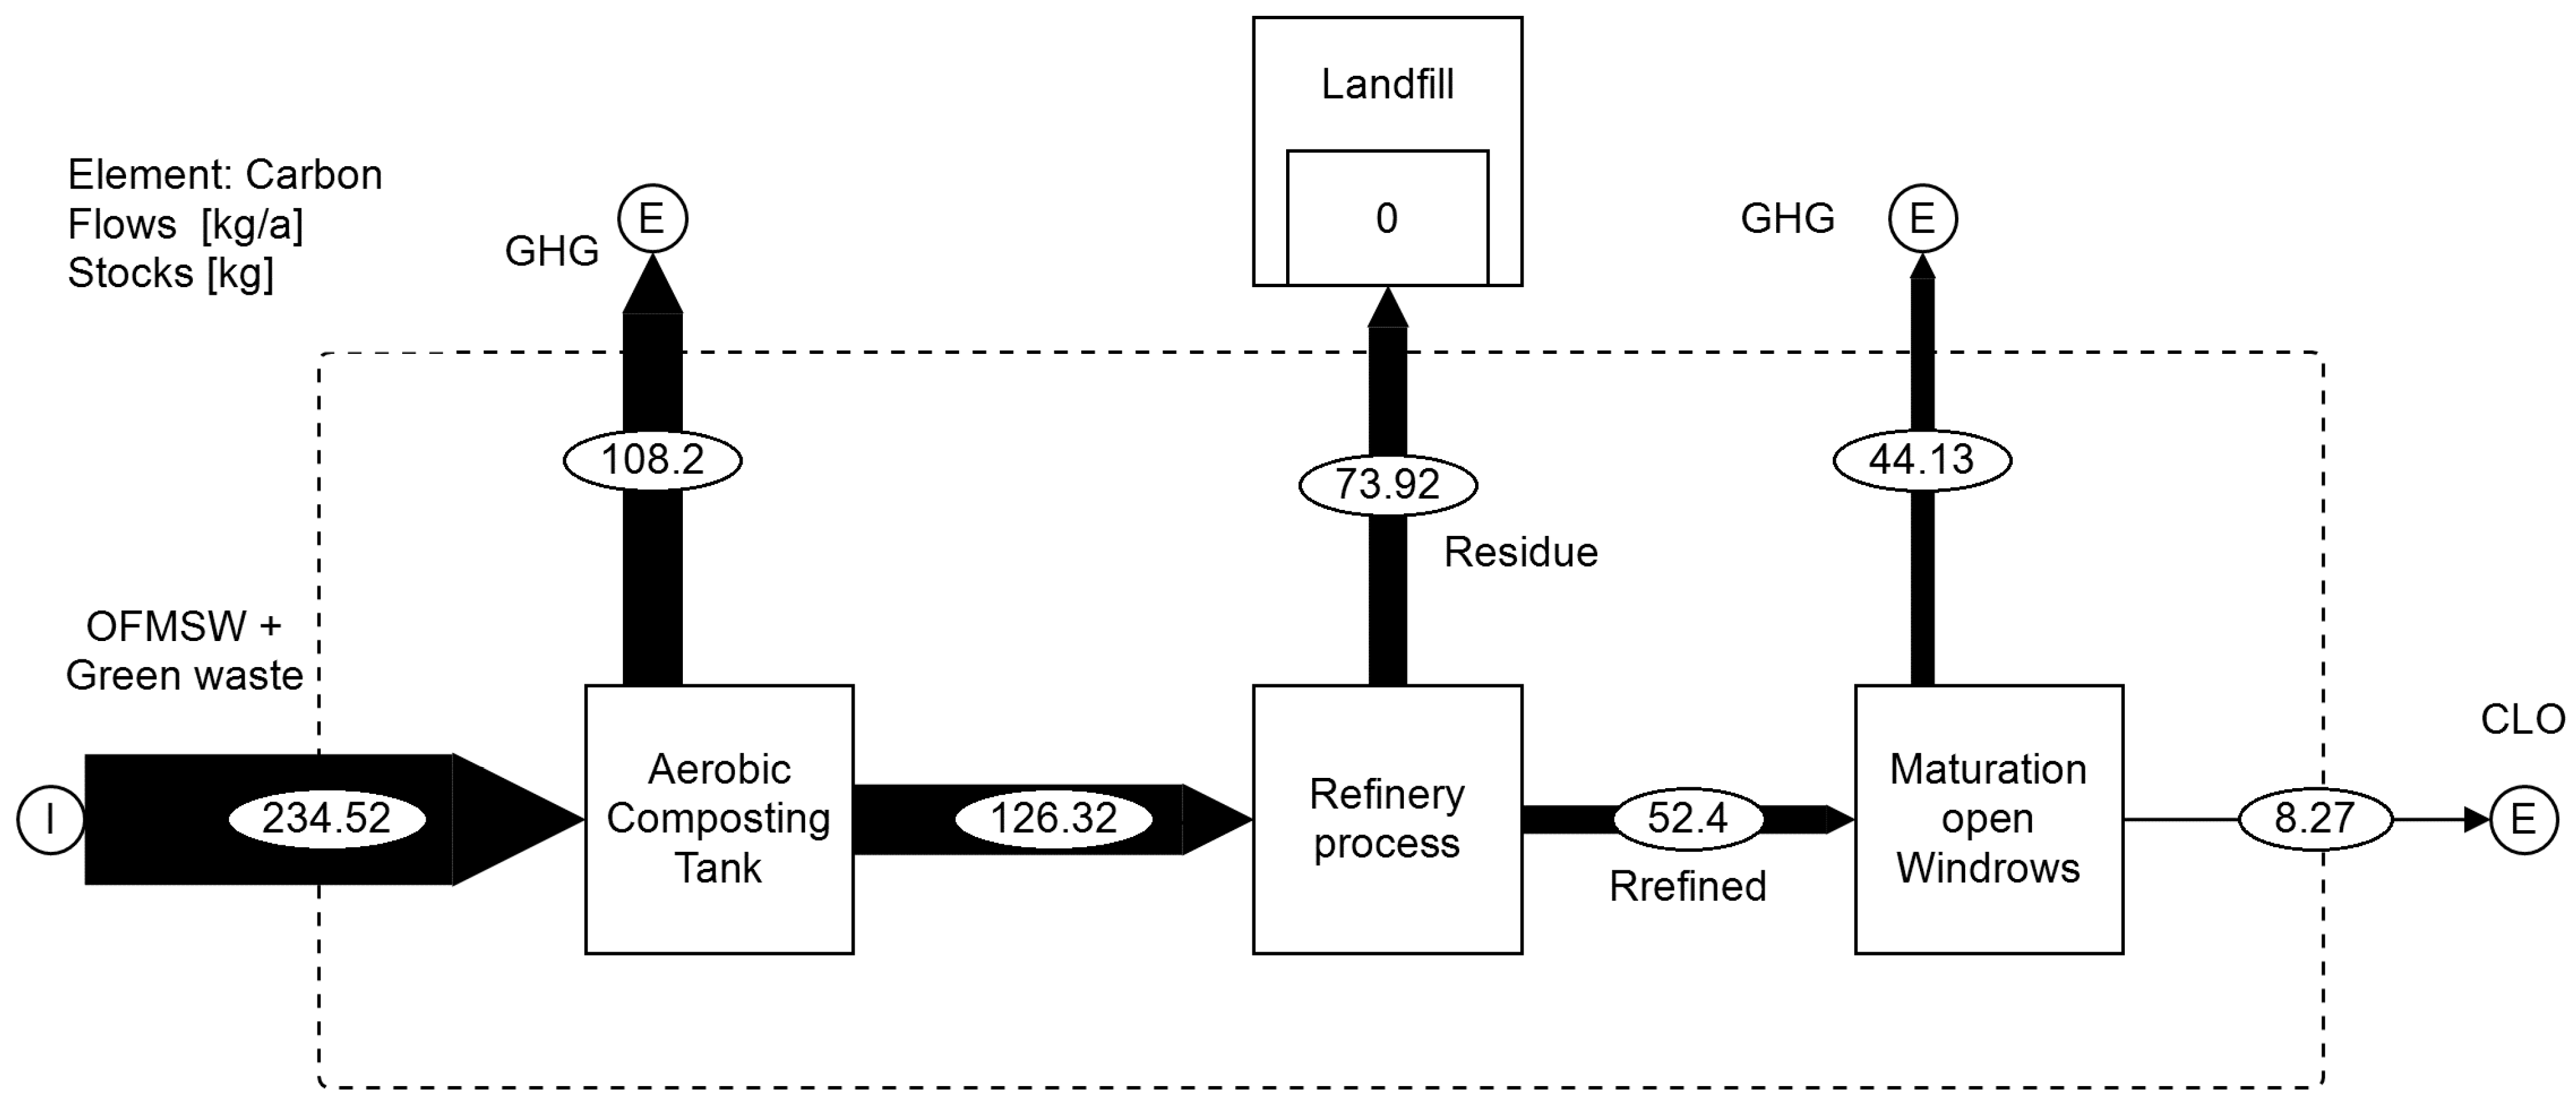
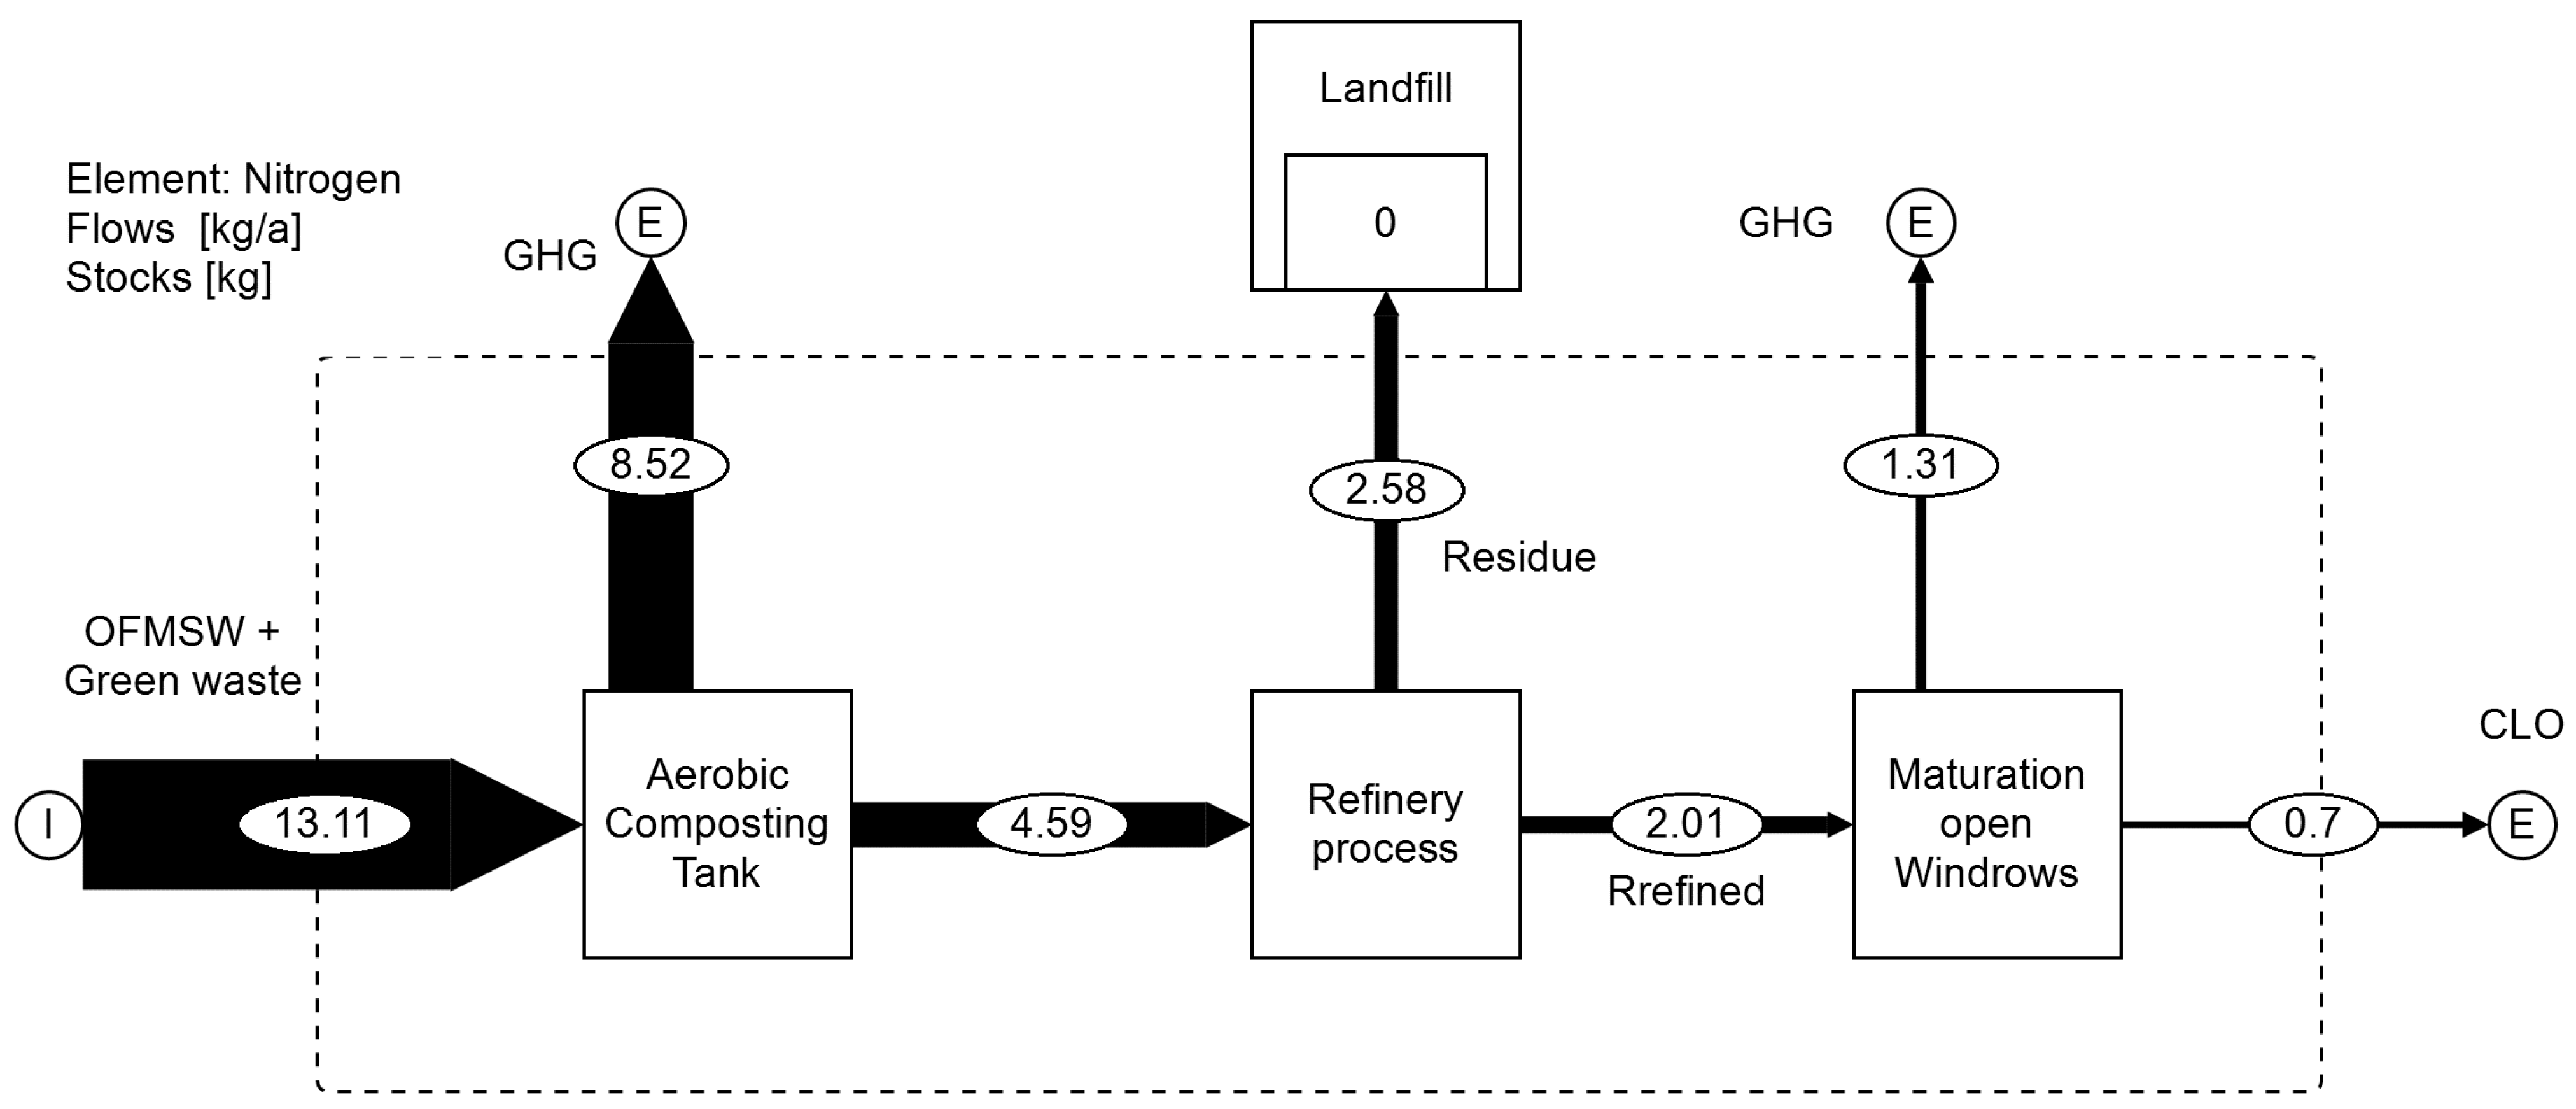
The overall process with flow dynamics and mass balance is presented in Figure 2. The estimations of C and N flows are displayed in Figure 3 and Figure 4, respectively, assuming that carbon is 99% oxidized to CO2 while nitrogen is released to the air as NH3 at the ACT process [12]. The modeling of the composting system follows all fractions throughout the processes based on two assumptions: (1) the mass can be transferred between processes, and (2) the carbon of biogenic origin in biodegradable materials is biologically degraded to gases with dominant carbon dioxide. The above transfers and transformations are expressed as degradation factors and transfer coefficients.
The primary process occurs in the continuous-flow aerobic composting tank (ACT), where the materials enter daily, are mechanically mixed, and transferred across the tank. Controlled conditions are provided with aeration, water adjustment, and temperature management. The processed material that exits daily continues to the refinery unit for separation. The calculated retention time of the materials in the composting tank is four to five weeks. Several studies follow a general approach when modeling a composting system and consider the treated materials as a single homogenous mixture appointing one degradation factor [9,48]. That is justified since most studies refer to source-segregated OFMSW [9,49,50,51] and only a few to mechanical sorted OFMSW [27]. This research considers the individuality of each of the consisting fragments and its different degradation rates. The degradation factors are calculated utilizing MFA methodology with data of the ash content and mass loss of each fragment in the input and output at the ACT.
In Table 4, the degradation factors are referred to the biodegradable materials. Paper-like materials present the higher degradation factor with printed paper (61%), cardboard (51%), and dirty paper (43.3%). These materials present high VS, and they consist primarily of cellulose and lignin, organic polymers difficult to decompose. However, the high decompositions are justified by the screening, mixing and the elevated temperatures found during the thermophilic phase of composting process that contribute to the rapid degradation of lignocellulose [52]. Similar high degradation rates have been observed elsewhere [43] concerning various paper-like materials present in OFMSW composting. It is also stated that if the paper-like materials do not exceed 27% of OFMSW, degradations of 36–65% are feasible in controlled conditions with a retention time of 45 days. Concerning biowaste, the degradation factor has an average 48%, while the green waste 15%.
The above results suggest that the retention time in the ACT is not sufficient for the complete decomposition of the biodegradable materials of biowaste. Green waste serves as a bulking agent and is shredded to medium-sized particles presenting a low degradation factor [53]. Physical characteristics such as bulk density, particle size, and porosity are important factors for fragment decomposition level. The structure of green waste (containing lignocellulosic materials) appears difficult decomposition and requires specific lignocellulosic microorganisms (and enzymes) to improve it degradation and retention time more than 12 weeks [54,55]. In order to produce mature compost, [12] stated that degradations of 40–83% of the carbon contained in the biowaste are required, while [56] reported 62–66% and 66–77% degradation of carbon for garden waste and food waste, respectively.
Plastic materials present close to zero degradation for this process; only LDPE abandoned in the form of shopping bags can be accounted to have a 10% degradation. Although LDPE films have presented some degradation only in the harsh environment of the composting process [55], and the degraded portion is meager. The mechanical processes employ throughout the composting process, such as turning mixing and screening, can result in polymers being sheared into smaller fragments during the conventional composting process and could explain the above degradation factor, as it is often apparent in household and commercial organic waste [57,58]. An additional issue that must be considered is the rapid increase in biodegradable plastic materials that have started to replace the traditional PE film. Their biodegradability is dependent on the composting conditions and the chemical composition of each material [59].
The second sub-process (refinery unit-RFU) is a mechanical separation stage based on sizing the material using a ‘flip-flop’ sieve with 10 by 10 mm mesh holes, followed by a gravimetric air separator in line with a gravimetric air cyclone to collect the lightweight material. Table 5 presents the transfer coefficients for each material. Bulky and heavy materials are mainly rejected into residue. Water content is critical in this step since it adds excess weight if not adjusted correctly in the previous process, leading to discarding compostable materials as residue. The fact that the exiting material is collected by its size and gravimetric properties and not its chemical characteristics is advantageous. It provides optimal mechanical characteristics on the collected materials, although it does not prevent the infiltration of unwanted dissolved chemicals such as heavy metals. The collected materials have TS (75.03%), vs. (75.4) of TS, and 19.3% TS carbon of biogenic origin. The rejected material of the process consists of bulky and non-compostable materials. The same principle is followed for the transfer coefficients of the refinery process, and the above assumptions allow experimentation with variations of composition with the same system, providing a handy tool for further research.
The material that continues to the final composting/maturation stage has a homogenous texture; the origin fractions are hard to recognize, only some paper-like remains, and some wood fraction with particle size lower than 10 mm are notable. The total vs. is high (69%). The material is accounted as concentrated biodegradable fraction, which justifies the intense composting stage, followed by a prolonged maturation state (composting windrows). It must be stated that open-windrow composting can be challenging owing to variable weather conditions that advance or delay the composting process. Intensive mechanical mixing and constant windrow temperature monitoring which occurs once a week during this process minimize the number of anaerobic pockets in the composting mass. However, it is reasonable to assume that an inevitable release of CH4 occurs. Hence, adopting the lowest emissions values, 0.8–2.5% of degraded C is released as CH4, which seems reasonable [11]. Concerning nitrogen-based GHG, [60] stated that there is no production of N2O during the thermophilic phase since autotrophic nitrifier activity ceases above 40 °C. Since the maturation phase is considered a continuation of the primary composting process, GHG production is only scarce at the final stages of the process. For this reason, 0.1–0.7% of degrading N is accounted to transform to Ν2O. Mixing and water addition ensure a partially controlled maturation elongating to six or nine months until the desired physicochemical characteristics are reached.
The quality of MSW compost is dependent on many parameters, including the composting facility design, feedstock source and proportions used, composting procedure, and duration of maturation [61]. The maturation typically requires minor active management. It is a crucial final stage that facilitates the conversion of potentially toxic NH4 to NO3, allows the loss of phytotoxic volatile compounds, and stabilizes the microbial community. At this state, mesophilic fungi and actinomycetes colonize the compost, which is thought to be responsible for the breakdown and transformation of humic substances and lignin. Although, maturation is a vital stage frequently given insufficient time, or is even missed out altogether, to save space and increase the throughput of composting plants. In this case study, the corresponding sub-process can be chronically adjusted depending on the aiming physicochemical characteristics of the final product. The average decomposition rate is calculated to be 75% of the total volatile solids of the initial material. The resulting CLO has 37% water content, vs. of 57%, while the C and N contents are calculated to 56% and 1.9%, respectively. Carabassa et al. (2020) [13] presented CLO with similar physicochemical characteristics ranging from 65 to 70% TS, 44.5 to 64% VS, and 1.4 to 2.17% N, while [1] produced CLO with similar characteristics.

3.3. Mass Balance

Material and substance flow analyses are performed based on mass balances. The composting unit is then built graphically and displayed as Sankey plots. Figure 2 presents the mass flows of wet waste throughout the processes and the loss of material and compounds to the atmosphere (in kg). The water content is significant for the proper accounting of the total mass balance. Since it is added during composting and maturation and accounts for 200 L per Mg of treated materials in the ACT and 90 L per Mg of treated materials during maturation, the quantities are not insignificant (while its use is threefold). It provides temperature control by reducing heat due to its evaporation, it acts as a medium for the dilution and exchange of elements. Finally, it regulates the aerobic conditions in the composting mass. During the aerobic process, the evaporated water and mass loss is calculated to 766.3 kg per Mg w/w, plus 164.5 kg for the maturation state, while an amount of 279.5 kg is rejected. The resulting CLO material is calculated to be 79.73 kg.
The carbon balance is presented in Figure 3. During the two sub-processes where organic matter degradation occurs, 64.96% of the initial carbon is released into the environment. The primary composting process releases 46.14% of the initial carbon in gaseous form. A significant portion of the initial carbon (31.52%) is diverted to the landfill and contributes to carbon sequestration [62,63]. Finally, 3.52% is included in the CLO destined for land use. Several studies have investigated the degradation of organic matter and C fate during composting. Production of mature compost requires degradation of 40–83% of the carbon contained in the compost [12]. Most of this carbon is emitted as biogenic CO2, and a relatively small portion is emitted as CH4 created in anaerobic pockets in the composting mass.
The total nitrogen loss during the main composting process (ACT) is 64.99% (Figure 4). A portion (19.68%) of the initial nitrogen is landfilled, and 5.3% is bound to the CLO produced mass. The rest is released in gas form during the maturation phase. The controlled conditions in the ACT provide a stable temperature profile of 45–65 °C, favoring the thermophiles phase. The above conditions inhibit the nitrification of produced ammonium to NO2 while the dissociation constant (pKa) of NH4+ decreases with increasing temperature, meaning that higher temperatures favor evaporation of NH3. Eventually, ammonia is the most emitted form of N [64,65]. However, other by-products have not been investigated (i.e., for ammonia the oxidized forms NO and N2O are not considered, although aerobic microorganisms may form them). These gases potentially impact the environment. NO may result in ozone depletion in the stratosphere, and N2O is an effective greenhouse gas [66].

3.4. Estimation of Resources Consumed

3.4.1. Electricity

Aeration, deodorization, mixing, transfer, and refining of compost are the main electricity-consuming processes in the ACT and RFU resulting in a 34.56 kWh electricity consumption per Mg of the wet treated material (Table 6). This number is the average electricity consumption for every sub-process for a given volume of the treated material. According to [12], electricity consumption depends mainly on technology use and is higher on closed composting systems, especially reactor technologies, ranging between 9 and 65 kWh/Mg w/w versus 0.023–19.7 kWh/Mg w/w for open technologies. The research by [67] attributes a fourfold electricity consumption to reactor technology than windrow composting, stating that the benefit of reactor composting is covered from N loss by preventing organic contaminants, higher degradation rates, and lower composting periods. Another research in large-scale bioconversion systems based on the aerobic treatment of organic waste implies that the reduction of the produced leachate due to controlled air supply is reduced by 75–99% [68].

3.4.2. Fuel

The transportation of the residue to the landfill and the refined material to the maturation area employs a hook-lift truck consuming 0.311 L per Mg of the transferred material. For the management and treatment of the maturing windrows, two wheel-loaders, and one compost turner are involved (Table 6). The fuel consumption for each vehicle is calculated to be 2.201, 1.096, and 0.098 L of diesel consumed, respectively, per Mg of maturing material. Τhe engine technology for all of the vehicles follows the standard of Euro 5 as it has been classified from the European emission standards for heavy-duty diesel engines. The conversion of fuel consumption to the initial wet mass of MS-OFMSW is 0.658 L of diesel per Mg, while the literature review presents a range of 0.4–0.5 L per Mg for similar processes [12].

3.4.3. Water

Water consumption is 200 L per Mg for the ACT and 90 L per Mg of refined material during windrow composting. In many LCA methodologies, water consumption is not included [11]. During the aerobic tank composting, the water addition is constant to substitute the water loses of high composting rates and prevent the compost from overheating, while the only water source is the embedded irrigation system. On the other hand, open composting is exposed to weather conditions and precipitation contributes to the windrows irrigation system.

3.5. Sensitivity Analysis

Sensitivity analysis is performed to check the model’s robustness and assess overall uncertainty [69]. The parameters tested in the perturbation analysis include the degradation factors for aerobic composting and the transfer coefficients. All parameters are raised, one at a time, by 10% and the resulting change in the three key outputs of the system: the two exits of the refinery process (rejects and refined materials) and the at the end of maturation phase (produced CLO) are recorded as the quantity of wet mass in contrast to the initial quantities. The results as NSRs are presented in Table 7. The resulting NSRs reveal the sensitivity of the model to the degradation rate of biowaste and the maturating CLO.
The second part of the sensitivity analysis is performed regarding the overall uncertainty propagation for the system outputs. Monde Carlo simulation (MCS) is initialized to generate pseudo-random numbers from the set of the studied parameters. The model degradation parameters and transfer coefficients are attributed with uncertainties of 10% in the form of normal distribution, and the MCS iteration value is set to 10,000 times to obtain the sample distribution of the output parameter [31,69,70,71]. The results are 6.1% variation for the rejects output, 9.4% for the refinery output, and 15% for the compost output.

4. Discussion

This study identifies the dynamics of recovering significant quantities of biogenic carbon and benefitting from the produced compost-like output as a soil conditioner. Although the quality of the produced CLO has several uncertainties due to the origin of the materials, a significant amount of the initial materials is discarded as rejects and usually ends up in landfills. Considering the circular economy perspective, the sustainable treatment of OFMSW requires it to be separated from residual waste at the source to eliminate contaminants remaining in the initial materials [5]. In Spain, samples of produced CLO from 10 MBT plants in Castile and Leon showed heavy metal concentrations below the limits set by the national legislation. However, the percentage of inert impurities, such as plastic or glass, was excessively high, exceeding in some cases the legal limit [72,73]. The same issues were concerned for the CLO produced from the MBT of Attica [1]. The elimination of reject based on the absence of the contaminants mentioned above increases the produced quantities since, in other cases, rejects could be further processed. The restrictions applied to CLO uses do not apply for source segregated biowaste produced compost. The use of the produced material to agriculture, soil improvement, and fertilizer substitution should not be overlooked.
In early 2017, Europe had about 570 active MBT plants with a treatment capacity of 55 million tons [74]. According to the 2020 report from the European Environment Agency (EEA) concerning bio-waste treatment in Europe, the most common treatment methods for biowaste, in line with circular economy principles, were composting and anaerobic digestion. The second was the most preferable in some cases due to benefits from the recovery of material and energy. However, the 22 EU countries average favor composting, with Greece utilizing only composting [5]. In the highest biowaste treatment capacities ranking, Sweden and Croatia present more than 370 kg/capita, followed by Austria, Slovenia, and France near 300 kg/person, while Greece shows the lowest capacities. In the same ranking, comparing source segregation (versus not separately collected biowaste), Greece mainly applies the collection of mixed waste. At the same time, Austria leads the trends with close to 200 kg/capita on separate biowaste collection. Concerning Greece until 2020, six MBT facilities had been constructed and in operation, and ten more are under construction [75].
The LCA study performed by Abeliotis [76] for the MBT of west Attica was based on data provided from the regional administration of Attica, and the native database of the LCA software was used to calculate the produced emissions. In a global LCA review [21] until 2014 (222 case studies), the dominant monitored waste stream was household mixed waste, 70% of the studies concern cases in European countries. Most of the inventory data sources were taken from the literature without addressing the appropriateness of the data used, such as representativeness in time or space of the extracted data compared to the studied system. Composting was the most favorable among the biological treatment methods used in 74 of the above studies. In contrast, anaerobic digestion was used in 53 cases.
In more recent studies, the life cycle inventory analysis is the most time and resource-demanding for the LCA partitioners [72]. The evolution of advanced LCA software with ready-made modules for the composting process may save time and resources. However, it may lead to fault results making mandatory an evaluation step of the primary LCI data.
The goals for a more circular economy in EU by the new revised Waste Framework Directive introduced a new requirement for bio-waste separation. By 31 December 2023, bio-waste must either be separated and recycled at the source or collected separately and not mixed with other types of waste [73]. In addition, as of 2027, compost derived from mixed municipal waste will no longer count towards achieving compliance with the recycling targets for municipal waste. From an LCA perspective, the impacts of a transition from mechanical sorting to source segregated biowaste collection has not yet been studied.

5. Conclusions

Most investigations in mechanical composting focus on open composting processes (e.g., windrows or static piles) or laboratory scale enclosed systems due to the difficulty in sampling commercial systems and the heterogeneous nature of MSW. In most cases, the private sector operates the facilities, and scarce data are available. In this paper, a life-cycle inventory (LCI) is created for the first time using primary data collected from an existing mechanical composting facility in Greece. This study uses comprehensive data to systematically model material and substance flows. The results indicate that significant decomposition occurs during the composting and maturation phases with significant conversion of the carbon content into carbon dioxide. It also proves that industrial-scale composting as a set of fragment flows throughout the different sub-processes provides flexibility, robustness, and profound usability to the designed model. The LCI can stand as a platform for environmental assessment. The practitioners can adjust the parameters accordingly to simulate alternative scenarios, providing a holistic view of specific situations and alternative disposal routes.

Author Contributions

Conceptualization, P.C. and A.G.; methodology, P.C.; validation, P.C.; investigation, P.C.; writing—original draft preparation, P.C.; writing—review and editing, A.G.; supervision, E.G. All authors have read and agreed to the published version of the manuscript.

Funding

This research received no external funding.

Institutional Review Board Statement

Not applicable.

Informed Consent Statement

Not applicable.

Data Availability Statement

Not applicable.

Acknowledgments

We would like to acknowledge the Trans-municipal enterprise for solid waste management of Chania (DEDISA S.A. public authorities) for providing valuable data.

Conflicts of Interest

The authors declare no conflict of interest.

References

  1. Malamis, D.; Bourka, A.; Stamatopoulou, Ε.; Moustakas, K.; Skiadi, O.; Loizidou, M. Study and assessment of segregated biowaste composting: The case study of Attica municipalities. J. Environ. Manag. 2017, 203, 664–669. [Google Scholar] [CrossRef]
  2. Bartocci, P.; Zampilli, M.; Liberti, F.; Pistolesi, V.; Massoli, S.; Bidini, G.; Fantozzi, F. LCA analysis of food waste co-digestion. Sci. Total Environ. 2020, 709, 136187. [Google Scholar] [CrossRef]
  3. Ardolino, F.; Colaleo, G.; Arena, U. The cleaner option for energy production from a municipal solid biowaste. J. Clean. Prod. 2020, 266, 121908. [Google Scholar] [CrossRef]
  4. Zeller, V.; Lavigne, C.; D’Ans, P.; Towa, E.; Achten, W.M.J. Assessing the environmental performance for more local and more circular biowaste management options at city-region level. Sci. Total Environ. 2020, 745, 140690. [Google Scholar] [CrossRef]
  5. EEA. Bio-Waste in Europe—Turning Challenges into Opportunities; Europian Environment Agency: Luxemburg, 2020. [Google Scholar]
  6. Council of the European Communities Council Directive 1999/31/EC on the landfill. Off. J. Eur. Communities 1999, L182/1. [CrossRef]
  7. Van Fan, Y.; Tin, C.; Perry, S. Anaerobic digestion of municipal solid waste: Energy and carbon emission footprint. J. Environ. Manag. 2018, 223, 888–897. [Google Scholar] [CrossRef]
  8. Wi, M.; Kulig, A.; Lelici, K. Applied sciences Odour Emissions of Municipal Waste Biogas Plants—Impact of Technological Factors, Air Temperature and Humidity. Appl. Sci. 2020, 10, 1093. [Google Scholar]
  9. Graça, J.; Murphy, B.; Pentlavalli, P.; Allen, C.C.R.; Bird, E.; Gaffney, M.; Duggan, T.; Kelleher, B. Bacterium consortium drives compost stability and degradation of organic contaminants in in-vessel composting process of the mechanically separated organic fraction of municipal solid waste (MS-OFMSW). Bioresour. Technol. Rep. 2021, 13, 100621. [Google Scholar] [CrossRef]
  10. Wei, Y.; Li, J.; Shi, D.; Liu, G.; Zhao, Y.; Shimaoka, T. Environmental challenges impeding the composting of biodegradable municipal solid waste: A critical review. Resour. Conserv. Recycl. 2017, 122, 51–65. [Google Scholar] [CrossRef] [Green Version]
  11. Díaz, M.J.; Ruiz-Montoya, M.; Palma, A.; de-Paz, M.V. Thermogravimetry applicability in compost and composting research: A review. Appl. Sci. 2021, 11, 1692. [Google Scholar] [CrossRef]
  12. Boldrin, A.; Andersen, J.K.; Møller, J.; Christensen, T.H.; Favoino, E. Composting and compost utilization: Accounting of greenhouse gases and global warming contributions. Waste Manag. Res. J. Sustain. Circ. Econ. 2009, 27, 800–812. [Google Scholar] [CrossRef] [Green Version]
  13. Carabassa, V.; Domene, X.; Alcañiz, J.M. Soil restoration using compost-like-outputs and digestates from non-source-separated urban waste as organic amendments: Limitations and opportunities. J. Environ. Manag. 2020, 255, 109909. [Google Scholar] [CrossRef]
  14. Vasileiadou, A.; Zoras, S.; Iordanidis, A. Biofuel potential of compost-like output from municipal solid waste: Multiple analyses of its seasonal variation and blends with lignite. Energy 2021, 236, 121457. [Google Scholar] [CrossRef]
  15. Bhattacharyya, P.; Chakrabarti, K.; Chakraborty, A. Effect of MSW Compost on Microbiological and Biochemical Soil Quality Indicators. Compost Sci. Util. 2003, 11, 220–227. [Google Scholar] [CrossRef]
  16. Baiano, S.; Fabiani, A.; Fornasier, F.; Ferrarini, A.; Innangi, M.; Mocali, S.; Morra, L. Biowaste compost amendment modifies soil biogeochemical cycles and microbial community according to aggregate classes. Appl. Soil Ecol. 2021, 168, 104132. [Google Scholar] [CrossRef]
  17. Palansooriya, K.N.; Shaheen, S.M.; Chen, S.S.; Tsang, D.C.W.; Hashimoto, Y.; Hou, D.; Bolan, N.S.; Rinklebe, J.; Ok, Y.S. Soil amendments for immobilization of potentially toxic elements in contaminated soils: A critical review. Environ. Int. 2020, 134, 105046. [Google Scholar] [CrossRef]
  18. BSI 14040; Environmental Management–Life Cycle Assessment—Principles and Framework. International Standard Organization: London, UK, 2006.
  19. Christensen, T.H.H.; Damgaard, A.; Levis, J.; Zhao, Y.; Björklund, A.; Arena, U.; Barlaz, M.A.A.; Starostina, V.; Boldrin, A.; Astrup, T.F.F.; et al. Application of LCA modelling in integrated waste management. Waste Manag. 2020, 118, 313–322. [Google Scholar] [CrossRef]
  20. Ripa, M.; Fiorentino, G.; Vacca, V.; Ulgiati, S. The relevance of site-specific data in Life Cycle Assessment (LCA). The case of the municipal solid waste management in the metropolitan city of Naples (Italy). J. Clean. Prod. 2017, 142, 445–460. [Google Scholar] [CrossRef]
  21. Laurent, A.; Bakas, I.; Clavreul, J.; Bernstad, A.; Niero, M.; Gentil, E.; Hauschild, M.Z.; Christensen, T.H. Review of LCA studies of solid waste management systems—Part I: Lessons learned and perspectives. Waste Manag. 2014, 34, 573–588. [Google Scholar] [CrossRef]
  22. Pini, M.; Neri, P.; Ferrari, A.M. Environmental Performance of Waste Management in an Italian Region: How LCI Modelling Framework could Influence the Results. Procedia CIRP 2018, 69, 956–961. [Google Scholar] [CrossRef]
  23. Guo, H.; Zhao, Y.; Damgaard, A.; Wang, Q.; Lu, W.; Wang, H.; Christensen, T.H. Material flow analysis of alternative biorefinery systems for managing Chinese food waste. Resour. Conserv. Recycl. 2019, 149, 197–209. [Google Scholar] [CrossRef]
  24. Mironov, V.; Vanteeva, A.; Sokolova, D.; Merkel, A.; Nikolaev, Y. Microbiota dynamics of mechanically separated organic fraction of municipal solid waste during composting. Microorganisms 2021, 9, 1877. [Google Scholar] [CrossRef]
  25. EL.STAT. Revision of the Results of the 2011 Population and Housing Census for the Resident, De Jure (Registered) and De Facto Population of Greece; Hellenic Statistical Authority: Pireas, Greece, 2014. [Google Scholar]
  26. Prefecture of Crete. Integration of the Local Waste Plans of the Municipalities of the Region. of Crete in the Regional Waste Management Planning (PESDAK) (Report in Greek Language); Prefecture of Crete Authority: Crete, Greece, 2016.
  27. Cecchi, F.; Traverso, P.; Pavan, P.; Bolzonella, D.; Innocenti, L. Characteristics of the OFMSW and Behavior of the Anaerobic Digestion Process. ChemInform 2003, 34, 141. [Google Scholar] [CrossRef]
  28. Edjabou, M.E.; Jensen, M.B.; Götze, R.; Pivnenko, K.; Petersen, C.; Scheutz, C.; Astrup, T.F. Municipal solid waste composition: Sampling methodology, statistical analyses, and case study evaluation. Waste Manag. 2015, 36, 12–23. [Google Scholar] [CrossRef] [Green Version]
  29. Cencic, O.; Rechberger, H. Material Flow Analysis with Software STAN. EnviroInfo 2008—Environ. Inform. Ind. Ecol. 2008, 2008, 440–447. [Google Scholar]
  30. Sevigné-Itoiz, E.; Gasol, C.M.; Rieradevall, J.; Gabarrell, X. Methodology of supporting decision-making of waste management with material flow analysis (MFA) and consequential life cycle assessment (CLCA): Case study of waste paper recycling. J. Clean. Prod. 2015, 105, 253–262. [Google Scholar] [CrossRef]
  31. Henriksen, T.; Levis, J.W.; Barlaz, M.A.; Damgaard, A. Approaches to fill data gaps and evaluate process completeness in LCA—perspectives from solid waste management systems. Int. J. Life Cycle Assess. 2019, 24, 1587–1601. [Google Scholar] [CrossRef] [Green Version]
  32. Clavreul, J.; Baumeister, H.; Christensen, T.H.; Damgaard, A. An environmental assessment system for environmental technologies. Environ. Model. Softw. 2014, 60, 18–30. [Google Scholar] [CrossRef] [Green Version]
  33. Favoino, E.; Hogg, D. The potential role of compost in reducing greenhouse gases. Waste Manag. Res. 2008, 26, 61–69. [Google Scholar] [CrossRef]
  34. Fruergaard, T.; Astrup, T.; Ekvall, T. Energy use and recovery in waste management and implications for accounting of greenhouse gases and global warming contributions. Waste Manag. Res. J. Sustain. Circ. Econ. 2009, 27, 724–737. [Google Scholar] [CrossRef]
  35. Koffi, B.; Cerutti, A.; Duerr, M.; Iancu, A.; Kona, A.; Janssens-Maenhout, G. CoM Default Emission Factors for the Member States of the European Union Dataset-Version 2017; European Commission—Joint Research Centre (JRC): Ispra, Italy, 2017. [Google Scholar]
  36. Djuric Ilic, D.; Eriksson, O.; Ödlund, L.; Åberg, M. No zero burden assumption in a circular economy. J. Clean. Prod. 2018, 182, 352–362. [Google Scholar] [CrossRef]
  37. Nakatani, J. Life cycle inventory analysis of recycling: Mathematical and graphical frameworks. Sustainability 2014, 6, 6158–6169. [Google Scholar] [CrossRef] [Green Version]
  38. Clavreul, J.; Guyonnet, D.; Christensen, T.H. Quantifying uncertainty in LCA-modelling of waste management systems. Waste Manag. 2012, 32, 2482–2495. [Google Scholar] [CrossRef] [PubMed] [Green Version]
  39. Andreasi Bassi, S.; Christensen, T.H.; Damgaard, A. Environmental performance of household waste management in Europe—An example of 7 countries. Waste Manag. 2017, 69, 545–557. [Google Scholar] [CrossRef] [PubMed] [Green Version]
  40. Hung, M.L.; Ma, H.W. Quantifying system uncertainty of life cycle assessment based on Monte Carlo simulation. Int. J. Life Cycle Assess. 2009, 14, 19–27. [Google Scholar] [CrossRef]
  41. Burnley, S.J. A review of municipal solid waste composition in the United Kingdom. Waste Manag. 2007, 27, 1274–1285. [Google Scholar] [CrossRef]
  42. Riber, C.; Rodushkin, I.; Spliid, H.; Christensen, T.H. Method for fractional solid-waste sampling and chemical analysis. Int. J. Environ. Anal. Chem. 2007, 87, 321–335. [Google Scholar] [CrossRef]
  43. Alvarez, J.V.V.L.L.; Larrucea, M.A.; Bermúdez, P.A.; Chicote, B.L. Biodegradation of paper waste under controlled composting conditions. Waste Manag. 2009, 29, 1514–1519. [Google Scholar] [CrossRef]
  44. Riber, C.; Petersen, C.; Christensen, T.H. Chemical composition of material fractions in Danish household waste. Waste Manag. 2009, 29, 1251–1257. [Google Scholar] [CrossRef]
  45. Eggleston, S.; Buendia, L.; Miwa, K.; Ngara, T.; Tanabe, K. 2006 IPCC Guidelines for National Greenhouse Gas. Inventories, Prepared by the National Greenhouse Gas Inventories Programme; Institute for Global Environmental Strategies: Kanagawa, Japan, 2006. [Google Scholar]
  46. Christensen, T.H.; Gentil, E.; Boldrin, A.; Larsen, A.W.; Weidema, B.P.; Hauschild, M. C balance, carbon dioxide emissions and global warming potentials in LCA-modelling of waste management systems. Waste Manag. Res. J. Sustain. Circ. Econ. 2009, 27, 707–715. [Google Scholar] [CrossRef]
  47. Saer, A.; Lansing, S.; Davitt, N.H.; Graves, R.E. Life cycle assessment of a food waste composting system: Environmental impact hotspots. J. Clean. Prod. 2013, 52, 234–244. [Google Scholar] [CrossRef]
  48. López, M.; Soliva, M.; Martínez-Farré, F.X.; Fernández, M.; Huerta-Pujol, O. Evaluation of MSW organic fraction for composting: Separate collection or mechanical sorting. Resour. Conserv. Recycl. 2010, 54, 222–228. [Google Scholar] [CrossRef]
  49. Campuzano, R.; González-Martínez, S. Characteristics of the organic fraction of municipal solid waste and methane production: A review. Waste Manag. 2016, 54, 3–12. [Google Scholar] [CrossRef]
  50. Gutiérrez, M.C.; Martín, M.A.; Serrano, A.; Chica, A.F. Monitoring of pile composting process of OFMSW at full scale and evaluation of odour emission impact. J. Environ. Manag. 2015, 151, 531–539. [Google Scholar] [CrossRef] [PubMed]
  51. Sailer, G.; Eichermüller, J.; Poetsch, J.; Paczkowski, S.; Pelz, S.; Oechsner, H.; Müller, J. Characterization of the separately collected organic fraction of municipal solid waste (OFMSW) from rural and urban districts for a one-year period in Germany. Waste Manag. 2021, 131, 471–482. [Google Scholar] [CrossRef] [PubMed]
  52. Tuomela, M.; Vikman, M.; Hatakka, A.; Itävaara, M.; It, M. Biodegradation of lignin in a compost environment: A review. Bioresour. Technol. 2000, 72, 169–183. [Google Scholar] [CrossRef]
  53. Yuan, J.; Zhang, D.; Li, Y.; Chadwick, D.; Li, G.; Li, Y.; Du, L. Effects of adding bulking agents on biostabilization and drying of municipal solid waste. Waste Manag. 2017, 62, 52–60. [Google Scholar] [CrossRef]
  54. Cerda, A.; Artola, A.; Font, X.; Barrena, R.; Gea, T.; Sánchez, A. Composting of food wastes: Status and challenges. Bioresour. Technol. 2018, 248, 57–67. [Google Scholar] [CrossRef] [Green Version]
  55. Davis, G.U. Open windrow composting of polymers: An investigation into the operational issues of composting polyethylene (PE). Waste Manag. 2005, 25, 401–407. [Google Scholar] [CrossRef]
  56. Komilis, D.P.; Ham, R.K. Carbon dioxide and ammonia emissions during composting of mixed paper, yard waste and food waste. Waste Manag. 2006, 26, 62–70. [Google Scholar] [CrossRef]
  57. Gui, J.; Sun, Y.; Wang, J.; Chen, X.; Zhang, S.; Wu, D. Microplastics in composting of rural domestic waste: Abundance, characteristics, and release from the surface of macroplastics. Environ. Pollut. 2021, 274, 116553. [Google Scholar] [CrossRef] [PubMed]
  58. Vithanage, M.; Ramanayaka, S.; Hasinthara, S.; Navaratne, A. Compost as a carrier for microplastics and plastic-bound toxic metals into agroecosystems. Curr. Opin. Environ. Sci. Health 2021, 24, 100297. [Google Scholar] [CrossRef]
  59. Narancic, T.; Verstichel, S.; Reddy Chaganti, S.; Morales-Gamez, L.; Kenny, S.T.; De Wilde, B.; Babu Padamati, R.; O’Connor, K.E. Biodegradable Plastic Blends Create New Possibilities for End-of-Life Management of Plastics but They Are Not a Panacea for Plastic Pollution. Environ. Sci. Technol. 2018, 52, 10441–10452. [Google Scholar] [CrossRef] [PubMed]
  60. Hellmann, B.; Zelles, L.; Palojärvi, A.; Bai, Q. Emission of climate-relevant trace gases and succession of microbial communities during open-windrow composting. Appl. Environ. Microbiol. 1997, 63, 1011–1018. [Google Scholar] [CrossRef] [PubMed] [Green Version]
  61. Hargreaves, J.C.; Adl, M.S.; Warman, P.R. A review of the use of composted municipal solid waste in agriculture. Agric. Ecosyst. Environ. 2008, 123, 1–14. [Google Scholar] [CrossRef]
  62. Kumar, A.; Sharma, M.P. GHG emission and carbon sequestration potential from MSW of Indian metro cities. Urban. Clim. 2014, 8, 30–41. [Google Scholar] [CrossRef]
  63. Staley, B.F.; Barlaz, M.A. Composition of Municipal Solid Waste in the United States and Implications for Carbon Sequestration and Methane Yield. J. Environ. Eng. 2009, 135, 901–909. [Google Scholar] [CrossRef]
  64. Andersen, J.K.; Boldrin, A.; Christensen, T.H.; Scheutz, C. Mass balances and life cycle inventory of home composting of organic waste. Waste Manag. 2011, 31, 1934–1942. [Google Scholar] [CrossRef] [Green Version]
  65. Amlinger, F.; Peyr, S.; Cuhls, C. Green house gas emissions from composting and mechanical biological treatment. Waste Manag. Res. J. Sustain. Circ. Econ. 2008, 26, 47–60. [Google Scholar] [CrossRef]
  66. Clemens, J.; Cuhls, C. Greenhouse gas emissions from mechanical and biological waste treatment of municipal waste. Environ. Technol. 2003, 24, 745–754. [Google Scholar] [CrossRef]
  67. Liu, Z.; Wang, X.; Wang, F.; Bai, Z.; Chadwick, D.; Misselbrook, T.; Ma, L. The progress of composting technologies from static heap to intelligent reactor: Benefits and limitations. J. Clean. Prod. 2020, 270, 122328. [Google Scholar] [CrossRef]
  68. Themelis, N.J.; Kim, Y.H. Material and energy balances in a large-scale aerobic bioconversion cell. Waste Manag. Res. J. Sustain. Circ. Econ. 2002, 20, 234–242. [Google Scholar] [CrossRef] [PubMed]
  69. Groen, E.A.; Heijungs, R.; Bokkers, E.A.M.; de Boer, I.J.M. Methods for uncertainty propagation in life cycle assessment. Environ. Model. Softw. 2014, 62, 316–325. [Google Scholar] [CrossRef]
  70. Helton, J.C.; Johnson, J.D.; Sallaberry, C.J.; Storlie, C.B. Survey of sampling-based methods for uncertainty and sensitivity analysis. Reliab. Eng. Syst. Saf. 2006, 91, 1175–1209. [Google Scholar] [CrossRef] [Green Version]
  71. Groen, E.A.; Bokkers, E.A.M.; Heijungs, R.; de Boer, I.J.M. Methods for global sensitivity analysis in life cycle assessment. Int. J. Life Cycle Assess. 2017, 22, 1125–1137. [Google Scholar] [CrossRef] [Green Version]
  72. Laurent, A.; Clavreul, J.; Bernstad, A.; Bakas, I.; Niero, M.; Gentil, E.; Christensen, T.H.; Hauschild, M.Z. Review of LCA studies of solid waste management systems—Part II: Methodological guidance for a better practice. Waste Manag. 2014, 34, 589–606. [Google Scholar] [CrossRef]
  73. EU 2018/851; Directive 2018/851 Amending Directive 2008/98/EC on Waste Framework. Official Journal of the European Union: Luxembourg, 2018; p. L-150/109.
  74. Doing, M. The Market. for Mechanical Biological Waste Treatment in Europe—Locations, Plants, Backgrounds and Market Estimations; Ecoprog GmbH: Köln, Germany, 2017. [Google Scholar]
  75. Environmental Protection Agency. National Plan for Waste Management—Including Hazardous Waste (Legislation in Greek Language); Environmental Protection Agency: Athens, Greece, 2020; p. 729.
  76. Abeliotis, K.; Kalogeropoulos, A.; Lasaridi, K. Life Cycle Assessment of the MBT plant in Ano Liossia, Athens, Greece. Waste Manag. 2012, 32, 213–219. [Google Scholar] [CrossRef]
Figure 1. Sankey’s graphic representation of the system and its boundary includes the composting process and inputs/outputs. The subprocesses (aerobic composting tank, refinery unit, open windrows-maturation) are presented. Colored lines represent the different fractions of MS-OFMSW, while the thickness of the lines is proportional to the mass of each fragment. The resources used (electricity, fuel, and water) are shown with yellow and orange arrows, and the emissions to the atmosphere are shown with dark gray arrows. Water addition and evaporation are shown with light blue arrows. The red arrows indicate the sampling points.
Applsci 12 02047 g001
Figure 2. Sankey diagram of mass balance for OFMSW + green waste treatment in kg (wet waste) (the lines are proportional to the mass of each flux).
Applsci 12 02047 g002
Figure 3. Sankey diagram for carbon mass balance in kg for OFMSW + green waste composting processing. The lines are proportional to the mass of each flux.
Applsci 12 02047 g003
Figure 4. Sankey diagram for nitrogen mass balance in kg for OFMSW + green waste composting processing (the lines are proportional to the mass of each flux).
Applsci 12 02047 g004
Table 1. Composting conditions and involved personnel for CLO production from mechanically separated OFMSW and green waste.
Composting ConditionsValue—Factor
 Mixing ratio by volume (OFMSW:GW)1:4
 Retention time in the composting tank4 weeks
 Refinery unitYes
 Residue after treatmentUsed for landfill cover
 Maturation time6–9 months
PersonelNumber of PeopleInvolvement
 Operation manager (senior engineer)1Full-time
 Front line stuff (workers)2Full-time
 Heavy machinery operator1Full-time
 Mentainence mechanic1Part-time
 Mentainence electrician1Part-time
 Truck driver1Part-time
Table 2. Emission factors (Efs) relevant to GHG during composting.
Type of Process/EmissionEmission FactorReference
Provision of diesel oil0.306 kg CO2-eq/L diesel[33]
Combustion of diesel oil2.7 kg CO2-eq/L diesel[32]
Provision of electricity0.810 kg CO2-eq/kWh[33]
Table 3. Fragmentation composition of OFMSW and green waste, proximate and ultimate analysis for each fraction, and carbon content (divided to biogenic and fossil origin).
FractionOFMWS
Composition (%)
OFMSW
Water Content (%)
TS (%)VS (%)Ash (%)C Bio (%)C Fossil (%)N(%)
Biodegradable
 Biowaste76.49 ± 10.5556.0437.4090.0010.0054.600.603.72
 Paper11.40 ± 10.9133.2987.0072.3027.7037.600.200.18
 Dirty paper0.29 ± 0.6353.3075.5091.108.9044.600.910.30
 Cardboard1.24 ± 17.0639.3389.5084.9015.1041.100.300.24
 Green waste4.64 ± 1.6247.0053.0093.007.0043.020.000.15
Plastics *
 Soft plastic (PE)0.30 ± 2.9028.2585.8995.604.400.4181.600.20
 Hard plastic (PP)0.29 ± 2.0522.8396.8097.802.200.4079.505.50
 Non-recyclable plastic0.30 ± 3.900.0092.9094.505.500.3670.600.50
Metals
 Aluminum foil and containers0.14 ± 0.4724.9581.2023.9076.1013.701.520.40
 Batteries and electronic devices0.14 ± 0.939.7291.1014.2085.804.354.350.10
 Food cans (tinplate/steel)0.15 ± 1.577.0386.820.00100.000.000.000.00
Other materials
 Rubber0.11 ± 3.5834.4292.3090.309.7052.3013.100.60
 Leather0.11 ± 3.5834.4293.3087.4012.6030.7030.700.30
 Textile0.11 ± 3.5834.4294.0096.403.6039.1013.003.20
 Processed wood0.11 ± 3.5834.4284.6096.303.7049.400.000.00
 Glass3.17 ± 2.052.2399.701.2098.800.000.000.10
 Other Inert1.81 ± 2.8734.7163.402.3097.700.650.650.00
* PET and Tetra pack packaging were monitored but not found.
Table 4. Degradation factors (%w/w) for the volatile solids of waste fractions in the aerobic composting tank process.
FractionDegradation Factor (%)
Biowaste48
Paper61
Dirty paper43.3
Cardboard51
Green waste15
Soft plastic (PE)10
Other inert5
Other materials0
Table 5. Refinery process transfer coefficients total mass (%w/w) for open windrow composting and maturation.
FractionTransfer Coefficients (%)
Biowaste45
Paper60
Cardboard100
Green waste5
Soft plastic (PE)2
Hard plastic (PP)1
Non-recyclable plastic1
Other materials0
Table 6. Heavy machinery involved in the composting process (fuel consumption), electricity, and water consumption.
Row Labels Process AttributedUnit/Mg of Material Treated
in the Corresponding Process Material
Backhoe loader (L of diesel)MIDI wheel loader (L/Mg)Maturation2.201
Wheel loader (L of diesel)Wheel loader (L/Mg)Maturation1.096
Other tractor (L of diesel)Hook lift (L/Mg)Maturation0.311
Other drivable machines (L of diesel)Compost turner (L/Mg)Maturation0.098
Marginal Electricity Consumption (kWh)Electricity (kWh/Mg)Aerobic composting Tank and Refinery34.56
Water consumption for composting process in aerobic composting tankL/Mg entering main compostingAerobic composting Tank and Refinery200.0
Water consumption for maturation state in open windrowsL/Mg material in windrowsMaturation583.7
Table 7. Perturbation analysis of NRSs for the main parameters of the model.
Refinery OutputRejects OutputFinal CLO
Degradation Factor
Aerobic composting tank
 Biowaste0.80.90.2
 Paper0.20.10.1
 Dirty paper0.00.00.0
 Cardboard0.00.00.0
 Green waste0.00.00.0
 Soft plastic (PE)0.00.00.0
 Other Inert0.00.00.0
Transfer coefficient
Refinery process
 Biowaste0.00.00.0
 Paper1.01.00.5
 Dirty paper0.30.30.2
 Cardboard0.00.00.0
 Green waste0.00.00.0
 Soft plastic (PE)0.00.00.0
Degradation Factor
Open windrows
 Degradation Factor--1.0
Publisher’s Note: MDPI stays neutral with regard to jurisdictional claims in published maps and institutional affiliations.

