1. Introduction
Object detection is an important field in artificial intelligence (AI). Today, there are many computer vision applications based on object detection in different contexts. Accordingly, a wide variety of detection models have been proposed in the literature [
1,
2]. Similarity detection and measures is an emerging field of research in object detection.
A trademark is a form of intellectual property (IP) consisting of a recognizable sign that identifies and distinguishes a product or service from others. It can be text, a phrase, a figurative symbol, a design, or any combination of these. The importance of logos and trademarks in building a brand is unquestionable, even for small businesses. A trademark mirrors the quality and professionalism of the product or service provided. Most customers rely on the trademark’s reputation to make purchase decisions and compare the quality of two products [
3,
4]. Therefore, the added value and additional profit that trademarks endow to their products exceed their real functional benefits [
4]. In 2018, the number of recorded trademark registrations worldwide was approximately equal to 10.9 million, an increase of 19.2%, compared with 2017 [
5].
Some processes should be conducted to ensure that the new mark does not cause confusion with prior registered trademarks and does not match any others in the case of a new trademark [
6]. In visual terms, the meaning of “matching” includes a combination of different parameters, such as colors, shape, and texture.
Nowadays, a number of regional and national IP offices around the world deal with the processes of trademark examination and registration [
6,
7]. Examples include the European Union Intellectual Property Office and the United States Patent and Trademark Office (USPTO), which serve these functions. In Saudi Arabia, the Saudi Authority for Intellectual Property is the official government body responsible for protecting and supporting IP rights in the Kingdom [
7].
Any new trademark should be examined to ensure no confusion or close similarity to any other prior registered marks. In a manual approach, the examination process for any trademark requires a long time as a result of the increasing annual number of registered trademarks. Additionally, the process could be susceptible to error because judging whether two trademarks are similar is subjective and varies from one examiner to another depending on their experience.
The automation of the examination process using AI that facilitates the retrieval of similarity-based trademarks can provide significant help for examiners to achieve higher accuracy. The AI can provide a limited number of most similar trademarks that need to be examined rather than a large database of marks. Although there are already some systems intended to support examiners in the trademark examination process, these systems depend on manually annotated trademarks. Therefore, they are subjective, time-consuming, and error-prone. Consequently, this study develops a trademark similarity detection system using deep learning that can automatically and accurately detect and retrieve registered trademarks that are closest in similarity to an input mark.
The contribution of this study is to provide a framework and comprehensive background for trademark similarity experiments as an examination tool in the trademark registration process. The proposed framework presents a system that reads an image (including the various image formats), extracts its features, and finds the similarity between a given image and each of those stored based on their distance. We investigated the use of convolutional neural network (CNN) to extract image features. Two pre-trained CNNs were utilized individually as features extractors: ResNet-50 and VGG-16. All of the experiments were conducted on a portion of the METU test set, equal to 10,000 images, to accelerate the process, along with the injected query set, to evaluate the retrieval performance.
The following sections illustrate our proposed system framework for the trademark similarity retrieval system.
Section 2 presents related work on this topic.
Section 3 describes our proposed system.
Section 4 presents experiments and results.
Section 5 presents our discussion. Finally,
Section 6 presents the study’s conclusions.
2. Related Work
The increasing number of images being registered as trademarks emphasize the need to automate the tasks of dealing with them, such as image detection, classification, and retrieving similar trademarks accurately. In particular, there is an urgent need to prevent trademark infringements by harnessing machine learning approaches to efficiently detect similarities. This section gives a short overview of previous studies of the trademark image detection and retrieval approaches.
One of the earliest studies in trademark detection was Ciocca and Schettini’s [
8] study in 1998. They proposed an approach for trademark retrieval based on relevant feedback. The user’s perspective directly affects the tuning of the similarity measure used by Ciocca and Schettini’s system. The feature vector of the input trademark was compared with those available in the database and assigned a weight for each to retrieve the higher-ranking images. Then, the user’s feedback was gathered as relevant or irrelevant to the input image to consider the image features for a second iteration. The results showed that user feedback could improve the measure of similarity and enhance the retrieval process.
In the same manner, Haddad et al. [
9] proposed a framework for trademark recognition and retrieval that integrated CNN with relevance feedback (RF) mechanism. The features are optimized using particle swarm optimization and self-organizing map methods as a preprocessing phase to reduce the search space. The framework was tested using the FlickrLogos-32 PLUS dataset. Comparing the proposed framework to methods based on deep learning models alone emphasized the positive impact of combining CNN with an RF mechanism.
CNNs have been efficiently used with most image classification, detection, and recognition tasks. Perez et al. [
10] proposed a method based on a pretrained CNN called VGG19 for trademark image retrieval. The VGG19 network was trained using two different databases. The first, VGG19v, concentrated on visual similarities, and the second, VGG19c, focused on conceptual similarities. The first database contained logos collected from the web and then categorized these into 151 classes based on similarities defined by experts. Further, the second database depended on manually labeled USPTO logos. Both networks complemented each other in the classification task. Combining VGG19v and VGG19c improves the accuracy of image detection tasks.
Additionally, Lan et al. [
11] proposed a trademark retrieval system based on CNN and constraints theory. The Siamese neural network (SNN) model was constructed using VGG-F with a pretrained CNN. The Middle East Technical University (METU) dataset was used to evaluate the proposed method. These experiments showed the effectiveness of the SNN and CNN-Triplet features.
In [
12], the authors proposed a method to detect logos in real-world images. The framework can be divided into two parts: conditioning and segmentation. In conditioning, CNNs are used to extract the features from the query image. The network consists of 13 convolution layers; each of which is activated using the rectified linear unit function. A modified version of the U-Net CNN architecture was used for the purpose of image segmentation, taking into consideration the different scale representations of logos at the encoder end of the U-Net. The proposed method achieved a mean average precision (mAP) score of 89.2, which is the highest score compared to some of the recent logo detection methods.
In trademark images, the figurative component is considered the most critical region in the image. In [
13], the authors’ proposed methods were based on hard- and soft attention mechanisms. U-Net architecture, a fully convolutional network, was trained using focal loss and was used to separate the images into text and nontext pixels for hard attention. Convolutional activation maps were used to assign a weight to the images’ symbolic and text components for soft attention. The authors highlighted some cases in which the proposed method was inefficient. The hard attention mechanism accurately identified the critical components in the images compared with soft attention.
Mosseri et al. [
14] introduced a search engine for trademark similarity detection based on AI. The proposed approach simultaneously searches for similarity among four different aspects: content similarity, image similarity, text similarity, and manually defined content similarity. Then, Mosseri et al.’s approach allowed the examiners to do a manual check between the input trademark and retrieved images from each aspect. As a result, the authors concluded that separating the search aspects produces high detection accuracy when combined with the manual examination.
For the same purpose, Showkatramani et al. [
6] proposed a search approach for trademark image similarity. The feature vectors of trademark images were extracted using ResNet-v2, a pretrained CNN. Then, these vectors were used to search for the nearest image neighbor in the database using the Approximate Nearest Neighbor Oh Yeah and NearPy libraries. The USPTO trademark dataset was used for the model training, whereas the simplistic test dataset was used for model testing purposes. The results obtained a score of 0.69 in mAP.
Searching among large trademark datasets takes a long time and has a high memory cost. Xia et al. [
15] proposed a framework based on deep hashing to classify trademark images for retrieval purposes. They applied a data augmentation strategy to the dataset’s images to enhance the training process. They used two heterogeneous convolutional networks to extract the visual features: a spatial transformer network and a recurrent convolutional network. A fusion layer was added in addition to a hash layer. This combined both networks’ feature maps to generate binary code for the images. The Hamming distances metric was used to measure the similarity between the query image and each image stored in the dataset. The proposed framework was evaluated using two trademark image datasets: NPU-TM and METU. The obtained results were 0.449 and 0.501 mAP using the NPU-TM and METU datasets, respectively.
Morita et al. [
16] proposed another method for trademark-similarity retrieval using vector images. The proposed method extracted the features of each object in a given image from the image’s angle histogram. Then, the algorithm evaluated the objects’ similarity between a query image and images in the dataset by measuring the distance. The proposed method independently evaluated the shape similarities between each object well.
Since the histogram angle does not depend on the location of the segment, Morita et al. [
17] proposed an enhancement to the method in [
16] by considering the relative location of contour segments besides their angle. Thus, contour points were prepared and these defined the shape features as two vectors for each object. The first vector is the distance (d) between the centroid point and every contour point, and the second is the angle between the line of d and tangent line of the object at the contour point. Results showed that the accuracy of the similarity retrieval method was improved.
The combination of text, pronunciation, and image also represents the trademark and must protect it against infringement. Trappey et al. [
3] proposed a novel system to analyze the trademark similarity that involves spelling, pronunciation, and image similarity. The system contains three machine learning models to study three types of similarities: natural language processing (NLP), SNN, and CNNs. The Word2vec model was constructed using Google News to analyze spelling similarity, and then the string similarity was measured with the vector space model algorithm. In contrast, the pronunciation similarity was detected using the phonetic matching algorithm, and its similarity was then measured with the Levenshtein algorithm. The proposed method used a combination of CNN and SNN for image-based similarity, which is our interest. The main purpose of SNN is to transform the query images to feature vectors. Then, it will minimize the feature distance in the case of matching pairs; otherwise, the feature distance will be maximized. Moreover, SNN used two multi-input CNNs in the form of VGG-Net16 architecture. The proposed image-based similarity model was trained using a number of Cifar-10 and TopLogo-10 dataset images. The results of the proposed image-based similarity model showed the effectiveness of using CNNs to measure similarity compared to the models presented in the literature.
Conceptual similarity is an essential parameter for trademark comparison. Khamkar et al. [
18] proposed a system for detecting trademark conceptual similarity. First, all dataset images are resized to a fixed dimension. Next, it uses NLP techniques dealing with text, where the stopwords are removed, and the words are reformed to the root. Moreover, it calculates synonyms based on the WordNet dictionary. Then, the similarity distance computation is performed along with the histogram algorithm. If there is a similar trademark, it will be retrieved for the user; otherwise, a message will appear to announce that the trademark is available to use.
Applying different feature extractors leads to obtaining different results. Aires et al. [
19] applied four feature extractors to find the best-fitting method for a trademark. The feature extractors were concavity/convexity deficiency, Freeman chain code, scale-invariant feature transform, and Hu-invariant moments (Hu). The artificial neural network and support vector machine (SVM) were used to select the best extractor for classification purposes. The experiment was conducted using the UK Patent Office database that includes 10,151 images. The results show that using the SVM could improve the retrieval process in the case of a trademark. It obtained a normalized recall equal to 0.91.
The visual features mainly distinguish trademarks from each other. Lan et al. [
20] proposed integrating a CNN and local binary pattern (LBP) to extract features. The VGGNet-f model was used to extract the image features. Furthermore, the uniform LBP feature was extracted from the convolution feature map after normalizing its value to 0-255. Next, the dimensions of cascade LBP features were reduced using principal component analysis (PCA). The experiment was conducted using 7,139 of the collected trademark images, along with the METU dataset. As a result, the proposed method has much better performance than others in the past, where it achieved a recall of 89.63%.
3. Materials and Methods
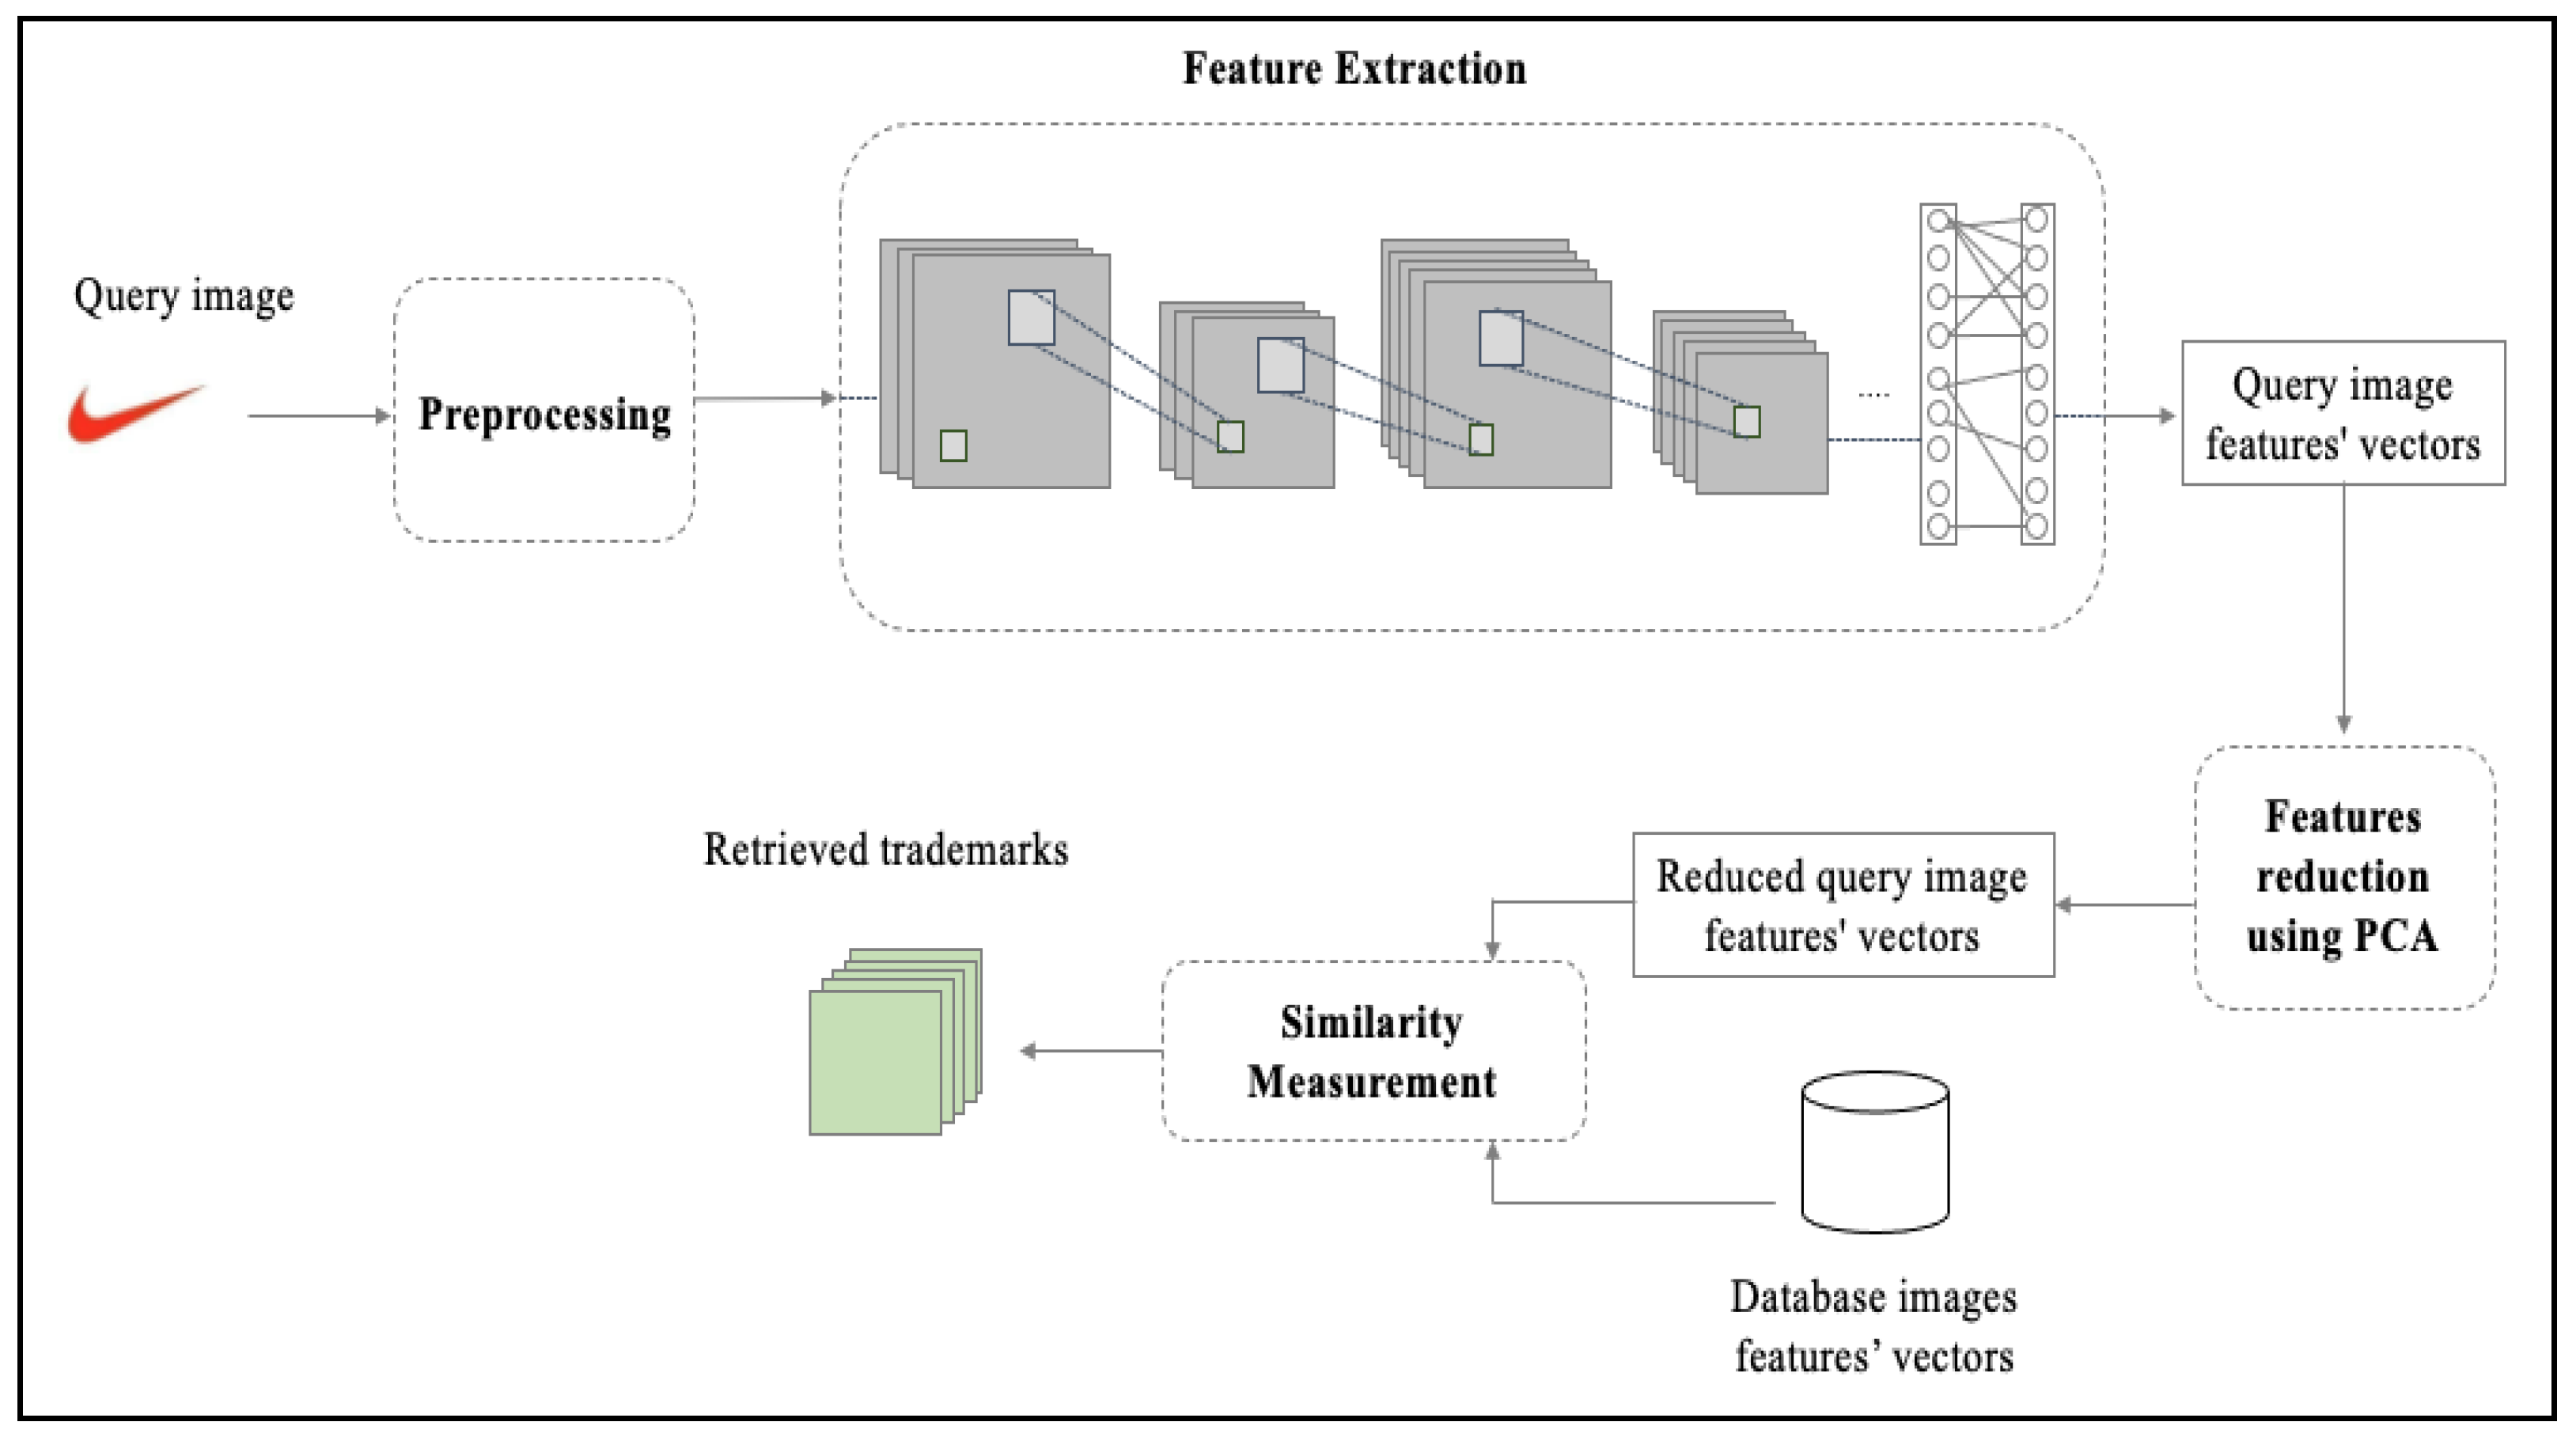
Deep learning allows a wide range of intelligent tasks to be automatically and efficiently performed. It has allowed for significant advancements in solving many difficult problems with performance that could exceed human capabilities. The proposed trademark similarity detection system will help the examiners in the IP offices and individual users guarantee that a given trademark does not match any prior registered trademarks by harnessing the potential of deep learning to automate extracting the image’s features. Two pretrained CNNs are individually utilized: VGG-16 and ResNet-50. The distance between the query image and each previously registered trademark is measured using the Euclidean distance metric. Finally, the system retrieves the images with the smallest distance, meaning they are the most similar to the given query.
The system architecture consists of four main modules: preprocessing, feature extraction, feature reduction, and similarity measurement.
Figure 1 presents the system’s architecture.
The system was developed using Python version 2.7.12, with the help of Google Colaboratory from Google Research, a hosted Jupyter Notebook service that provides access to graphics processing units. Moreover, the dataset was uploaded into Google Drive to manage storage.
The following subsection briefly describes our proposed system. We start by describing the benchmark dataset, followed by the utilized techniques of the essential system components. Finally, it presents the metrics used to evaluate the system performance.
3.1. Dataset
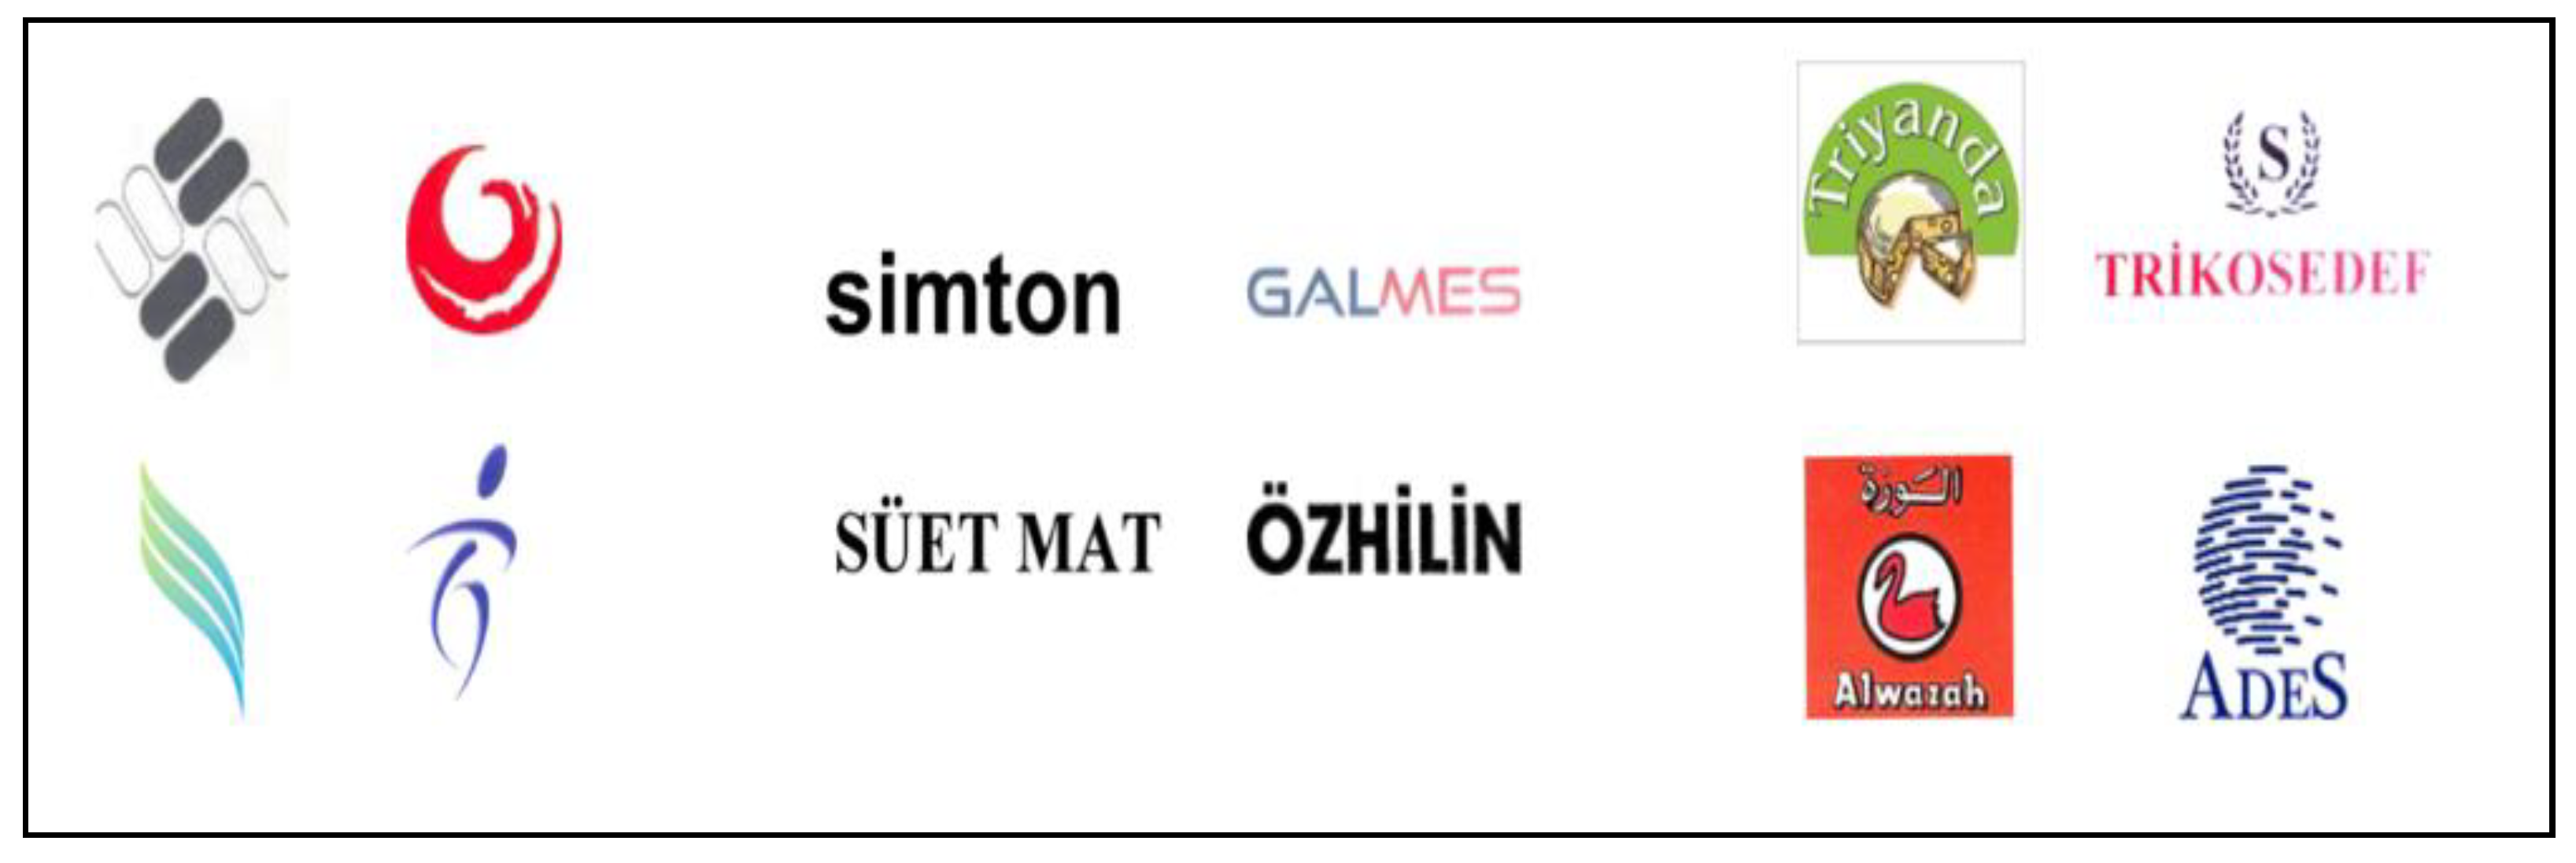
Trademark similarity detection is an image retrieval operation used to guarantee that a new trademark does not match any previously registered marks. The METU dataset is considered one of the best datasets due to its large scale, consisting of more than 923,000 trademark images containing text only, figures only, both figure and text, or unknown content [
21]. All the images are in JPEG format at various sizes and resolutions, from 30 × 30 pixels to 180 × 180 pixels. It has two main sets: the query set and test set. The query set is an independent labeled set containing 417 trademark images that belong to 35 different classes based on shape similarity. The primary role of the query set is to evaluate such a system. It could be injected into the entire or part of the test set, and then the image retrieval approach can be applied for the whole dataset and the rank of the relevant images that belong to the same query class can be looked at.
Figure 2 shows a sample of the METU dataset.
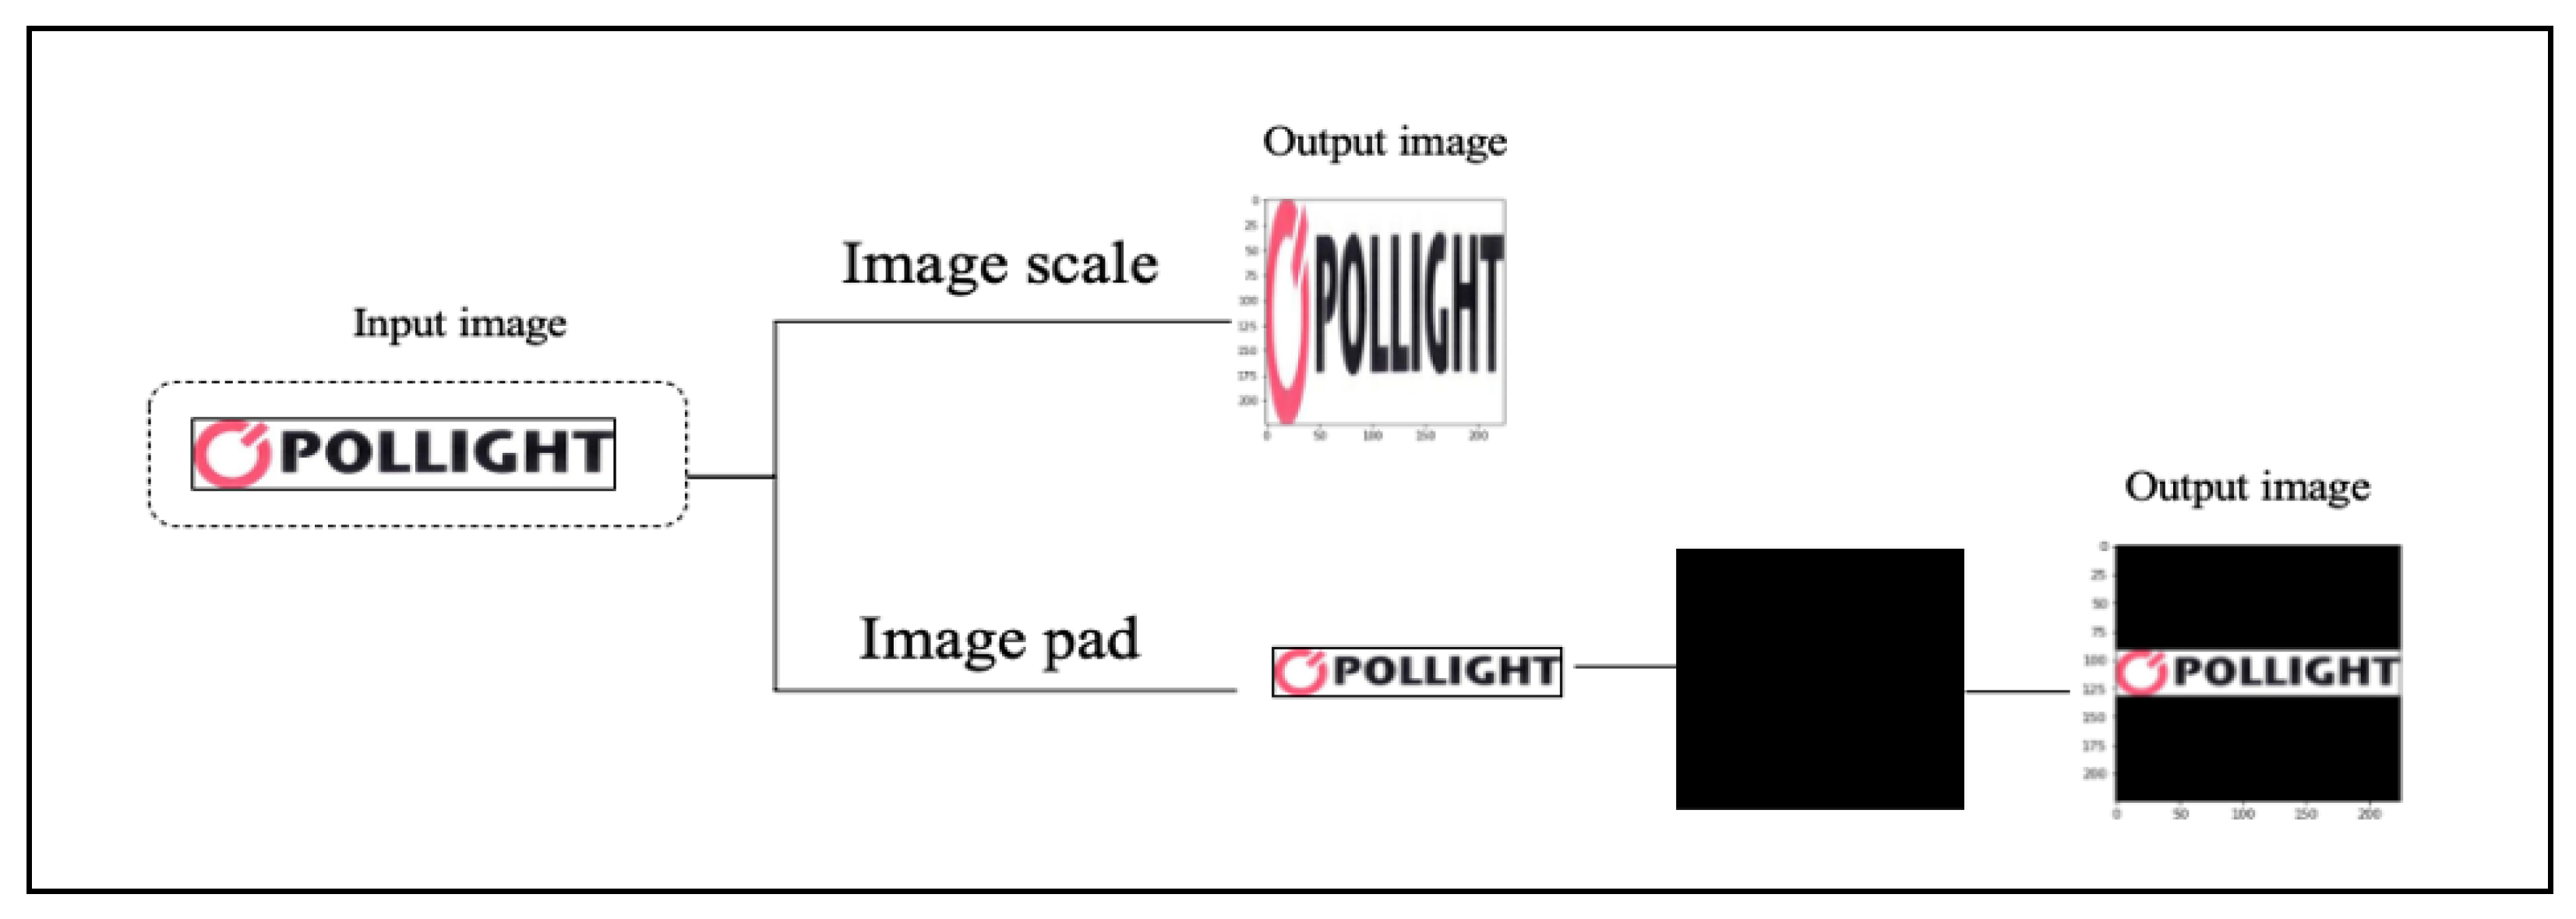
3.2. Preprocessing
The nature of trademark images is artificial and as such they require little or no processing. Moreover, any pretrained CNNs require a specific input dimension. Due to the dataset images being a variety of sizes, all images were resized to the accepted dimension by a given CNN, which is in our case equal to 224 × 224. Therefore, two approaches were conducted: scaling and padding to choose the best approach that does not lose the image’s information. The image scaling changes the input image’s height h and width w to the target dimension n × n.
In contrast, the image padding process involves finding the max value m of the height h and width w of the input image and then computing the ratio of n to the max value m. Thereafter, it changes the input image size to the integer value of (h × ratio, w × ratio). Finally, it creates the blank image with the dimension of n × n and pastes the newly resized image into the blank image (
Figure 3).
3.3. Features Extraction
As mentioned in
Section 2, using deep learning to extract image features improves related system results due to deep learning’s ability to extract deep features, such as efficiently detecting an intended object within a short time frame. Therefore, two pretrained CNNs were individually utilized to extract image features. The features were extracted from the pooling layer of a ResNet-50 and VGG16 with an output dimension of 2048 and 512, respectively. Then, their performance was compared.
3.4. Features Reduction
Many problems arise when working on high-dimensional features, i.e., adding too many features worsens recognition performance; this problem is known as the curse of dimensionality [
22]. Feature reduction refers to the techniques used to reduce the size of the vectors. As mentioned above, the dimensions of the features produced by ResNet-50 and VGG-16 are too large; therefore, reducing the features is essential to overcome future issues.
PCA is an unsupervised technique used in machine learning for reducing dimensionality [
22]. It aims to reduce the data dimensions from
n variables to
m components, where
m < n. This means representing the data using
m components (instead of
n), accounting for the most variance [
23], i.e., whenever the correlation between features is high, the PCA will combine these correlated features within a smaller number of uncorrelated features.
In this study, PCA was used to reduce the features extracted by two models to improve the recognition/detection performance. PCA works better if a linear structure in the data and variables are scaled in the same unit. Since the features were already normalized, features scaling was unnecessary. Moreover, the features extracted by the ResNet-50 and VGG-16 models were represented by 1450 and 410 components, respectively. These components explained more than 95% of the variance.
3.5. Similarity Measurement
As mentioned above, the output of the preceding module is the feature vector. Thus, in order to compute the similarity between the query and the stored dataset images, some computation should be conducted to calculate the distance between their feature vectors. If the distance is too small, then the images will be considered similar to each other. According to the literature, the Euclidean distance is one of the most effective measures in terms of classifying trademarks. The distance is computed from the query image to each image in the database. Next, the images are ranked based on their distance, in increasing order. Then, the system retrieves n ranked images corresponding to the user input. Consider the feature vector q for a given query and set of database features vectors
a1,
a2,…,
an. The system will measure the similarity between q and every feature vector from
a1 to
an. The Euclidean distance will be calculated using the following equation [
24]:
3.6. Evaluation
Evaluation is a process that is intended to ensure that the system performs in the way it should. In similarity detection, the system should be able to retrieve the images most similar to the query, or at least one of them. To this end, the proposed system was evaluated using three measures: average rank, normalized average rank, and mAP. The average rank metric computes the average ranks of the image belonging to the same query class [
21]. As shown in Equation (2),
Nrel refers to the number of relevant images in the query class, and
Ri the rank of the
ith relevant query.
The normalized average rank value is between [0,1], where zero represents the best retrieval performance and 0.5 is random performance [
21]. The normalized average rank equation is given below, where N refers to the size of the dataset.
The value mAP is the most frequently metric used to evaluate object-detection systems [
25]. Average precision (AP) is the positive value over the predicted positives, where a true positive equals 1 for an image relevant to the query q; otherwise, it is 0. Therefore, mAP is the mean of the AP for each q made over the total number of queries. The higher the mAP value, the better the performance.
where
Q is the number of queries in the set.
4. Experiments and Results
Several parameters and procedures played essential roles in the final results. Thus, many experiments with different techniques should be conducted to consider all possible situations. Some of these procedures include the methods used to process the input images and extract the image features, as well as additional processes to improve the system performance.
There is no single optimal or standard CNN structure. Each problem might be solved using various CNN structures, but the best-fitting one can be obtained through experiments for a given problem. Indeed, several CNN architectures that were pretrained on a large dataset for image classification purposes and achieved high accuracy are available to reuse for related problems.
With reference to one of the most valuable competitions that encourages researchers and developers to develop such a solution, is the ImageNet Large Scale Visual Recognition Challenge (ILSVRC). It is an annual competition that was conducted from 2010 to 2017 for object detection and image classification. Many of the current innovations have sprung from the ILSVRC competition. AlexNet, VGGNet, and ResNet are some of the popular CNN architectures that were developed during an ILSVRC [
26].
AlexNet was introduced in 2012 by Krizhevsky et al. [
27]. AlexNet was trained on more than 1.2 million images of the ImageNet dataset to classify them into 1000 classes belonging to different natural objects. It consists of 650,000 neurons and eight layers in total (five convolutional layers and three fully connected layers). The max-pooling layer follows the first, second, and fifth convolutional layers. Moreover, the rectified linear unit (ReLU) is applied to each neuron’s output. The ReLU is the factor that makes AlexNet more efficient compared with other activation functions, as it helps to accelerate the learning process and computational efficiency. To reduce the overfitting, data augmentation and dropout methods were applied. As a result, AlexNet won the ILSVRC-2012 competition by achieving top-1 and top-5 test set error rates of 37.5% and 17%, respectively.
VGGNet was inspired by the AlexNet architecture [
28]. It consists of a 3 × 3 kernel-size filter to produce a better recognition rate than the large-size filter. There are two different architectures of VGGNet: VGGNet16 and VGGNet19; these consist of 16 and 19 layers, respectively. Both architectures are composed of 3 × 3 convolutional, 2 × 2 max-pooling, and three fully connected layers. The last of the fully connected layers utilizes a softmax for classification purposes. Consequently, VGGNet achieved a top-5 test set error rate of 6.8%.
ResNet stands for Residual Network, a neural network introduced by K. He et al. [
29]. It was inspired by the VGG network. The main idea behind ResNet is to “identity shortcut connections,” which skip one or more network layers. The ResNet architecture consists of a 34-layer plain network, along with the shortcut connection. Most convolution layers have 3 × 3 filters and perform downsampling with a stride of two. The network ends with a global average pooling layer, followed by a fully connected layer that utilizes a softmax. As a result, ResNet won first place in the ILSVRC-2015 classification competition by achieving a top-5 test set error rate of 3.57%.
The following subsections briefly describe each experiment along with the corresponding evaluation results. The experiments are divided based on the image features extracted to make them easy to read.
4.1. Experiments
The main component of a similarity detection system is a feature extractor that involves image-fetching features to help distinguish similar images from others. In this study, two pretrained CNNs were individually utilized as features extractors: ResNet-50 and VGG-16. Moreover, trademark images often require much less preprocessing due to them being artificial and many processes being conducted automatically using the pretrained CNNs. Furthermore, all of the experiments were conducted on a portion of the METU test set, equaling 10,000 images, to accelerate the process, along with the injected query set, to evaluate the retrieval performance. The following two sections describe the experiments conducted with the help of two feature extractors.
4.1.1. ResNet-50 Features Extractor
All of the following experiments utilized the ResNet-50 model to extract image features.
- 1.
ResNet-50-based similarity detection (RSD) with image scaling-up: This experiment utilized the ResNet-50 model as a feature extractor. Since the images are a variety of sizes and the pretrained CNNs required a particular input size, in this experiment, all of the images were scaled to the size required by a model, specifically 224 × 224.
- 2.
RSD with image scaling-up and feature reduction using PCA: The dimension of the extracted features by the ResNet-50 model is equal to 2048, which is large to handle and process. So, there is a benefit to reducing the overall features. Therefore, this experiment used features reduced by PCA of scaling images.
- 3.
RSD with image padding: In this experiment, each image was resized and padded into a 224 × 224 image, which is the size required by ResNet-50.
- 4.
RSD with image padding and feature reduction using PCA: This experiment used features reduced by PCA of the padding images.
4.1.2. VGG-16 Features Extractor
All of the following experiments were conducted based on the features extracted by VGG-16.
- 1.
VGG-16-based similarity detection (VSD) with image scaling-up: This experiment utilized the VGG-16 model to extract all of the images’ features. Moreover, all images were scaled to the size required by a VGG-16, which is equal to 224 × 224.
- 2.
VSD with image scaling-up and feature reduction using PCA: As mentioned above, the dimension of the extracted features should be reduced. So, this experiment used features reduced by PCA of scaling images.
- 3.
VSD with image padding: In this experiment, each image was padded into a 224 × 224 image, which is the input size required by VGG-16.
- 4.
VSD with image padding and features reduction using PCA: As with the previous experiments, this experiment investigated the effect of the feature reduction technique for the features extracted from the padded images.
Table 1 shows the average and normalized average ranks for each conducted experiment using the ResNet-50 features extractor and VGG-16 features extractor, respectively.
The above table shows that Exp#1 and Exp#2 achieved results that are close to each other; the average rank and R of the related experiment were improved by applying the PCA reduction technique. In contrast, the worst results were obtained from the features extracted by the VGG-16 pooling layer for padded images.
Table 2 presents the mAP value for each experiment.
As shown in
Table 2, the mAP values of the first four experiments were close to each other, which represent the experiments that utilized ResNet-50 as a feature extractor. Hence, the ResNet-50 feature extractor overcomes the VGG-16 performance in the conducted experiments.
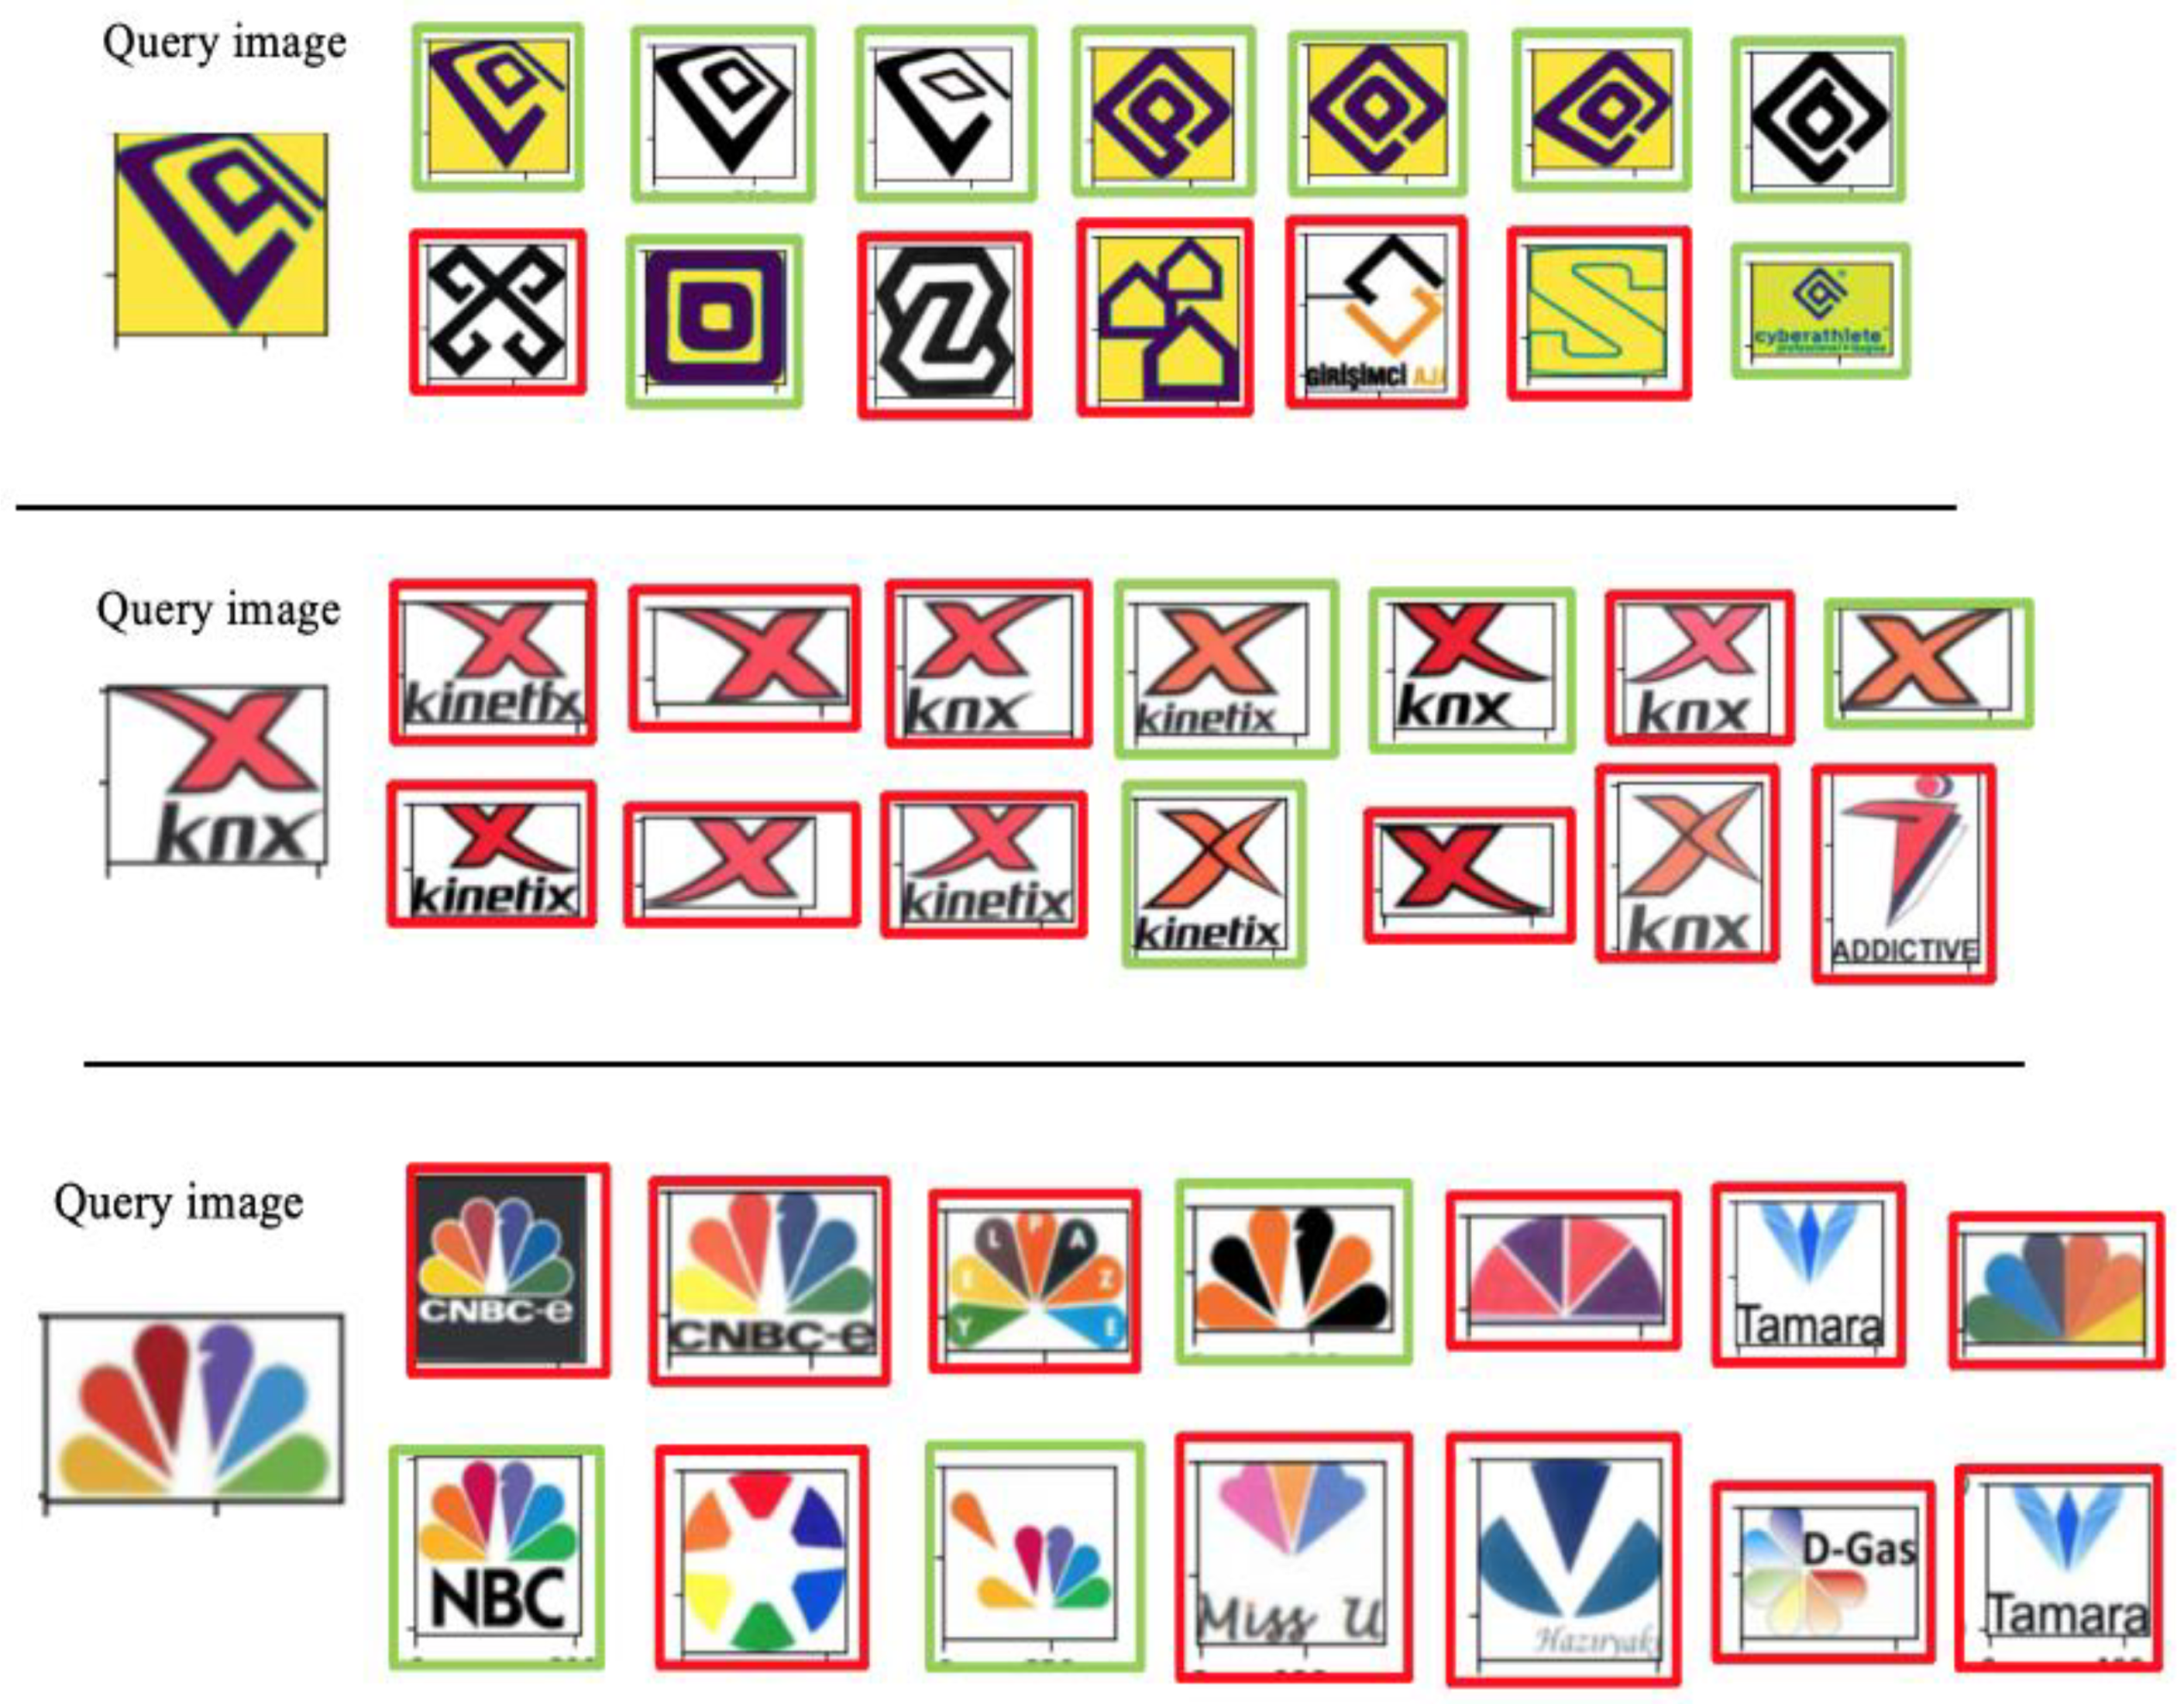
Figure 4 presents some examples of the developed trademark similarity detection system. The green rectangles identify the true positives (images belong to the same query class); the remaining images are bounded into red rectangles. A yellow background was used to clearly show the results.
Table 3 presents the comparison between the performance of the proposed approach and other studies other previous studies that use similar approaches, where they used the same dataset.
Tursan et al. [
21] used pre-trained models with different parameters over the METU dataset, and the output of FC7 of VGG16 achieved the best retrieval performance, which was 0.086 of NAR.
Feng et al. [
30] proposed a method that extracted features starting from trademarks’ edge images until the enhanced SIFT features. As a result, their model achieved an NAR of 0.083, outperforming some of the deep-learning methods.
Cao et al. [
31] proposed using the ResNet50 model on the METU dataset by considering features from the FC layer. Their propsed model achieved a NAR of 0.110.
As shown in
Table 3, the retrieving performance of the relation database method overcomes the methods proposed by Tursan et al., Feng et al., and Cao et al. with the fully-connected layer. Additionally, it achieved an mAP of 0.774, which means that the proposed approach gives a promising result in detecting trademark similarity.
5. Discussion
In our study, we used mAP to evaluate the retrieval performance of our proposed model. We also compared our proposed method with other studies using the average rank and normalized average rank. As shown in
Table 1 and
Table 2, the best performance was achieved by Exp#2, which was based on reducing the features extracted by ResNet-50 for rescaled dataset images. It achieved an average rank of 774.447, a
of 0.0737, and an mAP of 0.759, which were the best results compared to the other experiments. Moreover, 85% of the relevant images to a given query appeared on the top 20 retrieved images.
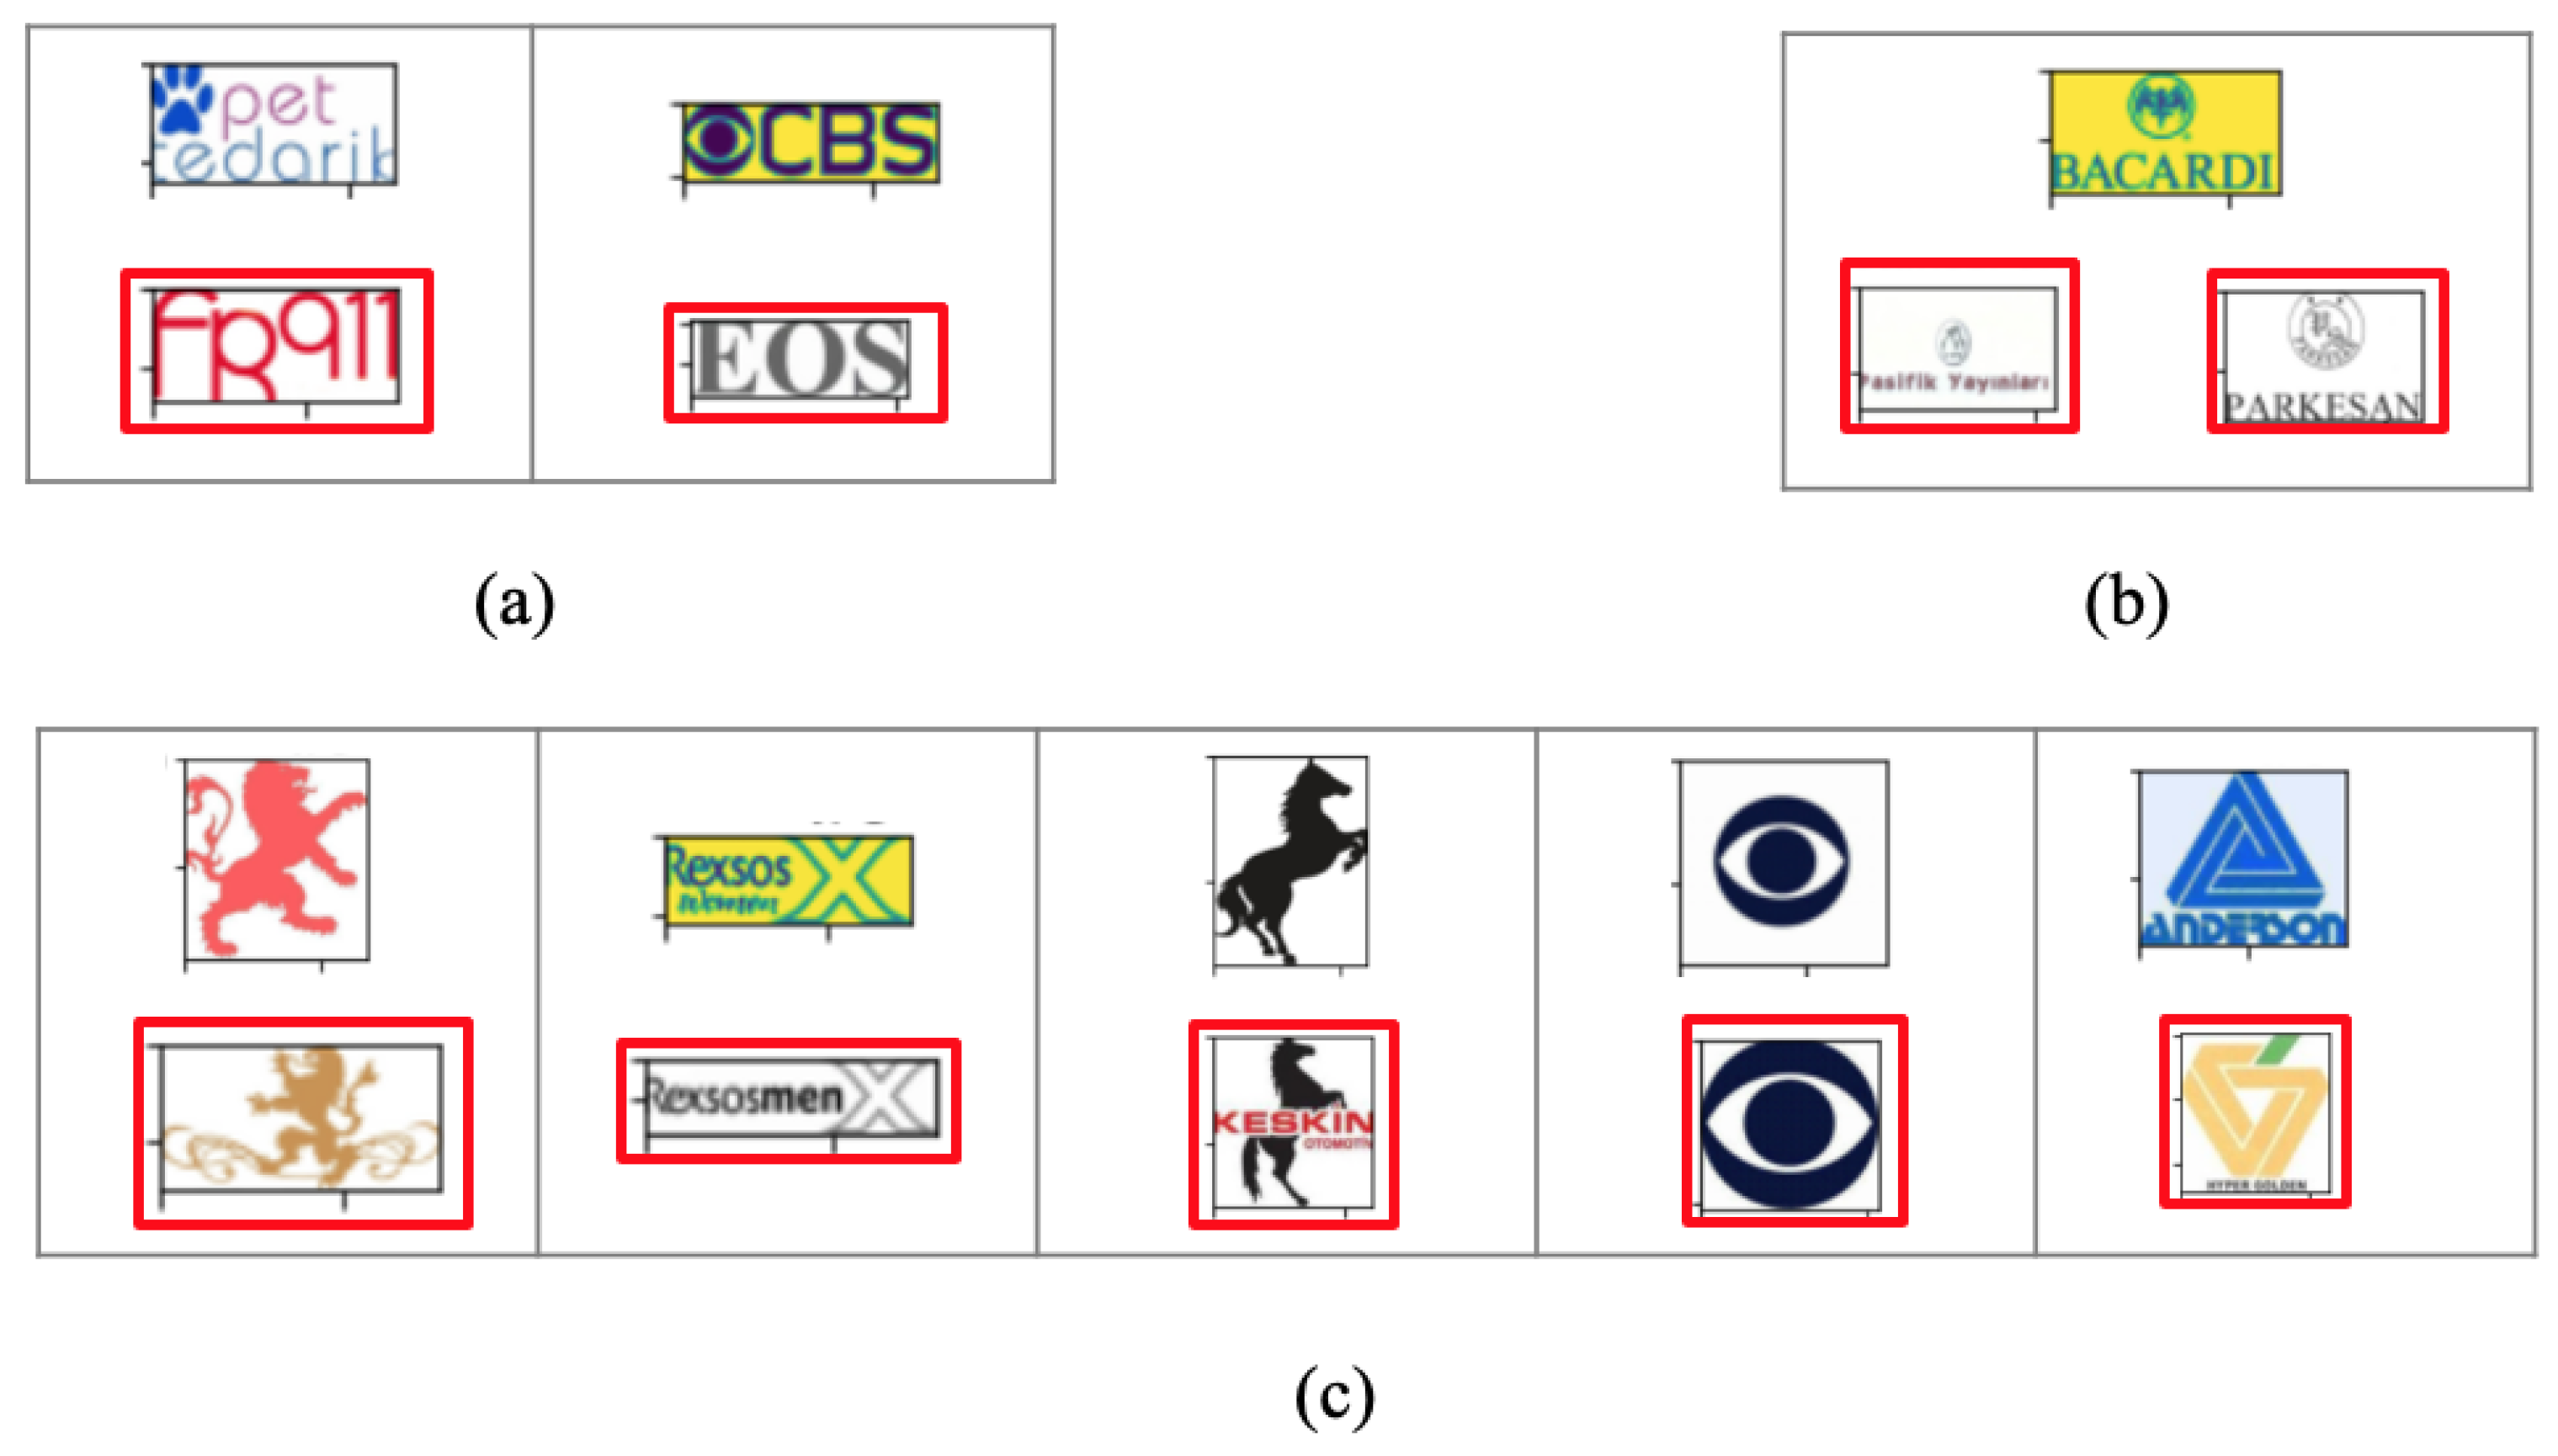
Visual analysis helped in further understanding the system’s performance. Whenever the query was a trademark with a clear shape, the system was either able to retrieve all relevant images or most of them correctly (see
Figure 5). In contrast, the text included in the query image could mislead the system to detect the core component because it was dealing with each letter as a shape (
Figure 5a). Therefore, the system must be improved to consider semantic similarities. Moreover, the detection performance was primarily affected by some parameters, such as the arrangement of the objects and spaces (
Figure 5b). Additionally, when evaluating this system, some of the most similar images to the query existed in the test set (large unclassified dataset), but they were not considered to be similar because they did not belong to the same query class. For example, as shown in
Figure 5c, the images in the red rectangles appeared in the top 15 retrieved images for a related query, but they were not considered relevant.
6. Conclusions
There is potential for machine learning applications to enhance the examination process by providing examiners with an automated image detection system that would facilitate improved accuracy in the detection process. This study aimed to provide a trademark similarity detection system based on deep learning that is able to automatically and accurately detect and retrieve the registered trademarks that are most similar to the input mark. The target system users are both IP examiners and individual users. The system provides assessments in the examination process by retrieving the trademark images that most closely resemble the input for the IP examiners. Thus, the examiners compare the query input with the limited number of most similar marks retrieved by the system. It helps the individual users by providing them the guarantee that a trademark is a right reserved exclusively by them and is not similar to any prior ones. As a result, the system achieved an average rank of 67,067.788, a normalized average rank of 0.073, and a mAP of 0.774.
ResNet50 model was used only by a few studies for image features extraction, mainly the trademarks. In our study, we found that the deep architecture of ResNet50 could help extract the distinct features, even without training on an annotated dataset.
Future directions for our work include considering the semantic similarities to be able to detect a similarity among text-only trademarks. Moreover, a large annotated trademark dataset will be built to fine-tune the model in order to improve the model’s performance.


