Article

Recording of Long Low-Amplitude Bulk Elastic Waves in Transparent Solid Waveguides by Digital and Classical Holography

by
Andrey V. Belashov
,
Anna A. Zhikhoreva
and
Irina V. Semenova
*
Ioffe Institute, 26, Polytekhnicheskaya, 194021 St. Petersburg, Russia
*
Author to whom correspondence should be addressed.
Appl. Sci. 2022, 12(3), 1687; https://doi.org/10.3390/app12031687
Submission received: 27 December 2021 / Revised: 31 January 2022 / Accepted: 1 February 2022 / Published: 7 February 2022
(This article belongs to the Special Issue Holographic Technologies: Theory and Practice)

Abstract

:
In this paper we compare two implementations of the holographic technique for recording long, nonlinear, elastic waves of low amplitude in solid polymer waveguides: classical holographic interferometry and digital holography. Both implementations are realized in transmission configuration, with recording in the off-axis schematic. The advantages and disadvantages of these implementations are discussed as applied to the investigation of the evolution of shock waves and strain solitons in transparent solid waveguides.

1. Introduction

Holographic interferometry began to be actively used in research in various fields of physics for several decades. This approach was applied to, among other problems, studies of the mechanical properties of membranes and solids [1,2,3], processes occurring in plasma [4,5,6], gas flows [7], shock waves [8,9] and many other physical phenomena [10,11,12]. Besides this, holographic interferometry was used for the non-destructive testing of a wide range of industrial products [13,14]. The rapid progress in digital matrix photodetectors and their widespread use significantly affected further development of holographic methods.
Digitalization allowed for the significant simplification of hologram recording procedures and enabled automatic data processing. However the transition from high-resolution photographic films or plates to digital matrices imposed significant restrictions on the minimal resolvable width of interference fringes, and necessitated changes in experimental methodology, which was previously based on the simultaneous optical reconstruction of two object waves existing at different time moments but recorded on the same frame [10]. An adaptation of interference methods to digital recording triggered the development of a number of numerical algorithms optimized for the analysis of digital holograms, in particular, those of phase–image deconvolution [15,16,17], filtering [18,19,20,21] the automatic segmentation of specific parts of object waves on recorded phase distributions [22,23], as well as tomographic algorithms [24,25]. The development of high-speed digital cameras equipped with fast, global shutters allowed eliminating the need to probe rapid dynamic processes using pulsed lasers [26]. At the same time, despite much more frequent use of digital holography, especially in the field of microscopy and biology [27,28,29,30,31], holographic interferometry with traditional recording on holographic plates and films is still in demand in a number of applications [32,33,34,35,36]. Among these applications is the recording of elastic waves of different types in solids, in particular, shock and strain solitary waves (solitons) in solid waveguides. Linear elastic waves are widely used for the non-destructive analysis of internal structure and integrity of constructional elements [37]. Nonlinear elastic waves can be applied for the investigation of the nonlinearly elastic and viscoelastic properties of materials [38,39,40].
In this paper we report a comparative analysis of experimental results on monitoring the strain soliton formation from shock waves in a solid waveguide by means of holographic interferometry and digital holography. Specific advantages and disadvantages of the two techniques are discussed in view of the investigation of this particular process, characterized by significant difference in the parameters of these two types of elastic waves. The two, basically different, pump-probe approaches applied in the holographic monitoring of fast processes (at the nanosecond time scale) are validated and analyzed. The utilization of both techniques for the investigation of the same process demonstrated similar results; in particular, close values of soliton parameters and the evolution dynamics of fast-decaying, short-wavelength, oscillating components. Specific features of the procedure for stitching together several frames obtained by both digital holography and classical holographic interferometry are discussed. Certain specifics of spatial resolution, achieved using these two techniques, are analyzed as well. In general, we demonstrate that, in spite of the relatively complex experimental implementation classical holographic interferometry has certain advantages over easily-automated digital holography.

2. Experimental Methodology

2.1. Formation of Long Bulk Strain Waves from the Initial Shock Wave

Our previous studies (see [26,41,42] and references therein) have shown that bulk nonlinear strain solitary waves (solitons) can be efficiently formed in polystyrene, polymethylmethacrylate (PMMA) and polycarbonate waveguides from a shock wave generated in water nearby the waveguide input by the pulsed laser evaporation of metallic foil. The process of shock wave transformation into a strain soliton in the solid waveguide is not instantaneous and has not been sufficiently studied as yet. It was experimentally shown that the soliton is formed in rods at a distance of about 10–20 rod radii from its input [41]. Depending upon the initial shock wave energy, a single soliton or a soliton train (a wave packet of two or more solitons) or a soliton followed by an oscillating tail can be formed. The typical width of a soliton formed in a rod of 10 mm in diameter is about several centimeters, while that of the soliton train or soliton with a tail is much larger and can reach several tens of centimeters. Recording of such wave patterns, elongated in one direction, raises significant difficulties and often requires “stitching” of several sequential wave patterns recorded at different time moments.

2.2. Recording of Wave Evolution in Solid Waveguides

The holographic approach applied to record long elastic strain waves in transparent solid waveguides is based on registration of variations in waveguide density and thickness caused by the propagating elastic wave. Since the initial shock wave is generated in water, to provide its efficient introduction into the solid waveguide, the initial waveguide segment, 1–5 cm, long was submerged in water and fixed in the cuvette. The main part of the waveguide was surrounded by air, which allowed us to avoid superposition of waves in water around the waveguide on the resulting wave pattern.
The holographic recording of wave patterns in the waveguide was carried out in an in-transmission configuration in the off-axis schematic of a Mach-Zehnder interferometer. For waveguides, we used a bar, 600 mm long, 10 × 10 mm in cross section, and a rod, 10 mm in diameter with horizontal transparent flats providing waveguide transparency for in-transmission recording. Both waveguides were made of transparent polystyrene. The evolution of wave patterns in the waveguides was recorded by classical holographic interferometry and digital holography.

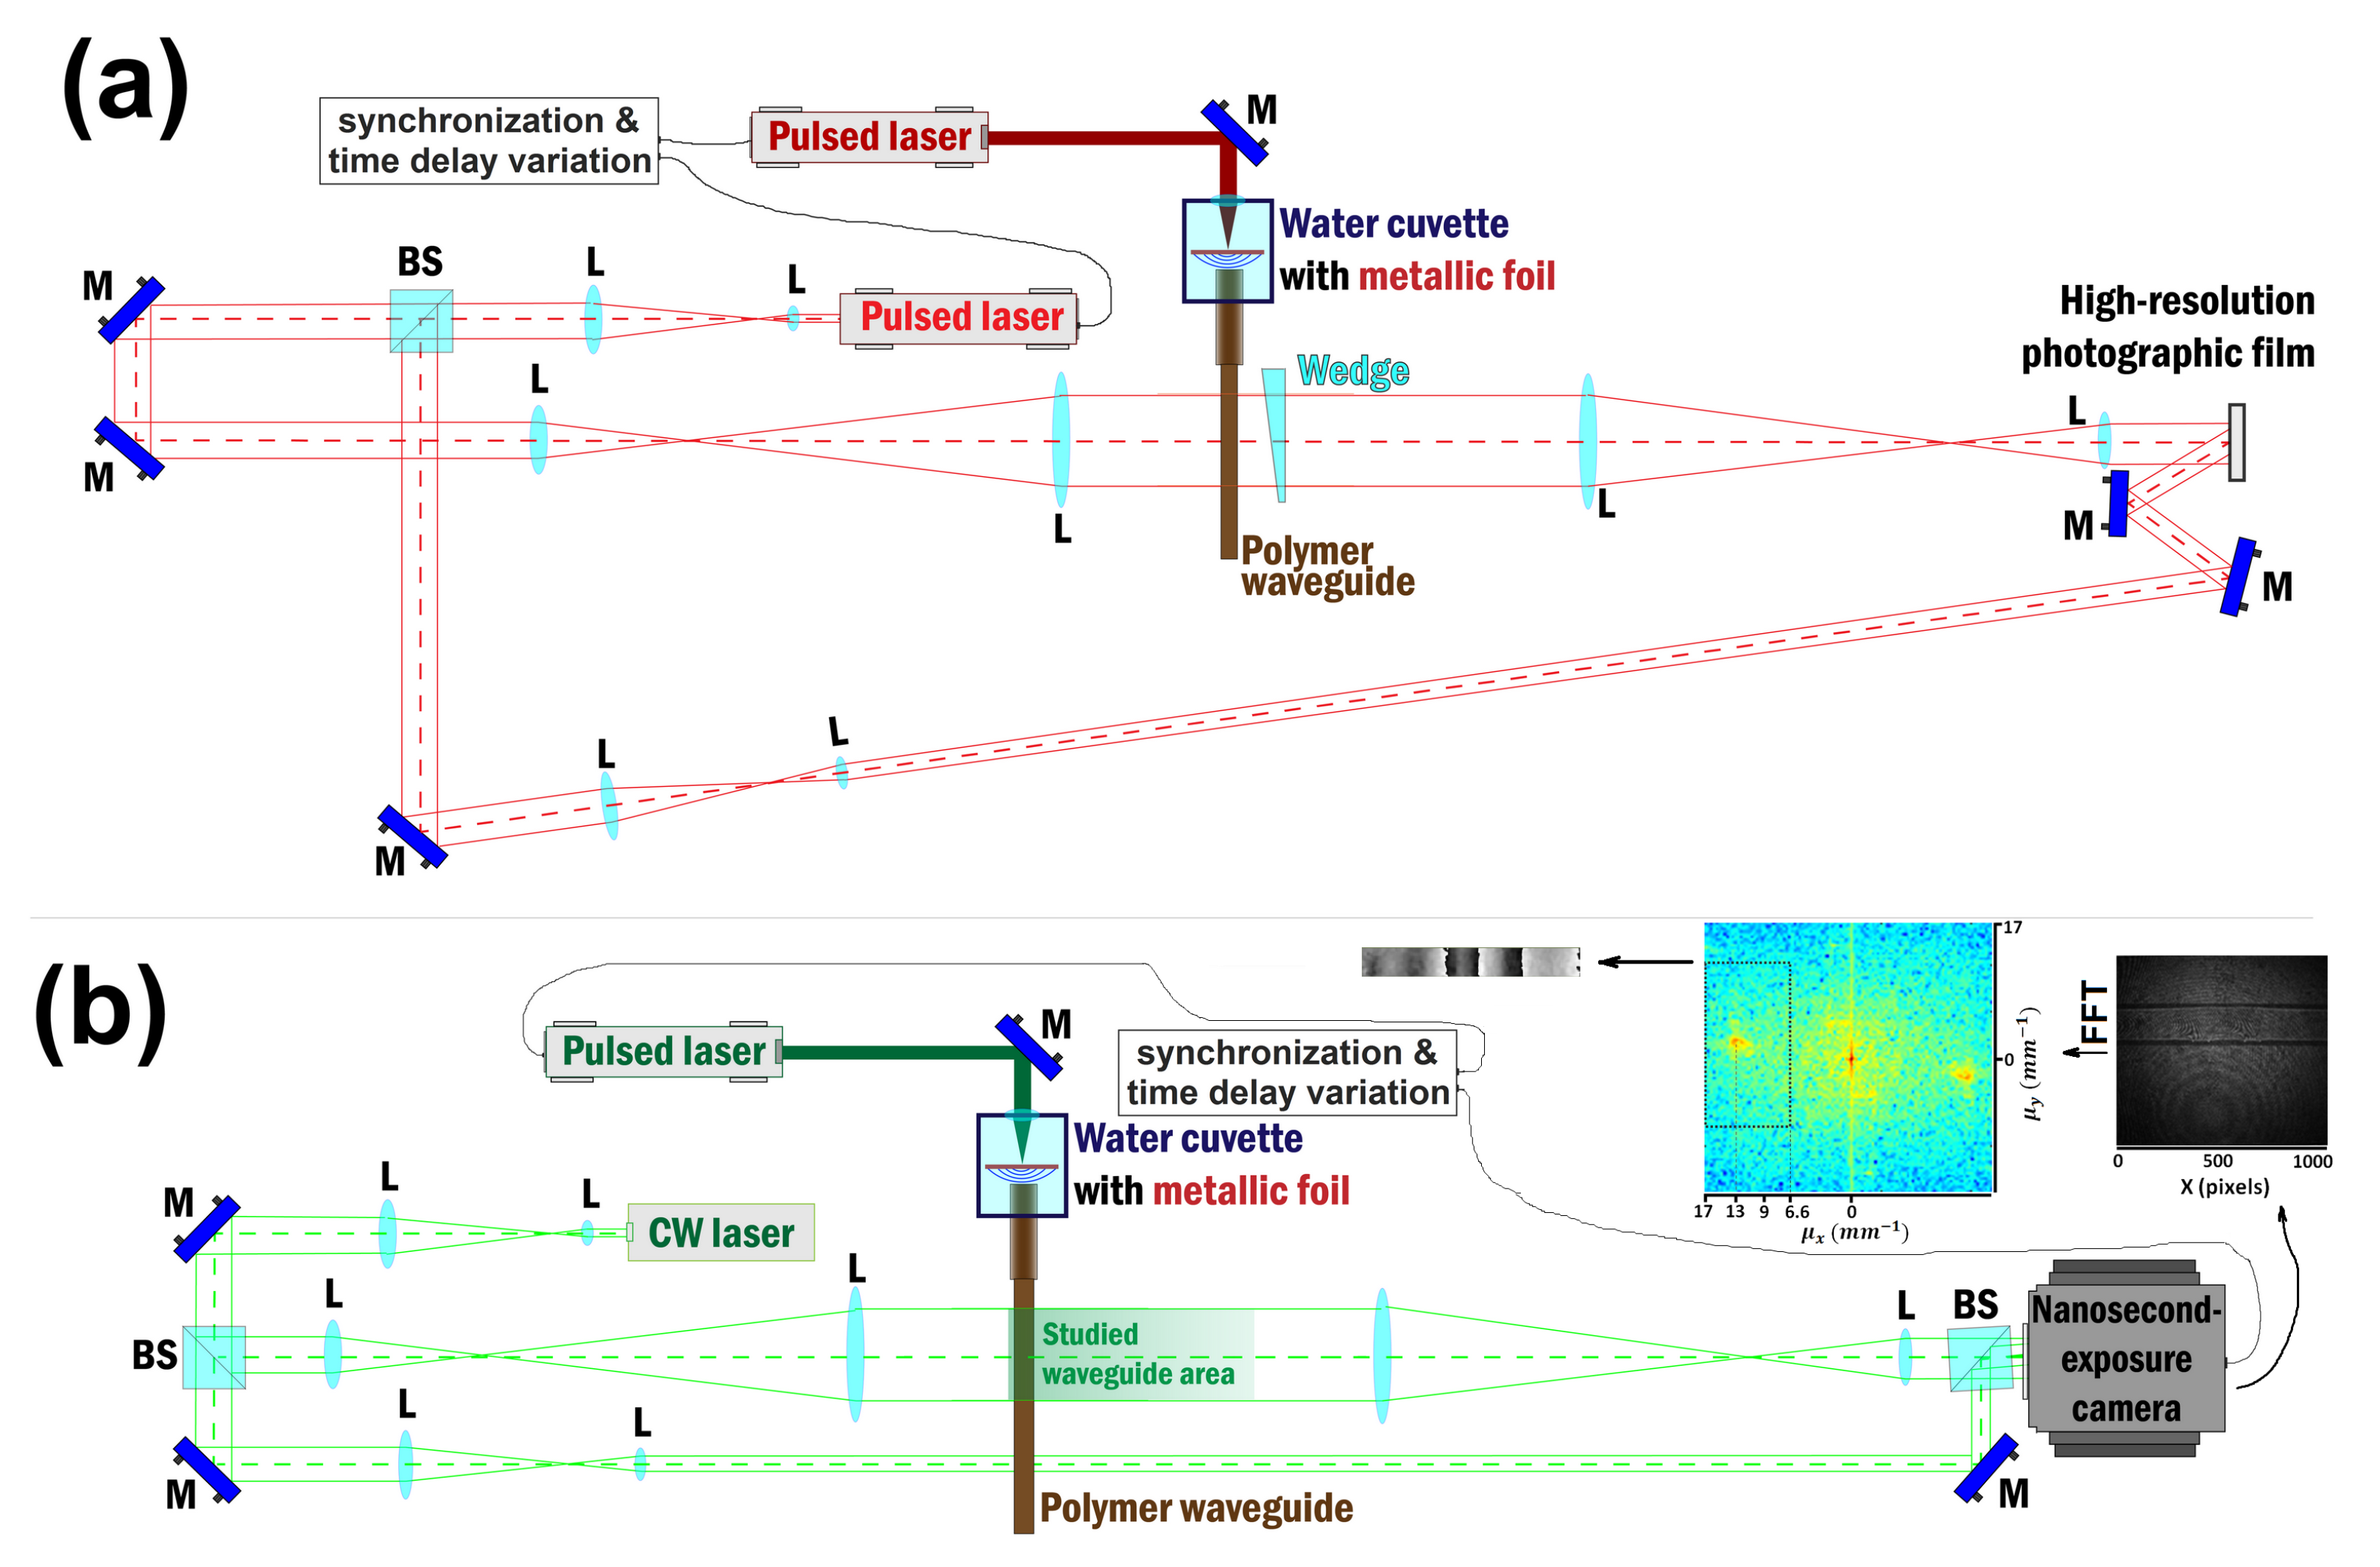
2.2.1. Classical Holographic Interferometry

In experiments performed by holographic interferometry, waves were generated and recorded using pulsed ruby lasers (pulse duration 20 ns, pulse energy up to 0.5 J, wavelength 694 nm). The optical schematic of the experimental setup is shown in Figure 1a. Synchronization of pump and probe laser pulses was provided by a delayed pulse generator, allowing variation of the delay time between laser pulses in a wide range.
The field of view was 30–50 mm in diameter. Two holograms were sequentially recorded on a single frame: one before excitation of the initial shock wave and second corresponding to a certain location of the strain wave in the waveguide. Subsequent illumination of these two holograms with a copy of the reference beam provided simultaneous reconstruction of copies of two object beams, their interference resulted in the formation of a holographic interferogram. Double-exposure holograms were recorded on high-resolution holographic film with maximal sensitivity in the red spectral range and interferograms were digitized at the reconstruction.
To record interferograms with the system of carrier fringes, a thin wedge was introduced into the object beam between exposures of the two holograms, causing a slight tilt of the object beam of the second hologram. During optical reconstruction of the double-exposure hologram the interference of the two object beams resulted in the formation of the system of equidistant carrier fringes on the interferogram. Variations in the optical path of the object beam produced by the propagating elastic wave caused fringe deformations within the wave area. The analysis of these deformations allowed for determining wave parameters. Note that in experiments with elastic waves in one-dimensional waveguides (rods and bars) due to a uniformity of strain distribution in the direction perpendicular to that of wave propagation, it is convenient to align carrier fringes in parallel with the waveguide axis. That makes further analysis most straightforward and illustrative and provides accurate data. The strain wave profile was determined in our experiments simply by digitizing the fringe shape, the soliton width equaled to the length of the disturbed area, and the amplitude was calculated using the equation [43]:
A = Δ K λ h ( n 1 ) ( 1 ν )
where Δ K is the maximal fringe shift, λ is the wavelength of the recording radiation, h is the waveguide thickness, n and ν are the refractive index and Poisson ratio of the waveguide material.
Note that in the case of extended disturbances with gently sloping fronts, such as strain solitons, the error in measuring the disturbance length becomes significant, especially if stitching of several consecutive frames is applied. A more accurate wavelength characteristic, in this case, is full width at half maximum (FWHM). To ensure the correct stitching of several frames, the carrier fringes on these frames must have exactly the same orientation. Since fringe orientation is defined by the position of the wedge introduced between the two exposures, special attention should be paid to keep the same wedge positions with sufficiently high accuracy. Note that, in contrast with digital holography, the orientation of the carrier interference fringes in holographic interferometry is defined solely by the initial and final wedge positions. Therefore, by precise wedge orientation, we have achieved repeatable position of carrier fringes, allowing for easy stitching of consecutive frames.
When studying more complex objects with non-uniform distribution of shape or refractive index along both axes, an interpretation of data obtained using holographic interferometry becomes more complicated and additional algorithms may be required to extract data from recorded interference patterns [44].

2.2.2. Digital Holography

In experiments with the digital recording of interference patterns, the initial shock wave was generated by a pulsed Nd:YAG laser Spitlight 600 (Innolas, Germany) with pulse energy up to 0.5 J at 532 nm and a pulse duration of 7 ns. For hologram recording, we used a CW laser module emitting at 532 nm and possessing high temporal coherence, which allowed for working with noticeably different pathlengths of the object and reference arms of the interferometer. To ensure sufficiently fast recording of interference patterns and to prevent blurring of interference fringes caused by fast propagation of elastic waves, a matrix photodetector with adjustable gain and exposure down to 20 ns, a Nanogate 24 (Nanoscan, Russia), with a resolution of 1392 × 1040 pixels, was utilized. An accounting of the wave velocity and magnification of the optical system yielded the exposure within the range of 70–120 ns in our experiments that provided the required quality of digital holograms. To register elastic waves in the course of propagation in the waveguide for a long distance, a shutter of the digital camera and the laser pulse causing explosive evaporation of the metallic foil were synchronized using an AM300 Dual Arbitrary Generator (Rohde & Schwarz), allowing for fine adjustment of the delay time.
Taking into account the pixel size of the utilized camera of about 30 μ m and horizontal angle between the object and reference waves of ≈0.35°, the typical thickness of the interference fringes comprised 3–5 pixels. Signal amplification and exposure time were adjusted to provide detection of relatively fast strain wave (typical speed of about 1800–2000 m/s) and recording of high-contrast interference fringes. Note that, due to the distortion introduced to the probe wave by the waveguide itself, thickness of interference fringes was different in different areas of a digital hologram. Reconstruction of digital holograms was performed by separation of the first diffraction order in the Fourier domain. In further data processing Goldstein unwrapping algorithm [16] was used for elimination of phase image singularities.
The optical layout of the experimental setup with digital recording is shown in Figure 1b. Several telescopic systems were used in the object arm of the Mach-Zehnder interferometer, providing a field of view in the object plane of about 60 mm in diameter. The telescopic system installed in the object beam after the object is used to image the enlarged field of view on the sample onto the camera matrix, so no wavefront propagation was needed to analyze the object in this schematic. However, being sufficient for reliable detection of already formed single solitons, such field of view was too small for the analysis of wave trains that were more than 100 mm long. In these experiments, a larger synthetic field of view was formed by stitching several profiles of elastic waves recorded at different delay times. To ensure robust stitching, recording of wave patterns was performed at slightly overlapped fields of view, namely at 0–60 mm, 50–110 mm and 100–160 mm from the waveguide input. An example of such numerical processing of several profiles of elastic waves is shown in Figure 2.
In contrast with classical holographic interferometry, utilizing analogous data processing, digital holography allows for automatic processing of several digital holograms, corresponding to different pump-probe delays. In particular, stitching of several phase images has been proposed and implemented in this study. Since the strain wave propagation velocity was not, a priori, known exactly, for accurate stitching of two phase images they were iteratively overlapped onto each other and the best shift values were estimated by the minimization of misalignment errors. In contrast with typical image-stitching problem [45,46], the holographic data processing is complicated by the reconstructed phase relativity. Therefore iterative relative shifting of the two processed images along with calculation of their difference, representing misalignment error E m i s a l i g n m e n t = i i m a g e | I 1 ( i ) I 2 ( i ) | , may not be implemented in this case. Instead of the analysis of two phase images themselves in the data processing workflow, one should use a gradient-based approach by considering E m i s a l i g n m e n t p h a s e = i i m a g e | I 1 ( i ) I 2 ( i ) | as a misalignment error. The latter criterion is insensitive to an additive constant applied to either of the phase images and therefore allows for correct stitching of phase images, although it is more sensitive to phase image deviations resulting from shot and coherent noise. Therefore, low-pass filtering should be applied prior to the stitching of phase images in order to decrease noise impact and to obtain correct coordinates needed for correct alignment of two phase images. Note that before numerical processing of phase images, the phase unwrapping algorithm should be applied. Due to the fact that gradient-based approach is applied for image stitching, it is crucial to perform a complete phase–image unwrapping and eliminate possible singularities on the phase image. After determination of the proper shifting parameter between the two images we directly overlapped the two 2D arrays onto each other and stitched them by adding a proper constant to the second image, aimed at the subtraction of the offset due to the relativity of the phase distribution.
The wave parameters were determined in the same way as described above for the analysis of holographic interferograms. The wave width corresponded to the length of the phase disturbance, and the wave amplitude was calculated using a formula similar to (1) with Δ K replaced by Δ ϕ / 2 π :
A = Δ ϕ λ 2 π h ( n 1 ) ( 1 ν )
where Δ ϕ is the maximal phase shift.
It should be noted that digital recording imposes certain restrictions on waveguide parameters, which should not introduce too strong distortions to the recording wavefront. Any deviations from sidewall flatness cause deformation of the interference fringes, which may not be resolved by the digital camera.
Note that, due to significant differences in realization of classical holographic interferometry and digital holography, it is quite difficult to implement these two methods at the same optical setup. This is due to different interference angles and magnification coefficients required for their implementation. Moreover, in the digital holography, we utilized CW laser radiation instead of the pulsed laser used in holographic interferometry.

3. Results and Analysis

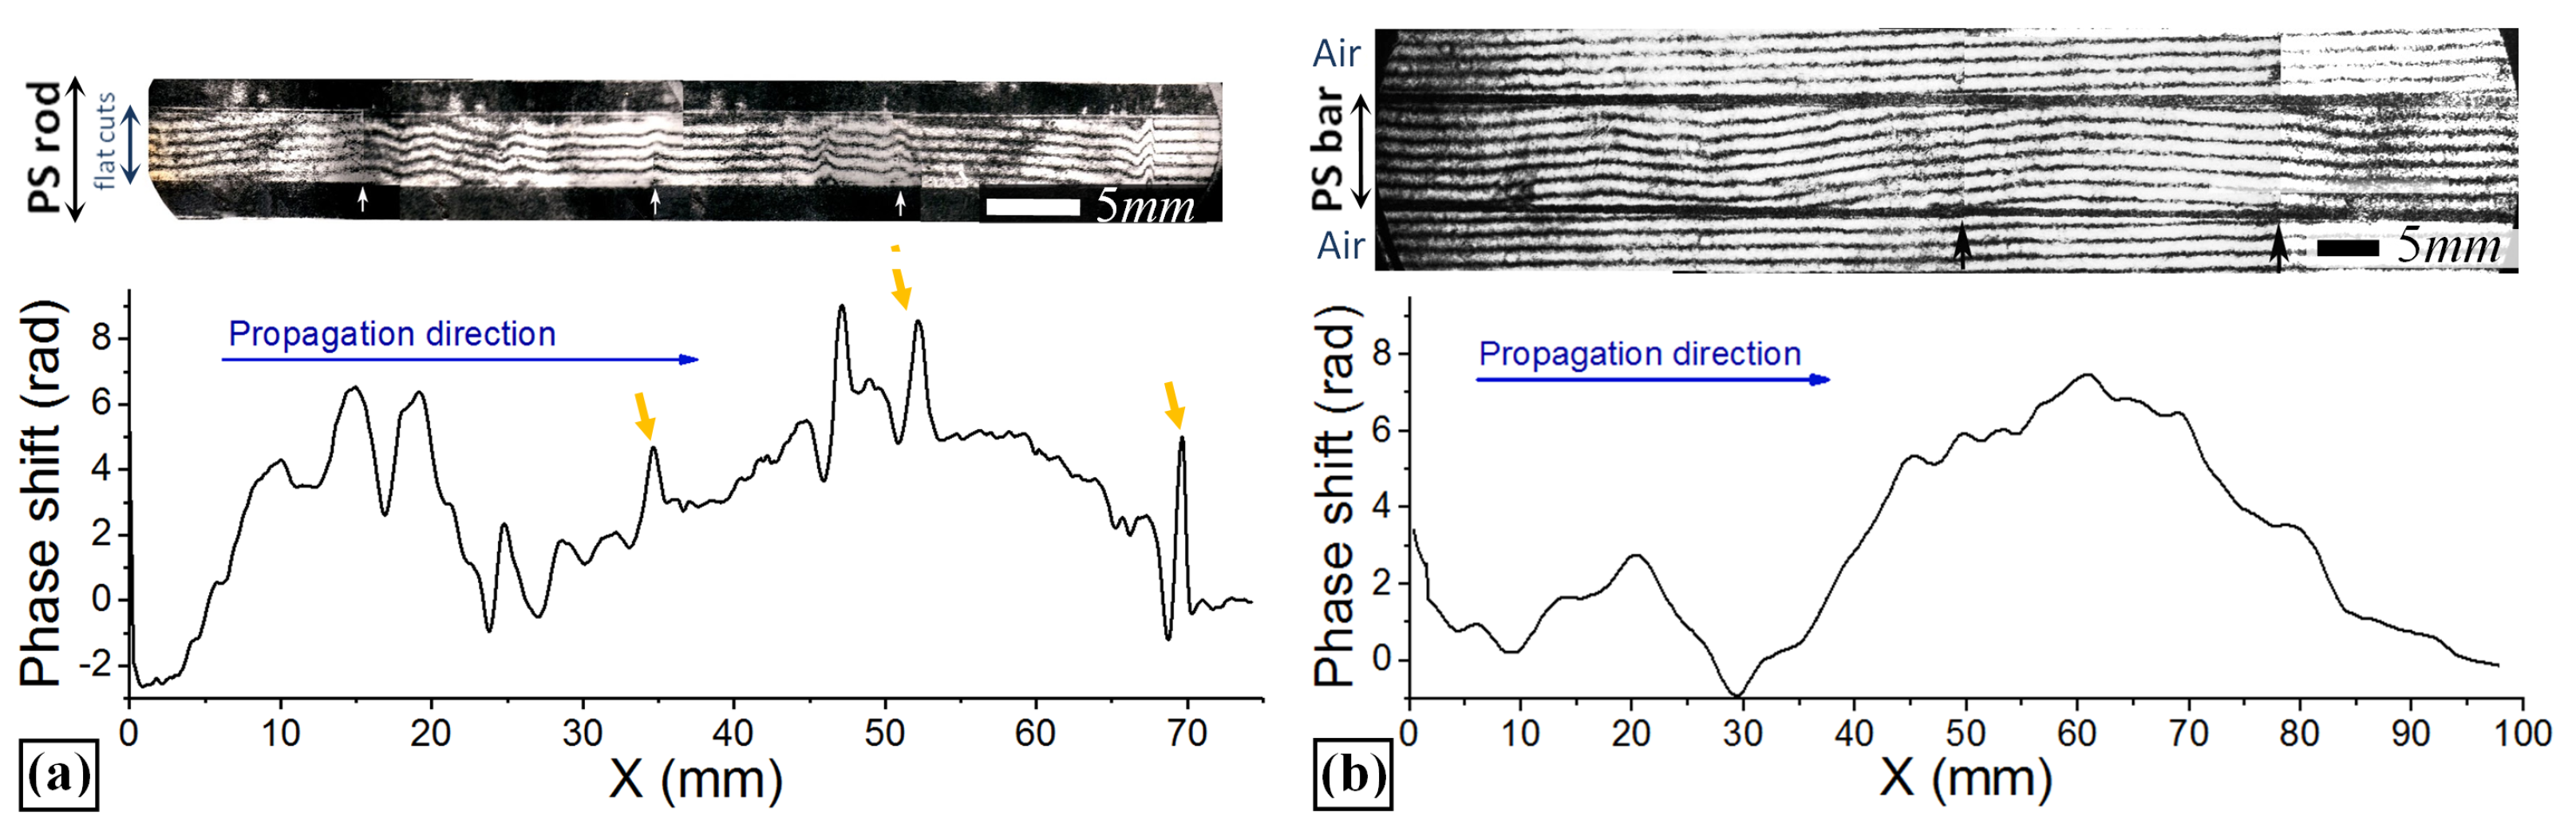
3.1. Recording by Holographic Interferometry

If wave patterns contain some distinctive local elements, the stitching of individual frames is quite simple and robust even at relatively small frames, as shown in Figure 3a. In the absence of such features as, for example in the case of already formed soliton (Figure 3b), the stitching procedure is more complicated and incorrect stitching can cause significant errors in estimated wave parameters. The parameters of the forming and formed soliton determined from the graphs in Figure 3, are summarized in Table 1.

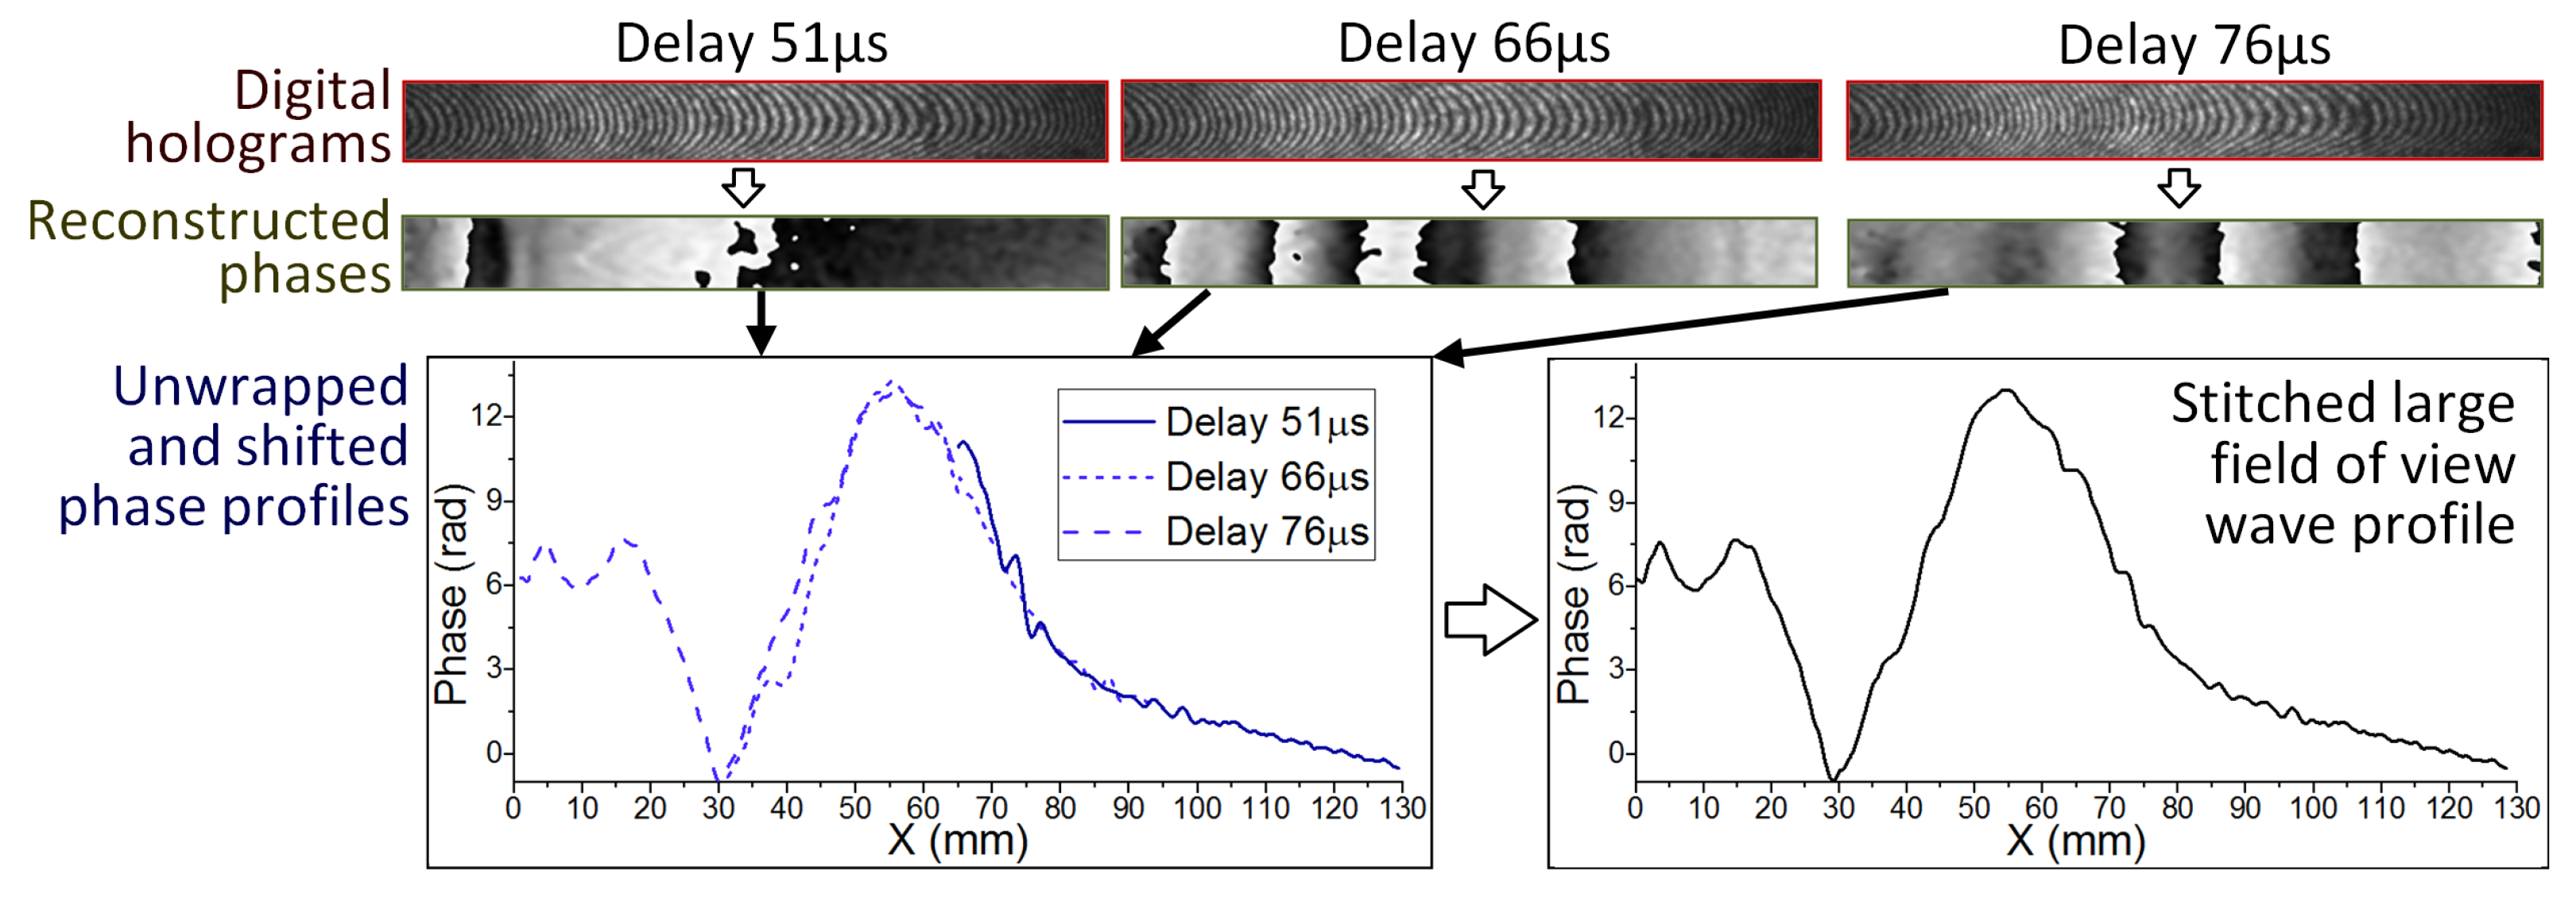
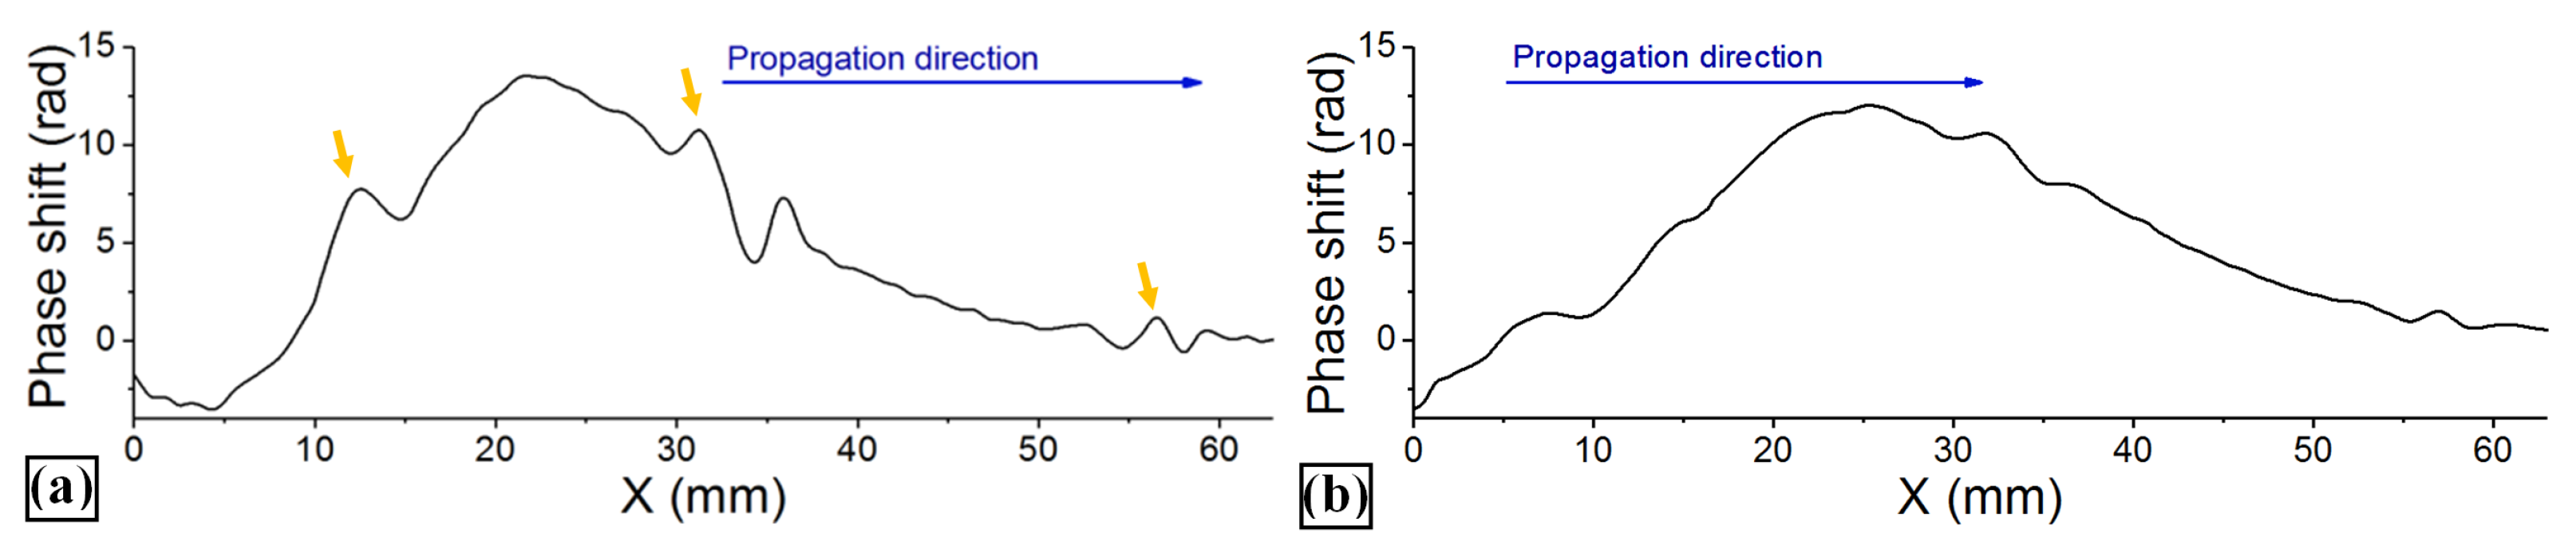
3.2. Recording by Digital Holography

Figure 4 presents profiles of elastic waves in the polystyrene bar within the areas of 50–110 mm and 100–160 mm, obtained by digital holography. As can be seen from Figure 4 while travelling along the waveguide, the wave pattern evolves, the wave amplitude decreases and its width increases. Besides this, short disturbances, clearly seen on the main long wave in Figure 4a, almost disappear in Figure 4b, which can be explained by the relatively fast damping of linear, high-frequency components with the attenuation coefficient α l i n = 0.25 cm 1 [47]. The two plots demonstrate the gradual formation of the nonlinear solitary wave in the waveguide. The attenuation coefficient for the solitary wave observed in these areas is an order of magnitude smaller than that for linear disturbances and is about α n o n l i n = 0.02 cm 1 [47]. The parameters of the forming and formed soliton determined from the graphs in Figure 4 are listed in Table 1.

3.3. Analysis of Short-Wavelength Perturbations at the Initial Stage of Strain Soliton Formation

At the initial stage of shock wave transformation into strain soliton, a number of chaotic short-wavelength oscillating perturbations of different amplitudes are observed behind the shock wave front. Figure 5 shows holographic interferogram of the wave pattern at the beginning of the waveguide (a) and digital holograms in the area of 10–60 mm from the waveguide input, recorded at different time moments (b). As can be seen from Figure 5a, holographic interferometry allows for visualization of the process, however, quantitative estimates of wave parameters are not possible. Digital holograms (Figure 5b) contain sharp fluctuations of interference fringes and singularities, which do not allow for correct reconstruction of the phase distributions (see Figure 5c).

4. Discussion

The data on shock wave evolution into the long elastic wave in the polystyrene waveguide obtained using classical holographic interferometry and digital holography demonstrate good agreement despite some slight discrepancy caused by different sources of pulsed laser radiation used to generate initial shock waves in these experimental realizations. Due to this difference the wave profiles obtained using holographic interferometry and digital holography, although being similar in shape, differ in amplitude. The images shown in Figure 3a and Figure 4a clearly show the presence of rapidly oscillating components indicated by yellow arrows. In the course of wave propagation in the waveguide, these linear short-wavelength components attenuate rapidly and are already scarcely visible in the images in Figure 3b and Figure 4b, corresponding to wave patterns travelled for 10 cm in the waveguide. Since the wave pattern shown in Figure 3a was recorded at slightly smaller distance from the waveguide input than that shown in Figure 4a, short-wave oscillations in the former case had higher amplitudes. Additional small differences in the wave profiles shown in Figure 3a and Figure 4a are due to the fact that the wave pattern in Figure 3a was recorded when this part of the waveguide was immersed in water, and additional disturbances propagating in surrounding water were superimposed on the resulting wave pattern in the waveguide (see [41] for details).
It is worth emphasizing major differences associated with obtaining and processing of experimental data in holographic interferometry and digital holography. The first and most obvious difference is the experimental procedure applied for the acquisition and analysis of the interference pattern. Classical holographic interferometry requires utilization of holographic recording materials; in most realizations, these are high-resolution photographic films or plates. The need for their chemical processing imposes restrictions on experiments in real time and does not allow for the prompt adjustment of experimental parameters in the course of experiment. On the contrary, digital holography easily allows for the automatization of the recording procedure and for synchronization of data processing workflow with specific steps of experiment, e.g. with waveguide displacement, change of the shock wave energy or of the delay between shock wave generation and hologram recording. Besides that, the recording of holograms of fast processes on photographic materials requires utilization of pulsed laser sources, while digital matrix photodetectors allow hologram recording using either pulsed [48,49] or CW probe lasers. The latter case, though, necessitates the usage of fast digital cameras with the amplification and electro-optical shutter, providing registration of 8–12-bit images with exposure times of the order of nano- to microseconds, depending upon the particular process under study [26,50].
Another fundamental difference when conducting experiments using digital holography and holographic interferometry is the ability of the latter technique to operate with highly distorted wavefronts. Digital holography requires rather fine adjustment of the optical system and imposes restrictions on the maximal angle formed by the object and reference waves that is limited by the size of the matrix pixel, as well as by the imperfections of the object shape. For instance, an imperfect flatness of the waveguide sidewalls causes curvature of the interference fringes, even in the absence of an elastic wave (see the curvature of initially vertical interference fringes in Figure 2). In this particular case, distortion of the transmitted wavefront was not critical and allowed us to reconstruct phase distributions nearly over the entire waveguide area within the field of view. Nevertheless, stronger distortions of the probe wavefront by the object can disallow reconstructing the phase distribution of the transmitted wavefront, even in the absence of disturbance. Note that such problem can arise also when monitoring shape changes of objects with rough, non-reflective surfaces [51,52,53] or in characterizing discontinuous deep surfaces [54]. The solution can be the utilization of additional optical methods, e.g., multiplexed or frequency-sweeping digital holography [54,55,56,57].
Conversely, holographic interferometry is based specifically on the visualization of object changes that significantly expand the capabilities of this technique in investigation of objects that introduce significant distortions to the probe wavefront. This also allows conclusions to be drawn on the characteristics of strong disturbances, such as, in our case, shock waves produced by explosive evaporation of the metallic foil (Figure 5a). Investigation of such objects using digital holography poses significant difficulties due to a large amount of sharp gradients and singularities of phase distribution (see Figure 5b,c).
The fast-gated digital camera with relatively large pixel size utilized in our experiments did not allow for the detection of rapidly oscillating strain wave components (see phase images in Figure 5c), although the position of first diffraction order was almost optimal for recording high-resolution phase images (see the image in Fourier domain in the inset of Figure 1b). The minimal size of a reliably resolvable high-frequency oscillating component was about 1.5 mm. Meanwhile. holographic interferometry utilizing a similar optical setup allows for the detection of smaller details of the strain wave (down to parts of mm) due to much higher resolution of the photographic films (being, however, still insufficient for resolving shock waves). Therefore, the technique of classical holographic interferometry is more suitable for the investigation of shorter disturbances when submillimeter resolution is required. We note, also, that efficient resolution of the optical system depends on the required magnification or reduction of the recorded area on the frame, with reduction causing a resolution decrease and, vice versa, magnification providing its increase. In the case of long disturbances, the image reduction is hardly avoidable. According to our experience, in general, the two major characteristics that should be considered for making a decision on the particular realization of the holographic approach that should be used for imaging are the spatial and temporal resolutions. If high spatial resolution is not required and the major object of interest introduces only smooth phase gradients, then digital holography is preferable due to an opportunity for automatic and relatively simple data processing. On the other hand, if the object requires much higher temporal resolution of the order of several nanoseconds or less then the pulsed laser approach should rather be used for holographic imaging. Besides that, digital holography should be implemented if the experimental workflow requires immediate availability of the results right after hologram recording.

5. Conclusions

In this paper we have demonstrated that two major holographic techniques, holographic interferometry and digital holography, in in-transmission configuration allow for the monitoring and analyzing of the evolution of long elastic waves of low amplitude in transparent solid waveguides. The parameters of nonlinear elastic strain waves in polystyrene waveguides, determined using these two methods, turned out to be quite close, despite some difference in the parameters of the laser pulses used for the generation of the initial shock wave. It was shown that holographic interferometry is more informative in studying the initial stages of the formation of strain solitons, since it allows visualizing wave patterns consisting of a number of short, high-amplitude components. The digital recording of such wave patterns causes the appearance of defects that do not allow for the correct reconstruction of phase distributions (see Figure 5). On the contrary, digital holography provides more accurate data on long elastic waves of small amplitude with smooth fronts.
As known, implementation of these two holographic techniques requires slightly different realizations of experimental setups (the need for pulsed laser sources of probe radiation in holographic interferometry and high-speed cameras in digital holography) and in the processing of experimental data. Although the rapid progress in the development of high-resolution, high-speed, digital cameras and the practical convenience of working with digital cameras has led to a wider adoption of this approach, there are still some areas of research where classical holographic interferometry remains the preferred technique. In particular, it allows for investigating scattering or diffusely reflecting objects.

Author Contributions

Conceptualization, I.V.S.; methodology, data curation and writing A.V.B. and I.V.S.; software, A.V.B.; investigation, A.V.B., A.A.Z. and I.V.S. All authors have read and agreed to the published version of the manuscript.

Funding

This research was funded by Russian Science Foundation (RSF) under the grant number 17-72-20201.

Institutional Review Board Statement

Not applicable.

Informed Consent Statement

Not applicable.

Data Availability Statement

Data is contained within the article.

Acknowledgments

We are grateful to Yaroslav M. Beltukov for valuable discussions.

Conflicts of Interest

The authors declare no conflict of interest.

References

  1. Röhler, R.; Sieger, C. Analysis of asymmetrical membrane vibrations by holographic interferometry. Opt. Commun. 1978, 25, 297–300. [Google Scholar] [CrossRef]
  2. Wilson, A.D. Inplane displacement of a stressed membrane with a hole measured by holographic interferometry. Appl. Opt. 1971, 10, 908–912. [Google Scholar] [CrossRef] [PubMed]
  3. Dreiden, G.V.; Ostrovsky, Y.I.; Reingand, N.O.; Romanova, T.P.; Semenova, I.V. Interference-holographic study of honeycomb diaphragm vibrations. Sov. Phys. Tech. Phys. 1992, 40, 21–33. [Google Scholar]
  4. Belland, P.; De Michelis, C.; Mattioli, M. Holographic interferometry of laser produced plasmas using picosecond pulses. Opt. Commun. 1971, 3, 7–8. [Google Scholar] [CrossRef]
  5. Ostrovskaya, G.V.; Frank, A.G. Time Evolution of the Plasma Spatial Structure During the Formation of a Current Sheet in Argon According to Holographic Interferometry. Plasma Phys. Rep. 2014, 40, 21–33. [Google Scholar] [CrossRef]
  6. Ivankov, A.S.; Kozhevnikova, A.M.; Schitz, D.V.; Alekseenko, I.V. Investigation of Nonthermal Plasma Jet Excitation Mode and Optical Assessment of Its Electron Concentration. Appl. Sci. 2021, 11, 9203. [Google Scholar] [CrossRef]
  7. Trolinger, J.D. Holographic interferometry as a diagnostic tool for reactive flows. Combust. Sci. Technol. 1976, 13, 229–244. [Google Scholar] [CrossRef]
  8. Takayama, K. Application of holographic interferometry to shock wave research. In Industrial Applications of Laser Technology; International Society for Optics and Photonics: Bellingham, WA, USA, 1983; Volume 398, pp. 174–179. [Google Scholar]
  9. Takayama, K. Visualization of Shock Wave Phenomena; Springer: Berlin/Heidelberg, Germany, 2019. [Google Scholar]
  10. Ostrovsky, Y.I.; Butusov, M.M.; Ostrovskaya, G.V. Interferometry by Holography; Springer: Berlin/Heidelberg, Germany, 1980. [Google Scholar]
  11. Sampson, R.C. Holographic-interferometry applications in experimental mechanics. Exp. Mech. 1970, 10, 313–320. [Google Scholar] [CrossRef]
  12. Gottenberg, W.G. Some applications of holographic interferometry. Exp. Mech. 1968, 8, 405–410. [Google Scholar] [CrossRef]
  13. Ostrovsky, Y.I.; Schepinov, V.P.; Yakovlev, V.V. Holographic Interferometry in Experimental Analysis; Springer: Berlin/Heidelberg, Germany, 1991. [Google Scholar]
  14. Parker, R.J. Industrial application of holographic interferometry. In Optical Methods in Engineering Metrology; Williams, D.C., Ed.; Springer: Dordrecht, The Netherlands, 1993; pp. 213–274. [Google Scholar]
  15. Lee, Y.; Ito, Y.; Tahara, T.; Inoue, J.; Xia, P.; Awatsuji, Y.; Nishio, K.; Ura, S.; Matoba, O. Single-shot dual-wavelength phase unwrapping in parallel phase-shifting digital holography. Opt. Lett. 2014, 39, 2374–2377. [Google Scholar] [CrossRef]
  16. Goldstein, R.M.; Zebker, H.A.; Werner, C.L. Satellite radar interferometry: Two-dimensional phase unwrapping. Radio Sci. 1988, 23, 713–720. [Google Scholar] [CrossRef] [Green Version]
  17. Wang, K.; Li, Y.; Kemao, Q.; Di, J.; Zhao, J. One-step robust deep learning phase unwrapping. Opt. Express 2019, 27, 15100–15115. [Google Scholar] [CrossRef] [PubMed]
  18. Uzan, A.; Rivenson, Y.; Stern, A. Speckle denoising in digital holography by nonlocal means filtering. Appl. Opt. 2013, 52, A195–A200. [Google Scholar] [CrossRef] [PubMed]
  19. Yan, K.; Chang, L.; Andrianakis, M.; Tornari, V.; Yu, Y. Deep learning-based wrapped phase denoising method for application in digital holographic speckle pattern interferometry. Appl. Sci. 2020, 10, 4044. [Google Scholar] [CrossRef]
  20. Shevkunov, I.; Katkovnik, V.; Claus, D.; Pedrini, G.; Petrov, N.V.; Egiazarian, K. Hyperspectral phase imaging based on denoising in complex-valued eigensubspace. Opt. Lasers Eng. 2020, 127, 105973. [Google Scholar] [CrossRef]
  21. Katkovnik, V.; Shevkunov, I.A.; Petrov, N.V.; Egiazarian, K. Sparse approximations of phase and amplitude for wave field reconstruction from noisy data. In Holography: Advances and Modern Trends IV. International Society for Optics and Photonics; International Society for Optics and Photonics: Bellingham, WA, USA, 2015; Volume 9508, p. 950802. [Google Scholar]
  22. Yi, F.; Moon, I.; Javidi, B.; Boss, D.; Marquet, P.P. Automated segmentation of multiple red blood cells with digital holographic microscopy. J. Biomed. Opt. 2013, 18, 026006. [Google Scholar] [CrossRef]
  23. Belashov, A.V.; Zhikhoreva, A.A.; Belyaeva, T.N.; Kornilova, E.S.; Salova, A.V.; Semenova, I.V.; Vasyutinskii, O.S. In vitro monitoring of photoinduced necrosis in HeLa cells using digital holographic microscopy and machine learning. JOSA A 2020, 37, 346–352. [Google Scholar] [CrossRef]
  24. Kuś, A.; Krauze, W.; Makowski, P.L.; Kujawińska, M. Holographic tomography: Hardware and software solutions for 3D quantitative biomedical imaging. ETRI J. 2019, 41, 61–72. [Google Scholar] [CrossRef] [Green Version]
  25. Belashov, A.V.; Petrov, N.V.; Semenova, I.V. Accuracy of image-plane holographic tomography with filtered backprojection: Random and systematic errors. Appl. Opt. 2016, 55, 81–88. [Google Scholar] [CrossRef]
  26. Belashov, A.V.; Beltukov, Y.M.; Petrov, N.V.; Samsonov, A.M.; Semenova, I.V. Indirect assessment of bulk strain soliton velocity in opaque solids. Appl. Phys. Lett. 2018, 112, 121903. [Google Scholar] [CrossRef]
  27. El-Schich, Z.; Mölder, A.L.; Gjörloff Wingren, A. Quantitative Phase Imaging for Label-Free Analysis of Cancer Cells — Focus on Digital Holographic Microscopy. Appl. Sci. 2018, 8, 1027. [Google Scholar] [CrossRef] [Green Version]
  28. Do R.B.F. Lima, M.A.; Cojoc, D. Monitoring Human Neutrophil Differentiation by Digital Holographic Microscopy. Front. Phys. 2021, 9, 190. [Google Scholar]
  29. Lu, C.W.; Belashov, A.V.; Zhikhoreva, A.A.; Semenova, I.V.; Cheng, C.J.; Su, L.Y.; Wu, C.H. Application of digital holographic tomography in antitumor effect of cantharides complex on 4T1 breast cancer cells. Appl. Opt. 2021, 60, 3365–3373. [Google Scholar] [CrossRef] [PubMed]
  30. Palacios-Ortega, N.; del Socorro Hernández-Montes, M.; Mendoza-Santoyo, F.; Flores-Moreno, J.M. Measurement of morphology thickness and refractive index in a melanoma A375 cell line using digital holographic microscopy. Appl. Opt. 2021, 60, 815–822. [Google Scholar] [CrossRef]
  31. Zhikhoreva, A.A.; Belashov, A.V.; Danilova, A.B.; Avdonkina, N.A.; Baldueva, I.A.; Gelfond, M.L.; Nekhaeva, T.L.; Semenova, I.V.; Vasyutinskii, O.S. Significant difference in response of malignant tumor cells of individual patients to photodynamic treatment as revealed by digital holographic microscopy. J. Photochem. Photobiol. B Biol. 2021, 221, 112235. [Google Scholar] [CrossRef]
  32. Ambrosini, D.; Paoletti, D.; Tanda, G. Investigation of natural convection in vertical channels by Schlieren and Optical Holography. J. Flow Vis. Image Process. 2004, 11. [Google Scholar] [CrossRef]
  33. Herman, C. Quantitative visualization of heat transfer in oscillatory and pulsatile flows. In Heat Transfer: Theoretical Analysis, Experimental Investigations and Industrial Systems; IntechOpen: London, UK, 2011; pp. 353–378. [Google Scholar]
  34. Pavlov, A.V.; Protasov, Y.; Telekh, V.D.; Shchepanuk, T.S. Laser holographic interferometry of short ultraviolet radiation with high power density interaction with condensed matters. Sci. Vis. 2019, 11, 111–125. [Google Scholar]
  35. Desse, J.M.; Olchewsky, F. Digital Holographic Interferometry for Analysing High-Density Gradients in Fluid Mechanics. In Holographic Materials and Optical Systems; IntechOpen: London, UK, 2017. [Google Scholar]
  36. Manickam, S.; Dhir, V. Holographic interferometric study of heat transfer associated with a single vapor bubble sliding along a downward-facing heater surface. In Proceedings of the ASME 2003 Heat Transfer Summer Conference, Las Vegas, NV, USA, 21–23 July 2003; Volume 36940, pp. 317–327. [Google Scholar]
  37. Groth, E.; Clarke, T.; da Silva, G.; Iturrioz, I.; Lacidogna, G. The Elastic Wave Propagation in Rectangular Waveguide Structure: Determination of Dispersion Curves and Their Application in Nondestructive Techniques. Appl. Sci. 2020, 10, 4401. [Google Scholar] [CrossRef]
  38. Garbuzov, F.E.; Samsonov, A.M.; Semenov, A.A.; Shvartz, A.G. Determination of Third-Order Elastic Moduli via Parameters of Bulk Strain Solitons. Tech. Phys. Lett. 2016, 42, 121–123. [Google Scholar] [CrossRef]
  39. Belashov, A.V.; Beltukov, Y.M.; Moskalyuk, O.A.; Semenova, I.V. Relative variations of nonlinear elastic moduli in polystyrene-based nanocomposites. Polym. Test. 2021, 95, 107132. [Google Scholar] [CrossRef]
  40. Garbuzov, F.; Semenova, I.; Belashov, A.; Beltukov, Y. Formation of solitary strain waves in viscoelastic waveguides. In Proceedings of the International Conference “Days on Diffraction 2021”, St. Petersburg, Russia, 31 May–4 June 2021; pp. 58–62. [Google Scholar]
  41. Dreiden, G.V.; Samsonov, A.M.; Semenova, I.V. Evolution of bulk strain solitons in long polymeric waveguides. Tech. Phys. 2008, 53, 540–546. [Google Scholar] [CrossRef]
  42. Dreiden, G.V.; Samsonov, A.M.; Semenova, I.V. Bulk elastic strain solitons in polycarbonate. Tech. Phys. Lett. 2011, 37, 500–502. [Google Scholar] [CrossRef]
  43. Dreiden, G.V.; Khusnutdinova, K.R.; Samsonov, A.M.; Semenova, I.V. Longitudinal Strain Solitary Wave in a Two-Layered Polymeric Bar. Strain 2010, 46, 589–598. [Google Scholar] [CrossRef]
  44. Belashov, A.V.; Petrov, N.V.; Semenova, I.V. Processing classical holographic interferograms by algorithms of digital hologram reconstruction. Tech. Phys. Lett. 2015, 41, 713–716. [Google Scholar] [CrossRef]
  45. Ma, B.; Zimmermann, T.; Rohde, M.; Winkelbach, S.; He, F.; Lindenmaier, W.; Dittmar, K.E. Use of autostitch for automatic stitching of microscope images. Micron 2007, 38, 492–499. [Google Scholar] [CrossRef] [PubMed]
  46. Szeliski, R. Image alignment and stitching. In Handbook of Mathematical Models in Computer Vision; Springer: Berlin/Heidelberg, Germany, 2006; pp. 273–292. [Google Scholar]
  47. Samsonov, A.M.; Semenova, I.V.; Belashov, A.V. Direct determination of bulk strain soliton parameters in solid polymeric waveguides. Wave Motion 2017, 71, 120–126. [Google Scholar] [CrossRef]
  48. Zhu, L.; Zhou, C.; Wu, T.; Jia, W.; Fan, Z.; Ma, Y.; Niu, G. Femtosecond off-axis digital holography for monitoring dynamic surface deformation. Appl. Opt. 2010, 49, 2510–2518. [Google Scholar] [CrossRef]
  49. Balciunas, T.; Melninkaitis, A.; Tamosauskas, G.; Sirutkaitis, V. Time-resolved off-axis digital holography for characterization of ultrafast phenomena in water. Opt. Lett. 2008, 33, 58–60. [Google Scholar] [CrossRef]
  50. Lycksam, H.; Sjödahl, M.; Gren, P.; Öhman, M.; Gebart, R. High-speed interferometric measurement and visualization of the conversion of a black liquor droplet during laser heating. Opt. Lasers Eng. 2012, 50, 1654–1661. [Google Scholar] [CrossRef]
  51. Yamaguchi, I.; Ida, T.; Yokota, M.; Yamashita, K. Surface shape measurement by phase-shifting digital holography with a wavelength shift. Appl. Opt. 2006, 45, 7610–7616. [Google Scholar] [CrossRef]
  52. Kreis, T. Application of digital holography for nondestructive testing and metrology: A review. IEEE Trans. Ind. Inform. 2015, 12, 240–247. [Google Scholar] [CrossRef]
  53. Belashov, A.V.; Petrov, N.V. Improvement of rough surfaces height map reconstruction accuracy in tilt angle illumination digital holography. Opt. Eng. 2020, 59, 102414. [Google Scholar] [CrossRef]
  54. Kozacki, T.; Mikula-Zdankowska, M.; Martinez-Carranza, J.; Idicula, M.S. Single-shot digital multiplexed holography for the measurement of deep shapes. Opt. Express 2021, 29, 21965–21977. [Google Scholar] [CrossRef] [PubMed]
  55. Ding, J.; Jiang, C.; Jia, S. Digital holographic metrology based on multi-angle interferometry. Opt. Lett. 2016, 41, 4301–4304. [Google Scholar] [CrossRef] [PubMed]
  56. Ledl, V.; Psota, P.; Kavan, F.; Matousek, O.; Mokry, P. Surface topography measurement by frequency sweeping digital holography. Appl. Opt. 2017, 56, 7808–7814. [Google Scholar] [CrossRef] [PubMed]
  57. Psota, P.; Tang, H.; Pooladvand, K.; Furlong, C.; Rosowsky, J.J.; Cheng, J.T.; Ledl, V. Multiple angle digital holography for the shape measurement of the unpainted tympanic membrane. Opt. Express 2020, 28, 24614–24628. [Google Scholar] [CrossRef]
Figure 1. Schematics of experimental setups used for the recording of wave patterns by (a) holographic interferometry and (b) digital holography. L are lenses, M are mirrors, BS are beamsplitters. A diagram illustrating the digital hologram data processing workflow is shown in the inset in (b) (the image in the Fourier domain is shown in the logarithmic scale).
Applsci 12 01687 g001
Figure 2. Reconstruction of elastic wave profile by stitching three digital holograms obtained at different delays between the moments of shock wave generation and hologram recording. Waves travel from left to right.
Applsci 12 01687 g002
Figure 3. (a) Stitching of four consecutive holographic interferograms demonstrating formation of strain soliton from the shock wave in the polystyrene rod at the distance of 40–70 mm from the rod input. The frame size is 30 mm, the size of the field of view obtained by stitching is 70 mm. (b) Stitching of three consecutive holographic interferograms showing soliton with oscillating tail in the polystyrene bar at the distance of 100–150 mm from the bar input. The frame size is 50 mm, the size of the field of view obtained by stitching is 100 mm. Stitching lines are indicated on the interferograms with white (a) and black (b) arrows. Fast-decaying short-wavelength oscillations in the graph (a) are indicated by yellow arrows.
Applsci 12 01687 g003
Figure 4. Reconstructed profiles of strain waves in the polystyrene bar in the areas of 50–110 mm (a) and 100–160 mm (b) from the bar input. Yellow arrows in the graph (a) indicate fast-decaying short-wavelength oscillations.
Applsci 12 01687 g004
Figure 5. Initial stage of shock wave evolution after entering the polystyrene bar. (a) holographic interferogram; (b) set of digital holograms recorded during the first 15 μ s after shock wave generation; (c) phase distributions reconstructed from holograms (b). Note high amounts of rapidly oscillating components resulting in interference fringe breaks in (a,b) and phase wraps and singularities in (c).
Applsci 12 01687 g005
Table 1. Parameters of nonlinear elastic strain waves in different areas of the polystyrene waveguide, determined from graphs in Figure 3 and Figure 4. The error bars were obtained from the analysis of several recorded profiles of strain waves and statistical analysis of these data.
Holographic InterferometryDigital Holography
Waveguide Area (mm)40–70100–15050–110100–160
amplitude (10 4 )2.4 ± 0.22.1 ± 0.32.9 ± 0.052.6 ± 0.05
width (mm)45 ± 359 ± 746 ± 255 ± 2
FWHM (mm)24 ± 233 ± 520 ± 227 ± 2
Publisher’s Note: MDPI stays neutral with regard to jurisdictional claims in published maps and institutional affiliations.

