
Evaluation of the Effect of Passive Cooling Techniques on Thermal Comfort Using Test Cells in the Northern Region of Brazil


Abstract
:1. Introduction
2. Materials and Methods
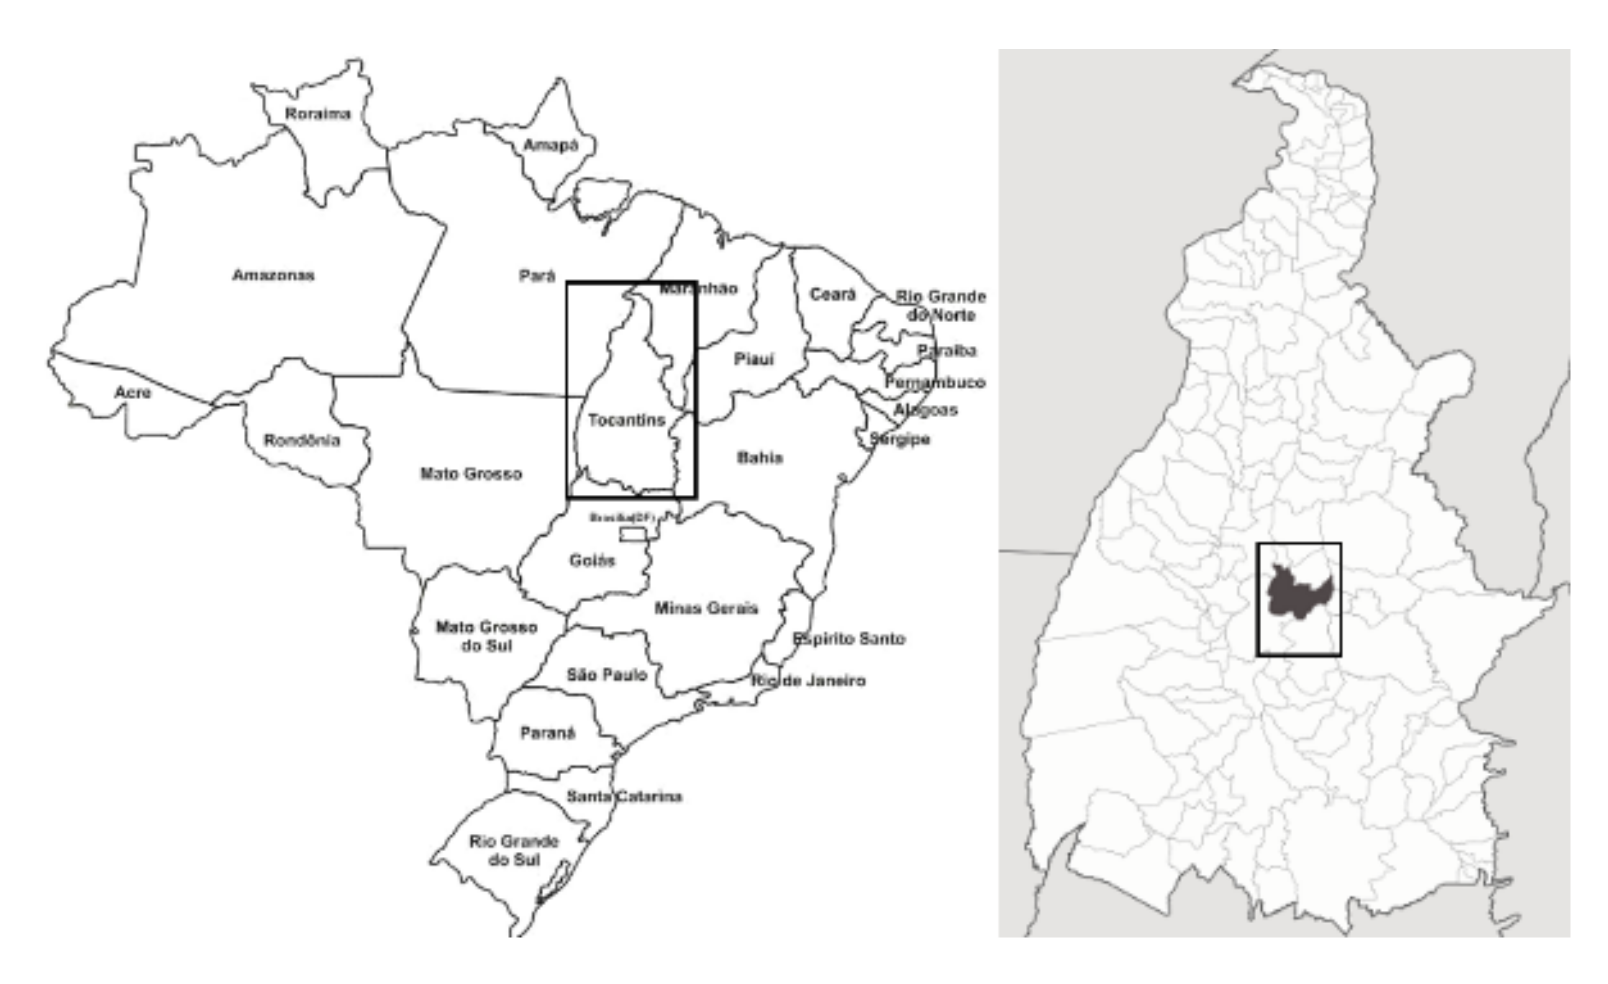
2.1. Framework
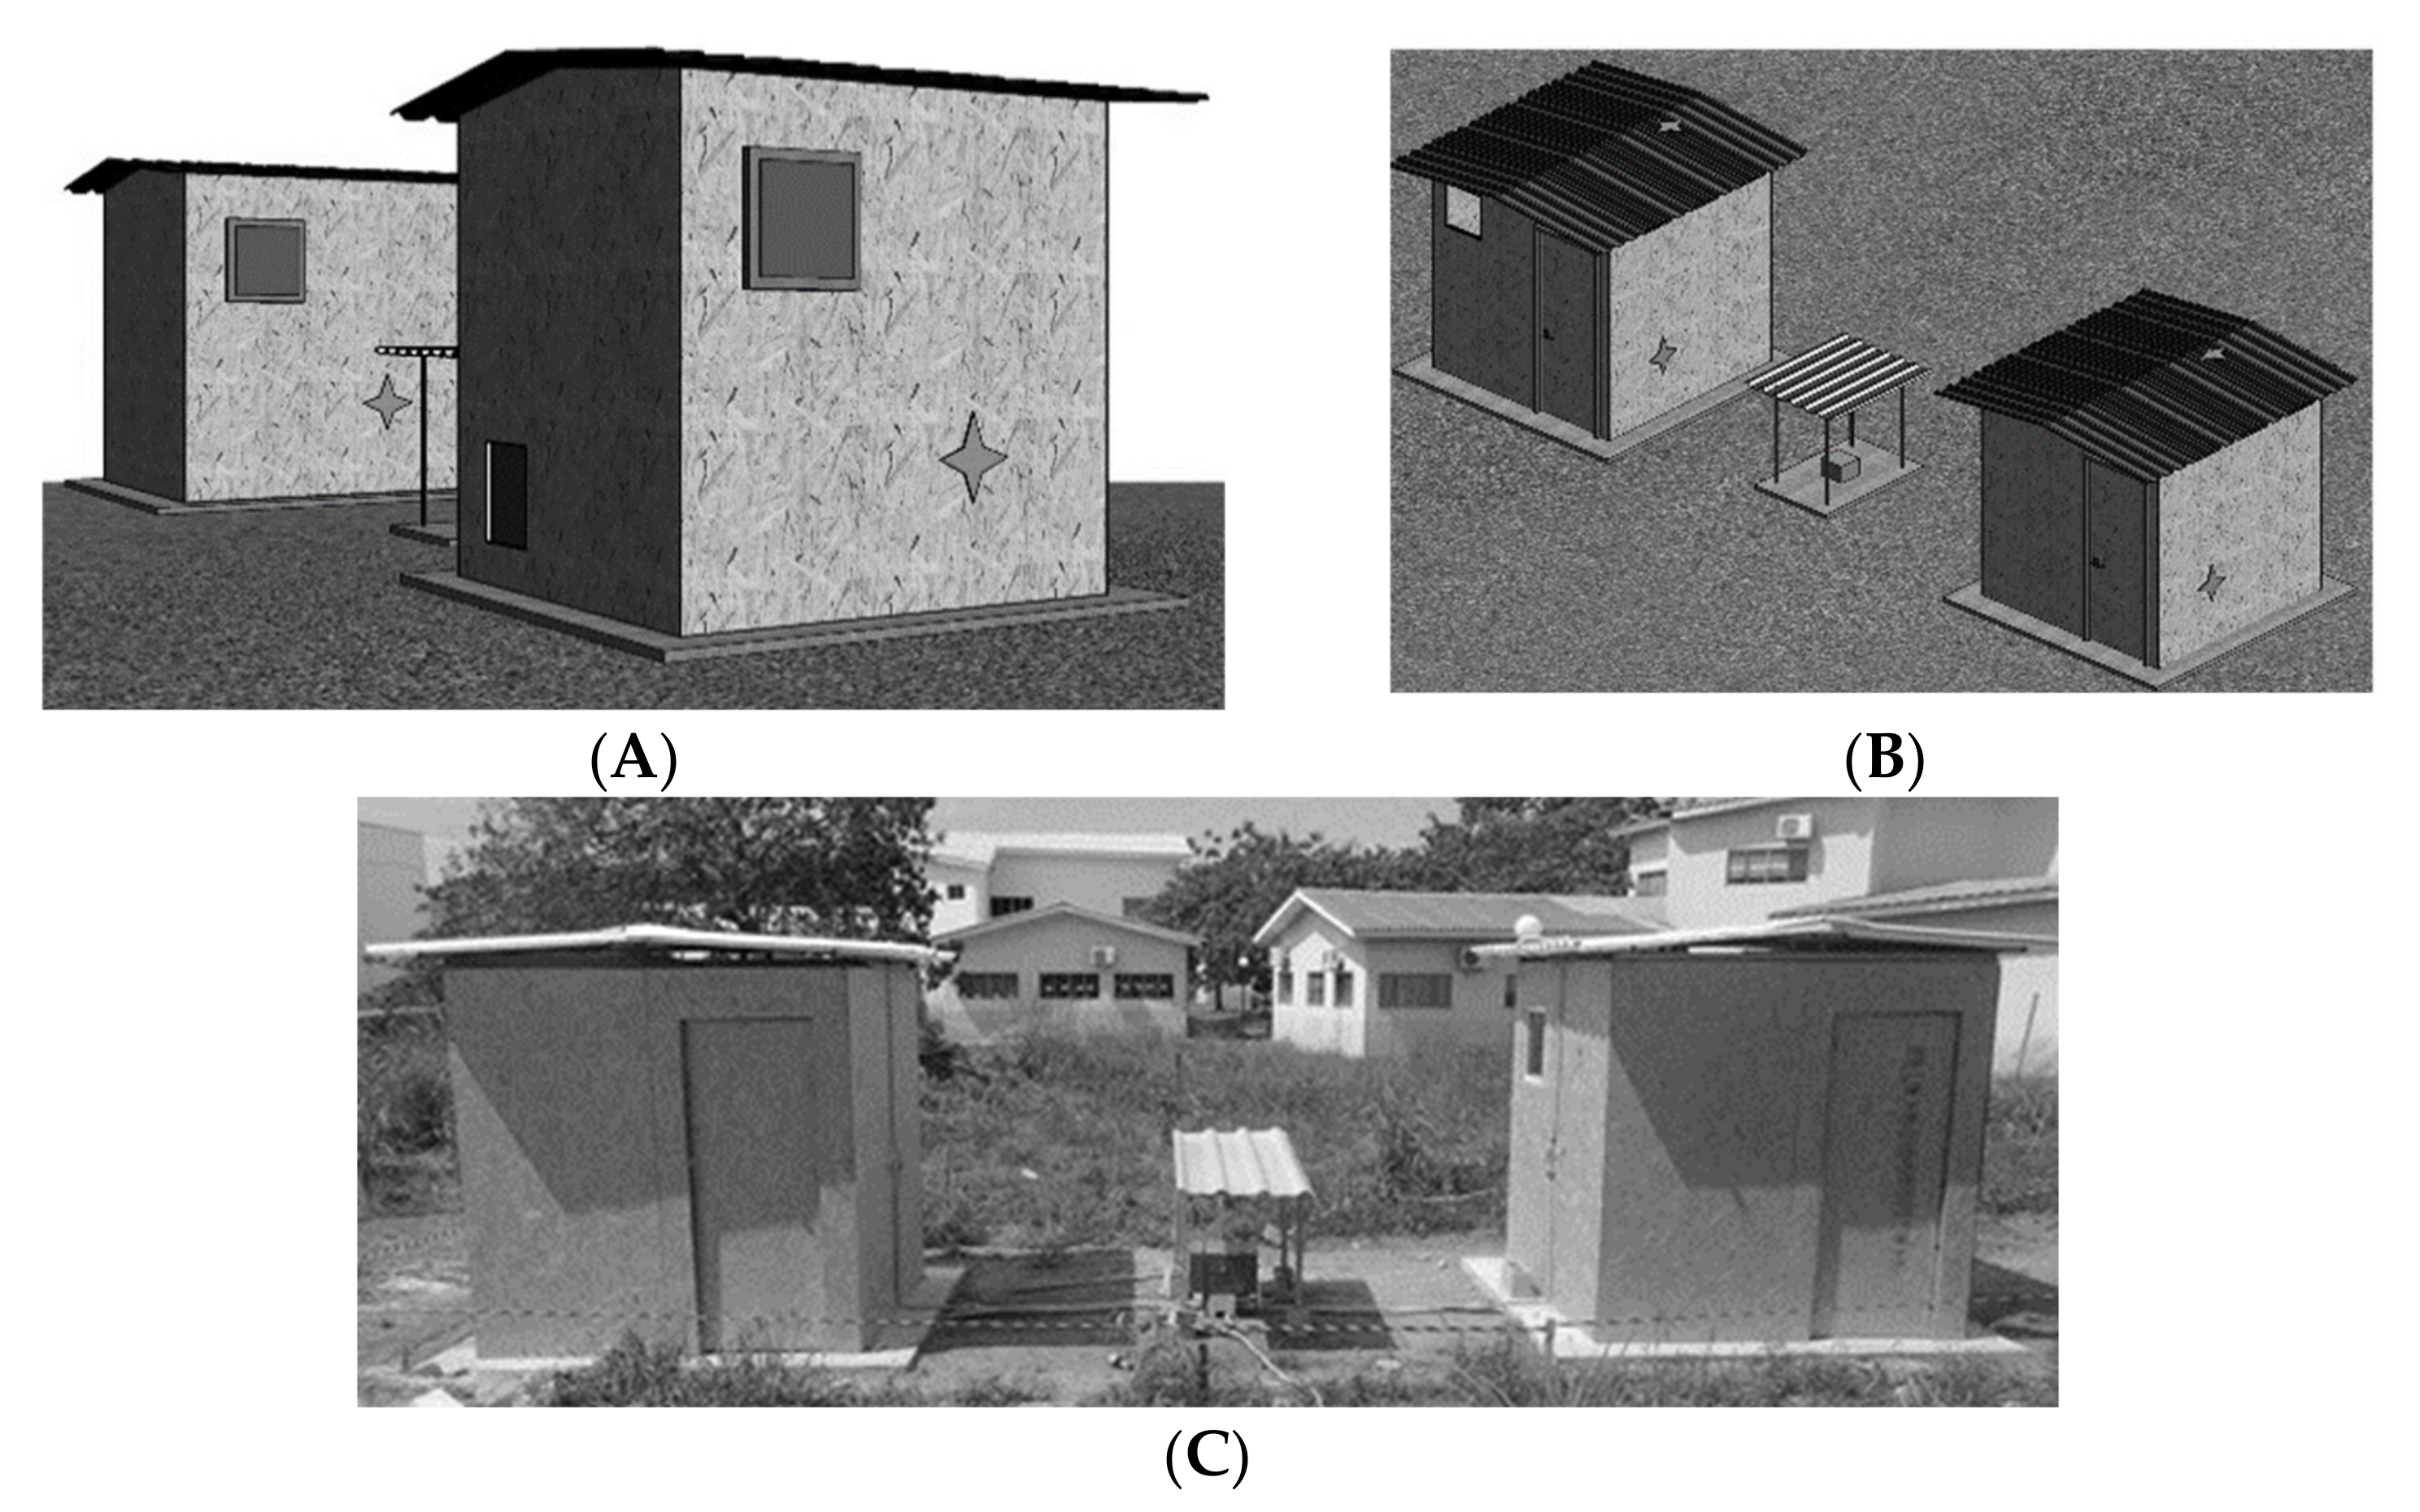
2.2. Test Cells
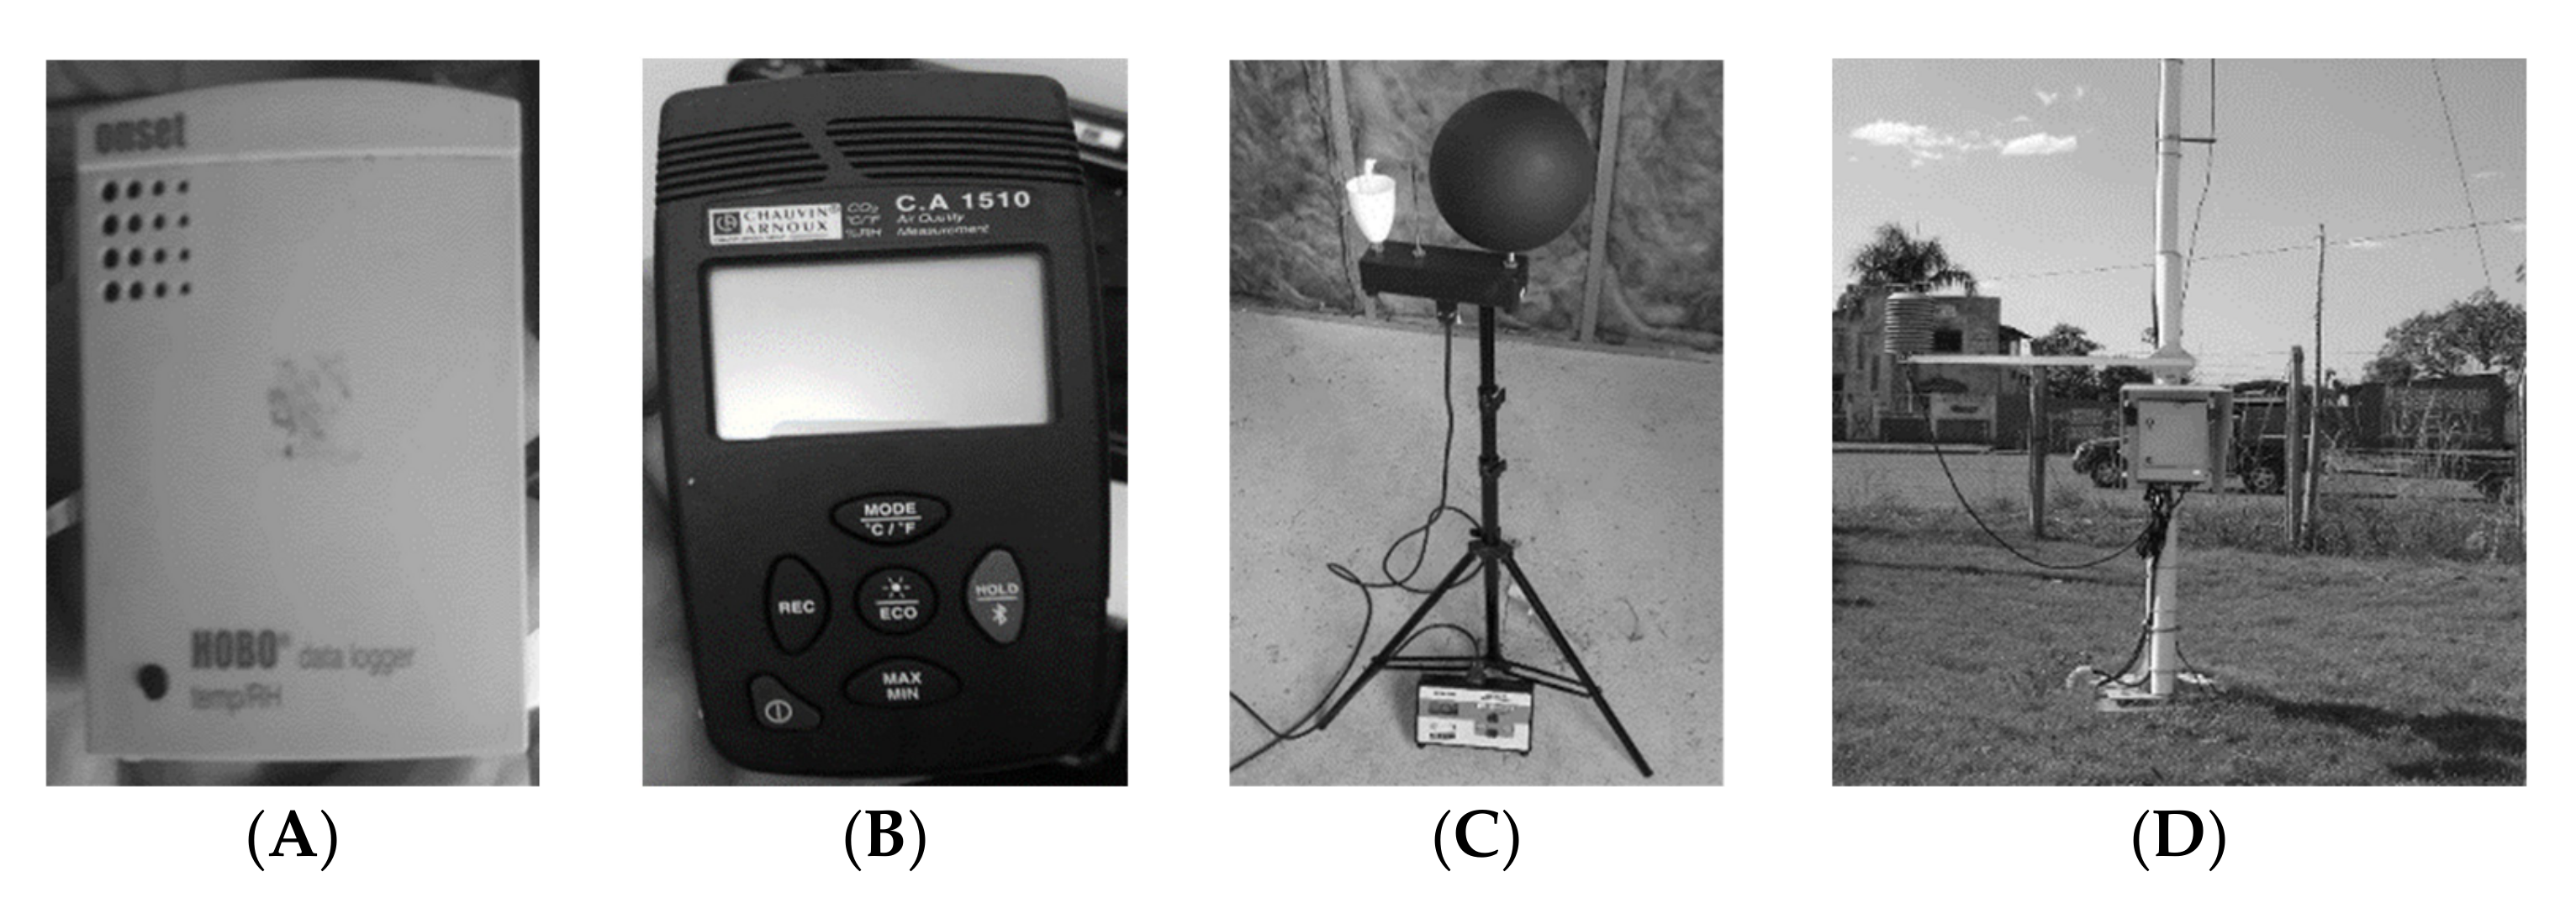
2.3. Equipment Used
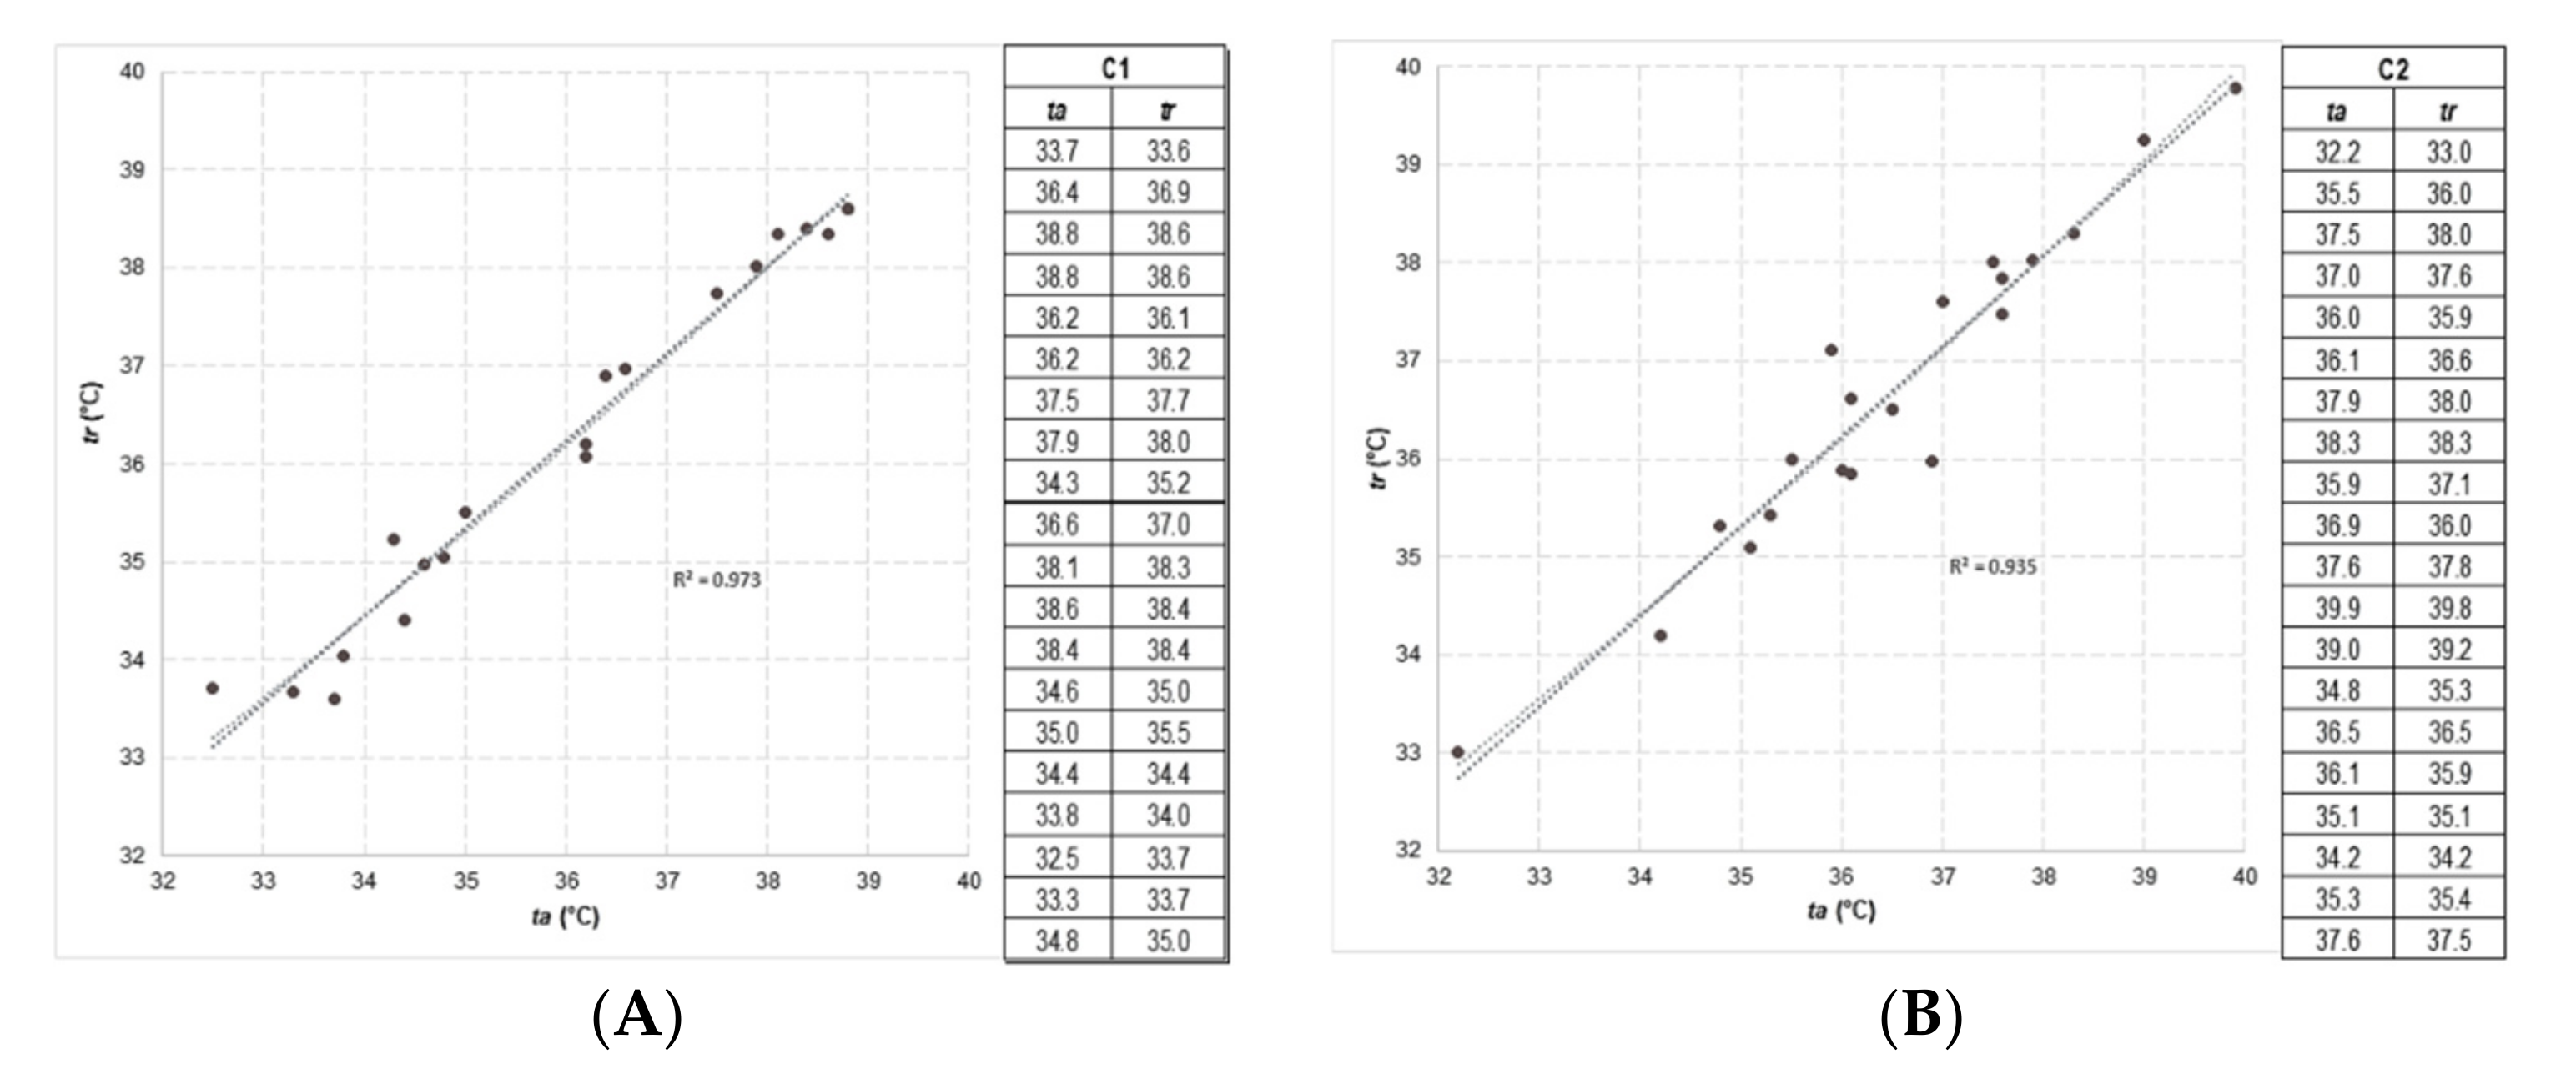
- tr is the mean radiant temperature [K];
- tg is the globe temperature [K];
- ta is the air temperature [K];
- hcg is the convective heat transfer coefficient at the globe level [W/m2.K];
- εg is the emissivity of the black globe;
- Σ is the Stefan–Boltzan constant [5.67 × 10⁻⁸ W/m2.K4];
- D is the globe diameter (0.15 m).
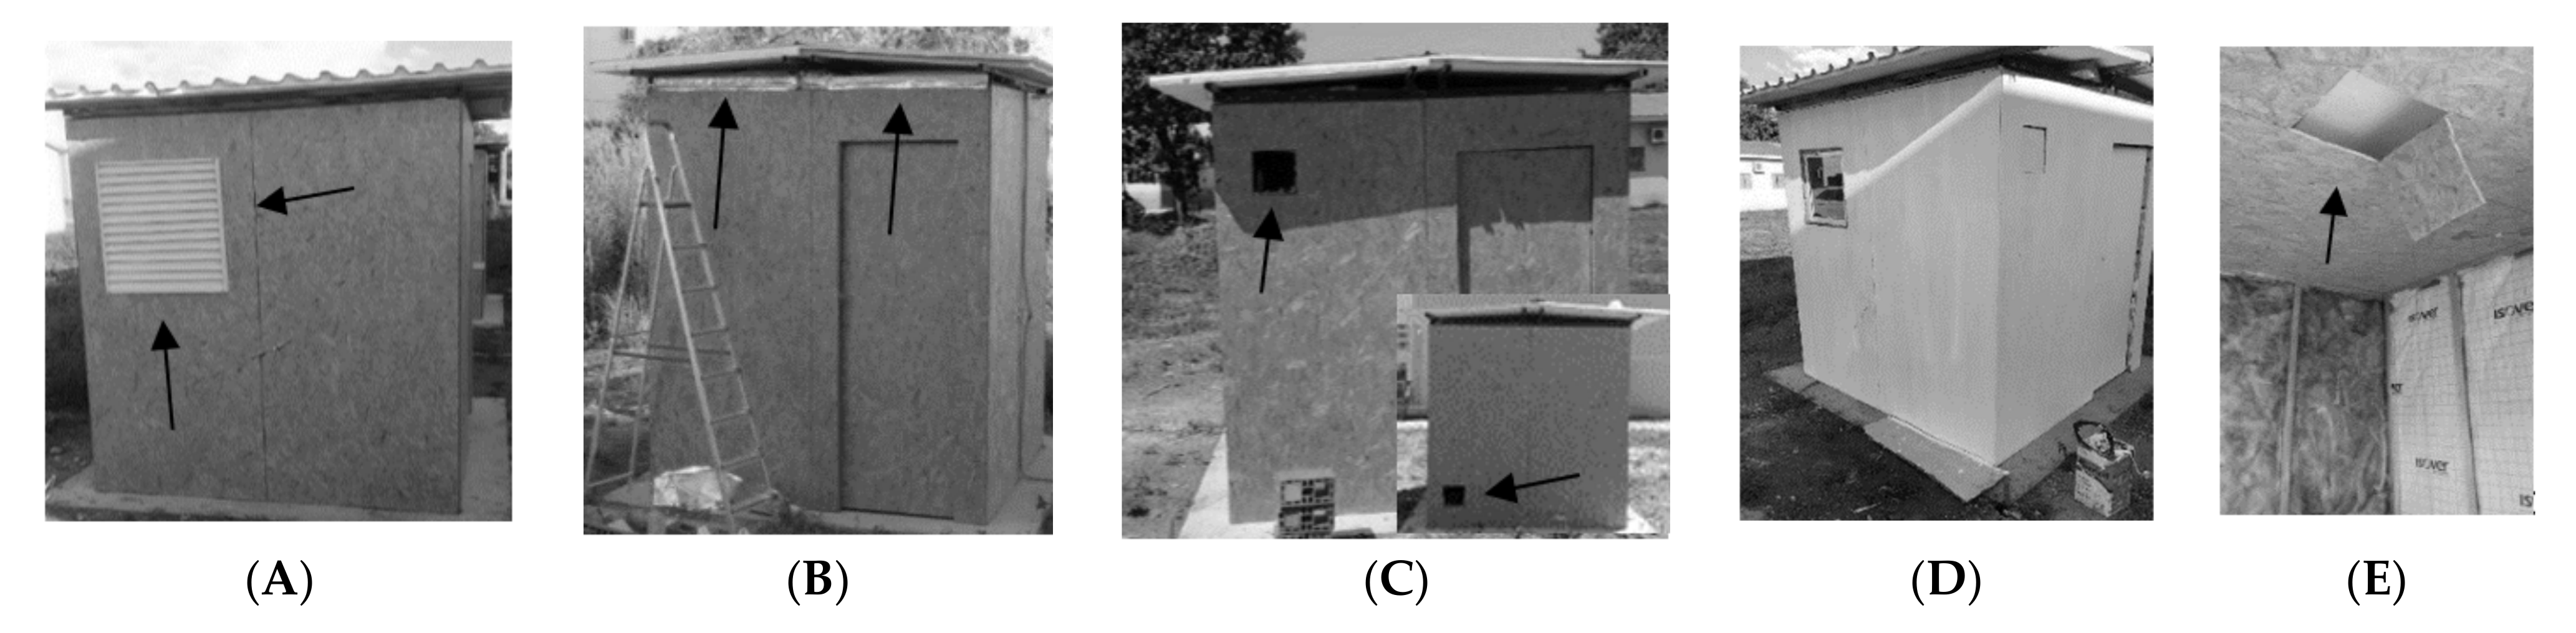
2.4. Implemented Passive Cooling Techniques
3. Preliminary Results
4. Results
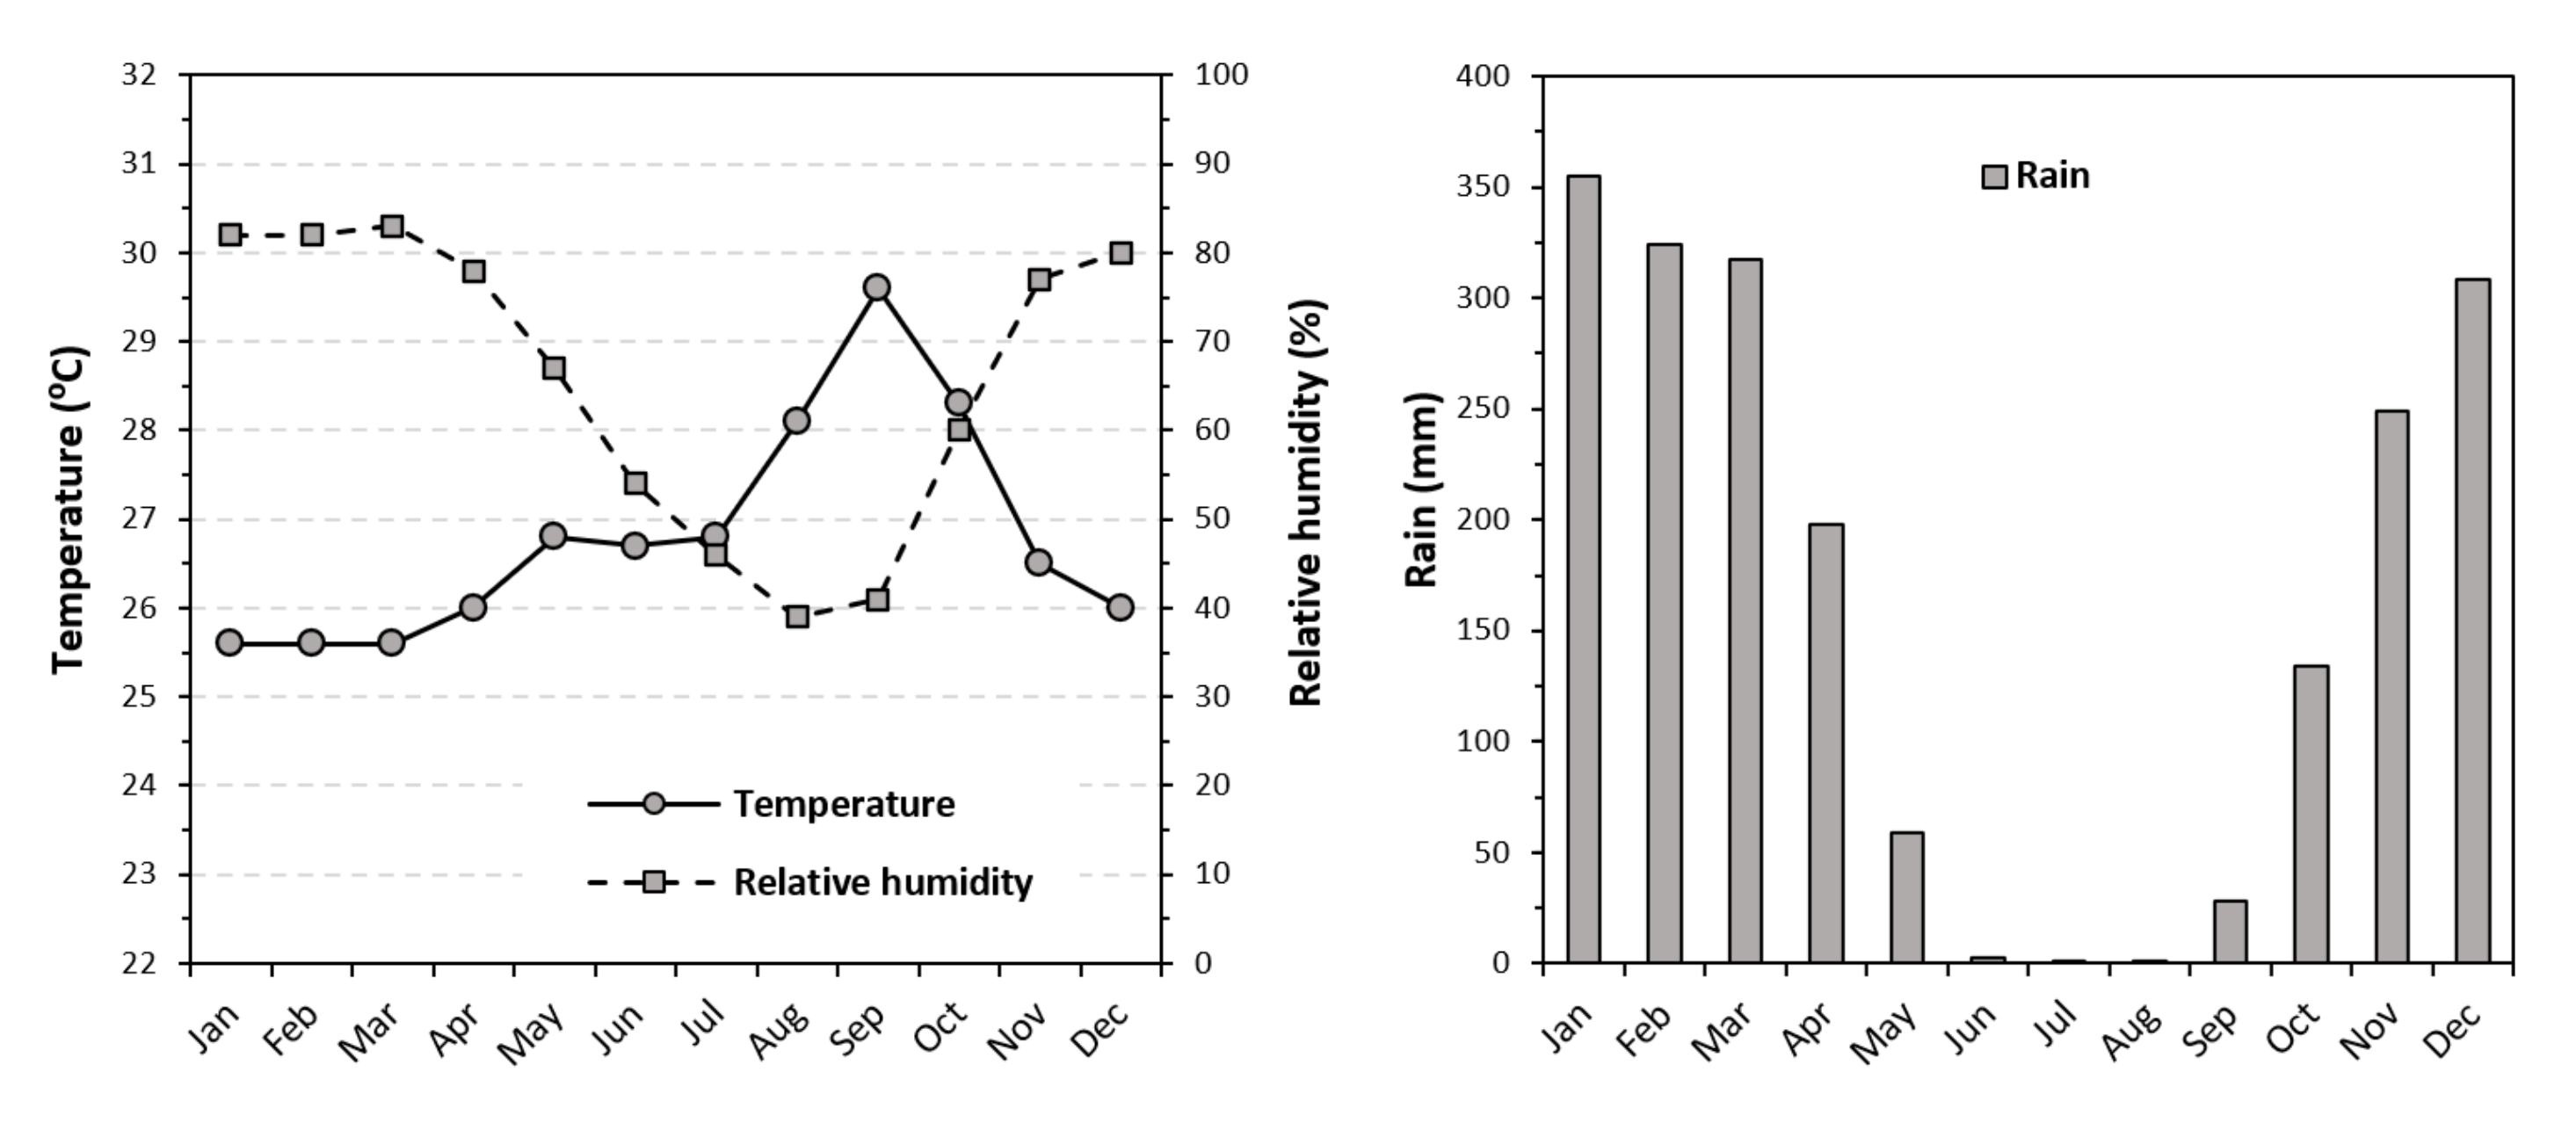
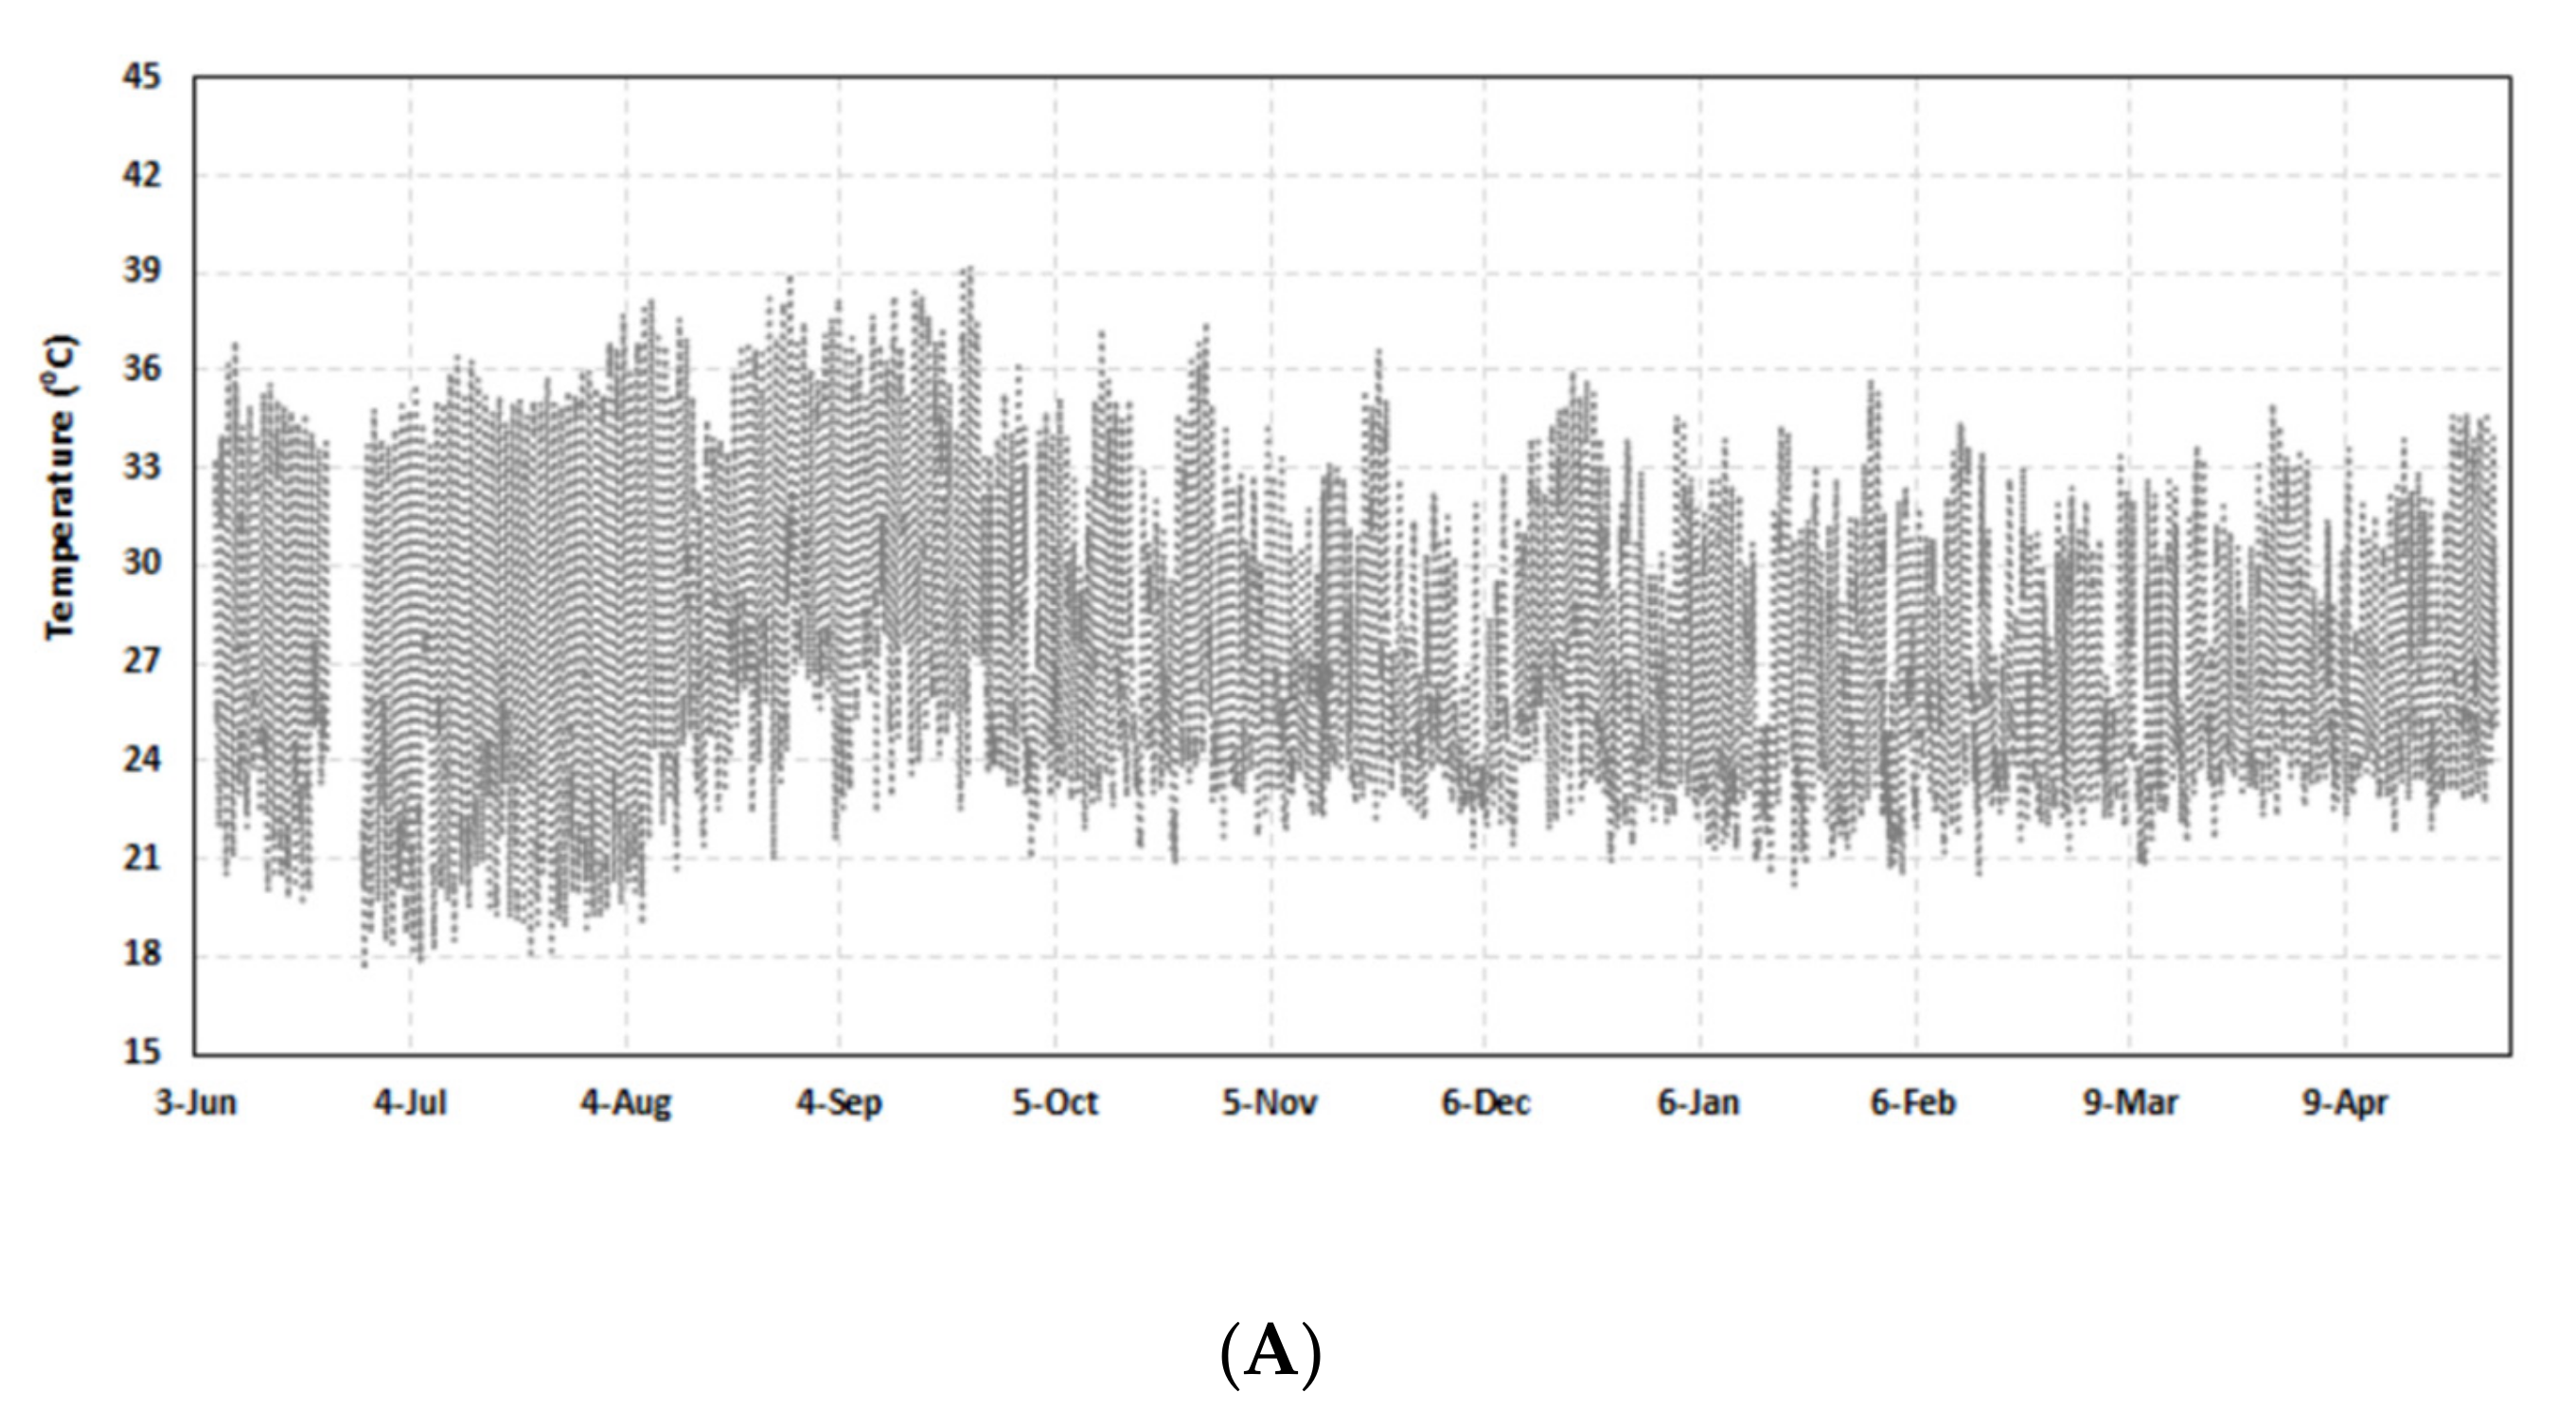
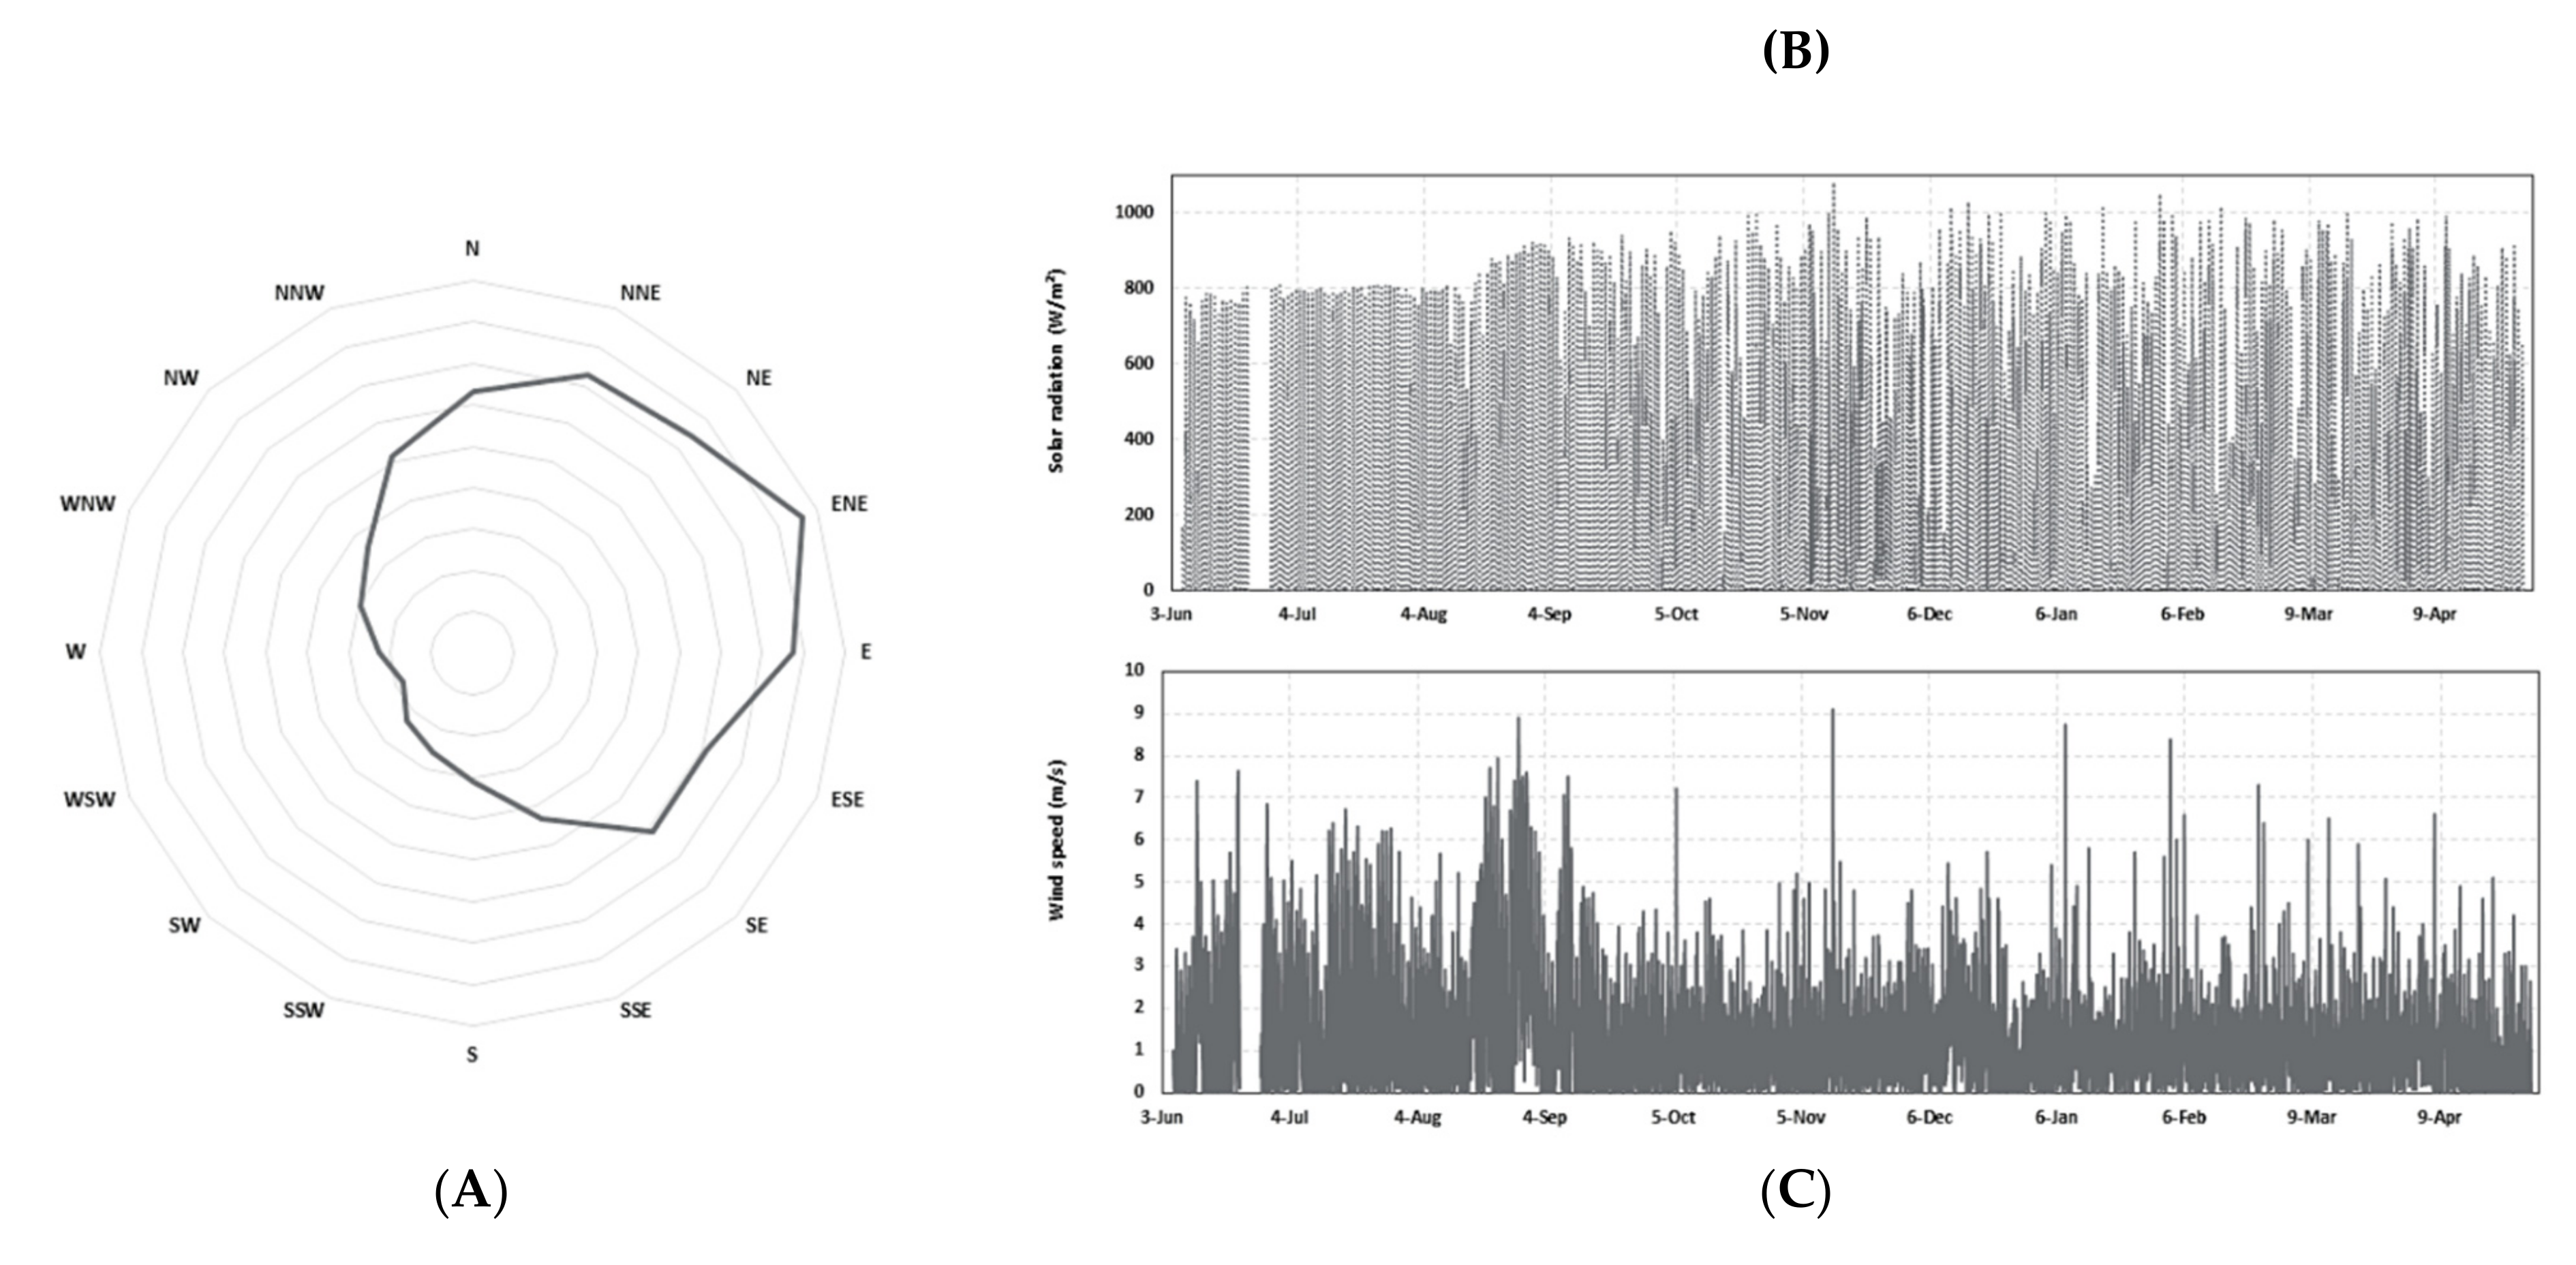
4.1. Outdoor Climate
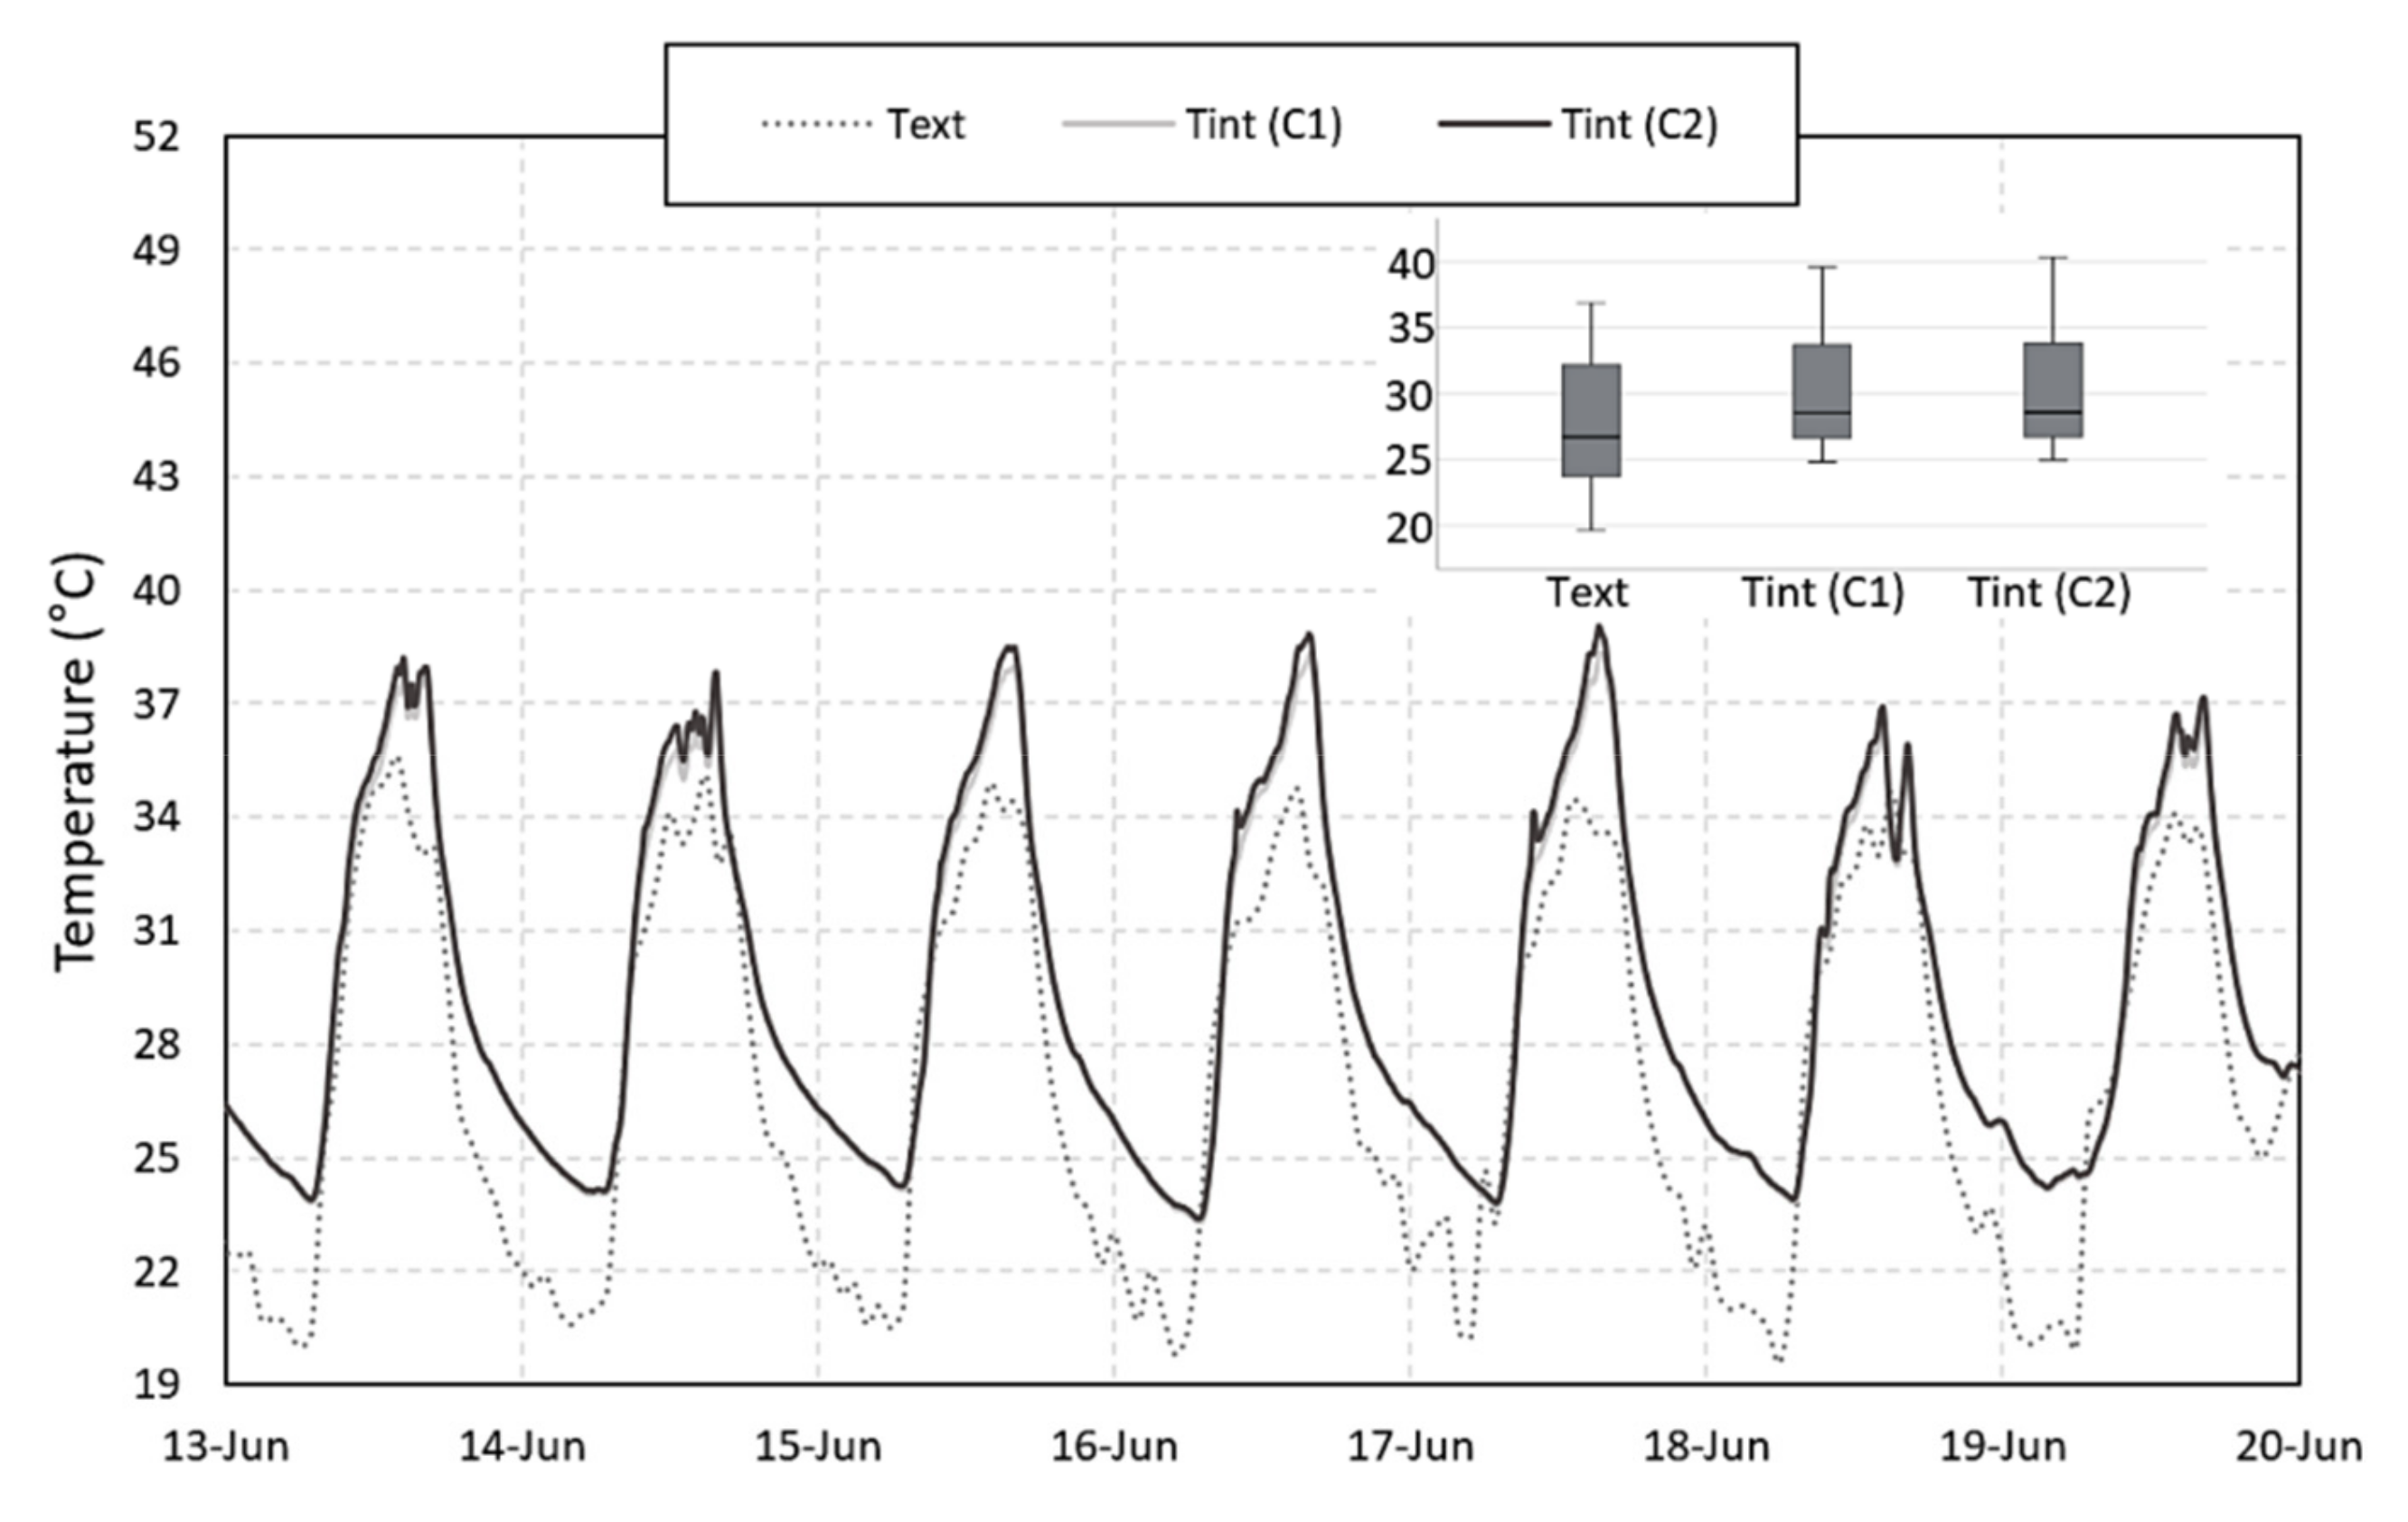
4.2. Phase I
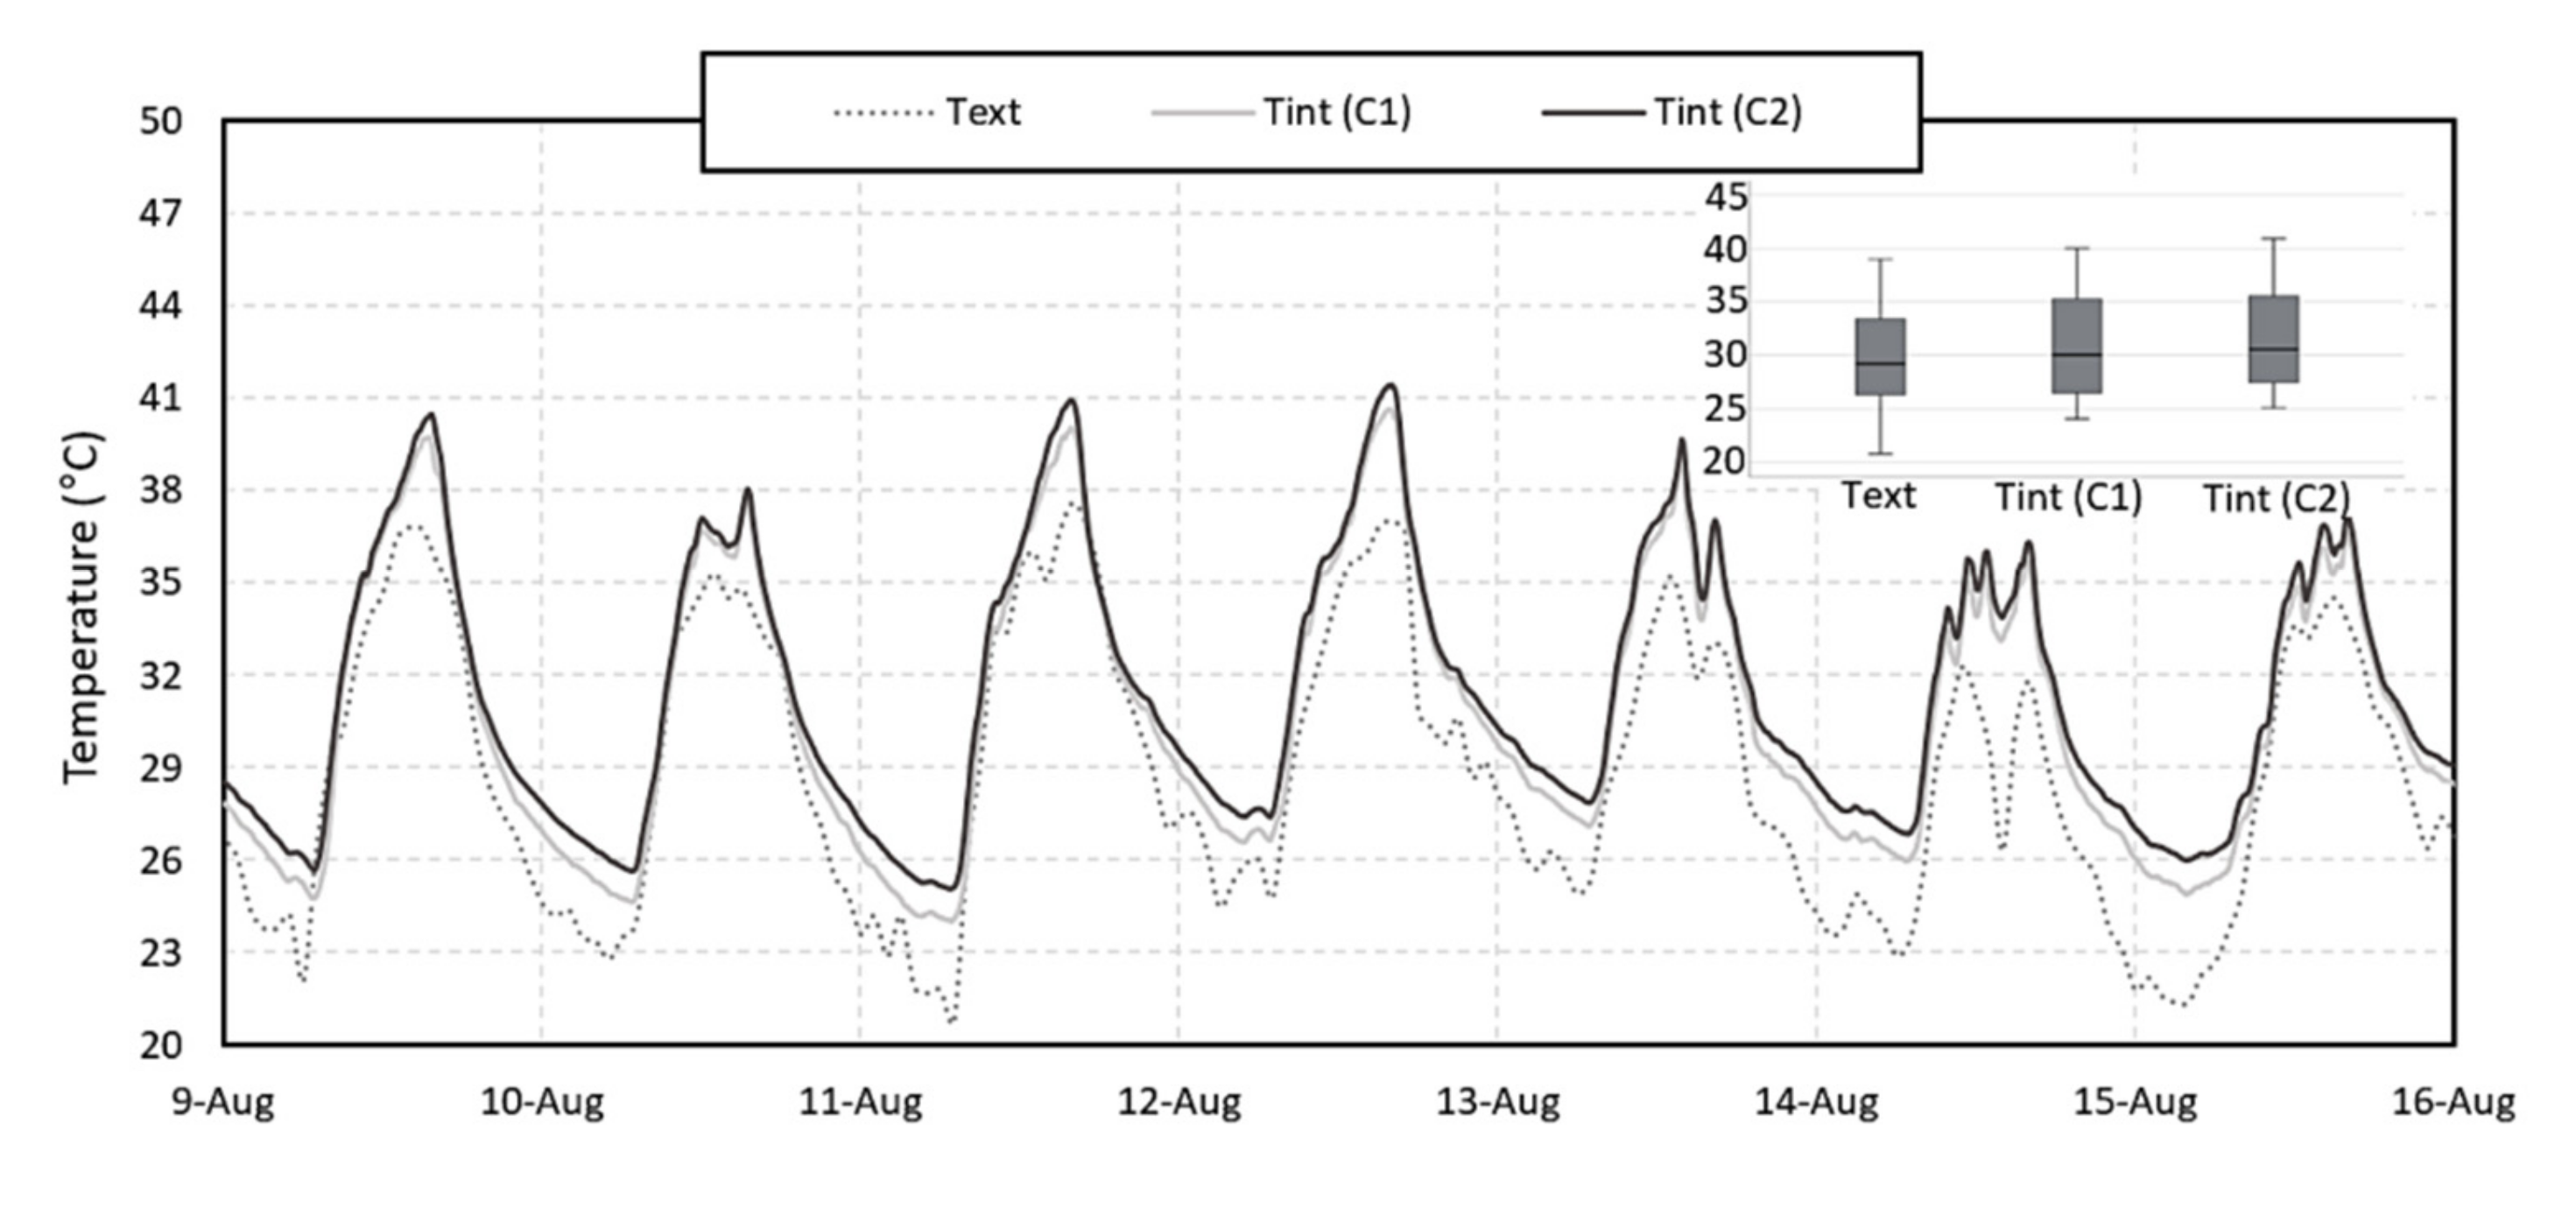
4.3. Phase II
5. Conclusions
- -
- the effectiveness of the shading of the glazed opening was not very evident, probably due to the specific characteristics of the opening used in the test cells, so it will be necessary to evaluate its effect with larger glazing areas;
- -
- the low-emissivity reflective film, considering the proposed roof model, was not efficient;
- -
- natural cross ventilation was the most effective at night, lowering the temperature compared to the control by 0.8 °C, and the reflective painting showed better performance during the day, ensuring a temperature decrease of 1.5 °C;
- -
- regarding the combined techniques, the results indicate that the last three campaigns were the most effective, that is, the combination of reflective painting with natural ventilation ensured greater decreases in temperature regarding the ones measured in the control cell;
- -
- globally, the differences obtained are insufficient to achieve adequate levels of thermal comfort without the support of air conditioning systems. However, the contribution of the passive techniques can be important in reducing the energy consumption associated with the HVAC systems.
Author Contributions
Funding
Institutional Review Board Statement
Informed Consent Statement
Acknowledgments
Conflicts of Interest
References
- Kamal, M.A. An overview of passive cooling techniques in buildings: Design concepts and architectural interventions. Napoc. Civ. Eng. Archit. 2012, 55, 84–97. [Google Scholar]
- Santamouris, M.; Kolokotsa, D. Passive cooling dissipation techniques for buildings and other structures: The state of the art. Energy Build. 2013, 57, 74–94. [Google Scholar] [CrossRef]
- Santamouris, M.; Argiriou, A. Passive cooling of buildings—Results of the pascool program. Int. J. Sol. Energy 1997, 19, 3–19. [Google Scholar] [CrossRef]
- Darmanis, M.; Çakan, M.; Moustris, K.P.; Kavadias, K.A.; Nikas, K.-S.P. Utilisation of Mass and Night Ventilation in Decreasing Cooling Load Demand. Sustainability 2020, 12, 7826. [Google Scholar] [CrossRef]
- Mumovic, D.S. A Handbook of Sustainable Building Desing and Engineering: An Integrated Approach to Energy. Health and Operational Performance; Earthscan: London, UK, 2009. [Google Scholar]
- Givoni, B. Climate Considerations in Building and Urban Design; Wiley: Hoboken, NJ, USA, 1998. [Google Scholar]
- Khambadkone, N.K.; Jain, R. A Bioclimatic analysis tool for investigation of the potential of passive cooling and heating strategies in a composite Indian climate. Build. Environ. 2017, 123, 469–493. [Google Scholar] [CrossRef]
- Kumar, S.; Singh, M.K.; Mathur, A.; Mathur, S.; Mathur, J. Thermal performance and comfort potential estima-tion in low-rise high thermal mass naturally ventilated office buildings in India: An experimental study. J. Build. Eng. 2018, 20, 569–584. [Google Scholar] [CrossRef]
- Roque, E.; Vicente, R.; Almeida, R.M. Opportunities of Light Steel Framing towards thermal comfort in southern European climates: Long-term monitoring and comparison with the heavyweight construction. Build. Environ. 2021, 200, 107937. [Google Scholar] [CrossRef]
- Roque, E.; Oliveira, R.; Almeida, R.M.S.F.; Vicente, R.; Figueiredo, A. Lightweight and prefabricated construction as a path to energy efficient buildings: Thermal design and execution challenges. Int. J. Environ. Sustain. Dev. 2020, 19, 1–32. [Google Scholar] [CrossRef]
- Stazi, F.; Tomassoni, E.; Bonfigli, C.; DI Perna, C. Energy, comfort and environmental assessment of different building envelope techniques in a Mediterranean climate with a hot dry summer. Appl. Energy 2014, 134, 176–196. [Google Scholar] [CrossRef]
- Kumar, S.; Tewari, P.; Mathur, S.; Mathur, J. Development of mathematical correlations for indoor temperature from field observations of the performance of high thermal mass buildings in India. Build. Environ. 2017, 122, 324–342. [Google Scholar] [CrossRef]
- Givoni, B. Effectiveness of mass and night ventilation in lowering the indoor daytime temperatures. Part I: 1993 experimental periods. Energy Build. 1998, 28, 25–32. [Google Scholar] [CrossRef]
- Cheng, V.; Ng, E.Y.Y.; Givoni, B. Effect of envelope colour and thermal mass on indoor temperatures in hot humid climate. Sol. Energy 2005, 78, 528–534. [Google Scholar] [CrossRef]
- Artmann, N.; Manz, H.; Heiselberg, P. Parameter study on performance of building cooling by night-time ventilation. Renew. Energy 2008, 33, 2589–2598. [Google Scholar] [CrossRef]
- Romeo, C.; Zinzi, M. Impact of a cool roof application on the energy and comfort performance in an existing non-residential building. A Sicilian case study. Energy Build. 2013, 67, 647–657. [Google Scholar] [CrossRef]
- Imessad, K.; Derradji, L.; Messaoudene, N.A.; Mokhtari, F.; Chenak, A.; Kharchi, R. Impact of passive cooling techniques on energy demand for residential buildings in a Mediterranean climate. Renew. Energy 2014, 71, 589–597. [Google Scholar] [CrossRef]
- Al-Obaidi, K.M. Passive cooling techniques through reflective and radioative roofs in tropical houses in Southeast Asia: A literature review. Front. Archit. Research. 2014, 3, 183–297. [Google Scholar] [CrossRef] [Green Version]
- Eli, L.; Krelling, A.; Olinger, M.; Melo, A.; Lamberts, R. Thermal performance of residential building with mixed-mode and passive cooling strategies: The Brazilian context. Energy Build. 2021, 244, 111047. [Google Scholar] [CrossRef]
- Veiga, R.K. Metamodelo Para Estimar o Desempenho Térmico de Edificações Residenciais Multifamiliares Naturalmente Ventiladas. Master’s Thesis, Universidade Federal de Santa Catarina, Florianópolis, Brazil, 2021. (In Portuguese). [Google Scholar]
- Buonocore, C.O. Análise das Condições de Conforto Térmico no Clima Quente e Úmido de São Luís (MA): Estudos de Campo em Salas de Aula Naturalmente Ventiladas e Climatizadas. Master’s Thesis, Universidade Federal de Santa Catarina, Florianópolis, Brazil, 2018. (In Portuguese). [Google Scholar]
- Schabbach, L.M. Pigmented glazed ceramic roof tiles in Brazil: Thermal and optical properties related to solar reflectance index. Sol. Energy 2018, 159, 113–124. [Google Scholar] [CrossRef]
- Michels, C. Avaliação Experimental do Desempenho Térmico de Coberturas. Master’s Thesis, Universidade Federal de Santa Catarina, Florianópolis, Brazil, 2018. (In Portuguese). [Google Scholar]
- Brasil, Ministério Da Agricultura, Pecuária E Abastecimento: Instituto Nacional De Meteorologia. Rede de Estações Meteorológicas Automáticas do INMET; Nota Técnica nº 001/2011. 11; Ministério Da Agricultura, Pecuária E Abastecimento: Instituto Nacional De Meteorologia: Brasília, Brazil, 2011.
- Onset Computer Corporation. A Manual—U12011: Hobo U12 Temp/RH Data Logger Doc 13127; Onset Computer Corporation: Bourne, MA, USA, 2009. [Google Scholar]
- ISO 12569:2017 (EN). Thermal Performance of Buildings and Materials—Determination of Specific Airflow Rate in Buildings—Tracer Gas Dilution Method; ISO: Geneva, Switzerland, 2017. [Google Scholar]
- ASTM. E741-00 Standard Test Method for Determining Air Change in a Single Zone by Means of a Tracer Gas Dilution, American Society for Testing and Materials; ASTM: West Conshohocken, PA, USA, 2000. [Google Scholar]
- Oliveira, A.V.M.; Raimundo, A.M.; Gaspar, A.R.; Quintela, D.A. Globe Temperature and Its Measurement: Requirements and Limitations. Ann. Work. Expo. Health 2019, 63, 743–758. [Google Scholar] [CrossRef]
- Alfano, F.R.D.; Dell’Isola, M.; Ficco, G.; Palella, B.I.; Riccio, G. On the measurement of the mean radiant temperature by means of globes: An experimental investigation under black enclosure conditions. Build. Environ. 2021, 193, 107655. [Google Scholar] [CrossRef]
- ISO. 7726:1998 Ergonomics of the Thermal Environment—Instruments for Measuring Physical Quantities; ISO: Geneva, Switzerland, 1998. [Google Scholar]
- Stavrakakis, G.M.; Karadimou, D.P.; Zervas, P.L.; Sarimveis, H.; Markatos, N.C. Selection of window sizes for optimizing occupational comfort and hygiene based on computational fluid dynamics and neural networks. Build. Environ. 2011, 46, 298–314. [Google Scholar] [CrossRef]
- Stavrakakis, G.; Zervas, P.; Sarimveis, H.; Markatos, N. Optimization of window-openings design for thermal comfort in naturally ventilated buildings. Appl. Math. Model. 2012, 36, 193–211. [Google Scholar] [CrossRef]


| Thermal Resistance (m2 °C/W) | |
|---|---|
| Walls/Ceiling | 0.61 |
| Pitched Roof | 0.82 |
| Campaign | Passive Cooling Techniques | Duration |
|---|---|---|
| Phase I | ||
| 1 | Shading of the glazed opening | 21 days |
| 2 | Application of low-emissivity reflective film in the attic | 21 days |
| 3 | Natural cross ventilation by wind action for 24 h | 21 days |
| 4 | Painting the opaque envelope with reflective paint | 28 days |
| Phase II | ||
| 5 | Painting of the opaque envelope with reflective paint and natural cross ventilation by wind action for 24 h | 10 days |
| 6 | Painting of the opaque envelope with reflective paint and natural cross ventilation by wind action during the night period | 14 days |
| 7 | Painting of the opaque envelope with reflective paint and natural ventilation by chimney effect for 24 h | 10 days |
| Campaign | Passive Cooling Techniques | TAve, in °C | ||
|---|---|---|---|---|
| 24 h | Nigth | Daytime | ||
| Phase I | ||||
| 1 | Shading of the glazed opening | −0.2 | −0.0 | −0.2 |
| 2 | Application of low-emissivity reflective film in the attic | 0.2 | 0.2 | 0.3 |
| 3 | Natural cross ventilation by wind action for 24 h | −0.6 | −0.8 | −0.5 |
| 4 | Painting the opaque envelope with reflective paint | −1.1 | −0.5 | −1.7 |
| Phase II | ||||
| 5 | Painting of the opaque envelope with reflective paint and natural cross ventilation by wind action for 24 h | −1.7 | −0.8 | −2.7 |
| 6 | Painting of the opaque envelope with reflective paint and natural cross ventilation by wind action during the night period | −1.6 | −0.9 | −2.8 |
| 7 | Painting of the opaque envelope with reflective paint and natural ventilation by chimney effect for 24 h | −1.8 | −0.8 | −3.1 |
Publisher’s Note: MDPI stays neutral with regard to jurisdictional claims in published maps and institutional affiliations. |
© 2022 by the authors. Licensee MDPI, Basel, Switzerland. This article is an open access article distributed under the terms and conditions of the Creative Commons Attribution (CC BY) license (https://creativecommons.org/licenses/by/4.0/).
Share and Cite
Marcolini, M.; Almeida, R.M.S.F.; Barreira, E. Evaluation of the Effect of Passive Cooling Techniques on Thermal Comfort Using Test Cells in the Northern Region of Brazil. Appl. Sci. 2022, 12, 1546. https://doi.org/10.3390/app12031546
Marcolini M, Almeida RMSF, Barreira E. Evaluation of the Effect of Passive Cooling Techniques on Thermal Comfort Using Test Cells in the Northern Region of Brazil. Applied Sciences. 2022; 12(3):1546. https://doi.org/10.3390/app12031546
Chicago/Turabian StyleMarcolini, Murilo, Ricardo M. S. F. Almeida, and Eva Barreira. 2022. "Evaluation of the Effect of Passive Cooling Techniques on Thermal Comfort Using Test Cells in the Northern Region of Brazil" Applied Sciences 12, no. 3: 1546. https://doi.org/10.3390/app12031546
APA StyleMarcolini, M., Almeida, R. M. S. F., & Barreira, E. (2022). Evaluation of the Effect of Passive Cooling Techniques on Thermal Comfort Using Test Cells in the Northern Region of Brazil. Applied Sciences, 12(3), 1546. https://doi.org/10.3390/app12031546