1. Introduction
In accordance with the plan for the implementation of renewable energy 3020, Korea is pushing to increase its proportion of renewable energy from its current level of 7% to 20% by 2030 [
1]. More than 95% of newly installed facilities will be supplied with clean energy, such as solar and wind power. In particular, Korea aims to install 12 GW of offshore wind power by 2030. Due to the nature of offshore wind power generation, complexes are mainly built in coastal waters because of water depth restrictions. Accordingly, these complexes are concentrated in narrow waters, and offshore wind farms tend to be built in national boundary waters [
2,
3]. Marine wind power generation complexes are under construction not only in Korea but also in various countries facing the sea, and the indiscriminate construction of these complexes can seriously affect existing maritime traffic safety due to changes in ship traffic volume [
4].
The government enacted the Act on Marine Spatial Planning and Management in 2018 and is currently establishing the “Basic Plan for Marine Space” to create and implement plans for the sustainable use, development, and preservation of marine space [
5]. The Basic Plan for Marine Space contains outlines for basic policy directions, the management and utilization of spatial information, R&D, and the international cooperation necessary for marine space management, and also aims to develop marine resources such as aggregates and minerals, fishing rights, marine energy, and marine ecosystem management [
6,
7].
In such a situation, the Ministry of Oceans and Fisheries intends to establish an efficient maritime transportation system by creating a national integrated maritime transportation system, such as a road traffic and marine transportation network plan [
8]. As mentioned above, most ports and navigation areas are designated by law or notice, so the waters near ports are guaranteed some degree of ship traffic safety. In addition, intermediate waters that are not announced under the law, such as intermediate port waters connecting ports and ports, coastal port areas where coastal ships pass through, and port areas are important and need to be designated and managed properly [
9].
The construction of offshore wind farms has various effects on maritime traffic [
10]. Mehdi et al. [
11] studied seafarers’ perceptions of navigational safety risks near offshore wind farms and found that the respondents had high concerns about the five risk types. In addition, a plan for the coexistence of offshore wind farms and shipping was created by improving the navigation risk assessment process [
12]. A study was also conducted on the numerical effect of ship collision on wind turbine structures [
13].
There are many studies focusing on the design of fairways. Although some research on fairway design using autonomous navigation or AI has been carried out recently [
14,
15], many studies on fairway design, including fairway width, have already been conducted. However, most studies have focused on the design of the fairway width for ports taking into account the approaching waters or bandwidth of fairways [
16,
17,
18], and there are few studies or design standards on the appropriate fairway width for coastal fairways such as TSS in coastal waters [
19].
Thus, research related to the establishment of offshore wind farms with maritime traffic has been conducted previously, but the criteria used for calculating the width of the established vessel fairway have not been studied.
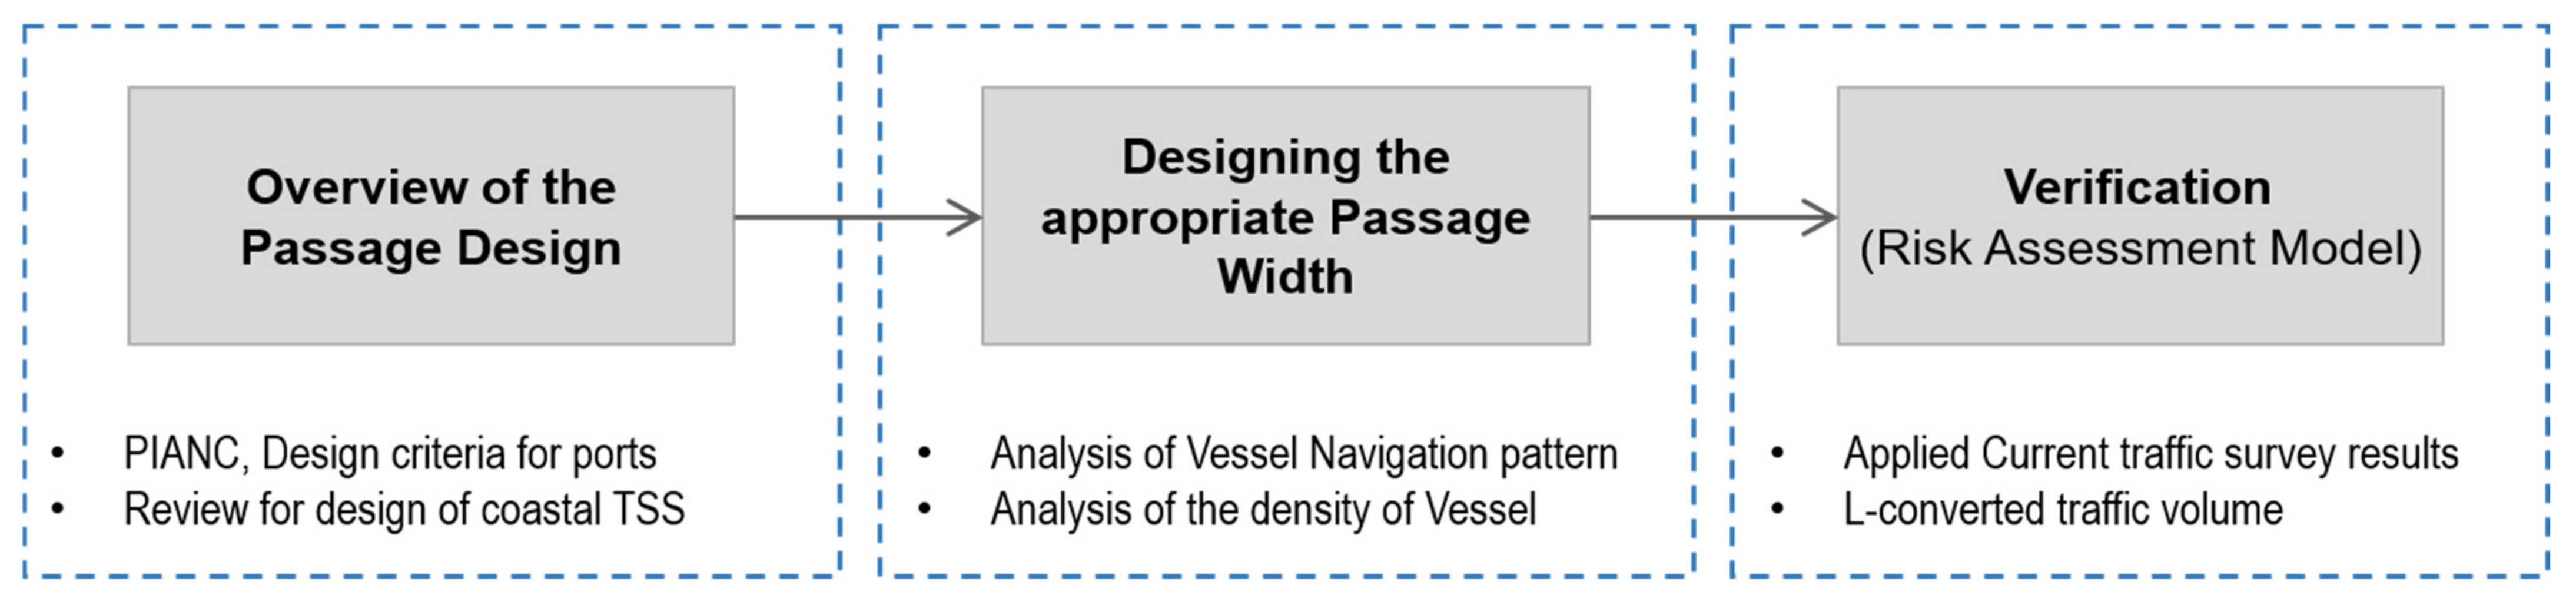
In this study, in order to calculate the appropriate width for an offshore transportation network route, the current status of coastal ships in Korea and the current status of the planned construction of offshore marine wind farms were analyzed. Based on the traffic status, an appropriate route width was designed using a maritime traffic safety evaluation model. For this, the standards and cases of general route design width were investigated, and an appropriate range was selected. After analyzing the traffic density and vessel operation patterns for the target sea area, a risk evaluation was conducted to determine the appropriate route width for the vessel traffic volume using the traffic safety evaluation model.
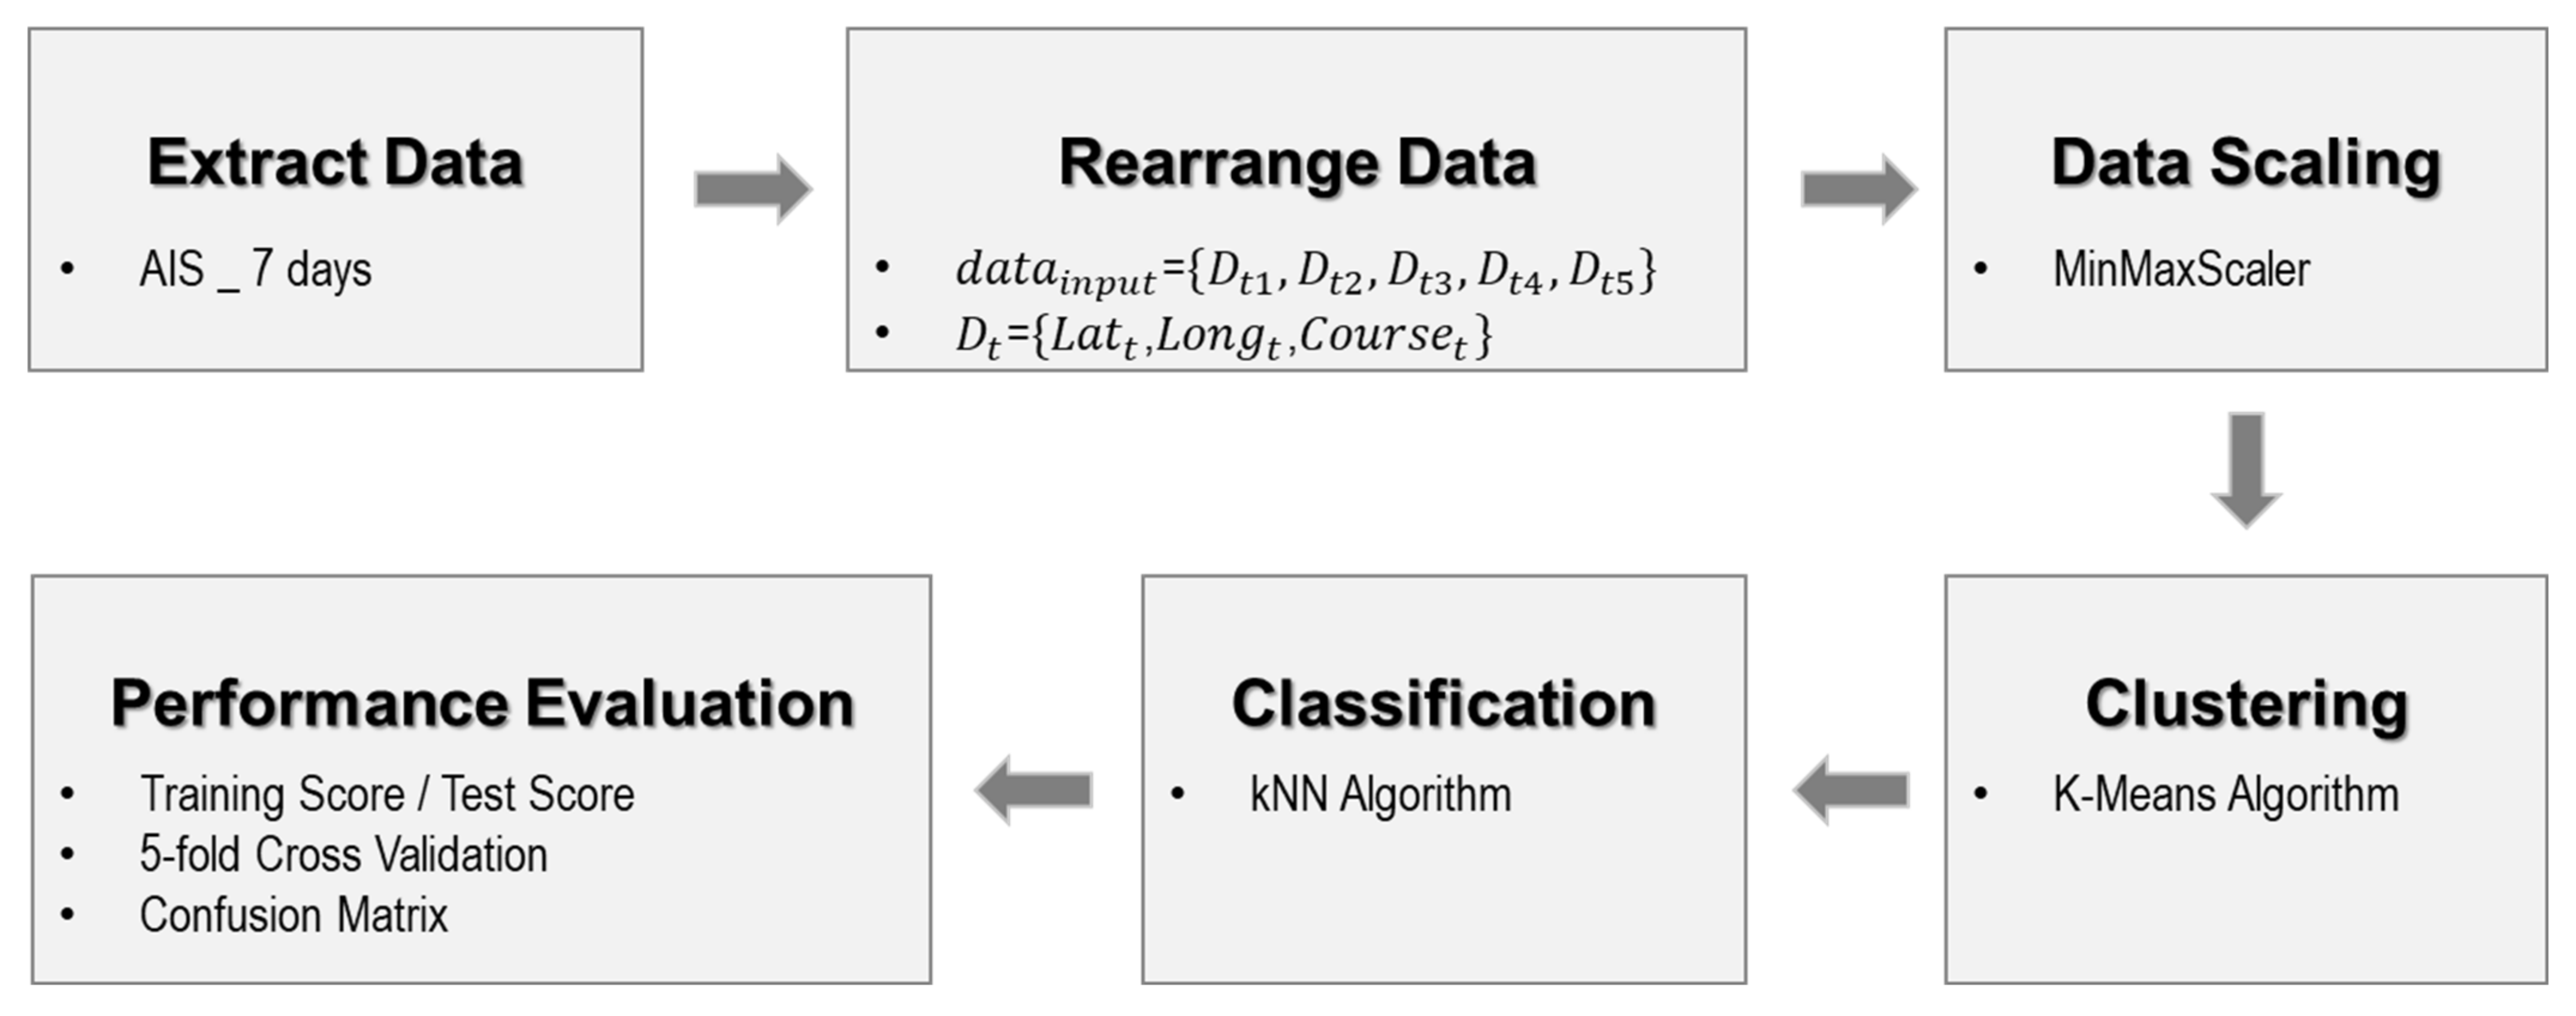
Figure 1 shows the flowchart of this study.
2. Analysis of the Designing for Fairway Width
2.1. Traffic Status Analysis
In this study, in order to determine the appropriate width for the marine transportation network, the current status of coastal ship fairways in Korea and the current status of the planned construction of an offshore wind power plant were analyzed. The offshore wind power generation complex is scheduled to be built in the Incheon, Jeon-buk, and Jeon-nam regions of the West Sea, Nam-hae, and off the coast of Ulsan. In this study, the target sea area off the coast of Gun-san was selected and analyzed, with the fairway intersecting the north–south direction and the east–west direction. Based on AIS (Automatic Identification System) data, most ships, except for fishing boats and other small ships, show a certain customs pattern depending on their destination and can be divided into the main flows where ship fairways are concentrated, and branch-type flows generated when entering each port.
In order to build an offshore wind farm, the wind conditions must be measured for one year and a wind turbine can be built within a range of 10 km for each instrument [
20]. Currently, in the coastal waters of Korea with depths below 200 m, wind condition gauges are installed and there are many planned installation sites.
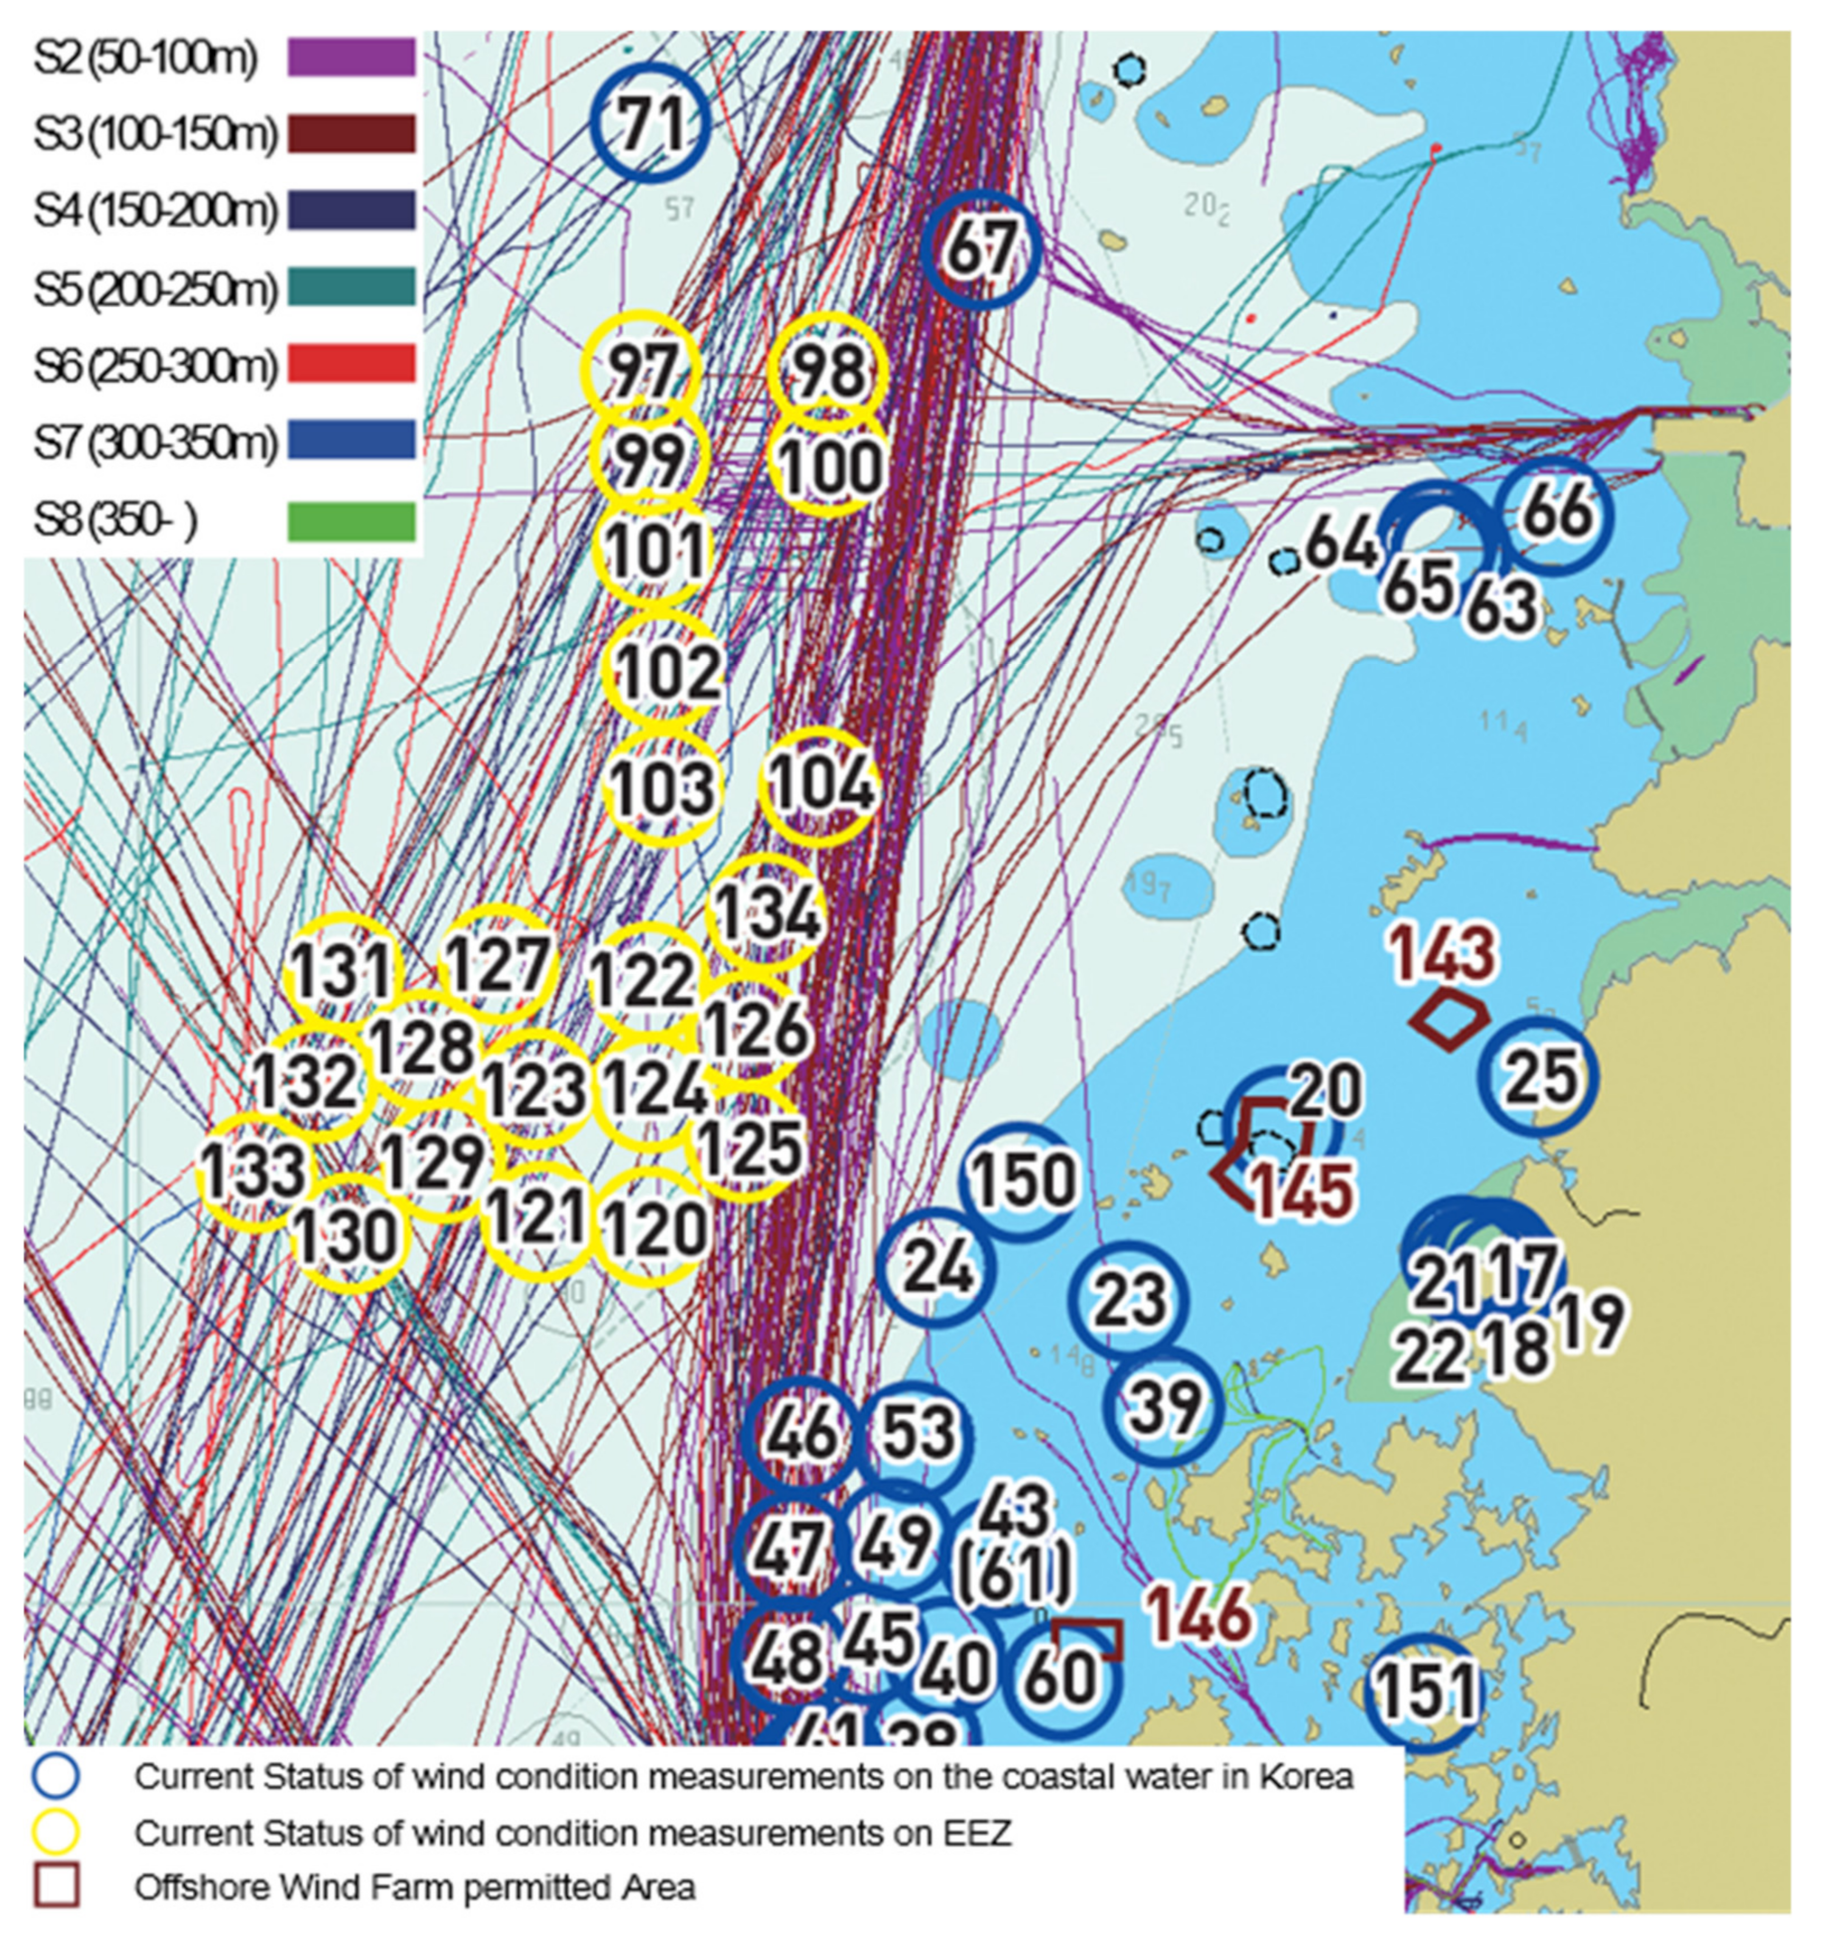
Figure 2 shows the current status of wind conditions and the maritime traffic flow to be achieved in the sea area near Gun-san Port, which is the focus area of this study.
Figure 2 shows the trajectory of ships over 50 m long: the blue circle represents the wind measuring instrument installation permit area in coastal waters, while the yellow circle represents the wind measuring instrument installation permit area in the EEZ (Exclusive Economic Zone). Some of the wind measuring instruments in the coastal waters are located in the middle of the main traffic flow going north and south. Most of the wind measuring instruments in the EEZ are located in the middle of the vessel traffic flow. If an offshore wind farm is built in the relevant water area in the future, the navigation flow of ships will change significantly. Therefore, before the establishment of an offshore wind farm construction plan, an appropriate vessel fairway should be established to ensure navigation safety.
Currently, when designing the width of approach channels for a port or fairways near a port, the “Harbour Approach Channels Design Guidelines” provided by the International Water Transportation Facility Association (PIANC) or the Korean port and fishing port design standards are considered. However, this method is useful when setting the width of a waterway and waters near to a port, and when ships with various destinations are navigating a wide area, the ships must pass by each other, which can lead to economic losses.
As one method of maritime traffic management, the setting of a traffic separation zone is frequently conducted at home and abroad. However, there is no unified guideline for the design of these traffic partitions, so they are set according to the subjective judgment of experts. Although there are some studies on reducing maritime accidents when setting up traffic partitions, there are few studies on design guidelines for traffic partitions [
19]. In this chapter, we conducted an analysis of Korea’s Traffic Separation Scheme and various route design standards for the basic survey of proper fairway width designs.
2.2. PIANC Standards
In this study, the Harbor Approach Channels Design Guidelines of the International Association of Water Transportation Facilities (PIANC Rule) were analyzed to examine the appropriateness of the width of the domestic coastal fairways.
This guideline is used for designing the width of the fairways and channels approaching ports, with the width differing depending on whether it is used for one-way passage or two-way passage. In order to design the fairway width, it is necessary to consider the characteristics of the ships passing through that area of the sea. The basic conditions for designing fairways to ensure the safety of vessels are as follows [
21,
22,
23]:
- -
Specify the largest vessel using the route;
- -
Consider the permissible weather conditions in which vessels can navigate the route;
- -
Specify the traffic capacity that the route can accommodate;
- -
Note any additional conditions (tugboat support, etc.).
PIANC’s approach channel design guideline sets the basic channel width according to the characteristics of the ship and reflects the influence of wind. The required channel width is added according to the marine environment, air speed, and sea level quality and shape, and cargo type. In addition, the factors applied vary depending on whether the waterway through which the ship passes is one-way or two-way [
21].
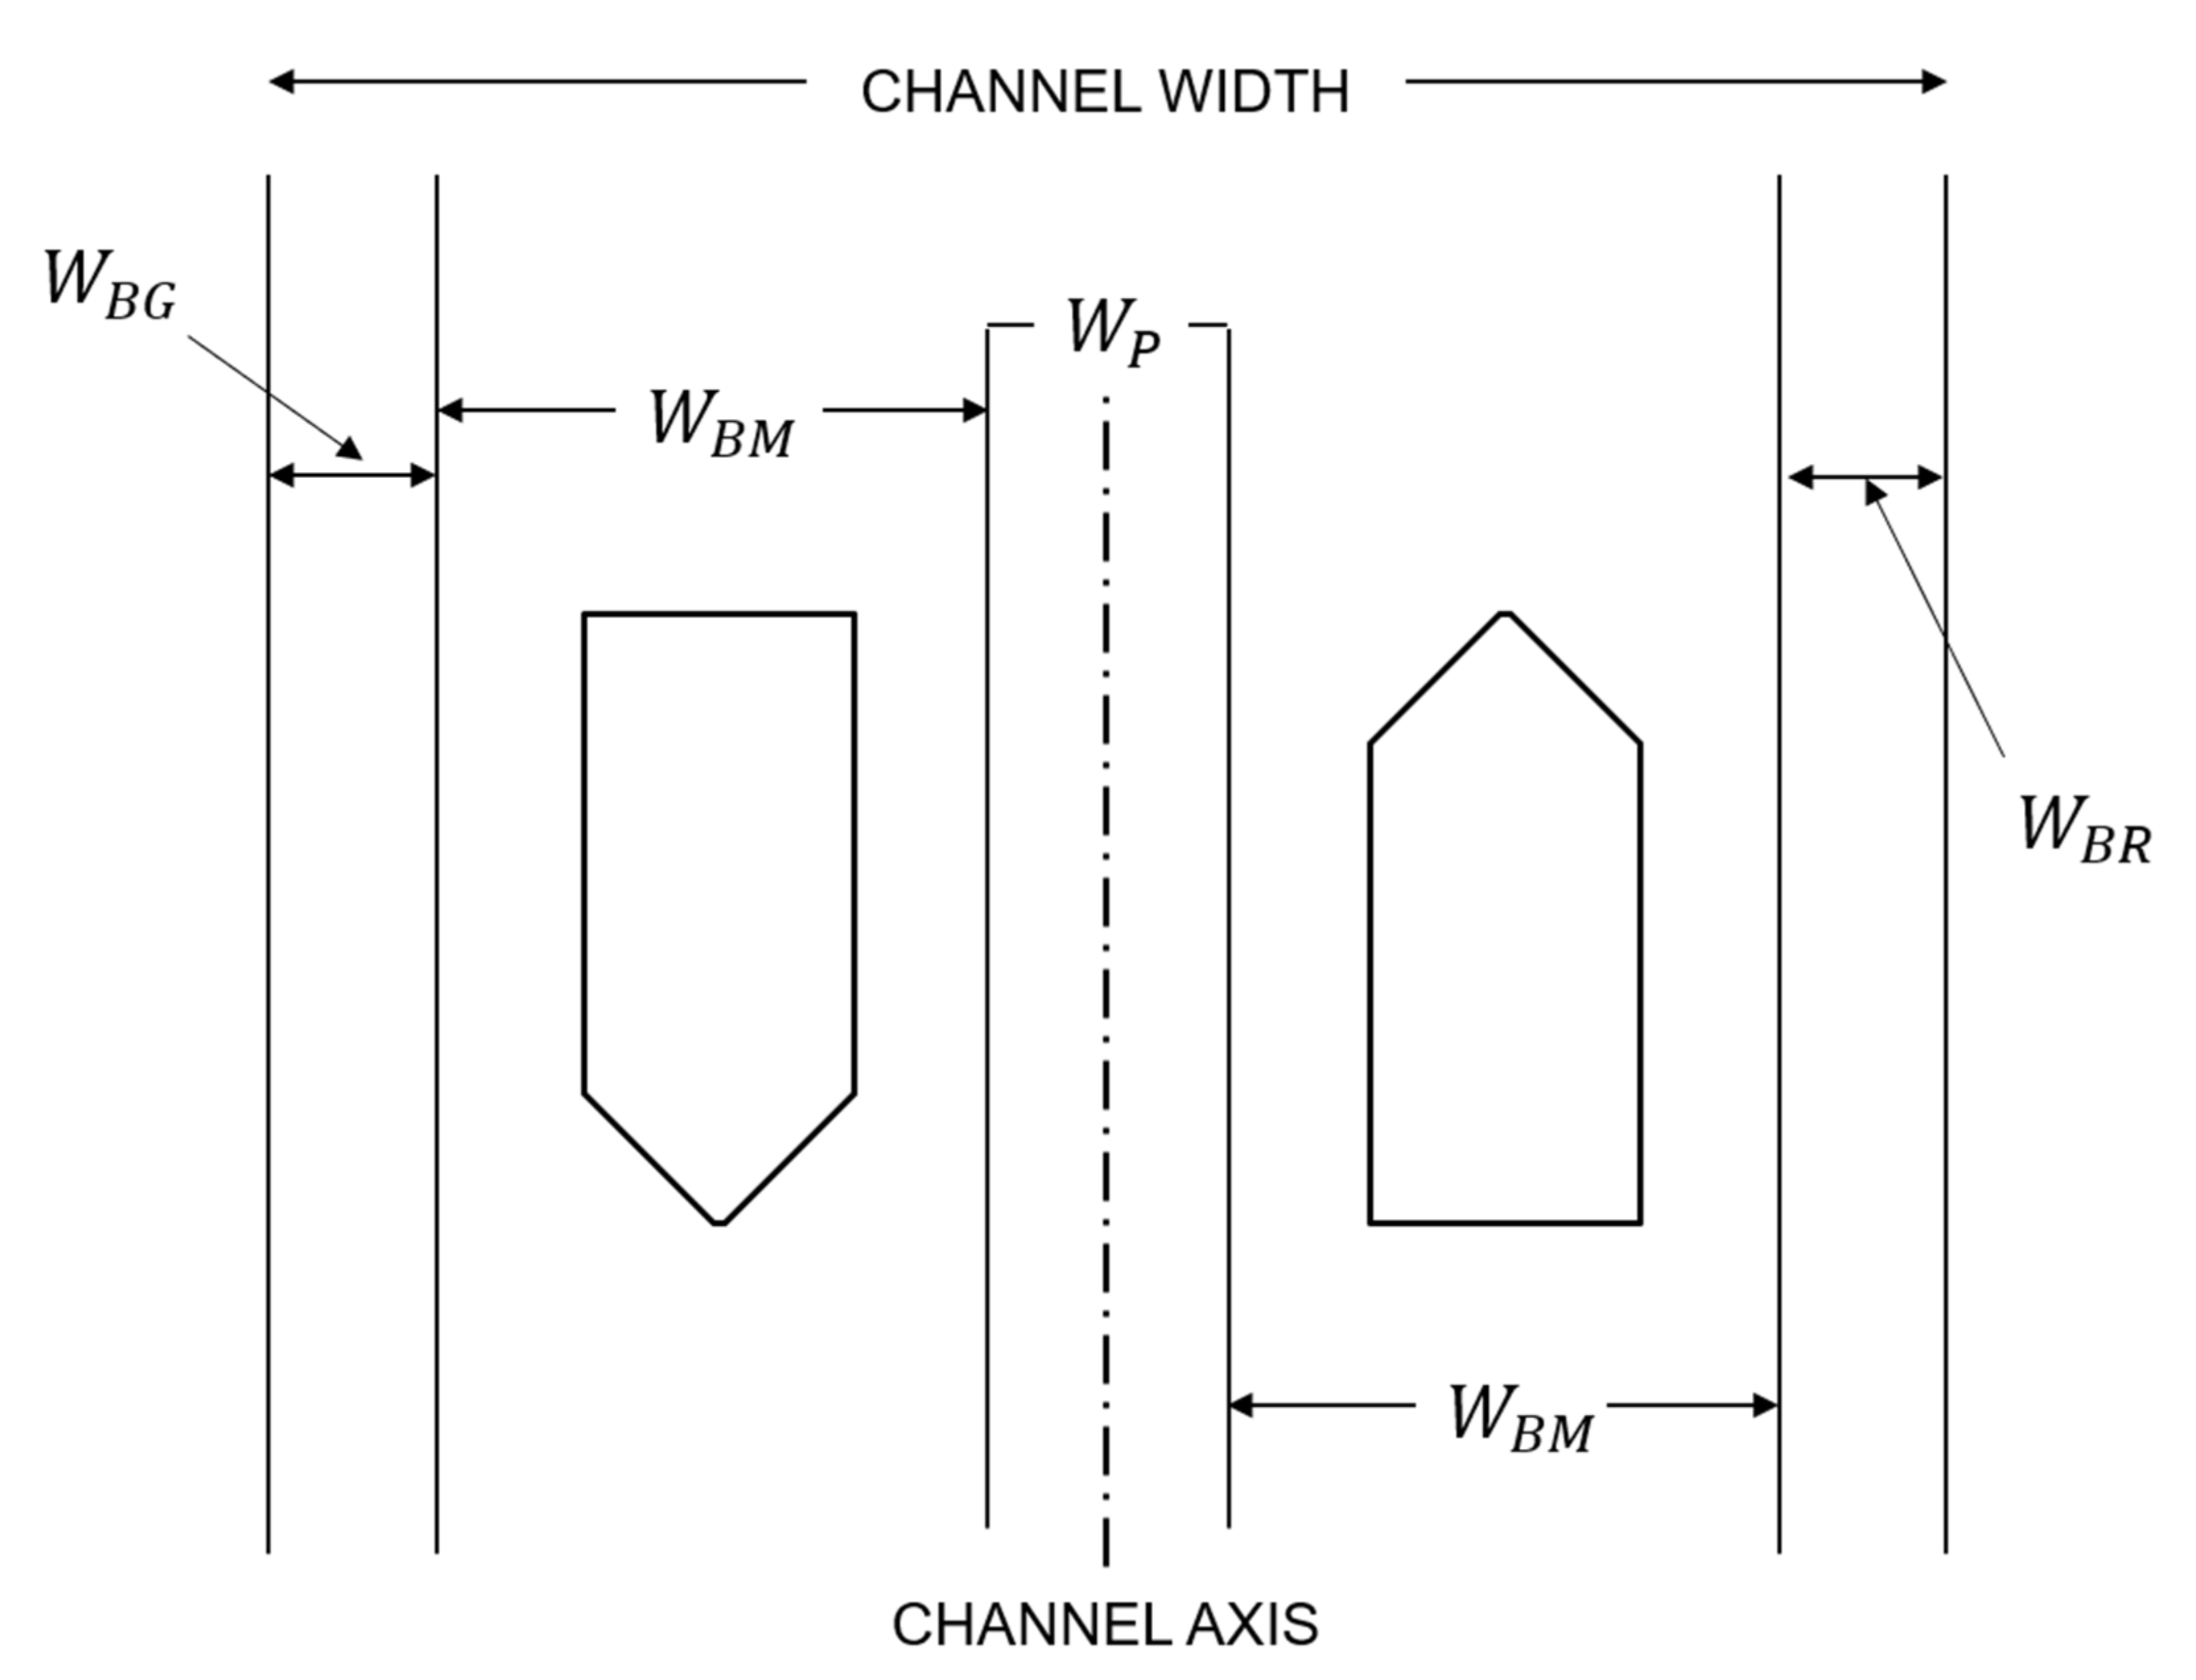
As shown in
Figure 3, the required channel width of a one-way channel for the bottom width
of the harbor and access channel is calculated using Equation (1):
Equation (2) is for the case of a two-way channel:
where:
| Basic maneuvering lane; |
| Additional widths to allow for the effects of wind, etc.; |
| Bank clearance; |
| Passing distance between both maneuvering lanes |
Table 1 shows detailed descriptions of the basic navigation channel width and the additional route width of the ship.
In summary, the Harbor Approach Channel Design Guideline is used for determining the width of the approach channel, as shown in
Section 2.2.
Table 1 summarizes the criteria used for calculating the width of the approach channel, considering the maneuvering performance, ship speed, and cargo loading according to the type of ship involved. For these factors, when calculating the two-way traffic according to Equation (2), it may appear from 3.8 to 18.6 B.
2.3. Korea Design Standard
The channel width is set according to the vessel specifications, traffic conditions, traffic flow, channel length, traffic volume, weather and sea conditions, etc. However, in the case of using a tugboat, setting an evacuation zone, or having a very short channel, the channel width may be reduced within a range that does not undermine the safe navigation of the vessels [
24].
Table 2 shows the channel width standard according to the Korea Design Standard.
2.4. Traffic Separation Scheme
In order to cope with a series of major maritime accidents in Northern Europe in the 1960s, the West German, French, and British Navigation Society launched a study on how to separate ports in the Dover Strait, followed by studies on other seas with a statistically increased risk of collisions. In 1968, the number of participating bodies increased significantly after 41 ports were recommended by the International Maritime Organization (IMO) and two ports were decided by the IMO in 1973 to reduce marine accidents. In addition, Article 10 of the International Maritime Collision Prevention Regulations of 1972 describes the behavior of ships navigating within or near the customs separation method adopted by the IMO [
19].
It is stated that the IMO fairway separation method should take into account the fairway density, passage method, and available vessel traffic area when setting the fairway width, but the design width of the traffic separation scheme is not taken into account.
As a result of a case study targeting the Strait of Dover, it was found that the number of marine accidents decreased by 23% compared to the previous level when the Traffic Separation Scheme was implemented [
25]. In addition, it was determined that the number of collision accidents in Tokyo Bay, Japan, decreased by 18% after the implementation of the Traffic Separation Scheme [
19,
26]. In addition, in studies focusing on the estimated effect of the introduction of the Traffic Separation Scheme, it was found that the number of collision accidents was reduced by about 24% in most cases [
19]. Additionally, Park et al. (2003) calculated the effect of installing a traffic separator using a maritime traffic flow simulation for a round-trip waterway without a center line mark. As a result, it was determined that the psychological burden of ship operators was reduced by about 32% when the TSS was installed [
27].
Table 3 shows the customs clearance zones in Korea. The Traffic Separation Scheme (TSS) established in Korea can be divided into schemes established in approach waterways near ports and schemes established in coastal waters. The TSS for coastal waters can be further divided into natural forms with an island in the middle of the TSS and artificial forms with separate sections.
3. Estimation of the Appropriate Fairway Width
According to the analysis above, the access channel of the port is formed at a minimum of 3.8 to 18.6 B. In addition, the TSS width is designed to be at least 5600 to 8500 m. In terms of maritime traffic safety, the wider the route is, the safer the fairway of ships will be. In this chapter, the current status of sea traffic and navigation routes in the sea area near Gunsan Port, the subject area of this study, was analyzed and presented. The navigation route was analyzed using the machine learning kNN algorithm and the K-Means algorithm. In this chapter, the appropriate fairway width was estimated through density analysis based on the suggested navigation route; in
Section 4, the appropriate fairway width was determined based on the risk assessment model.
3.1. Maritime Traffic Analysis
In order to design an appropriate width of fairway for the purpose of this study, the current status of maritime traffic was analyzed.
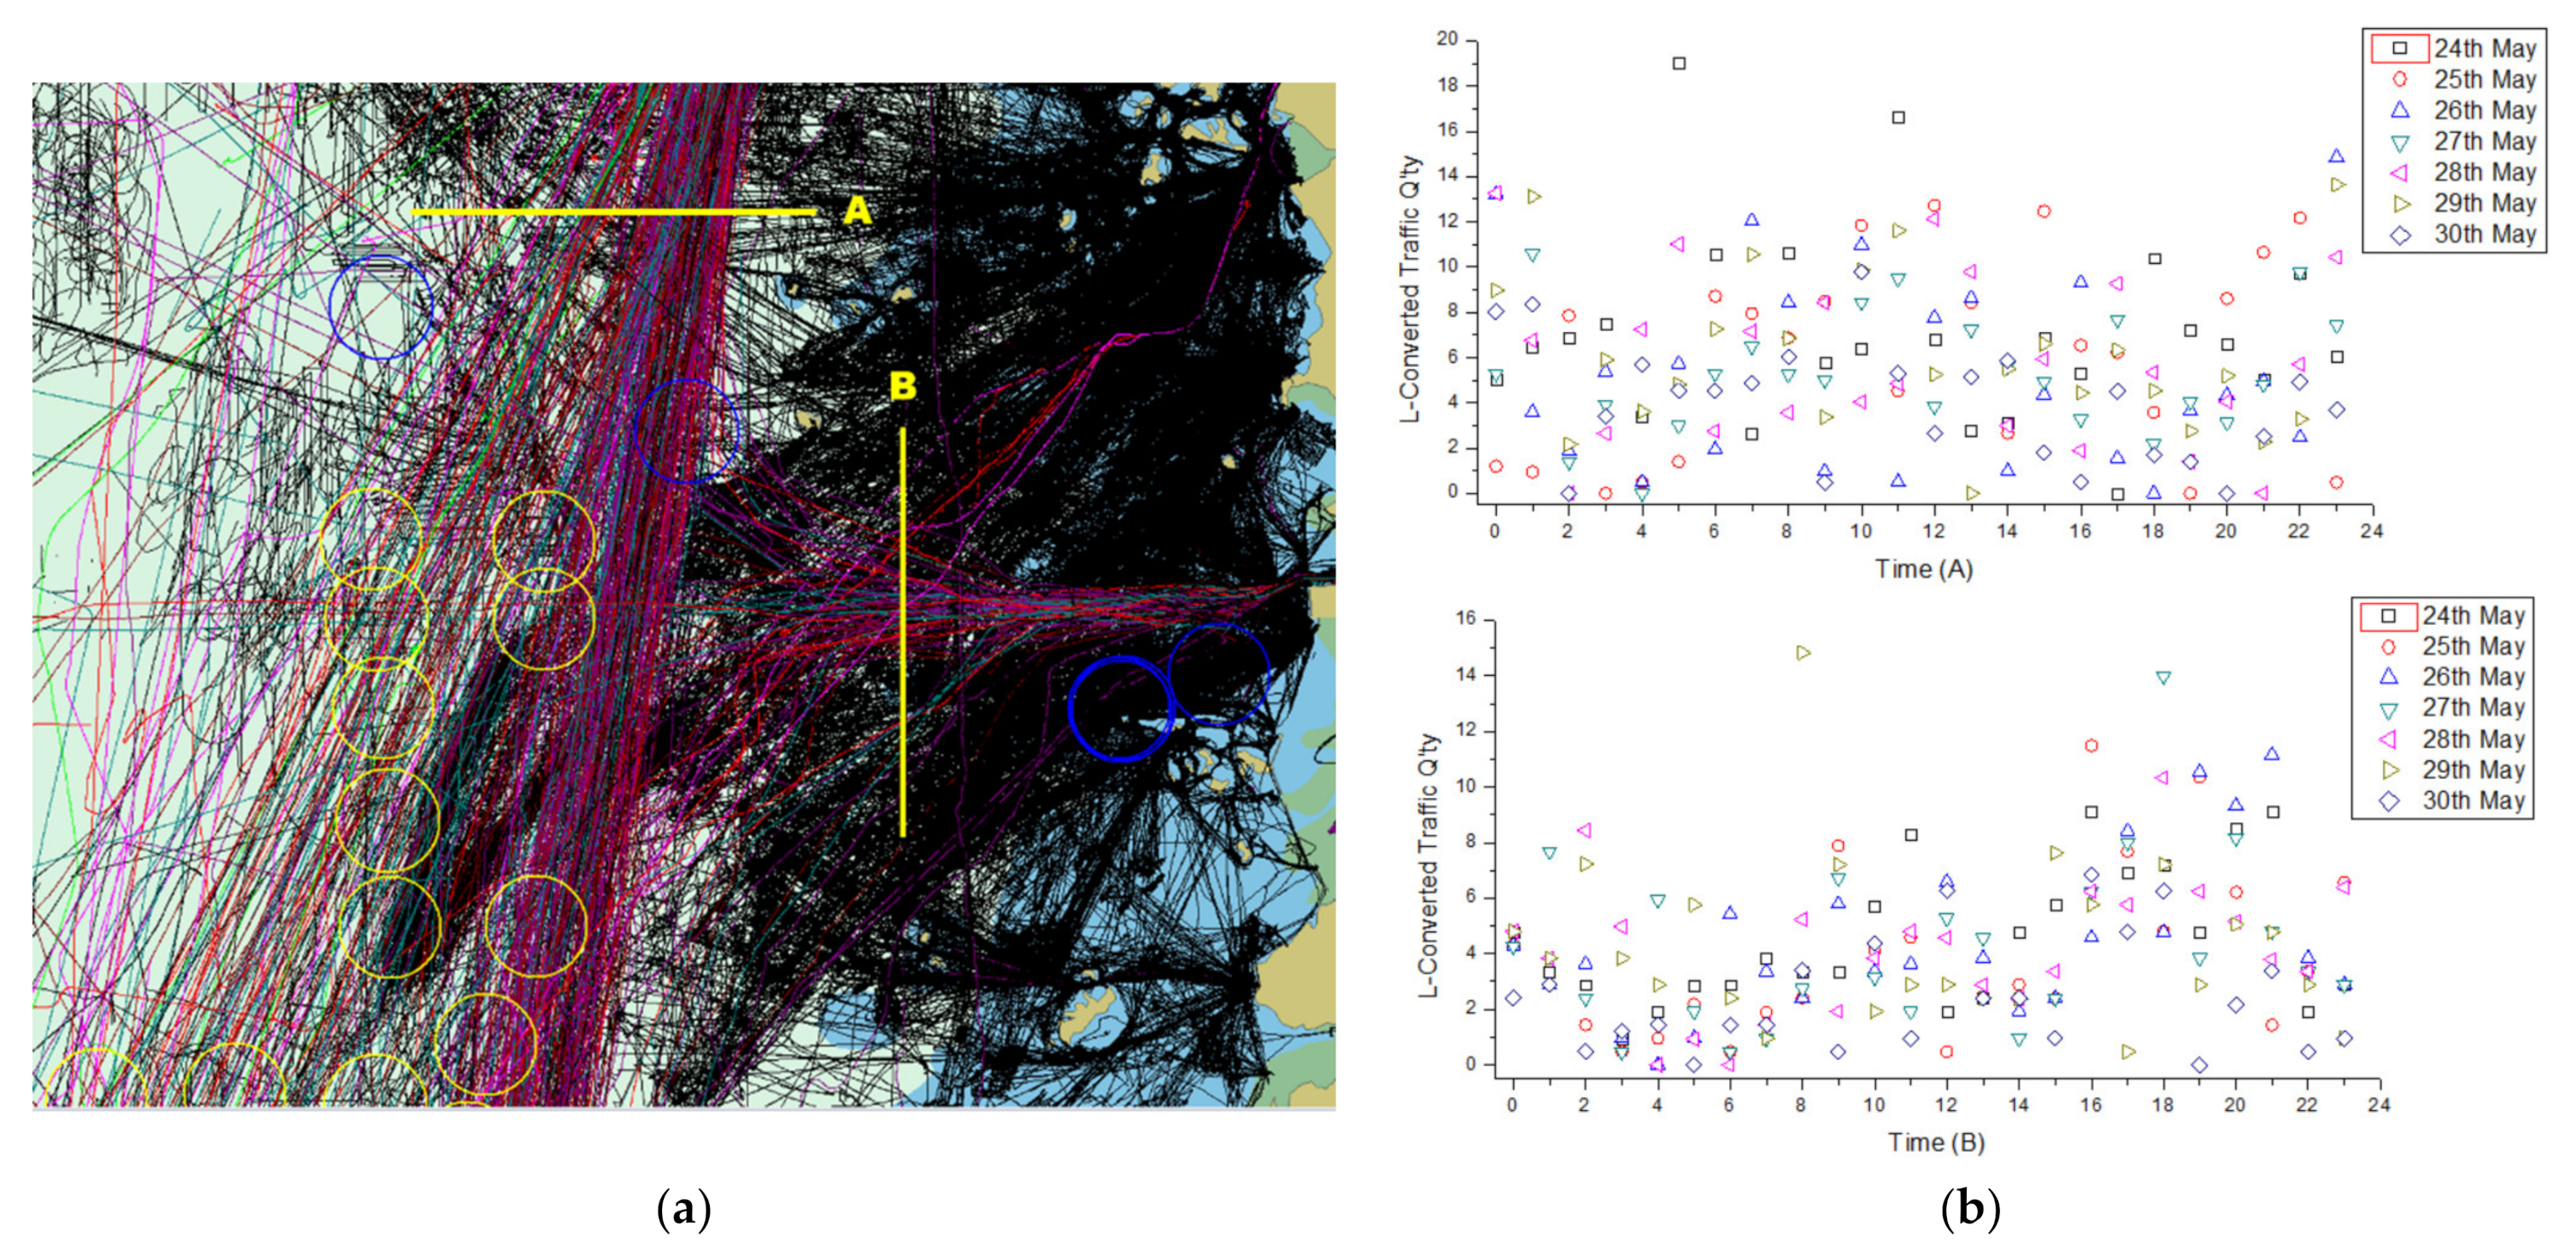
Figure 4 shows the traffic flow of the target sea area for 7 days from 24 May 2020 to 30 May 2020.
Table A1 of
Appendix A provides detailed traffic analysis data and L-converted traffic volume of
Figure 4.
The black flow represents the flow of vessels less than 50 m in long and includes those in the area with a low water depth. The vessel trajectories that form a regular flow are north–south trajectories and east–west trajectories, and the traffic volume was analyzed by dividing them into A and B as shown in
Figure 4. The largest transit vessel in the target waters is a container vessel with a length of 339 m and a width of 46 m. The total number of vessels passing through A Gate in the north–south direction is 790, with an average of 113 ships per day and 5 ships per hour. The total number of ships passing at B Gate in the east–west direction is 1206, with an average of 172 ships per day and 7 ships per hour. Numerically, there are many vessels passing through the B Gate, but most are small vessels such as fishing boats. In this study, considering the fact that the characteristics of passing vessels are different for each sea area, the concept of L-converted scales rather than simple vessel scales was introduced [
28]. Considering that small ships and large ships represent the same traffic volume when measuring maritime traffic will not lead to an accurate traffic volume analysis. Even for a single vessel, the size of the sea area occupied by different types of vessels will differ, so the degree of risk to the surrounding traffic will be different. The L-converted traffic volume is a quantitative measure of the relationship that takes into consideration the size of ships. For the L-converted traffic volume, each L-conversion factor is calculated based on the length of the vessel, and the L-conversion factor is calculated for each vessel length range when the standard ship converted to 1. Here, the standard ship length is 82 m. When an A Gate-passing vessel and B Gate-passing vessel are converted into L-converted traffic, the maximum for Gate A is about 20 ships per hour and the maximum for Gate B is about 15 ships per hour, as shown in
Figure 4b.
3.2. Vessel Traffic Pattern Analysis
In this study, vessel traffic patterns were analyzed based on the maritime traffic status in the target sea area. A method for identifying and classifying vessel navigation patterns that involved learning a vessel’s trajectory pattern and clustering the accumulated trajectory data was used. However, this method can be applied to ships with a certain pattern, and it is difficult to derive valid results for ships that do not maintain a constant pattern, particularly for small ships such as fishing boats. Since small ships are rarely restricted by water depth when navigating to reach their destination and do not set a specific change point and angle when establishing a voyage plan, the same voyage route is not maintained even if they travel to the same destination and will change depending on the environment [
29]. Therefore, in this study, pattern analysis using machine learning was performed on ships with patterns of 50 m or longer. The model used for the trajectory pattern learning is shown in
Figure 5.
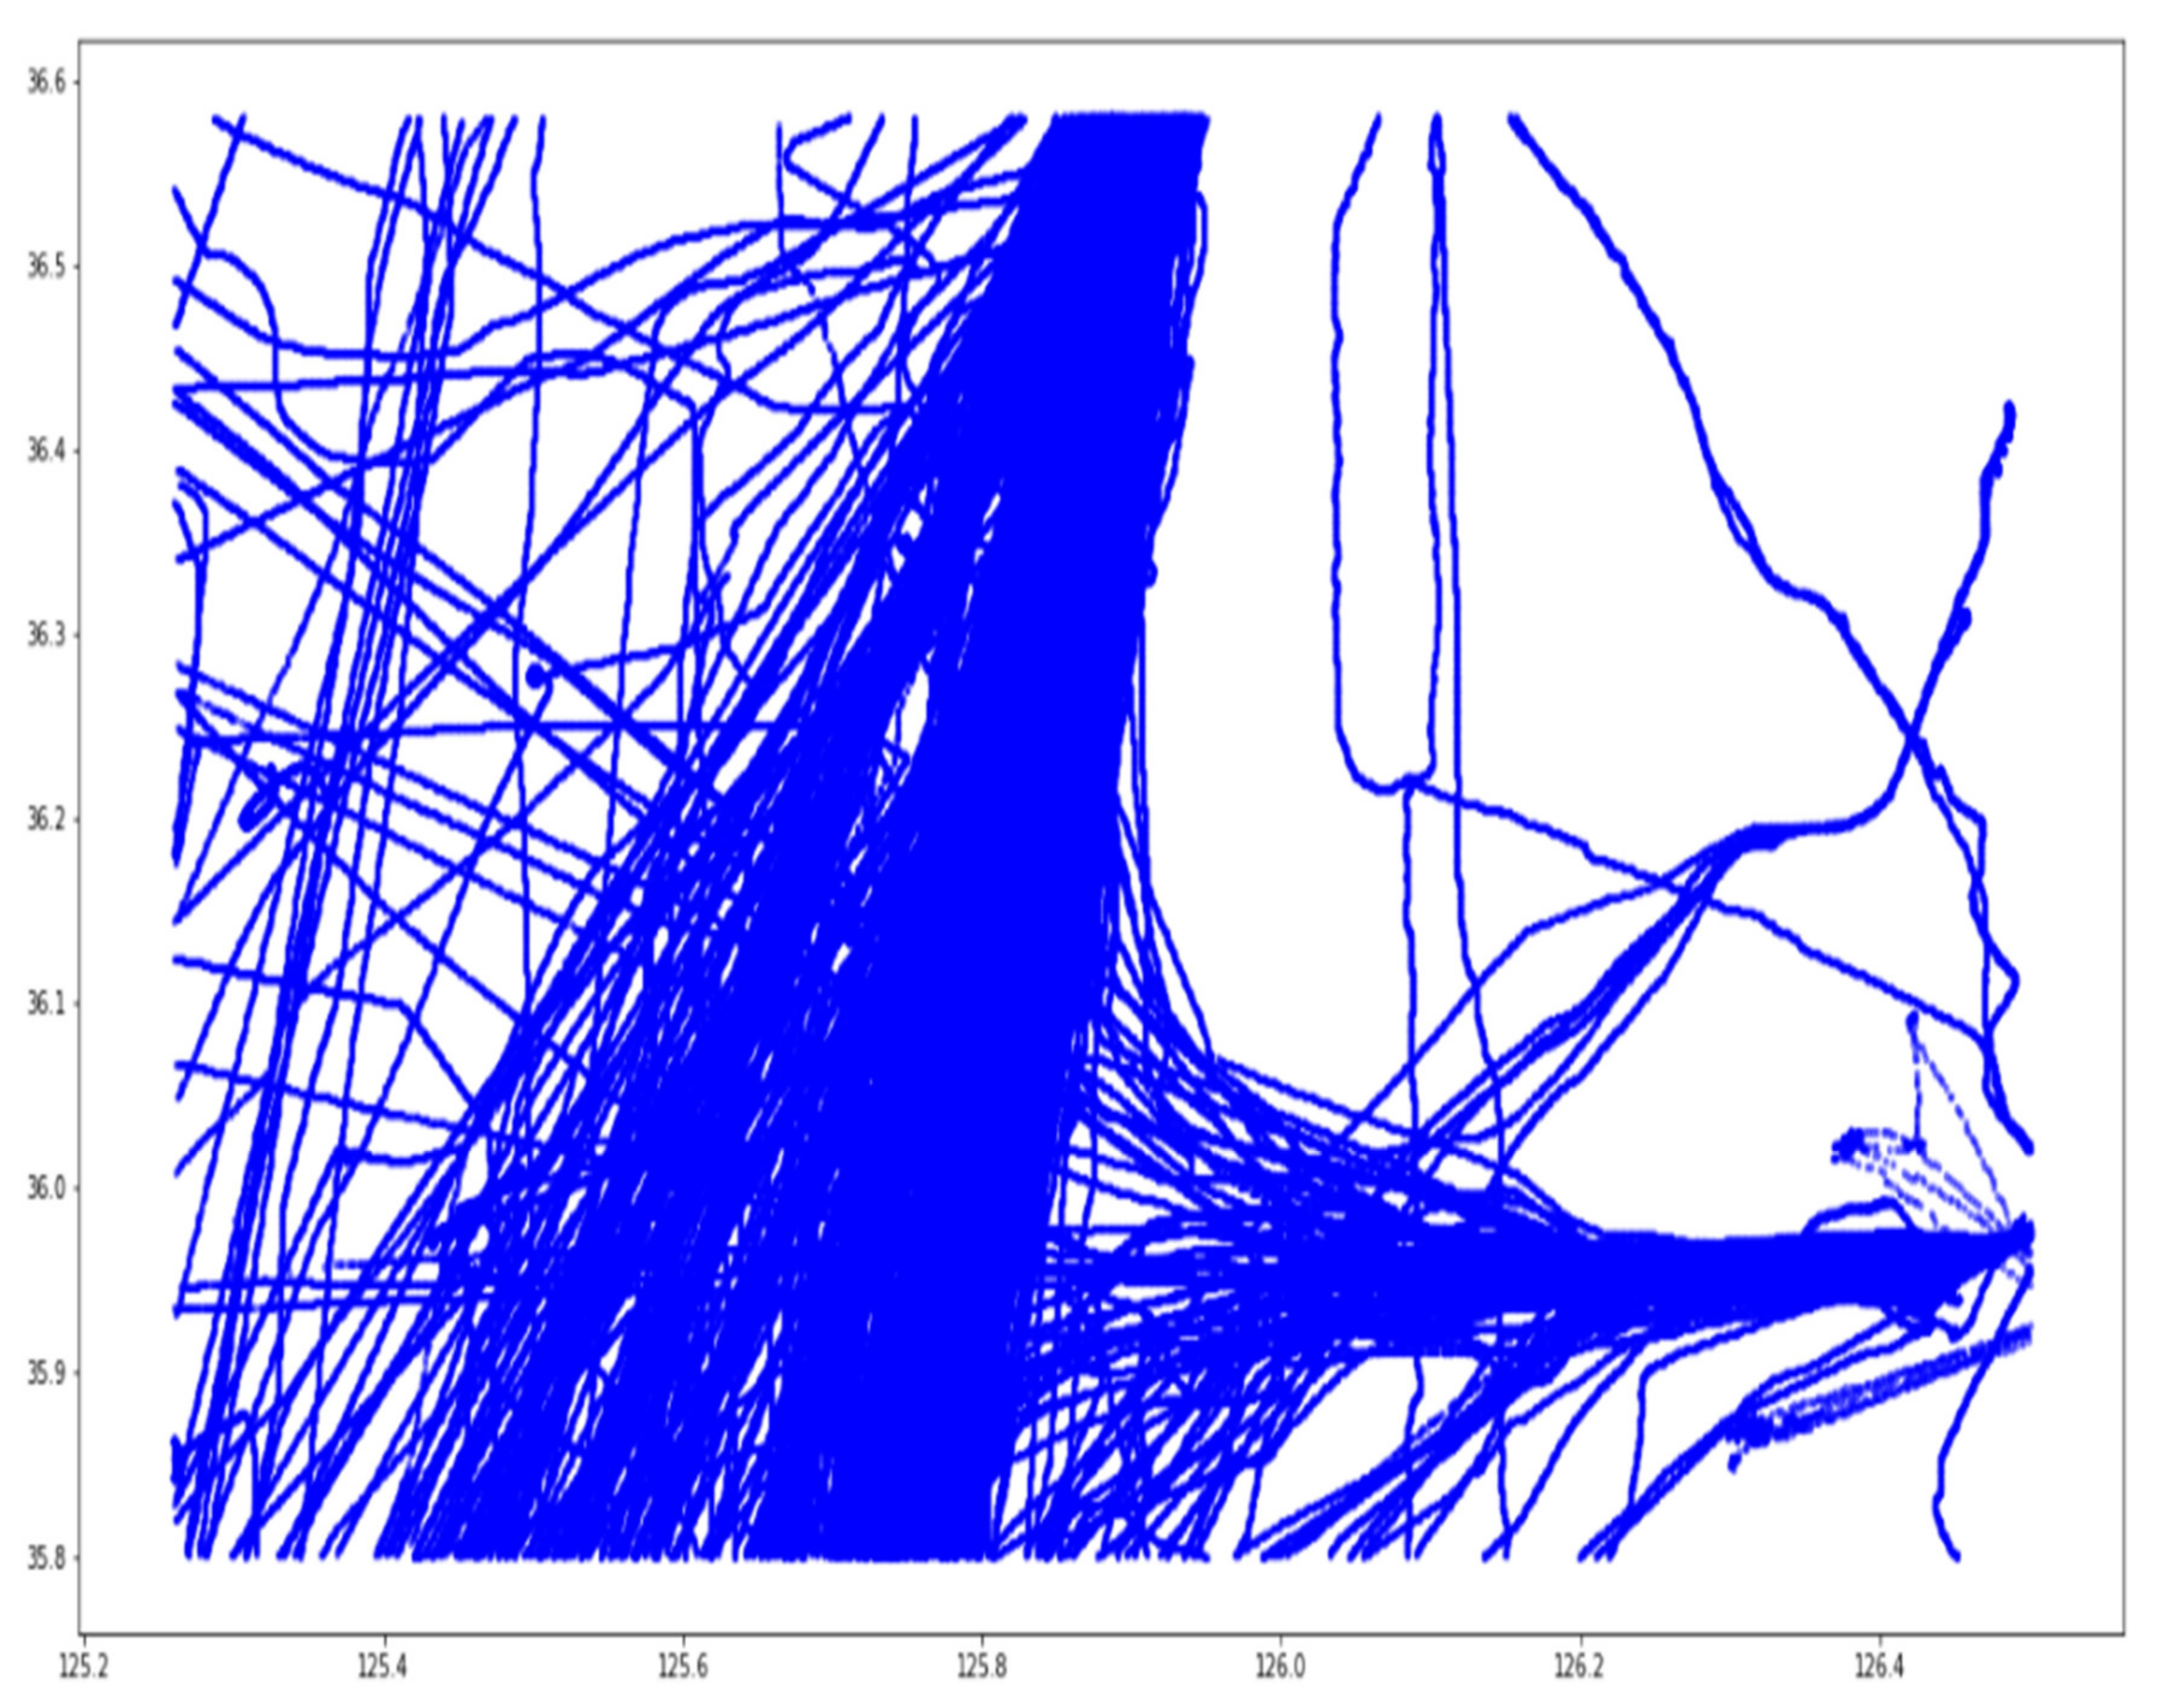
The first step in the ship navigation pattern clustering process is the extraction of learning data. In this step, AIS data were extracted for seven days and used as target data. Since data are received at random, five points of data were grouped into one group according to the order of data reception. As shown in Equations (3) and (4) below, the three pieces of information of latitude, longitude, and course in the order of time were considered as one set, and each set of 5 data points was used to generate data with 15 dimensions. The extracted AIS data are shown in
Figure 6.
where:
| La | Latitude; |
| Lo | Longitude; |
| C | Course over ground. |
After that, data scaling and clustering were performed for each point of trajectory data, which showed similar traffic patterns. For clustering, the K-Means algorithm was used. The K-Means algorithm is an algorithm that groups given data into
clusters and operates in a way that minimizes the dispersion of the distances between each cluster. The K-Means algorithm is a kind of machine learning process based on unsupervised learning and is also used to label data that have not been previously labeled [
30,
31].
Given a set of
-dimensional data observations,
, the K-Means algorithm aims to maximize cohesion between the observations in each set,
by partitioning the
data set of
data observations. Where
is the center of the
cluster and
is a set of points belonging to the cluster, the overall variance is calculated as follows in Equation (5).
After clustering, classification by state is performed using the kNN algorithm. The K-Nearest Neighbor (KNN) algorithm operates by identifying
nearest sample data from the training data set and including the untrained sample data in the most frequent group. The term kNN is a name given in the sense of using the
nearest data, and the kNN algorithm is a very intuitive method of classifying by inputting non-learning data to a set of learning data that are classified according to their similarity [
32,
33].
After clustering, the result data are finally evaluated, and the performance is verified.
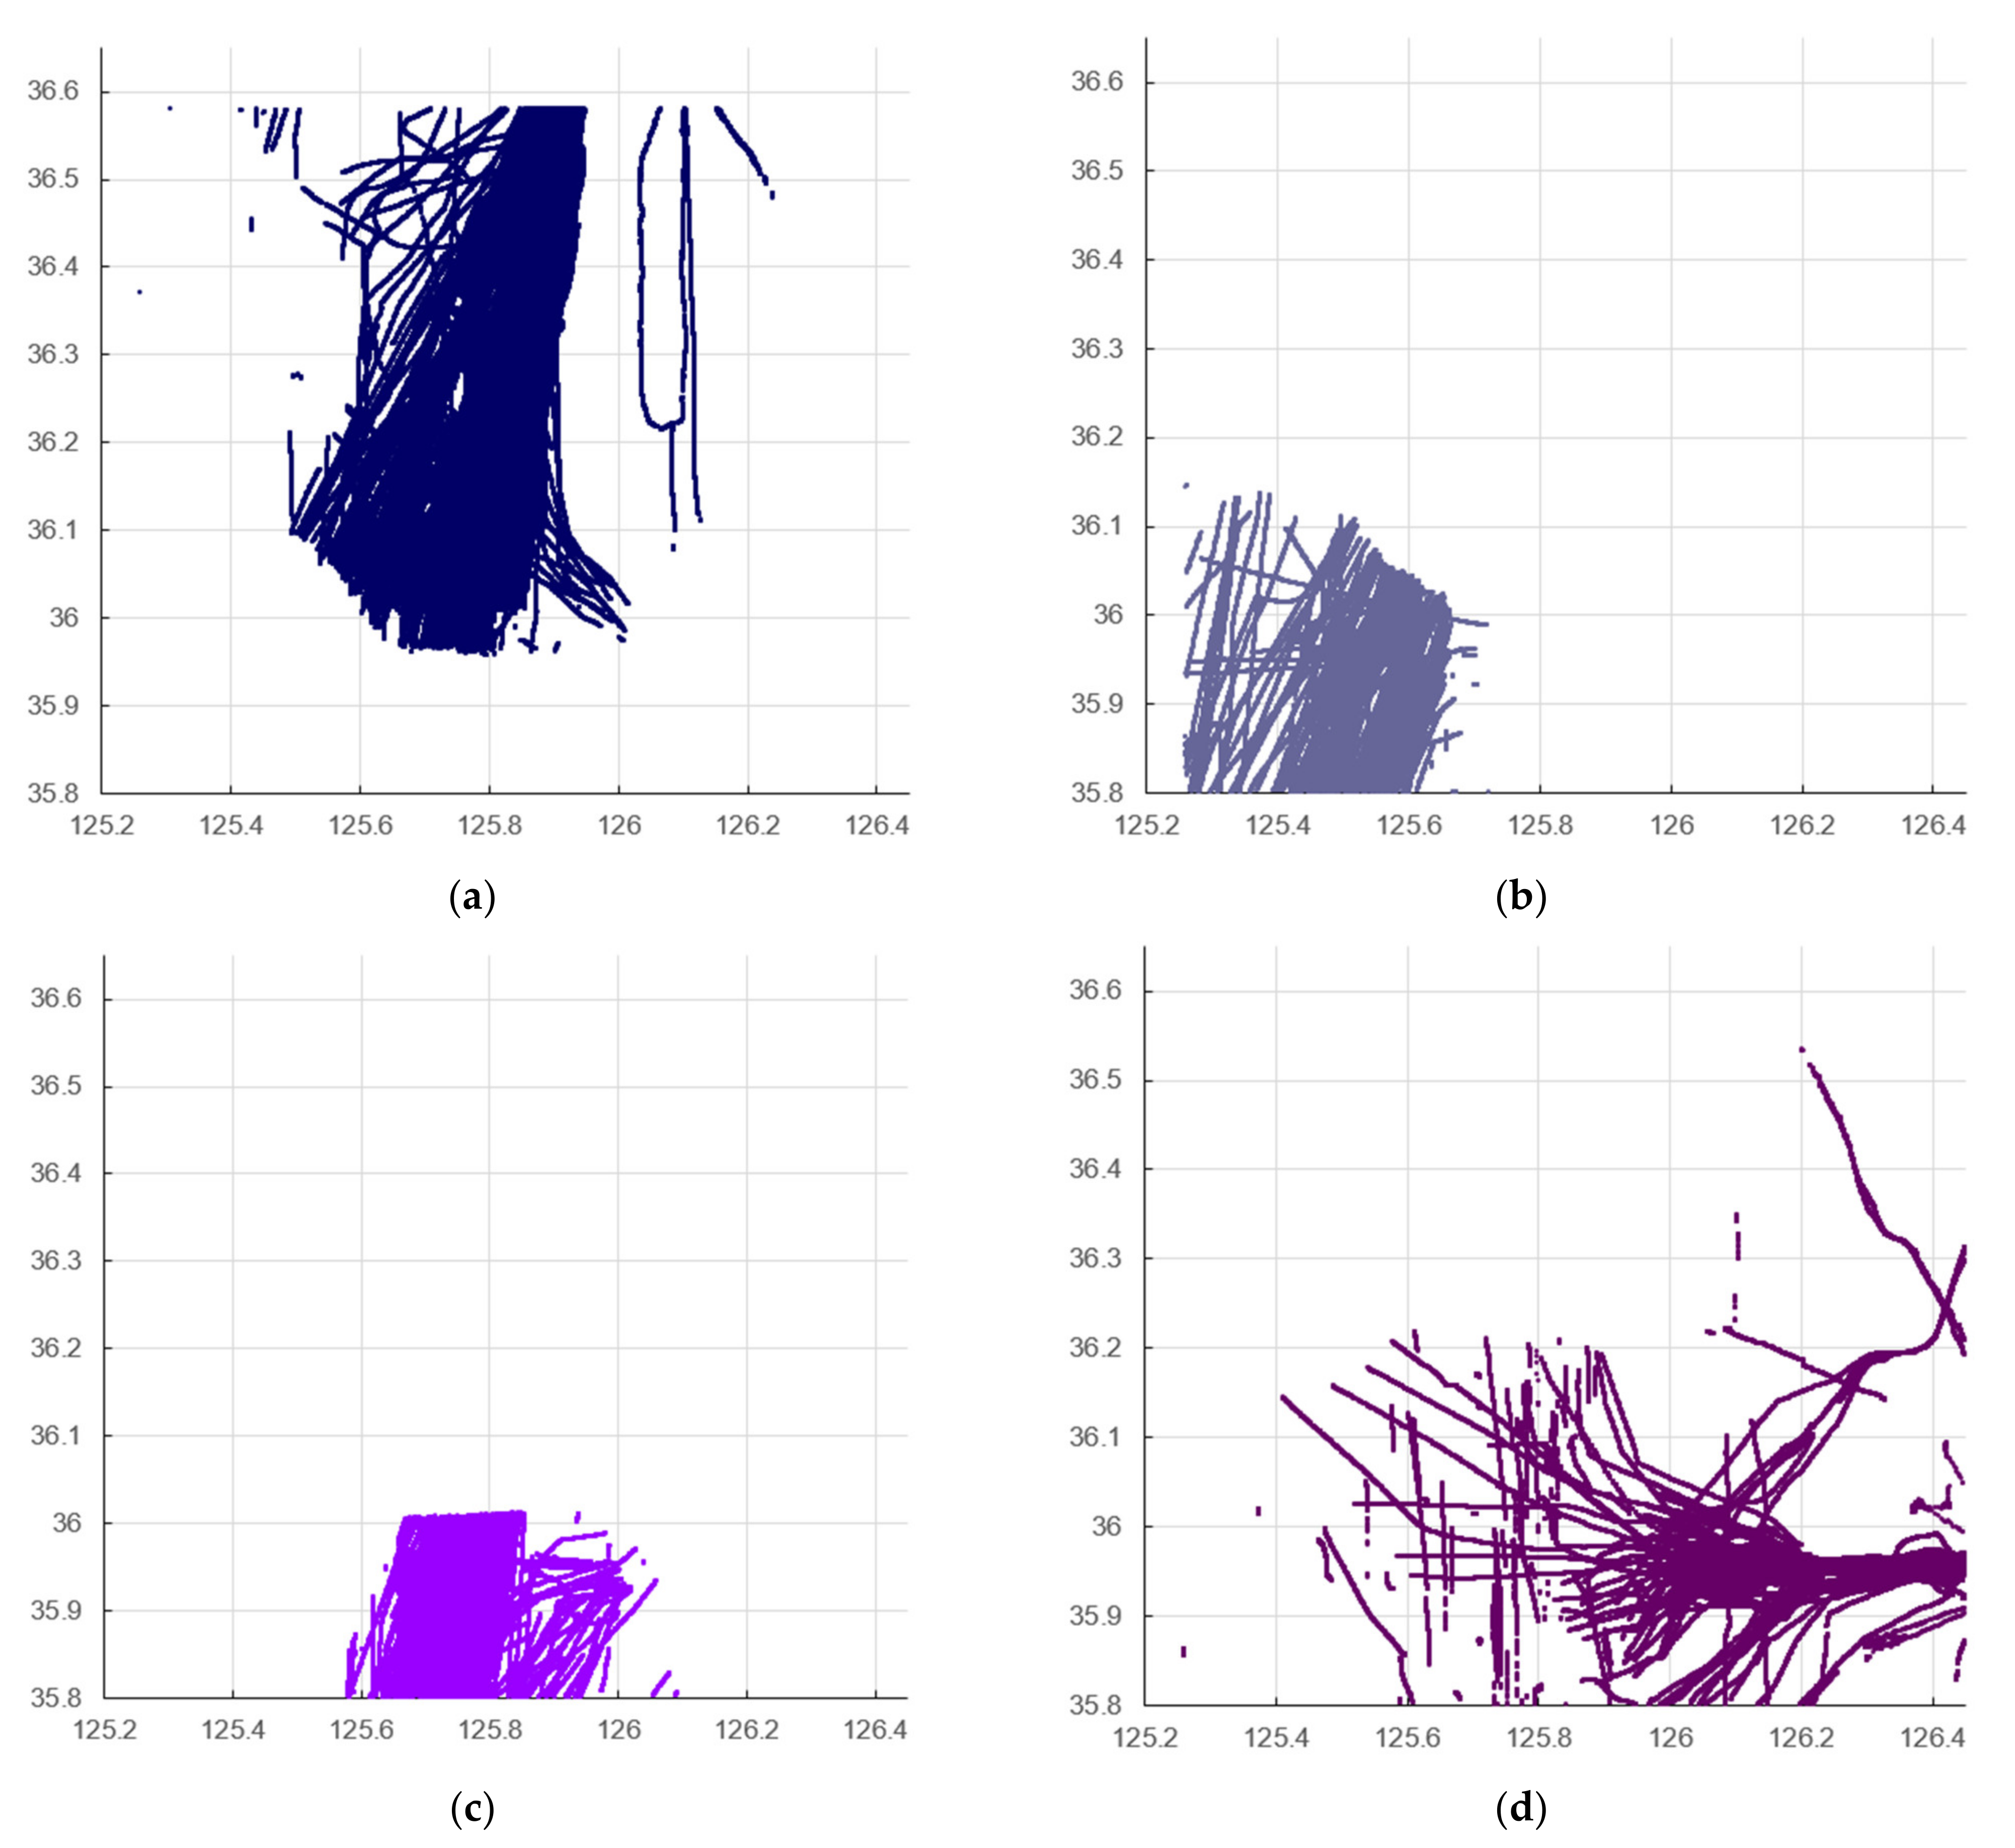
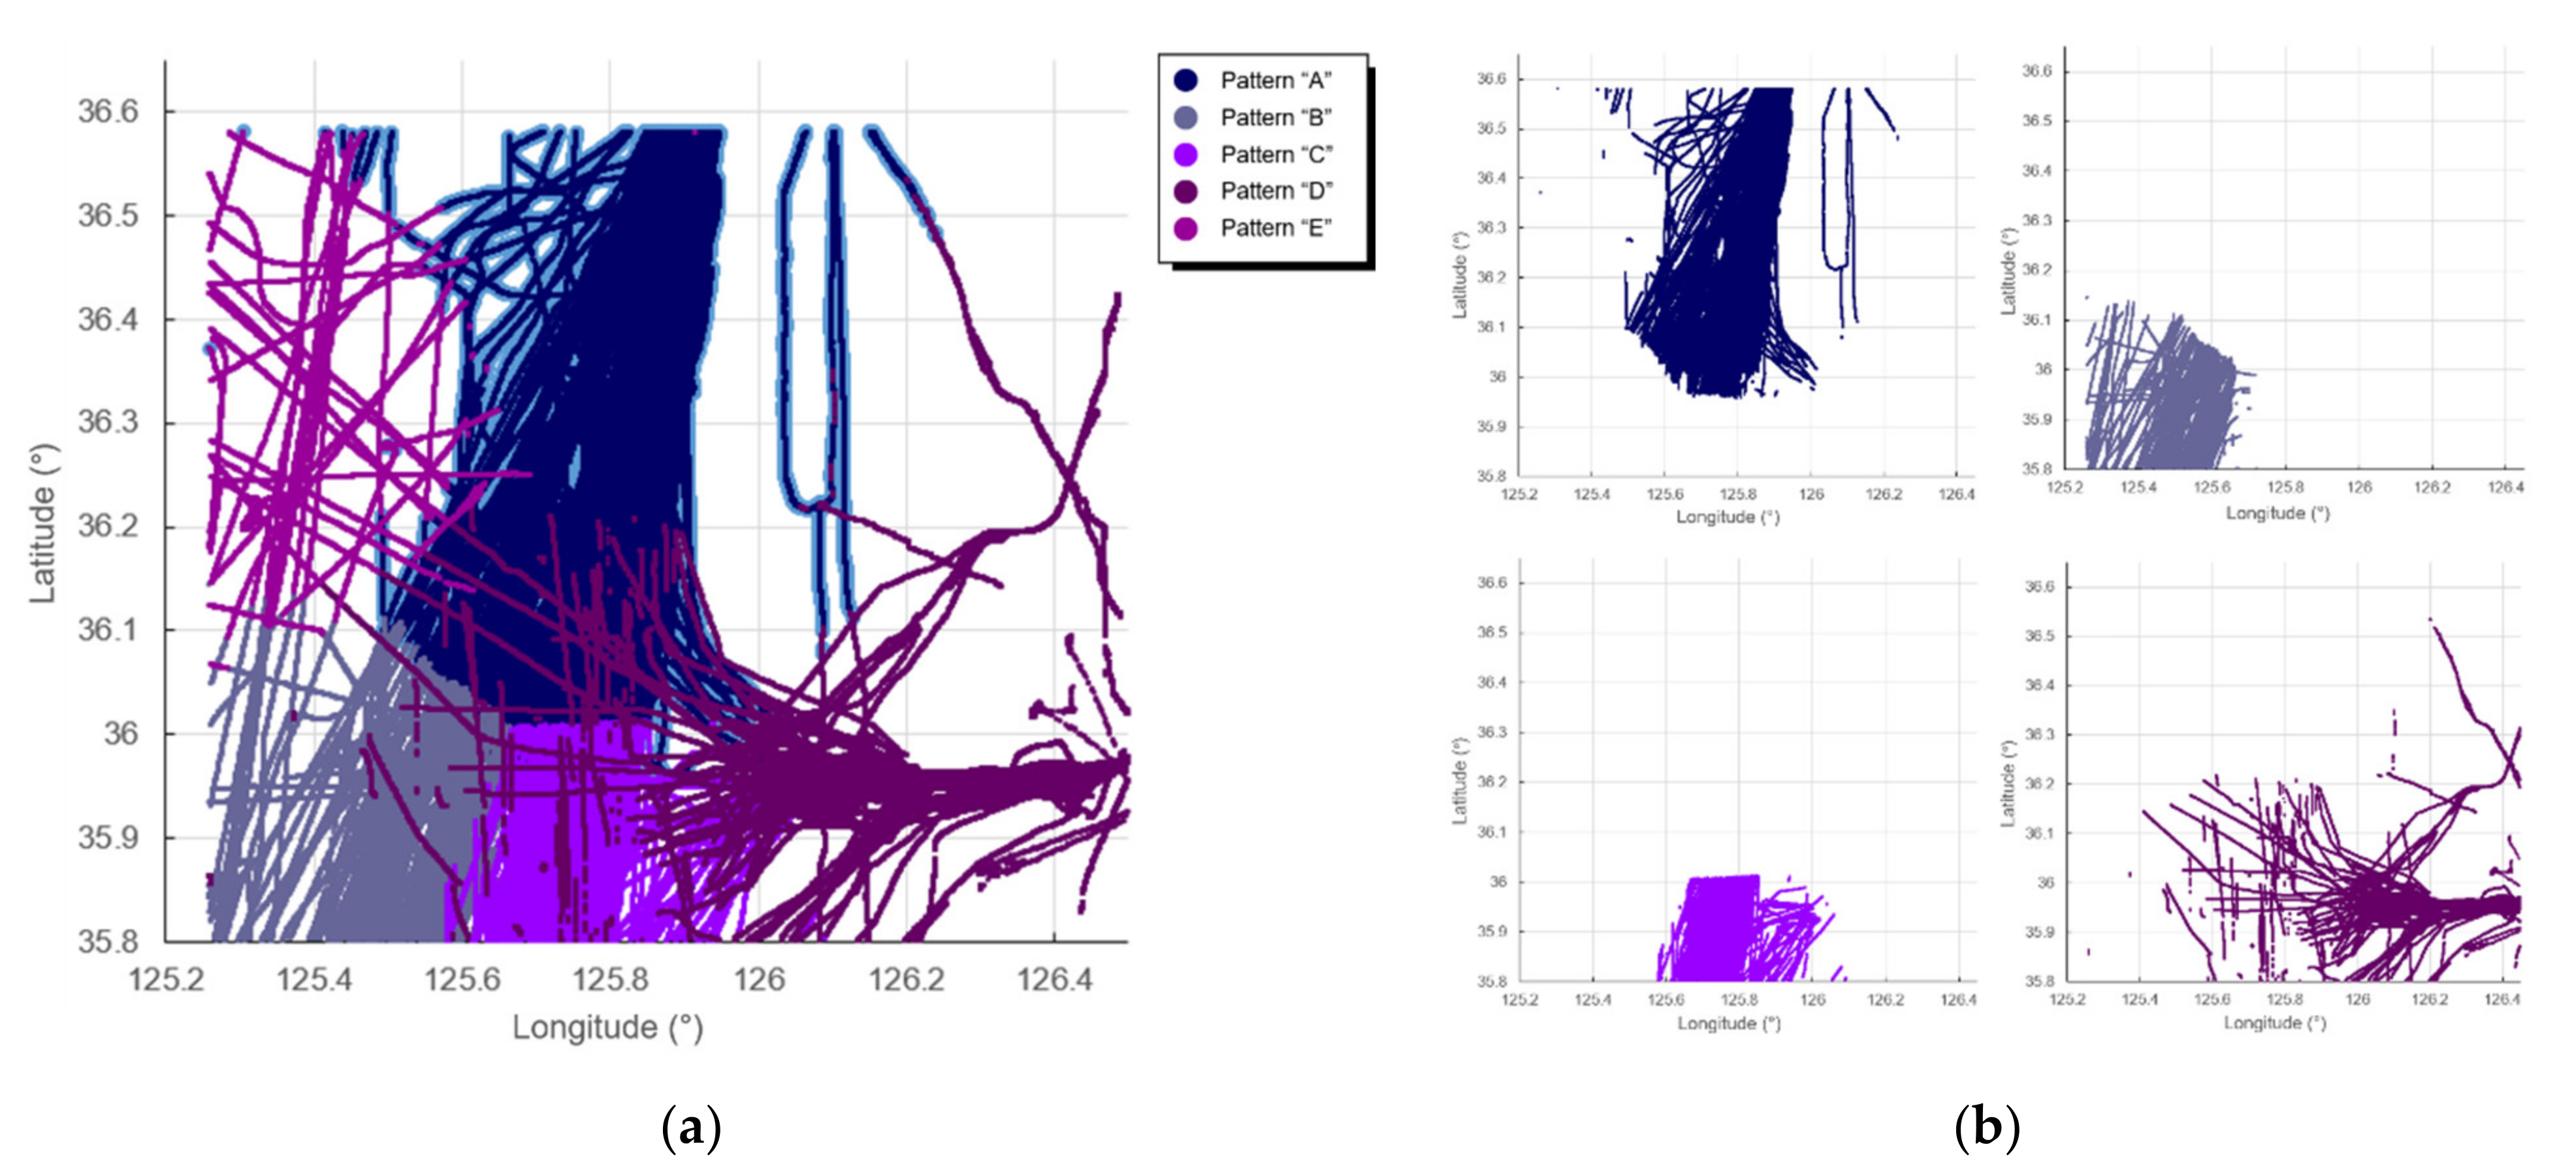
Figure 7 shows the results obtained for completing the clustering of data and plotting each clustering data point. The detailed plot diagrams are shown in
Figure A1 of
Appendix B.
After clustering and classification, each group was given a different color. As a result of clustering, the data were finally classified into five clusters. A is the main flow going north to south, B is the flow leading from the main fairway to Southeast Asia, C is the flow leading from the main fairway to the domestic coastal waterway, and D is the flow of vessels entering and departing from Gun-san Port. Additionally, E is the flow from the Incheon, Pyeong-taek, and Dang-jin ports to the outer sea and was excluded from the analysis carried out in this study. The clustering results of these data are reflected in the fairway width determined using the risk assessment model in
Section 4.
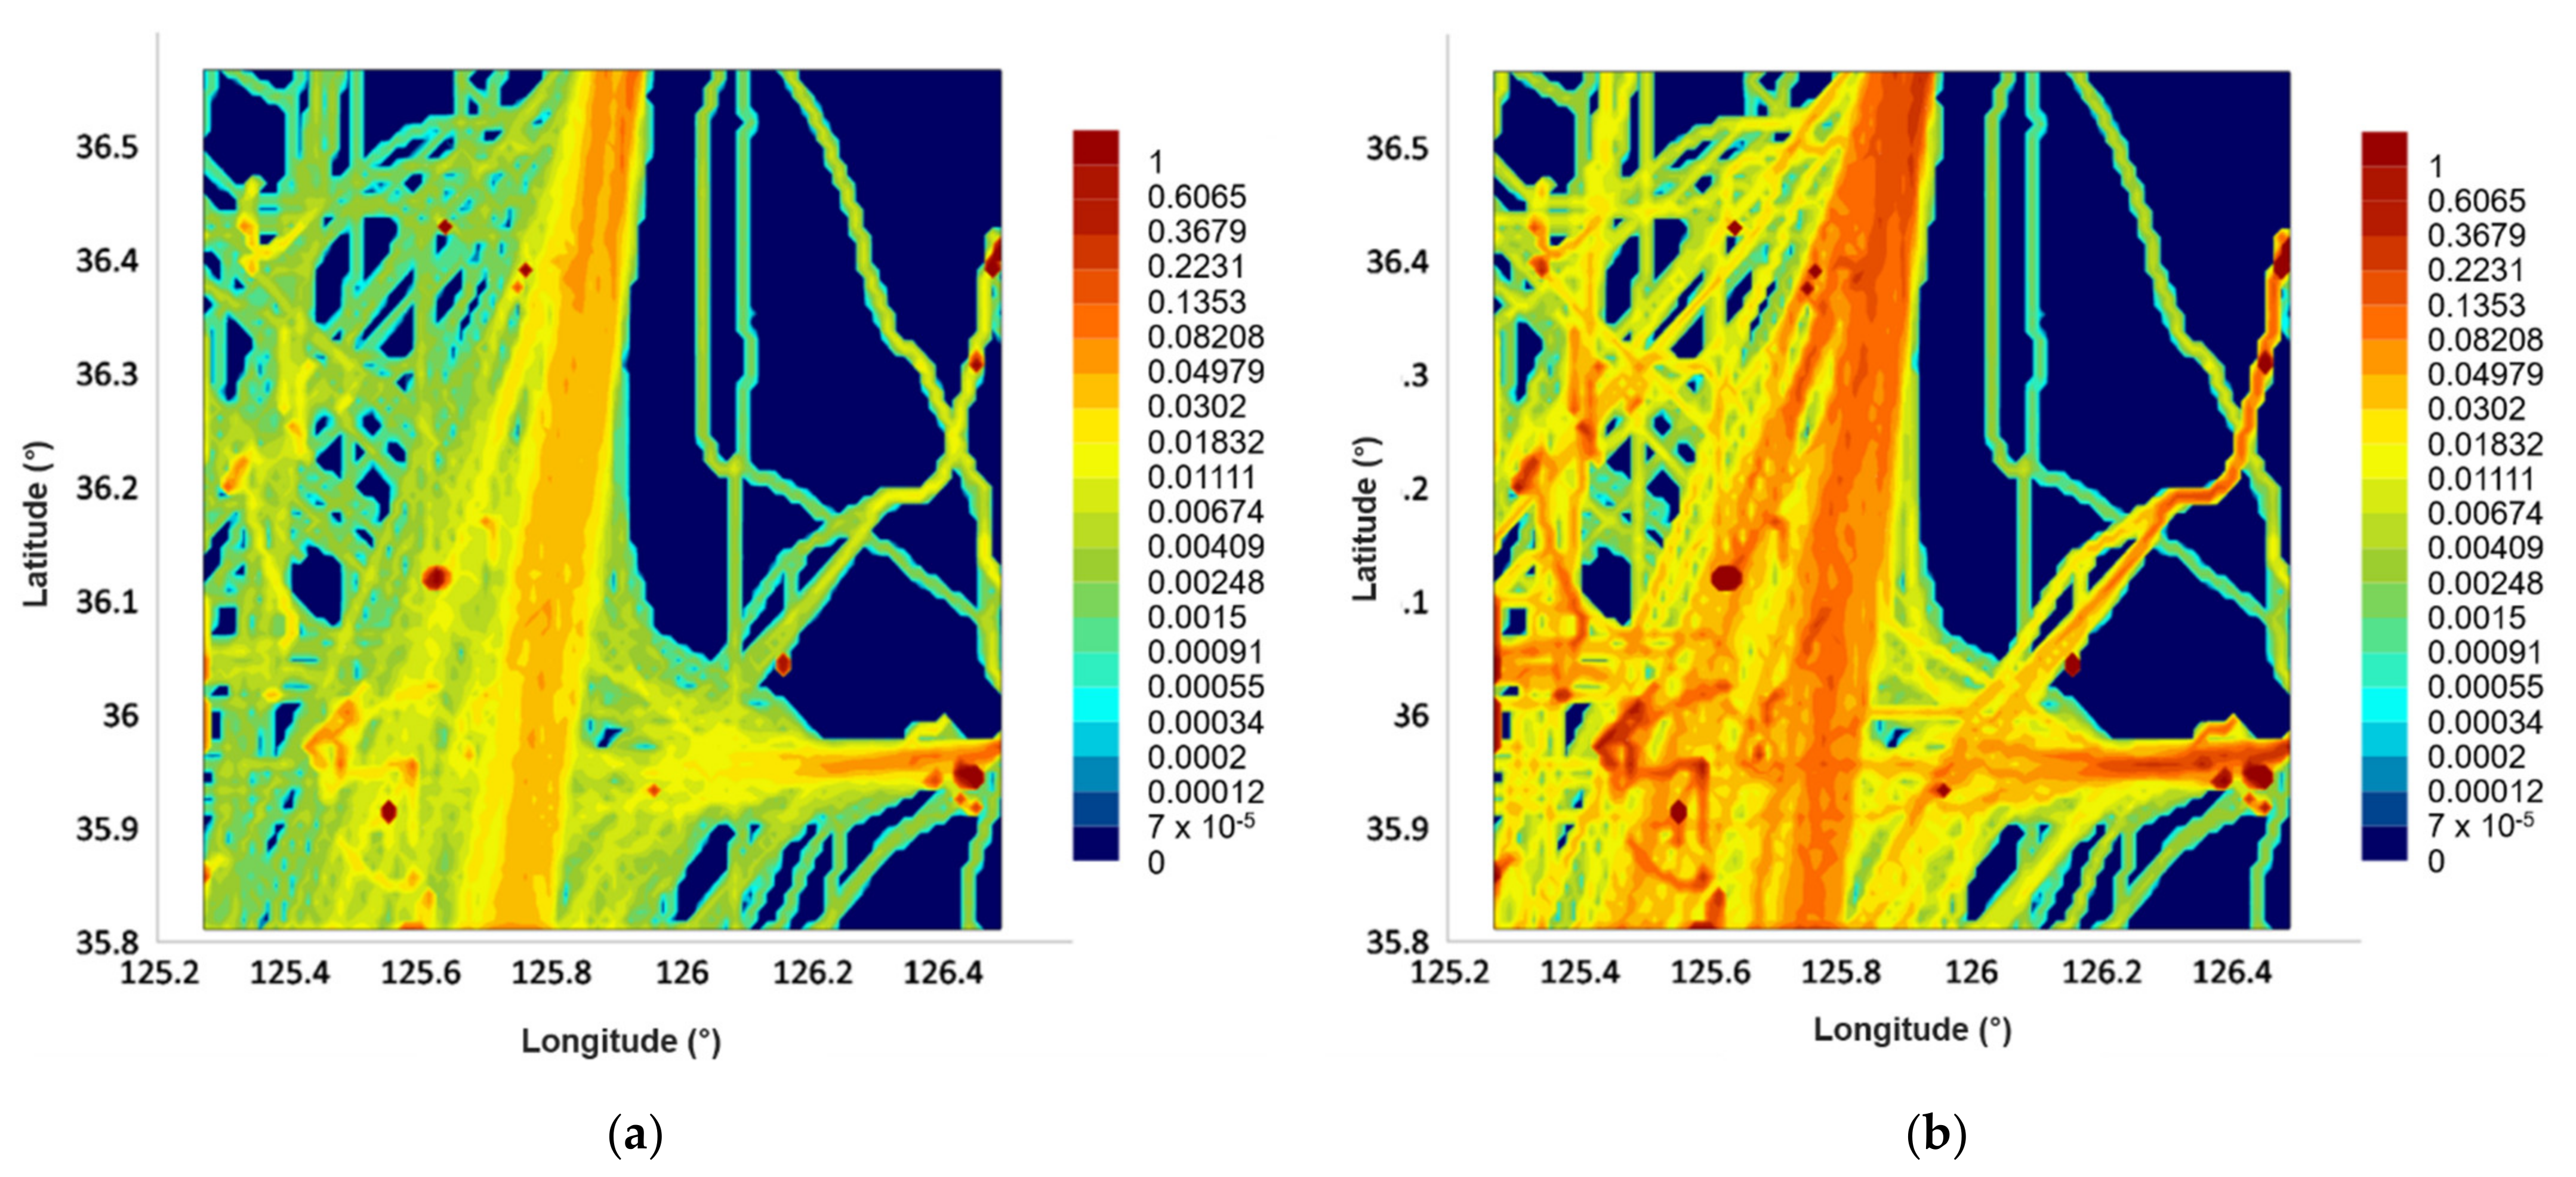
3.3. Density Analysis
According to the trajectories shown in the figure and our maritime traffic analysis, ships with a length of 50 m or more occupy a wide area near Gun-san Port and passing in north–south and east–west directions. It can be seen that the width of the occupied sea area is at least 6 km to 20 km or more, and the fairway is spread widely. In terms of efficiency, it is not practical to design a route limited only to the area it occupies; even if the sea area is occupied, the low-density sea area can be excluded from the priority range of the traffic route.
In this study, a density analysis was carried out in two ways. The first involved analyzing the maritime traffic density (
) by calculating the fairway frequency of vessels within the gridded sector per unit of time (1 s), as shown in Equation (6) below.
where:
| The total number of ships in the grid cell per second; |
| Number of ships; |
| Analysis period. |
The second is a method for analyzing the density (
) of marine traffic in consideration of the occupied area (
) of a standard vessel (a vessel with a total length of 82 m, which is the average length of ships entering Korean ports in Korea in 2003) compared to the occupied area of passing vessels, as shown in Equation (7) below [
34,
35].
where:
| The number of each vessel in the gridded sector per second; |
| Length of each vessel; |
| Length of standard vessel. |
The density analysis results for the target sea area are shown in
Figure 8. In (a), which calculates the frequency of fairway within the gridded sector per unit time (1 s), the high-density section was found to be about 5 to 6 km. On the other hand, in (b), where the density was calculated in consideration of the area occupied by passing vessels, it was determined that the section with a high density appeared as wide as 10 km or more.
4. Designing of the Appropriate Fairway Width
In this chapter, based on the Environmental Stress Model (ES model), which is a risk assessment model, we designed an appropriate fairway width for the target sea for the traffic flow of vessels. In
Section 2, general design standards for ports and approach channels and the width of TSS established in coastal waters were reviewed. As a result, it was determined that the width of the general passageway that can be established in the sea area near Gun-san Port is about 1 km to 10 km. As a result of the density analysis, it was found that the section with a high density ranged from a minimum of 5–6 km to a maximum of 10 km or more. Considering the general flow and traffic density, this will be advantageous in terms of economic efficiency of the operation of vessels when a fairway width of 10 km or more is formed in the target sea area. However, since it is necessary to adjust the scope according to the purpose in terms of the commonality and publicness of marine development and use, this chapter reviewed the amount of proper fairway width that must be secured in terms of safety.
4.1. Overview of ES Model
The Environmental Stress Model (ES model) is a model developed to quantitatively evaluate the degree of load applied to the ship operator due to the environment surrounding the ship. Here, the surrounding environment is divided into a traffic topographic environment and a ship navigation environment. The ES model is expressed as a stress value felt by the ship operator according to the time margin for the bearing/distance of obstacles in the range of ±90 degrees and the course/speed of the ship based on the course of the ship. The degree of environmental stress that a ship operator receives is called “Environmental Stress value”. The environmental stress value is composed of “ES value for Land (ESL)”, which is the amount of stress caused by the vessel operating environment, such as terrain or facilities, and “ES value for Ships (ESS)”, which is the amount of stress caused by other ships. The two stress values are collectively referred to as “Aggregation of ES value (ESA)”. ES stretch is classified into 4 levels (0–500, 500–750, 750–900, 900–1000). If the stress value is 750 or more, this is determined to be an acceptable limit, and if it is 900 or more it is determined to be unacceptable. In this study, the ESA value was used to evaluate the risk between ships and the risk caused by operation within a limited route. To calculate the ES value, you must first calculate the risk for the relative distance between ships in relation to the collision (SJ) value [
36,
37,
38].
The calculation method is shown in Equations (8) and (9) for
[
37].
where:
| |
| Risk of obstacles; |
| R | Distance to obstacles; |
| V | Speed of the own ship; |
| Coefficient determined by natural conditions; |
|
|
The calculation method is the same as that in Equations (10) and (11) for
[
37].
where:
|
In case the condition of encounter with the target ship is:
|
|
|
|
| Risk concerning the target ship; |
| Relative distance between own ship and target ships; |
| Relative speed between own ship and target ships; |
| Average length of the own ship and target ships. |
The calculation formula for simultaneous evaluation of ESL and ESS is as follows in Equation (12) [
37].
Table 4 shows the risk felt by ship operators related to ESL and ESS.
4.2. Results of ES Model Simulation
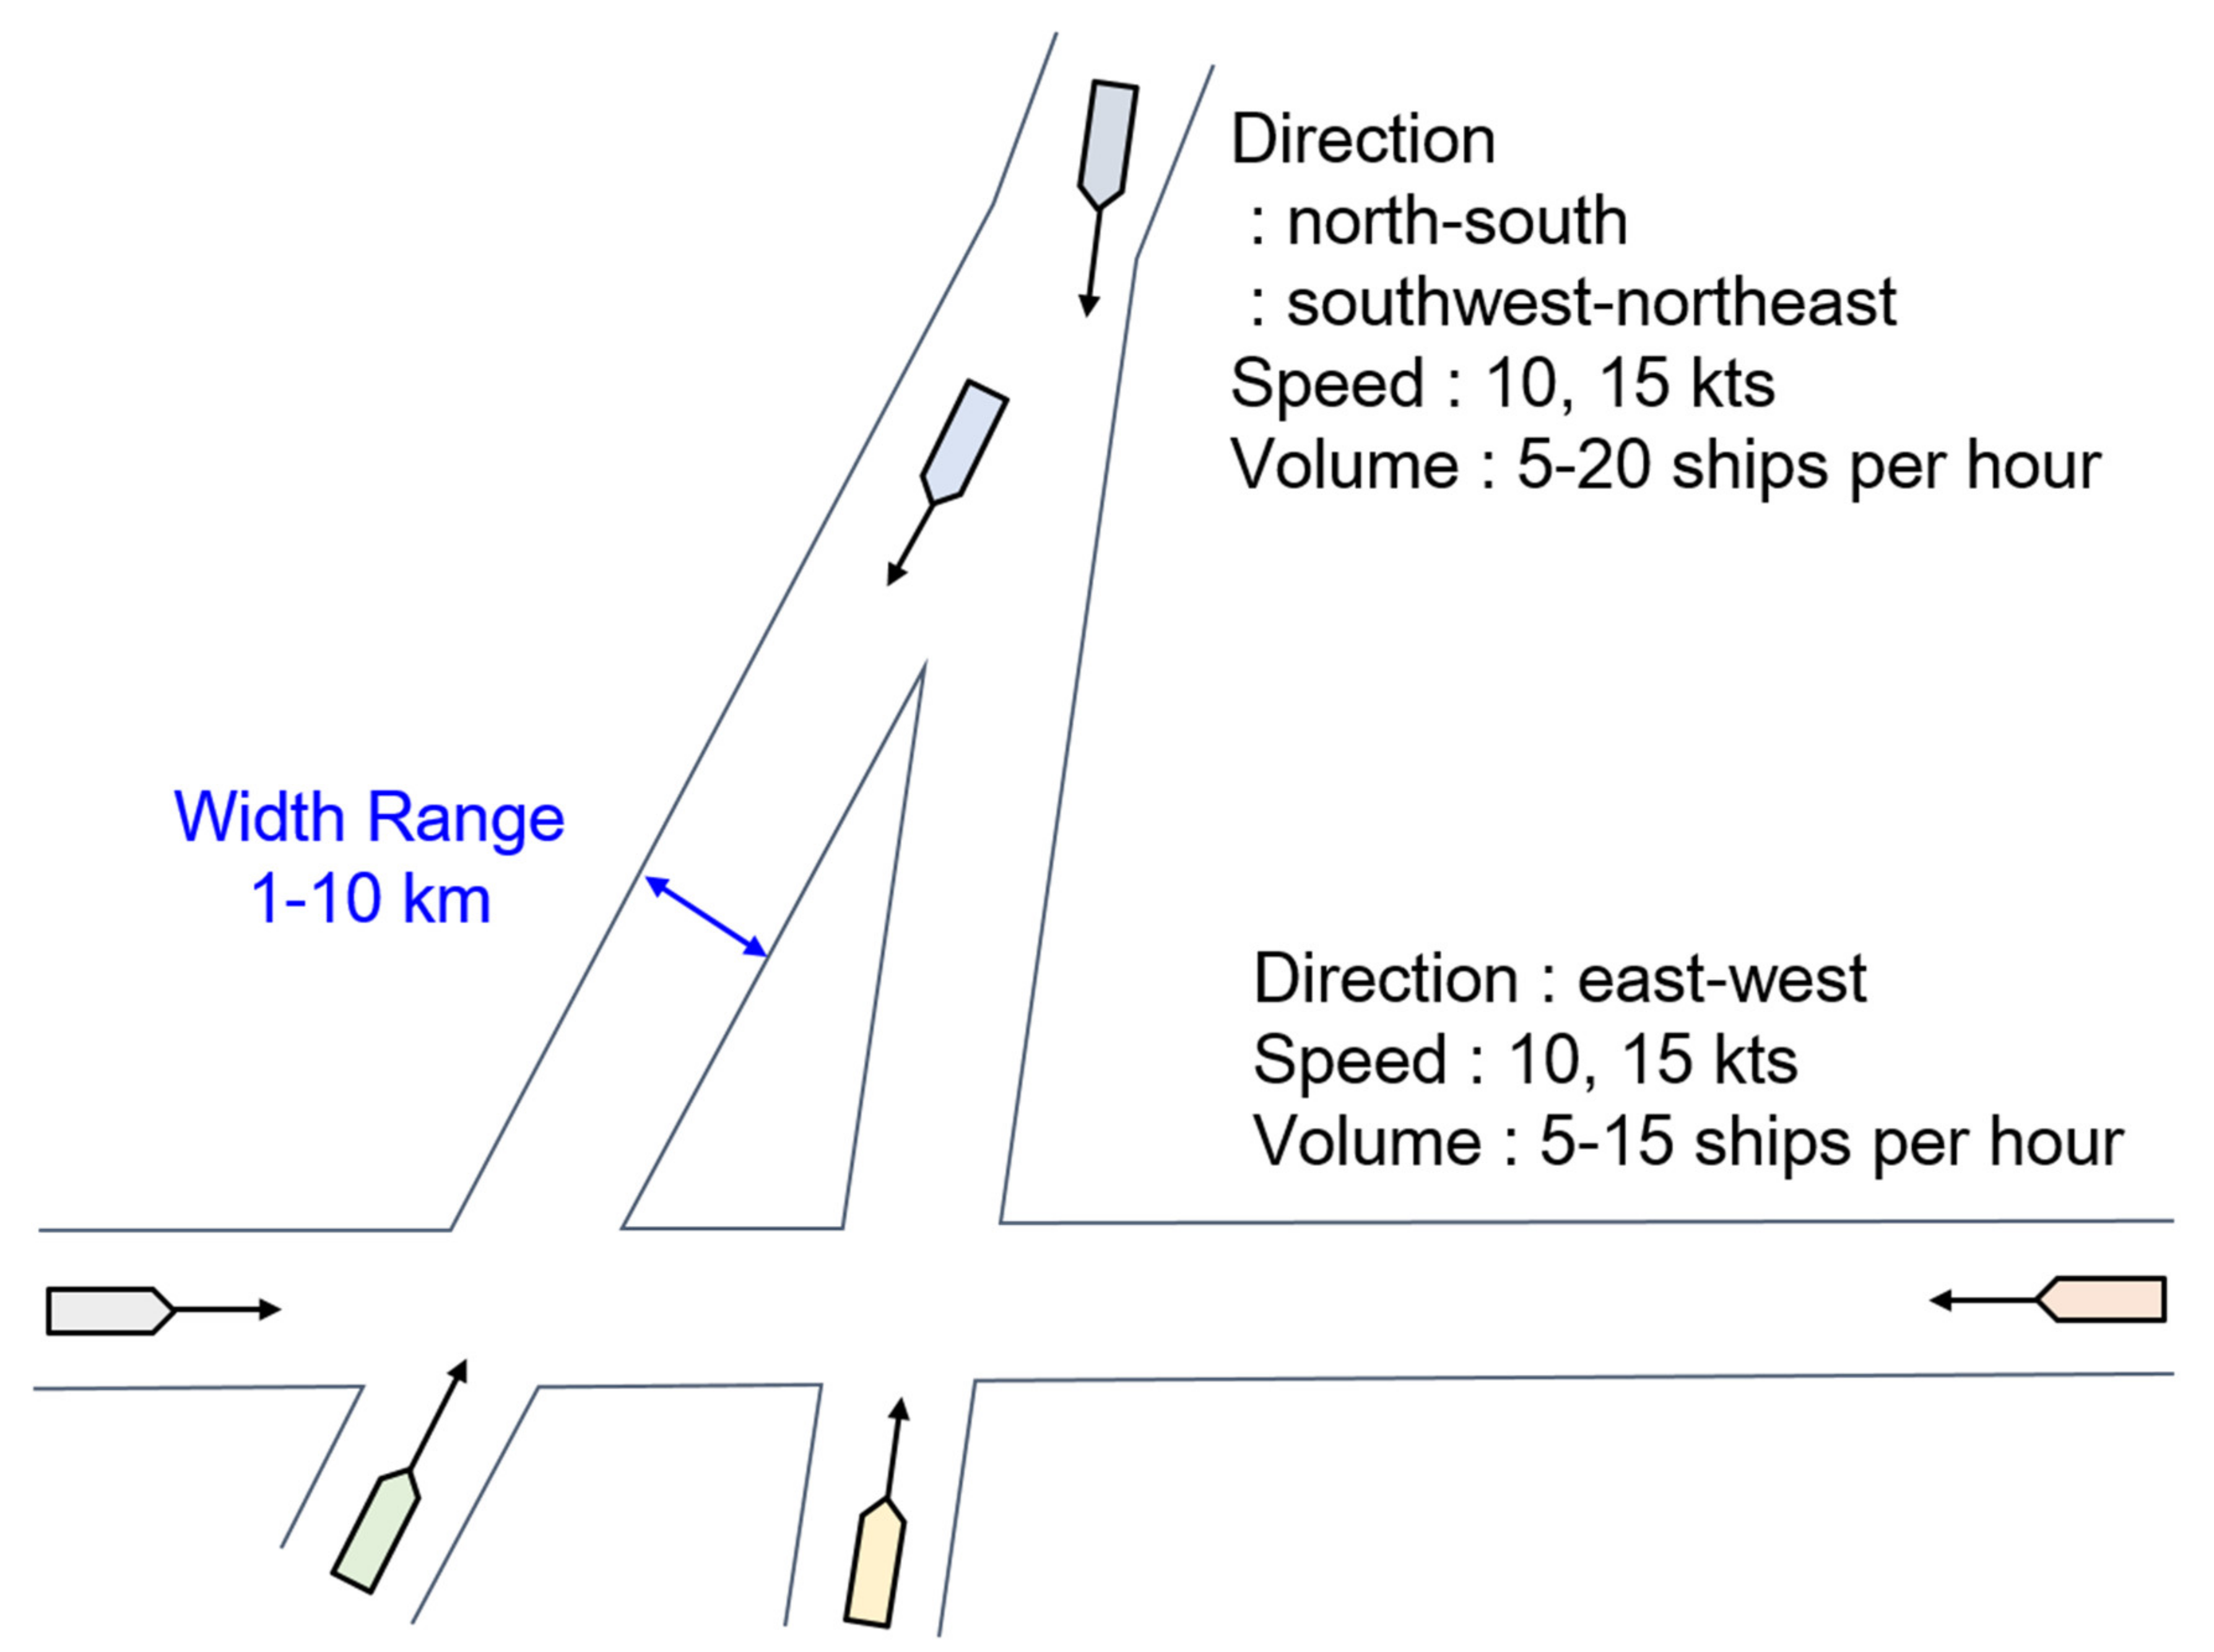
In order to design an appropriate route width, the width of the route that is normally designed was analyzed and scenarios were constructed using various conditions to evaluate the risk according to the change in the vessel’s traffic volume in the route width.
Table 5 shows the details of the parameters set for different scenarios.
In general, simulation evaluation reflects the number of vessels, vessel speed, vessel size, etc., based on the traffic survey results, and the traffic volume is reproduced by setting the time period with the most traffic. In this study, the concept of L-converted traffic was applied to evaluate the degree of risk according to the vessel traffic volume and the set fairway width. A vessel passing through a certain area per unit time follows a Poisson distribution [
39]. In the target area, it was determined that 5–20 ships per hour from gate A and 5–15 ships per hour from gate B.
The maximum fairway width in the approaching waters of the port analyzed above is 18.6 B, and since the width of the largest vessel passing through the target sea is about 46 m, the maximum fairway width in the approaching waters is about 855 m. In addition, the width of a typical TSS established along the coast of Korea is 5600–8500 m. Therefore, in this study the risk was evaluated using the ES model by generating the traffic volume of 5 to 20 ships per hour for each 1, 2, 4, 6, 8, and 10 km fairway width.
- 2.
Evaluation Criteria and Scenario
Using the ES model, a risk assessment was conducted through various fairway width situations and changes in vessel traffic volume. According to Article 15 of the Maritime Safety Act of Korea, when the proportion with an ES value of 750 or higher is 10% or higher in the Maritime Traffic Safety Assessment conducted before the approval of the implementation of the maritime development project, it is judged that safety measures are necessary [
39]. In this study, if the proportion with an ES value of 750 or higher was 10% or more of the total, the situation was judged to be dangerous and was set as a comparative index.
Figure 9 shows the design of the ES model evaluation scenario for 1–10 km fairway widths with the different ship conditions.
- 3.
Analysis of evaluation results
In this chapter, the current traffic flow was reproduced based on the traffic volume in the evaluation target sea area analyzed in
Figure 4 and the traffic flow analyzed in
Figure 7. The L-converted traffic volume for the reference vessel (83 m) was applied to 5, 10, 15, and 20 ships, respectively, and a simulation was performed using a risk assessment model for a 1 km to 10 km width, which is the target of the evaluation.
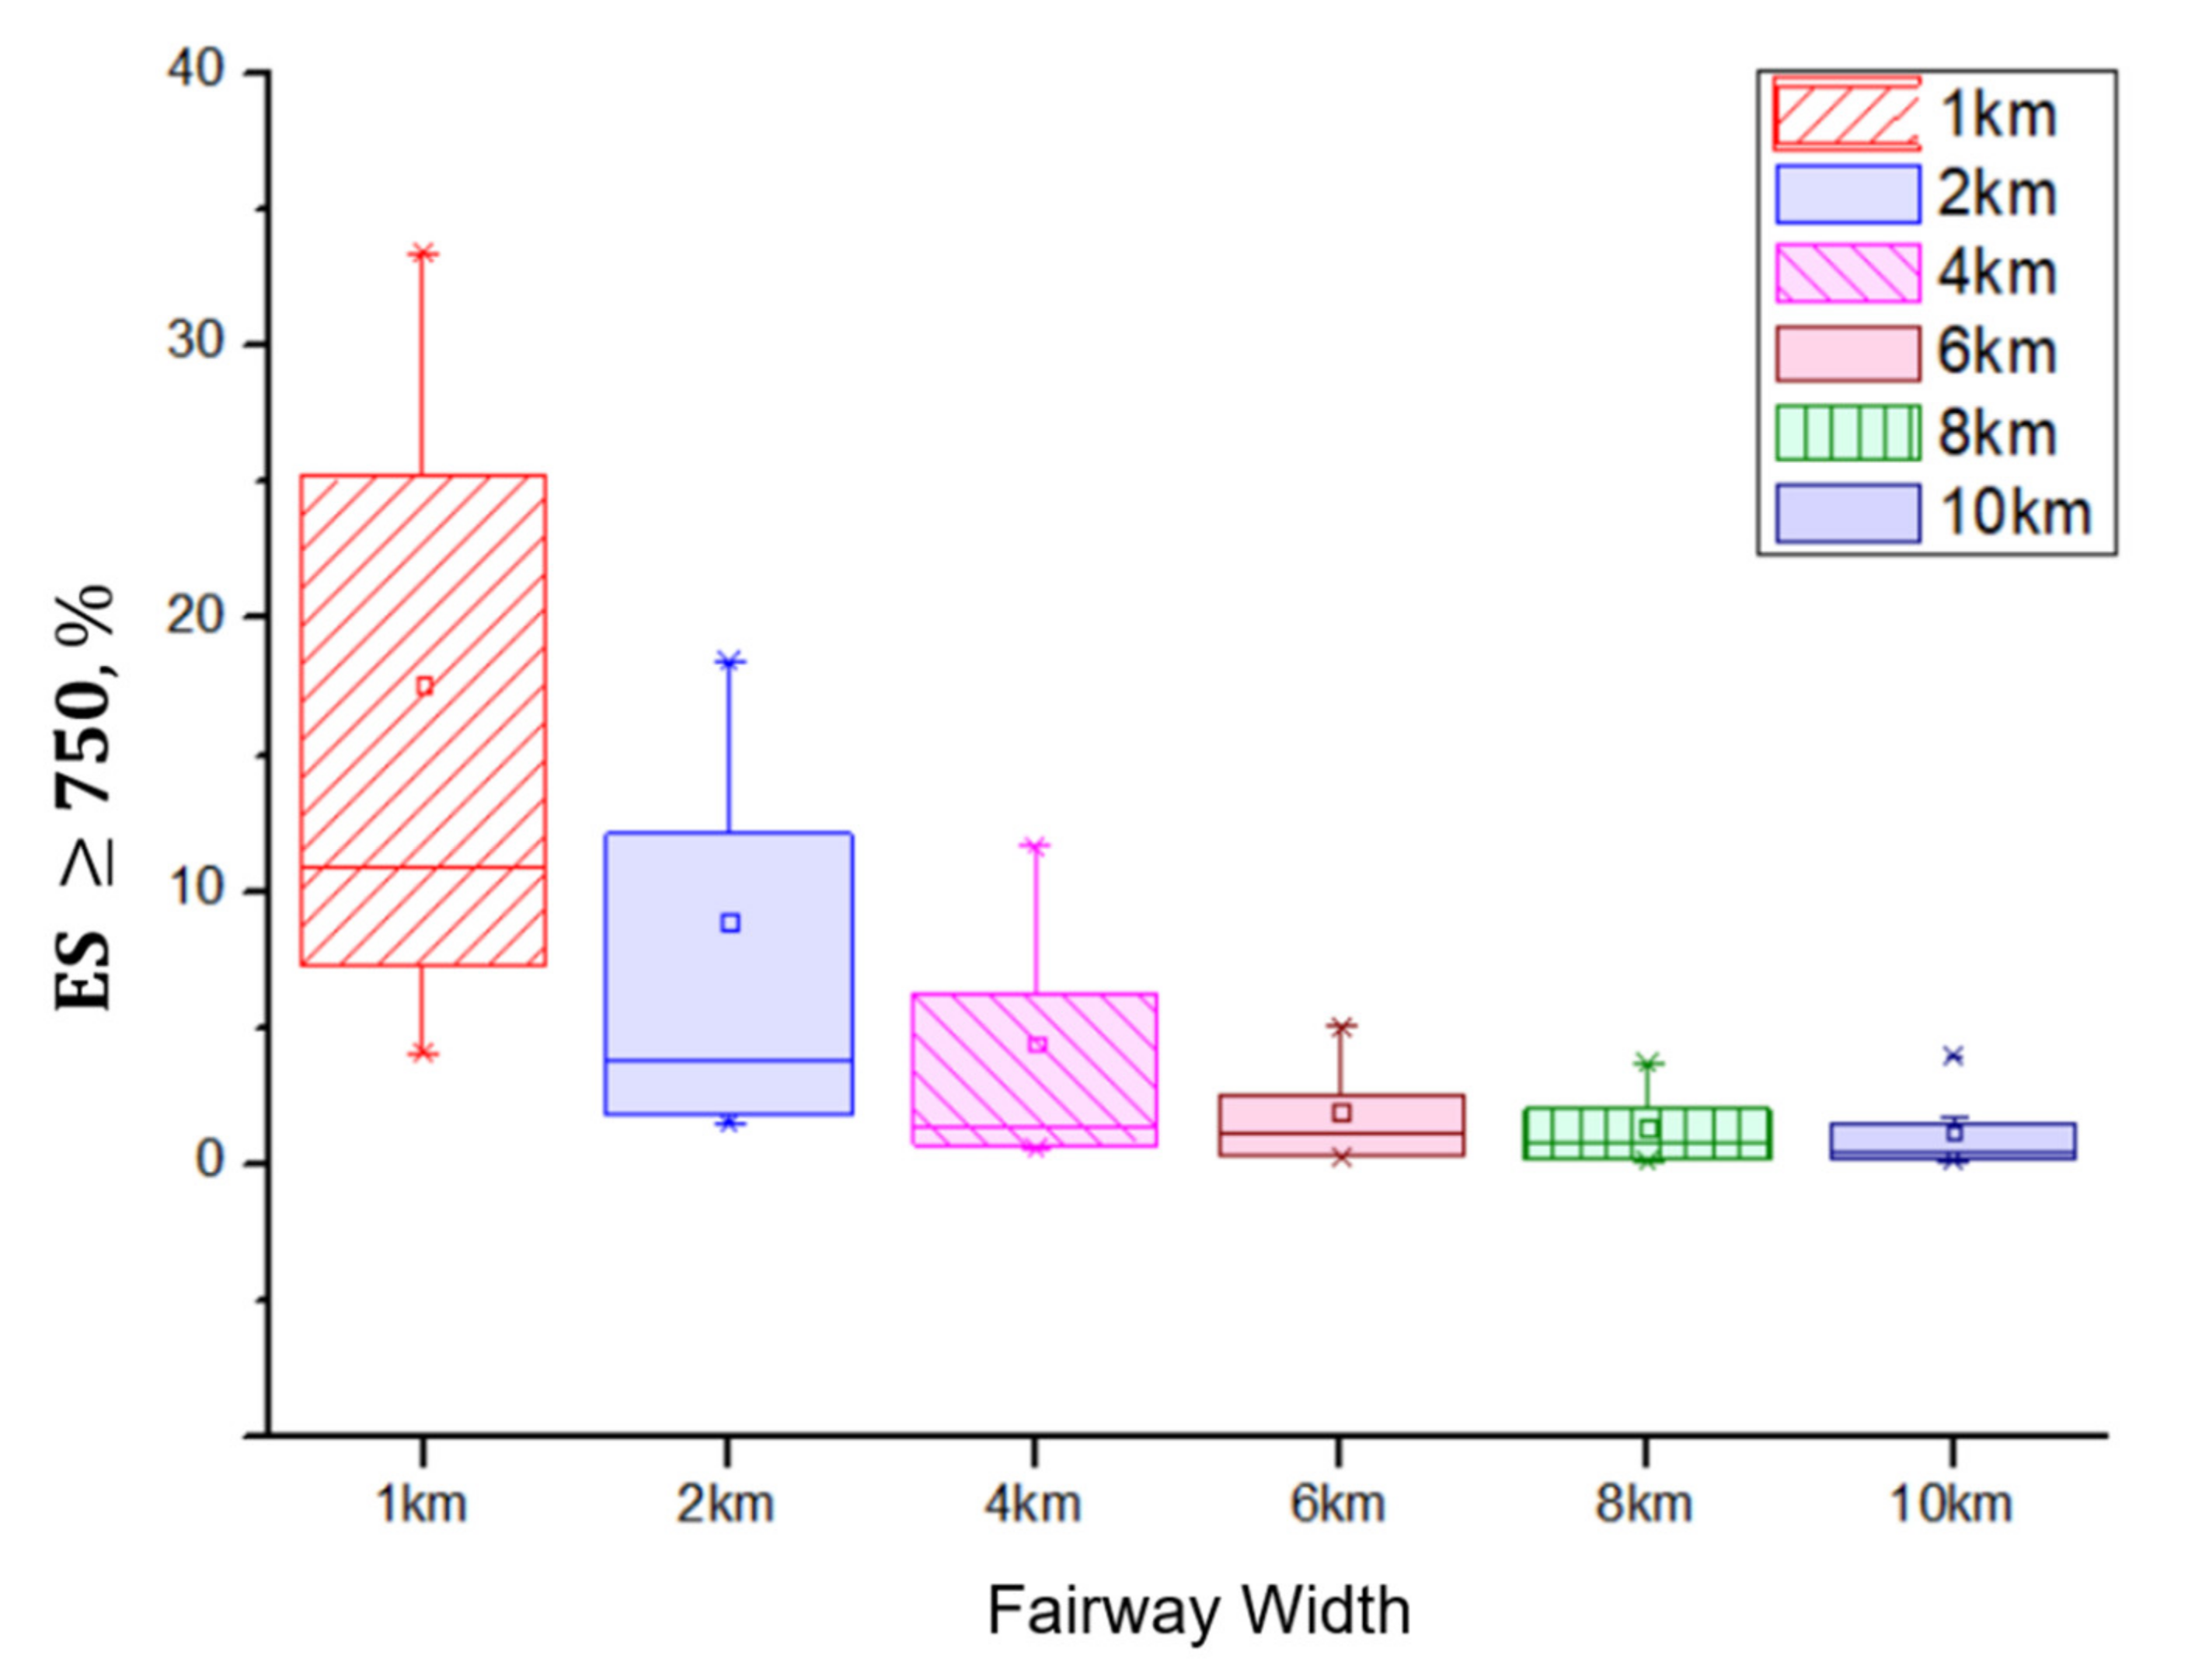
Figure 10 shows how the risk is distributed in each width of 1 km to 10 km for the hourly total environmental stress (ESA) value. When analyzing the risk distribution map from 1 km to 10 km, it was found that an ES value of 750 or higher occurs mostly for widths from 1 km to 4 km.
Figure 11 is a graph showing the situation in which ES ≥ 750 at the 1 km~10 km fairway width when the L-converted traffic volume is 5, 10, 15, and 20, respectively. When the L-converted traffic volume is 5, the maximum value of ES ≥ 750 is about 4%, and it is determined that this is a low level. When the L-converted traffic volume is 10, the maximum value of ES ≥ 750 is about 9.5%. When the L-converted traffic volume is 15, the maximum value of ES ≥ 750 is about 22%, which is determined to cause a significant burden on the operator. In particular, it was found that ES ≥ 750 was more than 10% even when the fairway width was 2 km, and more than 7% when the fairway width was 4 km or more. When the L-converted traffic volume is 20, the maximum value of ES ≥ 750 is about 33%, which is determined to cause a significant burden on the operator. In particular, it was found that ES ≥ 750 was more than 10% even when the fairway width was 6 km.
4.3. The Results of Appropriate Fairway Width Design
Based on the risk assessment model, we evaluated how the level of risk changes according to the amount of change in the vessel at each fairway width.
Table 6 summarizes the risk assessment results according to an L-converted traffic volume of 20, which is the largest amount of traffic. In a normal situation, most of the ESA values are ES values 0~500, as shown in
Figure 10e,f. However, for a fairway width of 4 km or less, the risk was high at values between 500 and 750, as shown in (a) and (b) of
Figure 11. It can be seen that the risk level was high throughout the set fairway, and conversely, there are few sections with low risk, so the burden on the operator is very high.
Figure 12 is a graph comparing the overall environmental stress ratio according to the increase in vessel traffic. In previous studies, it was found that the burden on ship operators was high when the ES value was more than 10% of the total, so it is necessary to design the fairway width in consideration of this [
39]. The results of this study showed that the ES value was 10% or more at 4 km when the vessel traffic volume was 20 or more.
In the general conditions of 5, 10, 15, and 20 of L-converted traffic according to the experimental conditions of this study and in the sea area where at least one cross-fairway occurs in the coastal fairway, the minimum fairway for the L-converted traffic volume is 15 and 20 or more. It was found that safety must be ensured for distances of 6 km or more.
5. Conclusions and Future Work
At present, renewable energy facilities and offshore wind power generation facilities are being built indiscriminately at sea, overlapping with the traffic routes customarily used by ships in domestic coastal waters. In the future, due to the expansion of marine development, the existing shipping lanes may be infringed upon, and this poses a threat to maritime traffic safety. Therefore, it is necessary to preserve safe fairways to ensure the safety of ships. While it is advantageous to secure a wide route from the viewpoint of the safety of the operator and the ship, this is not efficient. In this study, the sea area in front of Gun-san Port, which shows intersecting traffic in the north–south and east–west directions, was selected as the study area.
Currently, when designing the width of passageways near ports and port approach channels, the “Harbour Approach Channels Design Guidelines” provided by the International Water Transportation Facility Association (PIANC) or the criteria for the explanation of the port and fishing port design standards in Korea are considered. The value of the design fairway width in the relevant standard ranges from 3.8 to 18.6 B, and if the width of the largest ship passing through the target sea area is about 50 m long, a minimum fairway width of about 1 km is required. Meanwhile, TSS is established to prevent marine accidents and reduce the burden on ship operators along the domestic coast, and the width of the TSS is set to be about 5600~8500 m. In this way, when considering the channel approaching the port and the domestic coastal TSS, a general coastal fairway can be designed to be from 1 km to 10 km. In terms of maritime traffic safety, the wider the fairway is, the better the vessel’s safety will be. However, it is necessary to design an appropriate fairway width because economic feasibility and efficiency must be considered along with safety.
In this study, an appropriate fairway width was designed using the maritime traffic safety evaluation model. For this purpose, the traffic volume in the sea area in front of Gun-san Port, the target sea area, was analyzed. As the area characteristics and vessel navigation characteristics were so diverse, the concept of L-converted traffic was reflected, and it was found that the L-converted traffic volume was from a minimum of 5 to a maximum of 20 vessels per hour in the target sea area. High-density sections were identified through density analysis, and the high-density sections ranged from a minimum of 5 to 6 km to a maximum of 10 km or more. Considering the general flow and traffic density, it would be advantageous in terms of the economic efficiency of the vessels to use a fairway width of 10 km or more in the target sea area. However, it is necessary to design an appropriate fairway width that ensures the minimum safety requirements are met for marine use. In this study, based on the comprehensive environmental stress evaluation model, the change in safety according to the increase in traffic volume was compared and reviewed for a general route width of 1 km to 10 km. In the environmental stress model, in general, when the ES ≥ 750 is more than 10% of the total, the operator’s burden is determined to exist. As a result of evaluation based on these criteria, it was found that the ES ≥ 750 value exceeded 10% of the total when the fairway width was 1–4 km and the L-converted traffic volume was 20 or more. In particular, when the L-converted traffic volume was 20 or more, the ES ≥ 750 value exceeded 11% of the total. In a comprehensive analysis, the ES > 750 was less than 10% when the fairway width was 6 km or more in the sea area with one crossing passage at 5 to 20 ships per hour, which is the experimental condition used in this study, and the ship operator’s burden was determined to be insignificant. Based on these results, it is expected that when designing routes between offshore wind farms to be established in the future, it will be possible to design the minimum fairway width to ensure safety according to the traffic volume involved.
However, additional research is needed due to the following limitations of this study:
Review using various risk assessment models. In this study, a simulation evaluation was performed based on the ES model for risk evaluation. Although this is a model that expresses the degree of psychological risk of ship operators in a quantitative form, there are models that are similar to the ES model, so it will be necessary to derive comprehensive results from the diversification of evaluation models;
Generalization of characteristics in various waters. In this study, an evaluation was performed for the case of two cross-passages occurring in the waters in front of Gun-san Port. However, the degree of risk may differ according to the traffic volume or traffic type, and in order to apply the results of the study it is necessary to study various cases that can be generalized;
It is necessary to reflect the psychological influence of the fairway width. When the fairway width is greater than a certain amount, the change in risk will be small, but at a fairway width of 2 km or less the risk will significantly increase. This is considered to be a model characteristic that reflects the psychological influence of the ship operators. In order to prove this, it will be necessary to study the effect of psychological safety on risk through operator questionnaires.
Author Contributions
Conceptualization, Y.-S.P. and W.-S.K.; methodology, W.-S.K.; validation, Y.-S.P. and W.-S.K.; writing—original draft preparation, W.-S.K.; writing—review and editing, Y.-S.P.; visualization, W.-S.K.; supervision, Y.-S.P. All authors have read and agreed to the published version of the manuscript.
Funding
This research received no external funding.
Institutional Review Board Statement
Not applicable.
Informed Consent Statement
Not applicable.
Data Availability Statement
The data presented in this study are available on request from the corresponding author. The data are not publicly available due to privacy.
Conflicts of Interest
The authors declare no conflict of interest.
Appendix A
Table A1.
Factor values indicating the effect in the Environmental Stress Model assessment.
Table A1.
Factor values indicating the effect in the Environmental Stress Model assessment.
| North-South Direction |
| Number of ships by length | | Number of ships by ship type | |
| not more than 50 m | 172 | fishing vessel | 9 |
| 50–100 m | 109 | cargo carrier | 221 |
| 100–150 m | 126 | tanker | 103 |
| 150–200 m | 53 | passenger ship | 0 |
| 200–250 m | 34 | towing vessel | 3 |
| 250–300 m | 13 | other cargo ship | 177 |
| more than 300 m | 6 | total | 513 |
| total | 513 | | |
| East-west direction |
| Number of ships by length | | Number of ships by ship type | |
| not more than 50 m | 739 | fishing vessel | 221 |
| 50–100 m | 31 | cargo carrier | 65 |
| 100–150 m | 25 | tanker | 16 |
| 150–200 m | 11 | passenger ship | 14 |
| 200–250 m | 12 | towing vessel | 6 |
| 250–300 m | 3 | other cargo ship | 883 |
| more than 300 m | 0 | total | 1205 |
| total | 1205 | | |
| L-converted traffic per hour in north-south direction |
| date | hour | L | date | hour | L | date | hour | L | date | hour | L |
| 24 May | 0 | 5.01 | 25 May | 0 | 1.19 | 26 May | 0 | 13.23 | 27 May | 0 | 5.3 |
| 1 | 6.5 | 1 | 0.93 | 1 | 3.58 | 1 | 10.6 |
| | 2 | 6.85 | | 2 | 7.85 | | 2 | 1.86 | | 2 | 1.39 |
| | 3 | 7.47 | | 3 | 0 | | 3 | 5.37 | | 3 | 3.93 |
| | 4 | 3.39 | | 4 | 0.48 | | 4 | 0.48 | | 4 | 0 |
| | 5 | 19.05 | | 5 | 1.39 | | 5 | 5.72 | | 5 | 2.99 |
| | 6 | 10.58 | | 6 | 8.7 | | 6 | 1.92 | | 6 | 5.3 |
| | 7 | 2.65 | | 7 | 7.95 | | 7 | 12.03 | | 7 | 6.5 |
| | 8 | 10.62 | | 8 | 6.87 | | 8 | 8.42 | | 8 | 5.26 |
| | 9 | 5.78 | | 9 | 8.5 | | 9 | 0.96 | | 9 | 5 |
| | 10 | 6.41 | | 10 | 11.84 | | 10 | 10.98 | | 10 | 8.44 |
| | 11 | 16.66 | | 11 | 4.52 | | 11 | 0.48 | | 11 | 9.5 |
| | 12 | 6.82 | | 12 | 12.72 | | 12 | 7.75 | | 12 | 3.85 |
| | 13 | 2.79 | | 13 | 8.43 | | 13 | 8.61 | | 13 | 7.24 |
| | 14 | 3.1 | | 14 | 2.65 | | 14 | 0.96 | | 14 | 5.64 |
| | 15 | 6.9 | | 15 | 12.46 | | 15 | 4.36 | | 15 | 4.94 |
| | 16 | 5.28 | | 16 | 6.54 | | 16 | 9.3 | | 16 | 3.28 |
| | 17 | 0 | | 17 | 6.21 | | 17 | 1.55 | | 17 | 7.68 |
| | 18 | 10.39 | | 18 | 3.58 | | 18 | 0 | | 18 | 2.17 |
| | 19 | 7.22 | | 19 | 0 | | 19 | 3.63 | | 19 | 4.04 |
| | 20 | 6.61 | | 20 | 8.6 | | 20 | 4.32 | | 20 | 3.13 |
| | 21 | 5.05 | | 21 | 10.65 | | 21 | 4.95 | | 21 | 4.82 |
| | 22 | 9.71 | | 22 | 12.17 | | 22 | 2.48 | | 22 | 9.77 |
| | 23 | 6.06 | | 23 | 0.48 | | 23 | 14.85 | | 23 | 7.43 |
| date | hour | L | date | hour | L | date | hour | L | | | |
| 28 May | 0 | 13.25 | 29 May | 0 | 8.97 | 30 May | 0 | 8.02 | | | |
| 1 | 6.76 | 1 | 13.11 | 1 | 8.37 | | |
| | 2 | 0 | | 2 | 2.17 | | 2 | 0 | | | |
| | 3 | 2.65 | | 3 | 5.91 | | 3 | 3.39 | | | |
| | 4 | 7.24 | | 4 | 3.61 | | 4 | 5.71 | | | |
| | 5 | 11.01 | | 5 | 4.8 | | 5 | 4.54 | | | |
| | 6 | 2.75 | | 6 | 7.26 | | 6 | 4.54 | | | |
| | 7 | 7.16 | | 7 | 10.56 | | 7 | 4.85 | | | |
| | 8 | 3.56 | | 8 | 6.85 | | 8 | 6.03 | | | |
| | 9 | 8.43 | | 9 | 3.36 | | 9 | 0.48 | | | |
| | 10 | 4.04 | | 10 | 9.88 | | 10 | 9.76 | | | |
| | 11 | 4.86 | | 11 | 11.61 | | 11 | 5.29 | | | |
| | 12 | 12.13 | | 12 | 5.25 | | 12 | 2.65 | | | |
| | 13 | 9.79 | | 13 | 0 | | 13 | 5.15 | | | |
| | 14 | 2.99 | | 14 | 5.5 | | 14 | 5.84 | | | |
| | 15 | 5.93 | | 15 | 6.6 | | 15 | 1.79 | | | |
| | 16 | 1.89 | | 16 | 4.44 | | 16 | 0.48 | | | |
| | 17 | 9.27 | | 17 | 6.33 | | 17 | 4.52 | | | |
| | 18 | 5.34 | | 18 | 4.54 | | 18 | 1.71 | | | |
| | 19 | 1.39 | | 19 | 2.75 | | 19 | 1.39 | | | |
| | 20 | 4.06 | | 20 | 5.19 | | 20 | 0 | | | |
| | 21 | 0 | | 21 | 2.27 | | 21 | 2.51 | | | |
| | 22 | 5.7 | | 22 | 3.28 | | 22 | 4.91 | | | |
| | 23 | 10.43 | | 23 | 13.64 | | 23 | 3.7 | | | |
| L-converted traffic per hour in east-west direction |
| date | hour | L | date | hour | L | date | hour | L | date | hour | L |
| 24 May | 0 | 4.8 | 25 May | 0 | 4.32 | 26 May | 0 | 4.29 | 27 May | 0 | 4.27 |
| 1 | 3.36 | 1 | 2.88 | 1 | 2.88 | 1 | 7.68 |
| | 2 | 2.88 | | 2 | 1.44 | | 2 | 3.63 | | 2 | 2.4 |
| | 3 | 0.96 | | 3 | 0.48 | | 3 | 0.96 | | 3 | 0.48 |
| | 4 | 1.92 | | 4 | 0.96 | | 4 | 0 | | 4 | 5.93 |
| | 5 | 2.85 | | 5 | 2.19 | | 5 | 0.96 | | 5 | 1.92 |
| | 6 | 2.88 | | 6 | 0.48 | | 6 | 5.42 | | 6 | 0.48 |
| | 7 | 3.84 | | 7 | 1.89 | | 7 | 3.36 | | 7 | 0.96 |
| | 8 | 3.36 | | 8 | 2.4 | | 8 | 2.4 | | 8 | 2.75 |
| | 9 | 3.36 | | 9 | 7.88 | | 9 | 5.79 | | 9 | 6.72 |
| | 10 | 5.73 | | 10 | 4.11 | | 10 | 3.36 | | 10 | 3.15 |
| | 11 | 8.3 | | 11 | 4.59 | | 11 | 3.63 | | 11 | 1.92 |
| | 12 | 1.92 | | 12 | 0.48 | | 12 | 6.58 | | 12 | 5.28 |
| | 13 | 2.4 | | 13 | 2.4 | | 13 | 3.84 | | 13 | 4.56 |
| | 14 | 4.8 | | 14 | 2.88 | | 14 | 1.92 | | 14 | 0.96 |
| | 15 | 5.76 | | 15 | 2.4 | | 15 | 2.4 | | 15 | 2.4 |
| | 16 | 9.12 | | 16 | 11.49 | | 16 | 4.57 | | 16 | 6.24 |
| | 17 | 6.94 | | 17 | 7.68 | | 17 | 8.41 | | 17 | 8 |
| | 18 | 7.2 | | 18 | 4.8 | | 18 | 4.77 | | 18 | 13.98 |
| | 19 | 4.8 | | 19 | 10.35 | | 19 | 10.53 | | 19 | 3.84 |
| | 20 | 8.5 | | 20 | 6.21 | | 20 | 9.32 | | 20 | 8.16 |
| | 21 | 9.12 | | 21 | 1.44 | | 21 | 11.15 | | 21 | 4.8 |
| | 22 | 1.92 | | 22 | 3.36 | | 22 | 3.84 | | 22 | 3.36 |
| | 23 | 2.88 | | 23 | 6.56 | | 23 | 2.88 | | 23 | 2.88 |
| date | hour | L | date | hour | L | date | hour | L | | | |
| 28 May | 0 | 4.8 | 29 May | 0 | 4.8 | 30 May | 0 | 2.4 | | | |
| 1 | 3.84 | 1 | 3.84 | 1 | 2.88 | | | |
| | 2 | 8.43 | | 2 | 7.23 | | 2 | 0.48 | | | |
| | 3 | 4.98 | | 3 | 3.84 | | 3 | 1.23 | | | |
| | 4 | 0 | | 4 | 2.88 | | 4 | 1.44 | | | |
| | 5 | 0.93 | | 5 | 5.76 | | 5 | 0 | | | |
| | 6 | 0 | | 6 | 2.4 | | 6 | 1.44 | | | |
| | 7 | 1.44 | | 7 | 0.96 | | 7 | 1.44 | | | |
| | 8 | 5.23 | | 8 | 14.83 | | 8 | 3.39 | | | |
| | 9 | 1.92 | | 9 | 7.2 | | 9 | 0.48 | | | |
| | 10 | 3.84 | | 10 | 1.92 | | 10 | 4.38 | | | |
| | 11 | 4.8 | | 11 | 2.88 | | 11 | 0.96 | | | |
| | 12 | 4.57 | | 12 | 2.88 | | 12 | 6.27 | | | |
| | 13 | 2.88 | | 13 | 2.4 | | 13 | 2.4 | | | |
| | 14 | 2.37 | | 14 | 2.37 | | 14 | 2.4 | | | |
| | 15 | 3.36 | | 15 | 7.63 | | 15 | 0.96 | | | |
| | 16 | 6.24 | | 16 | 5.76 | | 16 | 6.84 | | | |
| | 17 | 5.76 | | 17 | 0.48 | | 17 | 4.8 | | | |
| | 18 | 10.33 | | 18 | 7.21 | | 18 | 6.25 | | | |
| | 19 | 6.24 | | 19 | 2.88 | | 19 | 0 | | | |
| | 20 | 5.16 | | 20 | 5.05 | | 20 | 2.16 | | | |
| | 21 | 3.79 | | 21 | 4.77 | | 21 | 3.39 | | | |
| | 22 | 3.36 | | 22 | 2.88 | | 22 | 0.48 | | | |
| | 23 | 6.39 | | 23 | 0.96 | | 23 | 0.96 | | | |
Appendix B
Figure A1.
(a) The vessel trajectory pattern analysis Group 1; (b) the vessel trajectory pattern analysis Group 2; (c) the vessel trajectory pattern analysis Group 3; (d) the vessel trajectory pattern analysis Group 4.
Figure A1.
(a) The vessel trajectory pattern analysis Group 1; (b) the vessel trajectory pattern analysis Group 2; (c) the vessel trajectory pattern analysis Group 3; (d) the vessel trajectory pattern analysis Group 4.
References
- Ministry of Trade, Industry and Energy. Implementation Plan for Renewable Energy 3020; Ministry of Trade, Industry and Energy: Sejong City, Korea, 2017.
- Serri, L.; Colle, L.; Witali, B.; Bonomi, T. Floating Offshore Wind Farms in Italy beyond 2030 and beyond 2060: Preliminary Results of a Techno-Economic Assessment. Appl. Sci. 2020, 10, 8899. [Google Scholar] [CrossRef]
- Ohn, S.W.; Lee, C.H.; Kim, C.S. A Study on the Establishment of Allowable Criteria for Sailing Ships at Offshore Wind Farms. J. Korean Soc. Mar. Environ. Saf. 2018, 24, 841–847. [Google Scholar] [CrossRef]
- Rawson, A.; Rogers, E. Assessing the Impacts to Vessel Traffic from Offshore Wind Farms in the Thames Estuary. Sci. J. Mar. Univ. Szczecin. 2015, 43, 99–107. [Google Scholar]
- Cho, S.J.; Choi, H.J. Recent Trends and Their Implications of Marine Activities Mapping for Marine Spatial Planning. J. Korean Soc. Mar. Environ. Energy 2018, 21, 270–280. [Google Scholar] [CrossRef]
- Kil, J.K. Rechtliche Betrachtungen auf der deuschen Maritimen Raumordnungsplan. Korea Pub. Land Law Assoc. 2014, 65, 69–95. [Google Scholar]
- Ministry of Oceans and Fisheries. Planning Research on the Establishment of a Systematic Maritime Transportation Network in Domestic Coastal Waters in Safety Assessment of Vessel Passageways in 2020; Ministry of Oceans and Fisheries: Sejong City, Korea, 2020; pp. 93–126.
- Ministry of Oceans and Fisheries. A Study on the Advancement of the National Maritime Transport Network; Ministry of Oceans and Fisheries: Sejong City, Korea, 2013; pp. 265–280.
- Lee, C.K. The Impacts on Sea Lanes of Communication (SLOC) Security to Korea’s National Economy. In Strategy 21; Korea Institute for Maritime Strategy: Seoul, Korea, 2012; Volume 30, pp. 31–62. [Google Scholar]
- Yu, Q.; Liu, K.; Teixeira, A.P.; Soares, C.G. Assessment of the Influence of Offshore Wind Farms on Ship Traffic Flow Based on AIS Data. J. Navig. 2020, 73, 131–148. [Google Scholar] [CrossRef]
- Mehdi, R.A.; Schroder-Hinrichs, J.; Baldauf, M. A Tale of Two Industries: Seafarer Perceptions of Navigational Safety Risks near Offshore Wind Farms. MaRiSa Ocean Yearb. 2019, 33, 543–581. [Google Scholar] [CrossRef]
- Mehdi, R.A.; Schroder-Hinrichs, J.; Overloop, J.; Nilsson, H.; Palsson, J. Improving the Coexistence of Offshore Wind Farms and Shipping: An International Comparison of Navigational Risk Assessment Processes. J. Marit. Arrairs. 2018, 17, 397–434. [Google Scholar] [CrossRef] [Green Version]
- Sourne, H.L.; Barrera, A.; Maliakel, J.B. Numerical Crashworthiness Analysis of an Offshore Wind Turbine Jacket Impacted by a Ship. J. Mar. Sci. Tech. 2015, 23, 694–704. [Google Scholar]
- Park, C.; Kee, S.C. Online Local Path Planning on the Campus Environment for Autonomous Driving Considering Road Constraints and Multiple Obstacles. Appl. Sci. 2021, 11, 3909. [Google Scholar] [CrossRef]
- Tullu, A.; Endale, B.; Wondosen, A.; Hwang, H.Y. Machine Learning Approach to Real-Time 3D Path Planning for Autonomous Navigation of Unmanned Aerial Vehicle. Appl. Sci. 2021, 11, 4706. [Google Scholar] [CrossRef]
- Paulauskas, V.; Paulauskas, D. Evaluating the Width of Navigational Channels. Transport 2013, 28, 166–174. [Google Scholar] [CrossRef]
- Gucma, S.; Dzwonkowski, J.; Przywarty, M. Kinematic Method of Determining Safe Fairway Bend Widths. Int. J. Mar. Nav. Saf. Sea Transp. 2020, 14, 435–441. [Google Scholar] [CrossRef]
- Kim, H.S.; Lee, Y.S. A Study on Decision of Minimum Required Channel Width Considering Ship Types by Fast Time Simulation. J. Korean Soc. Mar. Environ. Saf. 2020, 26, 309–316. [Google Scholar] [CrossRef]
- Park, Y.S. Basic Study on Design Guideline of Traffic Separation Scheme. J. Korean Nav. Port Res. 2007, 31, 173–178. [Google Scholar]
- Ministry of Trade, Industry and Energy. Announcement on Detailed Permission Standards for Power Generation Business, Electricity Rate Calculation Standards, Watt-Hour Meter Tolerance and Power System Operation Business; Ministry of Trade, Industry and Energy: Sejong City, Korea, 2020.
- PIANC. Harbour Approach Channels Design Guidelines; PIANC Report N-121; Maritime Navigation Commission: Bruxelles, Begium, 2014. [Google Scholar]
- Gucma, S.; Zalewski, P. Optimization of fairway design parameters: Systematic approach to manoeuvering safety. Int. J. Naval Arch. Ocean Eng. 2020, 12, 129–145. [Google Scholar] [CrossRef]
- Bak, A.; Zalewski, P. Determination of the Waterway Parameters as a Component of Safety Management System. Appl. Sci. 2021, 11, 4456. [Google Scholar] [CrossRef]
- Ministry of Oceans and Fisheries. Announcement of Revision of Port and Fishing Port Design Standards; Ministry of Oceans and Fisheries: Sejong City, Korea, 2020.
- Johnson, D.R. Recent Trends in Navigation Safety in the Dover Strait. In Proceedings of the 3rd International Symposium on Marine Traffic Service, Liverpool, UK, 3–6 April 1978. [Google Scholar]
- Kuroda, K.; Ekita, H. Safety Assessment of Waterway Network in Bay Area. In Proceedings of the 27th International Navigation Congress, Osaka, Japan, 19–26 May 1990. [Google Scholar]
- Park, Y.S.; Jeong, J.Y.; Park, J.S. An Assessment of the Quantitative Effect of TSS by Vessel Traffic Flow Simulation. J. Korean Soc. Transp. 2003, 21, 41–49. [Google Scholar]
- Park, J.S.; Park, Y.S.; Lee, K.H. Marine Traffic Engineering; Dasom Publisher: Busan, Korea, 2013; pp. 56–57; 141–145; 173–174. [Google Scholar]
- Lee, J.S.; Kim, J.S. Risk Analysis of VTS operators for Small Vessels Using Collision Risk Assessment Model. J. Nav. Port Res. 2019, 43, 250–255. [Google Scholar]
- Franti, P. Efficiency of Random Swap Clustering. J. Big Data. 2018, 5, 13. [Google Scholar] [CrossRef]
- Amorim, R.C.; Hennig, C. Recovering the Number of Clusters in Data Sets with Noise Features using Feature Rescaling Factors. Inf. Sci. 2015, 324, 126–145. [Google Scholar] [CrossRef] [Green Version]
- Nigsch, F.; Bender, A.; van Buuren, B.; Tissen, J.; Nigsch, E.; Mitchell, J.B.O. Melting point prediction employing k-nearest neighbor algorithms and genetic parameter optimization. J. Chem. Inform. Model. 2006, 46, 2412–2422. [Google Scholar] [CrossRef] [PubMed]
- Hall, P.; Park, B.U.; Samworth, R.J. Choice of neighbor order in nearest-neighbor classification. Ann. Stat. 2008, 36, 2135–2152. [Google Scholar] [CrossRef]
- Gong, I.Y.; Kim, Y.G. A Review on the Concept of Operating Rate of Fairway and Its Application. J. Ships Ocean Eng. 2005, 40, 173–178. [Google Scholar]
- Lee, B.K.; Cho, I.S.; Kim, D.H. A Study on the Design of the Grid-Cell Assessment System for the Optimal Location of Offshore Wind Farms. J. Korean Soc. Mar. Environ. 2018, 24, 848–857. [Google Scholar] [CrossRef]
- Lee, M.K.; Park, Y.S.; Park, S.W.; Lee, E.K.; Park, M.J.; Kim, N.E. Application of Collision Warning Algorithm Alarm in Fishing Vessel’s Waterway. Appl. Sci. 2021, 11, 4479. [Google Scholar] [CrossRef]
- Lee, H.K. Development of Marine Traffic Supporting System through ES Model for VTS. Ph.D. Thesis, Pukyong National University, Busan, Korea, 2011. [Google Scholar]
- Inoue, K. On the Separation of Traffic at Straight Waterway by Distribution Model of Ship. Jpn. Inst. Nav. 1977, 56, 103–115. [Google Scholar] [CrossRef] [Green Version]
- Park, H.G.; Park, Y.S.; Kim, D.W. Correlation of Marine Exploration-Survey Vessel Operation Factors and Grid-Type Operation Method through ES Model Analysis. J. Korean Soc. Mar. Environ. Saf. 2020, 26, 634–643. [Google Scholar] [CrossRef]
Figure 1.
Flowchart of the study.
Figure 1.
Flowchart of the study.
Figure 2.
Status of the marine traffic and offshore wind farm planned in the area.
Figure 2.
Status of the marine traffic and offshore wind farm planned in the area.
Figure 3.
Channel width design standard according to the PIANC guidelines.
Figure 3.
Channel width design standard according to the PIANC guidelines.
Figure 4.
(a) vessel traffic in the coastal waters near Gun-san Port; and (b) L-converted traffic volume based on GICOMS data for seven days (24 May–30 May).
Figure 4.
(a) vessel traffic in the coastal waters near Gun-san Port; and (b) L-converted traffic volume based on GICOMS data for seven days (24 May–30 May).
Figure 5.
Traffic pattern clustering process.
Figure 5.
Traffic pattern clustering process.
Figure 6.
Vessel trajectories for GICOMS data.
Figure 6.
Vessel trajectories for GICOMS data.
Figure 7.
(a) Comprehensive result of the vessel trajectory pattern analysis; and (b) A~D classification vessel trajectories for each pattern.
Figure 7.
(a) Comprehensive result of the vessel trajectory pattern analysis; and (b) A~D classification vessel trajectories for each pattern.
Figure 8.
(a) The density used to determine the frequency of passage along fairway within the gridded sector; and (b) the density which was calculated in consideration of the area occupied by passing vessels.
Figure 8.
(a) The density used to determine the frequency of passage along fairway within the gridded sector; and (b) the density which was calculated in consideration of the area occupied by passing vessels.
Figure 9.
Graph of the scenario for a safety assessment with the environmental stress model.
Figure 9.
Graph of the scenario for a safety assessment with the environmental stress model.
Figure 10.
(a) Graph of ESA value for 1 km fairway width; (b) graph of ESA value for 2 km fairway width; (c) graph of ESA value for 4 km fairway width; (d) graph of ESA value for 6 km fairway width; (e) graph of ESA value for 8 km fairway width; and (f) graph of ESA value for 10 km fairway width.
Figure 10.
(a) Graph of ESA value for 1 km fairway width; (b) graph of ESA value for 2 km fairway width; (c) graph of ESA value for 4 km fairway width; (d) graph of ESA value for 6 km fairway width; (e) graph of ESA value for 8 km fairway width; and (f) graph of ESA value for 10 km fairway width.
Figure 11.
(a) ES ≥ 750 ratio for a fairway width of 1 km for each L-converted traffic volume; (b) fairway width of 2 km; (c) fairway width of 4 km; (d) fairway width of 6 km; (e) fairway width of 8 km; and (f) fairway width of 10 km for each L-converted traffic volume.
Figure 11.
(a) ES ≥ 750 ratio for a fairway width of 1 km for each L-converted traffic volume; (b) fairway width of 2 km; (c) fairway width of 4 km; (d) fairway width of 6 km; (e) fairway width of 8 km; and (f) fairway width of 10 km for each L-converted traffic volume.
Figure 12.
ES 750 groups for each fairway width.
Figure 12.
ES 750 groups for each fairway width.
Table 1.
Basic maneuvering lane and additional channel width of PIANC.
Table 1.
Basic maneuvering lane and additional channel width of PIANC.
| Width | Basic or Additional Width Range |
|---|
| 1.3~1.8 B* |
| Additional Factor | Vessel Speed | 0~0.1 B |
| Wind | 0.1~1.1 B |
| Current | 0~1.6 B |
| Wave | 0~1.0 B |
| Navigation Aids | 0~0.4 B |
| Bottom surface | 0~0.2 B |
| Depth | 0~0.4 B |
| Two-Way Traffic | 1.0~2.0 B |
| Bank Clearance | 0~1.3 B |
Table 2.
Channel width according to the Korea design standard.
Table 2.
Channel width according to the Korea design standard.
| Type | Width Range |
|---|
| One-way | 0.5~1.0 L* |
| Two-way | 1.0~2.0 L |
Table 3.
Fairway width in the Traffic Separation Scheme.
Table 3.
Fairway width in the Traffic Separation Scheme.
| TSS Name | Width (m) | Width (m) by Bound |
|---|
| Bogil-do | 7850 | West Bound | 2900 |
| East Bound | 3700 |
| Separation Zone | 1250 |
| Geomun-do | 6260 | West Bound | 2600 |
| East Bound | 2570 |
| Separation Zone | 1090 |
| Hong-do | 8570 | West Bound | 3870 |
| East Bound | 3800 |
| Separation Zone | 900 |
| Ong-do | 5640 | West Bound | 1830 |
| East Bound | 1800 |
| Separation Zone | 2010 |
Bukmaemul
Sudo | 7950 | West Bound | 2750 |
| East Bound | 2750 |
| Separation Zone | 2450 |
Nammaemul
Sudo | 7950 | West Bound | 2750 |
| East Bound | 2750 |
| Separation Zone | 2450 |
Table 4.
Potential risk perceived by the operator.
Table 4.
Potential risk perceived by the operator.
| | Perceived Risk of Ship Operators |
|---|
| Degree of risk | −3 | −2 | −1 | 0 | +1 | +2 | +3 |
| Very Safe | Safe | Little Safe | Middle | Little Dangerous | Dangerous | Very Dangerous |
Table 5.
Variables used in the marine traffic simulation.
Table 5.
Variables used in the marine traffic simulation.
| Type | Width Range |
|---|
| 1 km | 2 km | 4 km | 6 km | 8 km | 10 km |
|---|
| Traffic Volume | 5 ships/h, 10 ships/h, 15 ships/h, 20 ships/h |
| Ship’s Speed | 10 knots, 15 knots |
| Traffic Direction | 3 Ways |
Table 6.
The summary of in the case of L-converted traffic of 20.
Table 6.
The summary of in the case of L-converted traffic of 20.
| ES Value | |
|---|
| 1 km | 2 km | 4 km | 6 km | 8 km | 10 km |
|---|
| 0–500 | 40.4 | 49.6 | 70.8 | 86.8 | 90.1 | 90.2 |
| 500–750 | 32.1 | 32.0 | 17.6 | 8.1 | 6.2 | 5.8 |
| 750–900 | 12.3 | 7.2 | 4.0 | 1.4 | 1.2 | 1.0 |
| 900–1000 | 15.1 | 11.2 | 7.6 | 3.7 | 2.5 | 2.9 |
| Publisher’s Note: MDPI stays neutral with regard to jurisdictional claims in published maps and institutional affiliations. |
© 2022 by the authors. Licensee MDPI, Basel, Switzerland. This article is an open access article distributed under the terms and conditions of the Creative Commons Attribution (CC BY) license (https://creativecommons.org/licenses/by/4.0/).


