Article

Influence of Directionality on the Seismic Response of Typical RC Buildings

by
Ignacio Bugueño
1,
Jorge Carvallo
2 and
Juan Carlos Vielma
2,*
1
Carvallo Carvallo Ltda, Viña del Mar 2520000, Chile
2
Civil Engineering School, Pontificia Universidad Católica de Valparaíso, Valparaíso 2340000, Chile
*
Author to whom correspondence should be addressed.
Appl. Sci. 2022, 12(3), 1534; https://doi.org/10.3390/app12031534
Submission received: 23 December 2021 / Revised: 21 January 2022 / Accepted: 28 January 2022 / Published: 31 January 2022
(This article belongs to the Special Issue Seismic Assessment and Design of Structures)

Abstract

:
Current seismic analysis contemplates the simultaneous use of the orthogonal components of an earthquake in order to determine the structural stresses closer to reality. This has led to these components being combined considering a fraction of them, as applying them completely would lead to excessively conservative results. However, their application is carried out considering that the direction of the components coincides with the orientation of the orthogonal axes that define the resistant structure. The assumption takes on special importance when it comes to establishing performance demands on a structure based on nonlinear time-history analysis. To establish the proportional relationship between the seismic components, the angle of incidence is used, which is one of the imponderable variables of an earthquake. In this investigation, a group of reinforced concrete structural archetypes with various typologies and regularity in plan is presented, which allow the effect of the angle of incidence in determining the maximum displacement demands to be studied. To study the response, a set of strong earthquakes recorded in Chile is used, obtaining the angle of incidence that produces the maximum displacement demands through interstory drift and roof displacement. A statistical analysis is also carried out in which the influence of the angle of incidence that produces the maximum response is studied.

1. Introduction

At present, the seismic-resistant design of structures is based on the results of the seismic analysis carried out considering two components of ground acceleration, which are transformed into seismic forces that act in two directions. The problem lies in determining the proportions in which the application of the accelerations, and thus the design of seismic forces, must be carried out, as the combination of the proportions can lead to results that are either on the conservative side or on the low side. In particular, the angle of incidence considered when performing the seismic analysis becomes important when determining the demands to which the structure will be subjected (MacRae and Mattheis [1]). For example, Athanatopoulou et al. [2] concluded that the estimation of interstory drift due to bi-directional earthquakes is dependent on the chosen reference axes, which is especially important in irregular structures. On the other hand, Rigato and Medina [3] obtained variations of up to 80% between the maximum inelastic deformations calculated with angles of incidence different from the usual ones (0° and 90°). On the other hand, underestimation in engineering demand parameters (interstory drifts and displacements) can be reduced by up to 20% by performing nonlinear time-history analysis with a large number of records in normal directions and parallel to the fault (Reyes and Kalkan [4]). However, these types of solutions may not be practical in Chilean territory given the extension of the active seismic zone. Regarding the errors observed, according to Kashkooli and Banan [5], mean maximum errors have been reported for story displacement and interstory drift of up to 22% and 42%, respectively, or errors of up to 37% in roof displacements and rotations in plastic hinges (Magliulo et al. [6]). Finally, Prajwal et al. [7] reported variations in displacement demands of up to 90%.
The direction in which the earthquake interacts with the structure is arbitrary, so the structural axes do not necessarily correspond to the main axes of movement, which would present the most unfavorable situation. To study this characteristic, Rigato and Medina [3] obtained the response of asymmetric and symmetric structures by varying the degrees of inelasticity, vibration periods, and incidence angles used, observing that the response varies depending on the fundamental period, structuring, and degree of inelasticity. In the analyses, two archetypes were used, varying the angle of incidence in increments of 5° from 0° to 180°. According to the authors, the ratio between the maximum inelastic deformation for a given angle and the maximum obtained for an angle of 0° and 90° tends to increase along with the fundamental period, averaging between 1.1 and 1.6 for torsionally balanced and unbalanced models. It was concluded that the structural axes are not necessarily the most unfavorable and that the critical incidence angle varies depending on the intensity of the record. On the other hand, Lagaros [8] studied two different structures, using three records and incidence angles in increments of 5° varying from 0° to 360°. These records were used as a basis to scale an acceleration spectrum considering the first period of the structures, damping of 5%, and three levels of intensity. The response of the structures varied according to the records, intensity level, and incidence angle.
In order to study the effect of the directionality of earthquakes on structures, nonlinear response analysis has frequently been used. Cantagallo et al. [9], studied the influence of directionality on seismic response variation, including in the study the variation of the angle of incidence between 0° and 180° in increments of 22.5°, reaching the conclusion that, for the analyzed structures, the main axes underestimated the demand, especially in plan irregular structures, while in structures with double symmetry, no considerable variations were obtained. Additionally, it was observed that the effects of directionality are lower in scaled seismic records. It should be noted that only four structures were considered in this study, so these results are limited.
Fontara et al. [10] studied the influence of the orientation of the seismic action and its intensity on single-story asymmetric reinforced concrete structures. The sensitivity of the structure to the angle of incidence varied depending on the degree of incursion in a nonlinear range; as the level of damage increases, the variability in the results as a function of the angle of incidence increases as well. The results indicated that the most unfavorable case was not obtained in the structural axes; that scaling the records using the same scale factor allows for similar levels of damage regardless of whether they are recorded, correlated, or not correlated; and that, if different scale factors are used, different levels of damage are obtained at the critical angle.
The influence of the angle of incidence of an earthquake has mainly been determined using three-dimensional nonlinear time-history analysis on reinforced concrete frame structures of between one and four stories, not necessarily applying both records simultaneously. This is found in several works [3,8,10,11,12], among others, with increments of incidence angles ranging from 1° to 22.5°. The highest structure analyzed in order to study the angle of incidence had nine stories (Kalkan and Reyes [12]). With this, it was determined that, when performing a nonlinear time-history analysis, the records should be applied in the maximum direction, this being the direction in which there is the greatest linear response of a mass with degrees of freedom in both horizontal directions: the normal direction and that which is parallel to the fault, at sites less than 15 km away from the fault. The recommendation given is based on the low attenuation observed in propagating waves within this range. Although the previous recommendations would not represent the worst case, they would deliver higher demand parameters than usual. Recently, dynamic incremental analysis has gained special importance in evaluating the response of various structural types [13,14,15] or even in determining their seismic design factors [16], but this type of analysis is usually computationally expensive in all its phases.
Many authors have tried to estimate, generally, the least favorable angle of incidence or the response given by it, and to express this through formulas. An example of this has been the procedure applied to reinforced concrete structures (Wilson and Button [17]). Although this procedure is practical in design, as it is based on modal response spectrum analysis, it does not take into account the components of the earthquake when they act on the main structural axis. Meanwhile, Smerby and Der Kiureghian [18] have indicated that the previous method had certain limitations. The problem has continued to be studied by González [19], even applying linear analysis, obtaining relative errors of up to 30%. A formula for determining the critical incidence angle has been proposed by Wilson et al. [20] based on linear response spectrum analysis or modal response spectrum analysis to determine the critical angle, using five load cases and three response spectra (López and Torres [21]).
Response spectra are commonly used in the definition of seismic action, so it is advisable to study their application by explicitly using the definition of directionality (Anastassiadis and Panetsos [22]). Regarding the results, the different types of analysis used tend to significantly affect their deviation from those obtained through conventional analysis. For example, a bridge with curvature in plan studied by Gao et al. [23] using nonlinear time-history analysis, combined with seismic records with incidence angles varying between 0° and 180° in 6° increments, presented variations in force and moments of up to 45% with respect to the conventional analysis. Similar studies [24,25,26] that have addressed the use of different types of analysis present different results regarding the influence of the angle of incidence on the maximum responses of the structures.
Next, some of the cited works are presented in greater detail, which will allow a better understanding of the different approaches that have been applied to the problem.

1.1. Wilson and Button

They consider two response spectra applied at angles of 0° and 90°, evaluate the forces obtained using the CQC combination [17], and subsequently determine the critical angle of incidence by means of the following equation:
t a n   ( 2 θ c r ) = 2 f 0 f 90 1 + α 2 ( f 0 2 f 90 2 ) ( 1 α 2 )
where α is the factor that multiplies the response spectrum and f 0 and f 90 are the responses obtained for an angle of incidence of 0° and 90°, respectively.

1.2. González

In this work, three structures were analyzed with the proposed methodology that consists of calculating the maximum response in each vibration mode using the angle of incidence of the earthquake as a parameter and subsequently combining the results with any modal combination criterion [19]. The displacement and stress results were compared using nonlinear time-history analysis and modal response spectrum analysis as a basis. It was concluded that the SRSS combination presented the best results in conjunction with the proposed method.

1.3. López and Torres

The authors propose addressing the problem of directionality through modal response spectrum analysis, solving five load cases [21].
The proposed method consists of the following:
  • Solving the five spectral modal load cases to obtain the response parameters.
  • Using Equation (3) to obtain the critical angle of incidence.
  • Using Equation (2) to obtain the maximum responses for each critical angle of incidence.
It should be noted that each parameter can have a different critical angle, where R is the peak response of the chosen parameter, C is the participation coefficient, and θ c r i t is the critical incidence angle, calculated using the following equations:
R ( θ ) = { [ ( R 1 x ) 2 + ( R 2 y ) 2 ] c o s 2 ( θ ) + [ ( R 1 y ) 2 + ( R 2 x ) 2 ] s i n 2 ( θ ) + 2 s i n   ( θ ) c o s ( θ ) [ i j C i j R i 1 x R j 1 y i j C i j R i 2 y R j 2 x ] + ( R 3 ) 2 } 1 2
θ c r i t = 1 2 t a n 1 ( 2 i j C i j [ R i 2 y R j 2 x R i 1 x R j 1 y ] ( R 1 y ) 2 + ( R 2 y ) 2 ( R 1 x ) 2 ( R 2 y ) 2 )
In Equations (2) and (3), R j 2 x and R i 2 y are the peak modal responses obtained along the structural reference axes x and y, respectively. Finally, R 3 is the peak modal response in the vertical axis z.

1.4. Menun and Der Kiureghian

The authors propose the use of the CQC3 combination as an alternative to the multicomponent combination (instead of the use of SRSS, CQC, and rules of 30% or 40%) [27]. Additionally, a formula is proposed for the calculation of the critical angle, where k and l represent the axes and the seismic components considered, α is the coefficient of participation related between the modes and the indicated direction, ρ corresponds to the correlation coefficient between modes, and γ is the ratio between the design spectra used. Finally, S k i correspond to the kth principal axis of the ground motion. The equations are presented below:
R k 2 = i j ρ i j α k j α k i S k i S k j
R k l 2 = i j ρ i j α l j α k i S k i S l j
θ c r = 1 2 t a n 1 [ 2 γ R 12 R 1 2 1 γ 2 R 2 2 ]

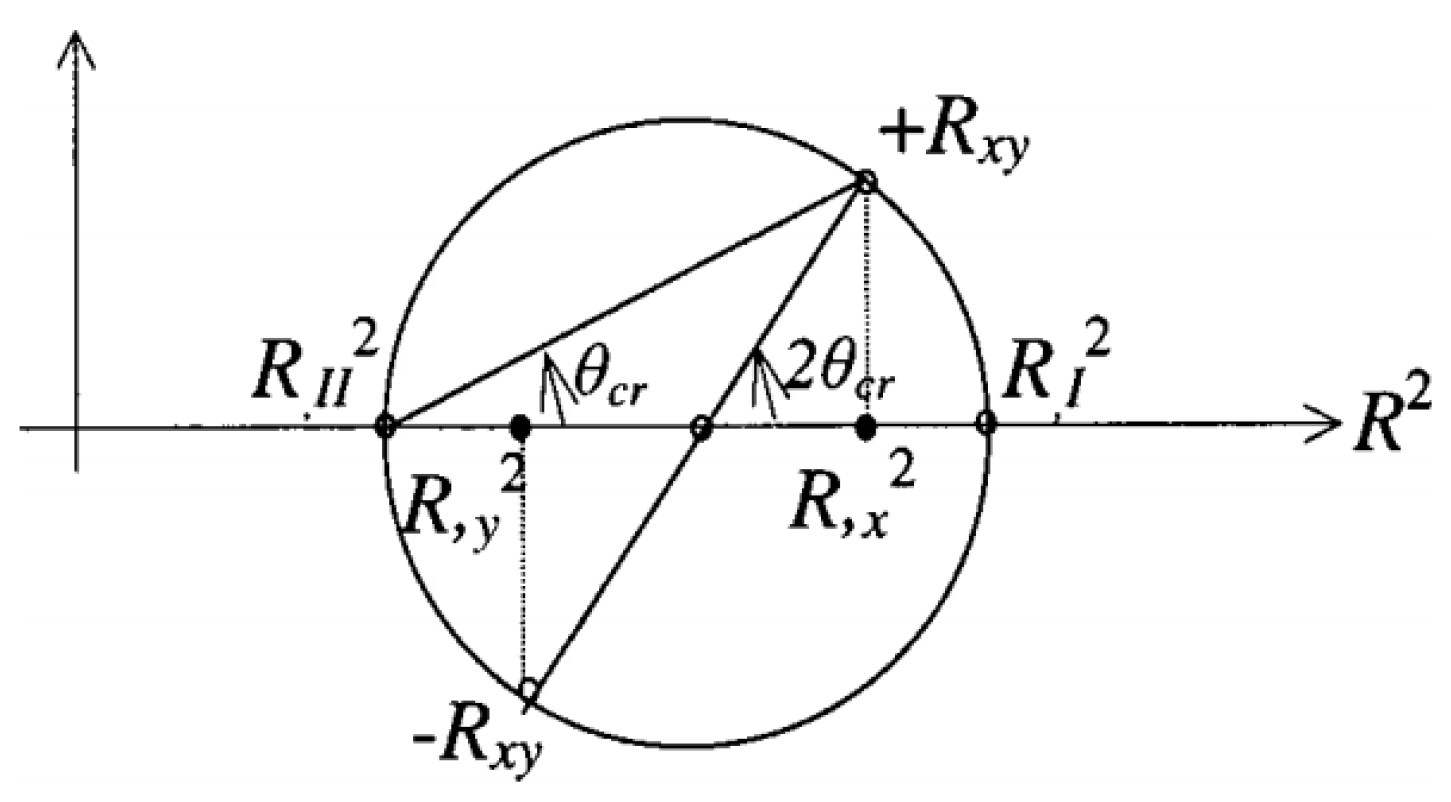
1.5. Anastassiadis and Panetsos

This method is based on previously published considerations presented by Penzien and Watanabe [
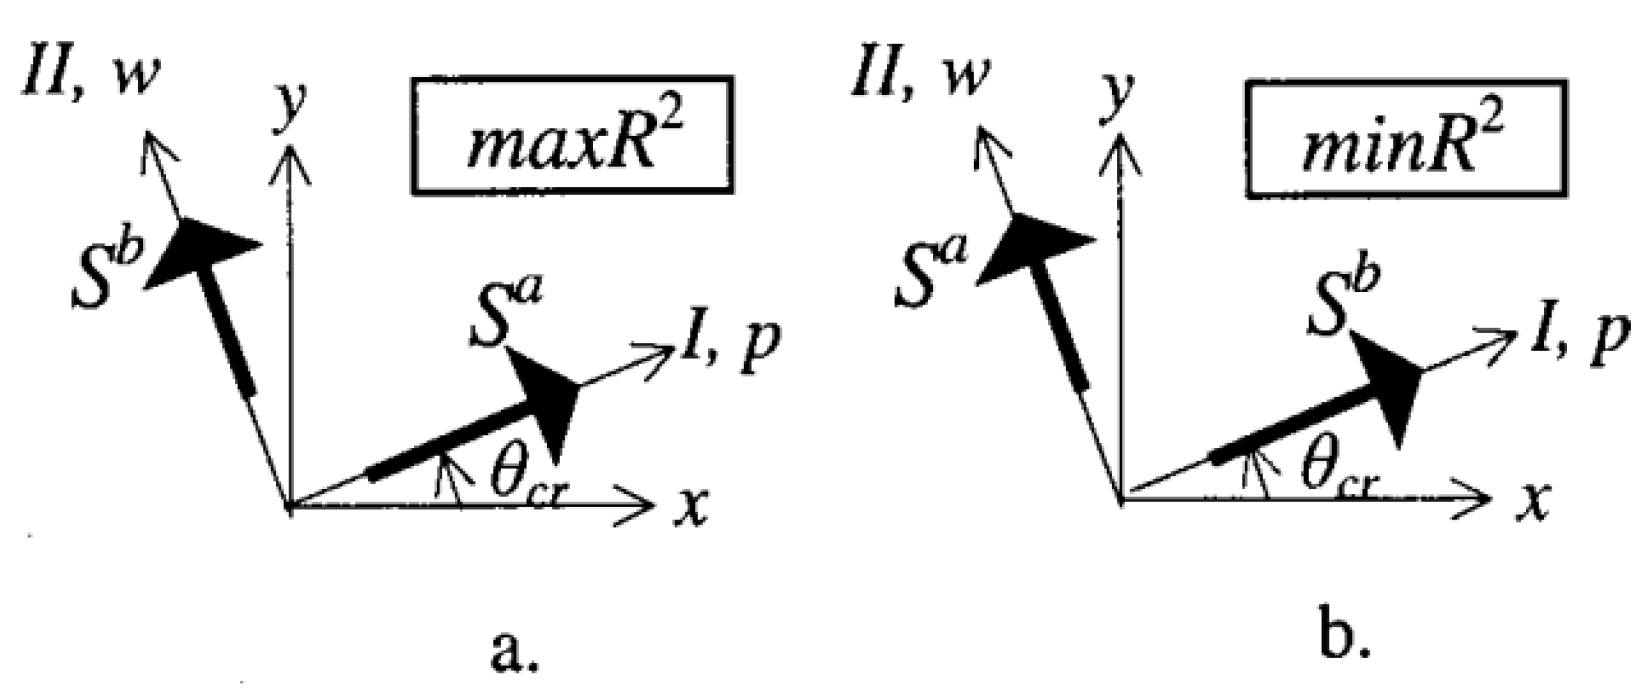
24], which are used by means of the response spectra when considering the existence of a major axis in the direction of the epicenter, intermediate transversal, and minor vertical, this being valid only when the effects of proximity to the fault are absent. The proposed seismic design is based on determining the critical orientation that provides the greatest response, on calculating maximum and minimum response values and on the application of the extreme stress or extreme force method to determine the most unfavorable combination of the resulting stresses acting on specific structural elements [22]. To determine the critical direction, the reference systems indicated in Figure 1 and the following equations should be used:
θ c r = { θ 0 = 1 2 t a n 1 ( 2 R x y R x 2 R y 2 ) θ 0 + π / 2
max R 2 = ( R x 2 + R y 2 ) 2 + ( ( ( R x 2 + R y 2 ) / 2 ) 2 + R x y 2 ) 0.5
min R 2 = ( R x 2 + R y 2 ) 2 ( ( ( R x 2 + R y 2 ) / 2 ) 2 + R x y 2 ) 0.5
R x 2 = R x a 2 + R y b 2 = i j ε i j ( R i , x a R j , x a + R i , y b R j , y b )
R y 2 = R x b 2 + R y a 2 = i j ε i j ( R i , x b R j , x b + R i , y a R j , y a )
R x y = R x y , a R x y , b = i j ε i j ( R i , x a R j , y a R i , x b R j , y b )
In Equations (10)–(12), ε i j represents the correlation coefficients between the modes i and j . A graphical representation of the reactions calculated using Mohr’s circle is shown in Figure 2.

1.6. Dongsheng et al.

This method corresponds to a simplified version of the CQC3 method. The similar method SRSS3 was introduced for the first time by Gao et al. [23], who postulate that this method presents considerable errors if there is a high correlation between the vibration modes of the structure, otherwise it gives similar results to the CQC3 method. The equations presented below takes into account the proportionality between the design spectra in each direction of analysis [28].
R 1 x = i R i 1 x R i 1 x
R 1 y = i R i 1 y R i 1 y
θ = 1 2 t a n 1 ( 2 i R i 1 x R i 1 y ( R 1 x ) 2 ( R 1 y ) 2
R ( θ ) = ( [ ( R 1 x ) 2 + ( γ R 1 y ) 2 ] c o s 2 ( θ ) + [ ( R 1 y ) 2 + ( γ R 1 x ) 2 ] s i n 2 ( θ ) + 2 s i n   ( θ ) c o s   ( θ )   ( 1 γ 2 ) [ i R i 1 x R i 1 y ] + R 3 2 ) 1 / 2

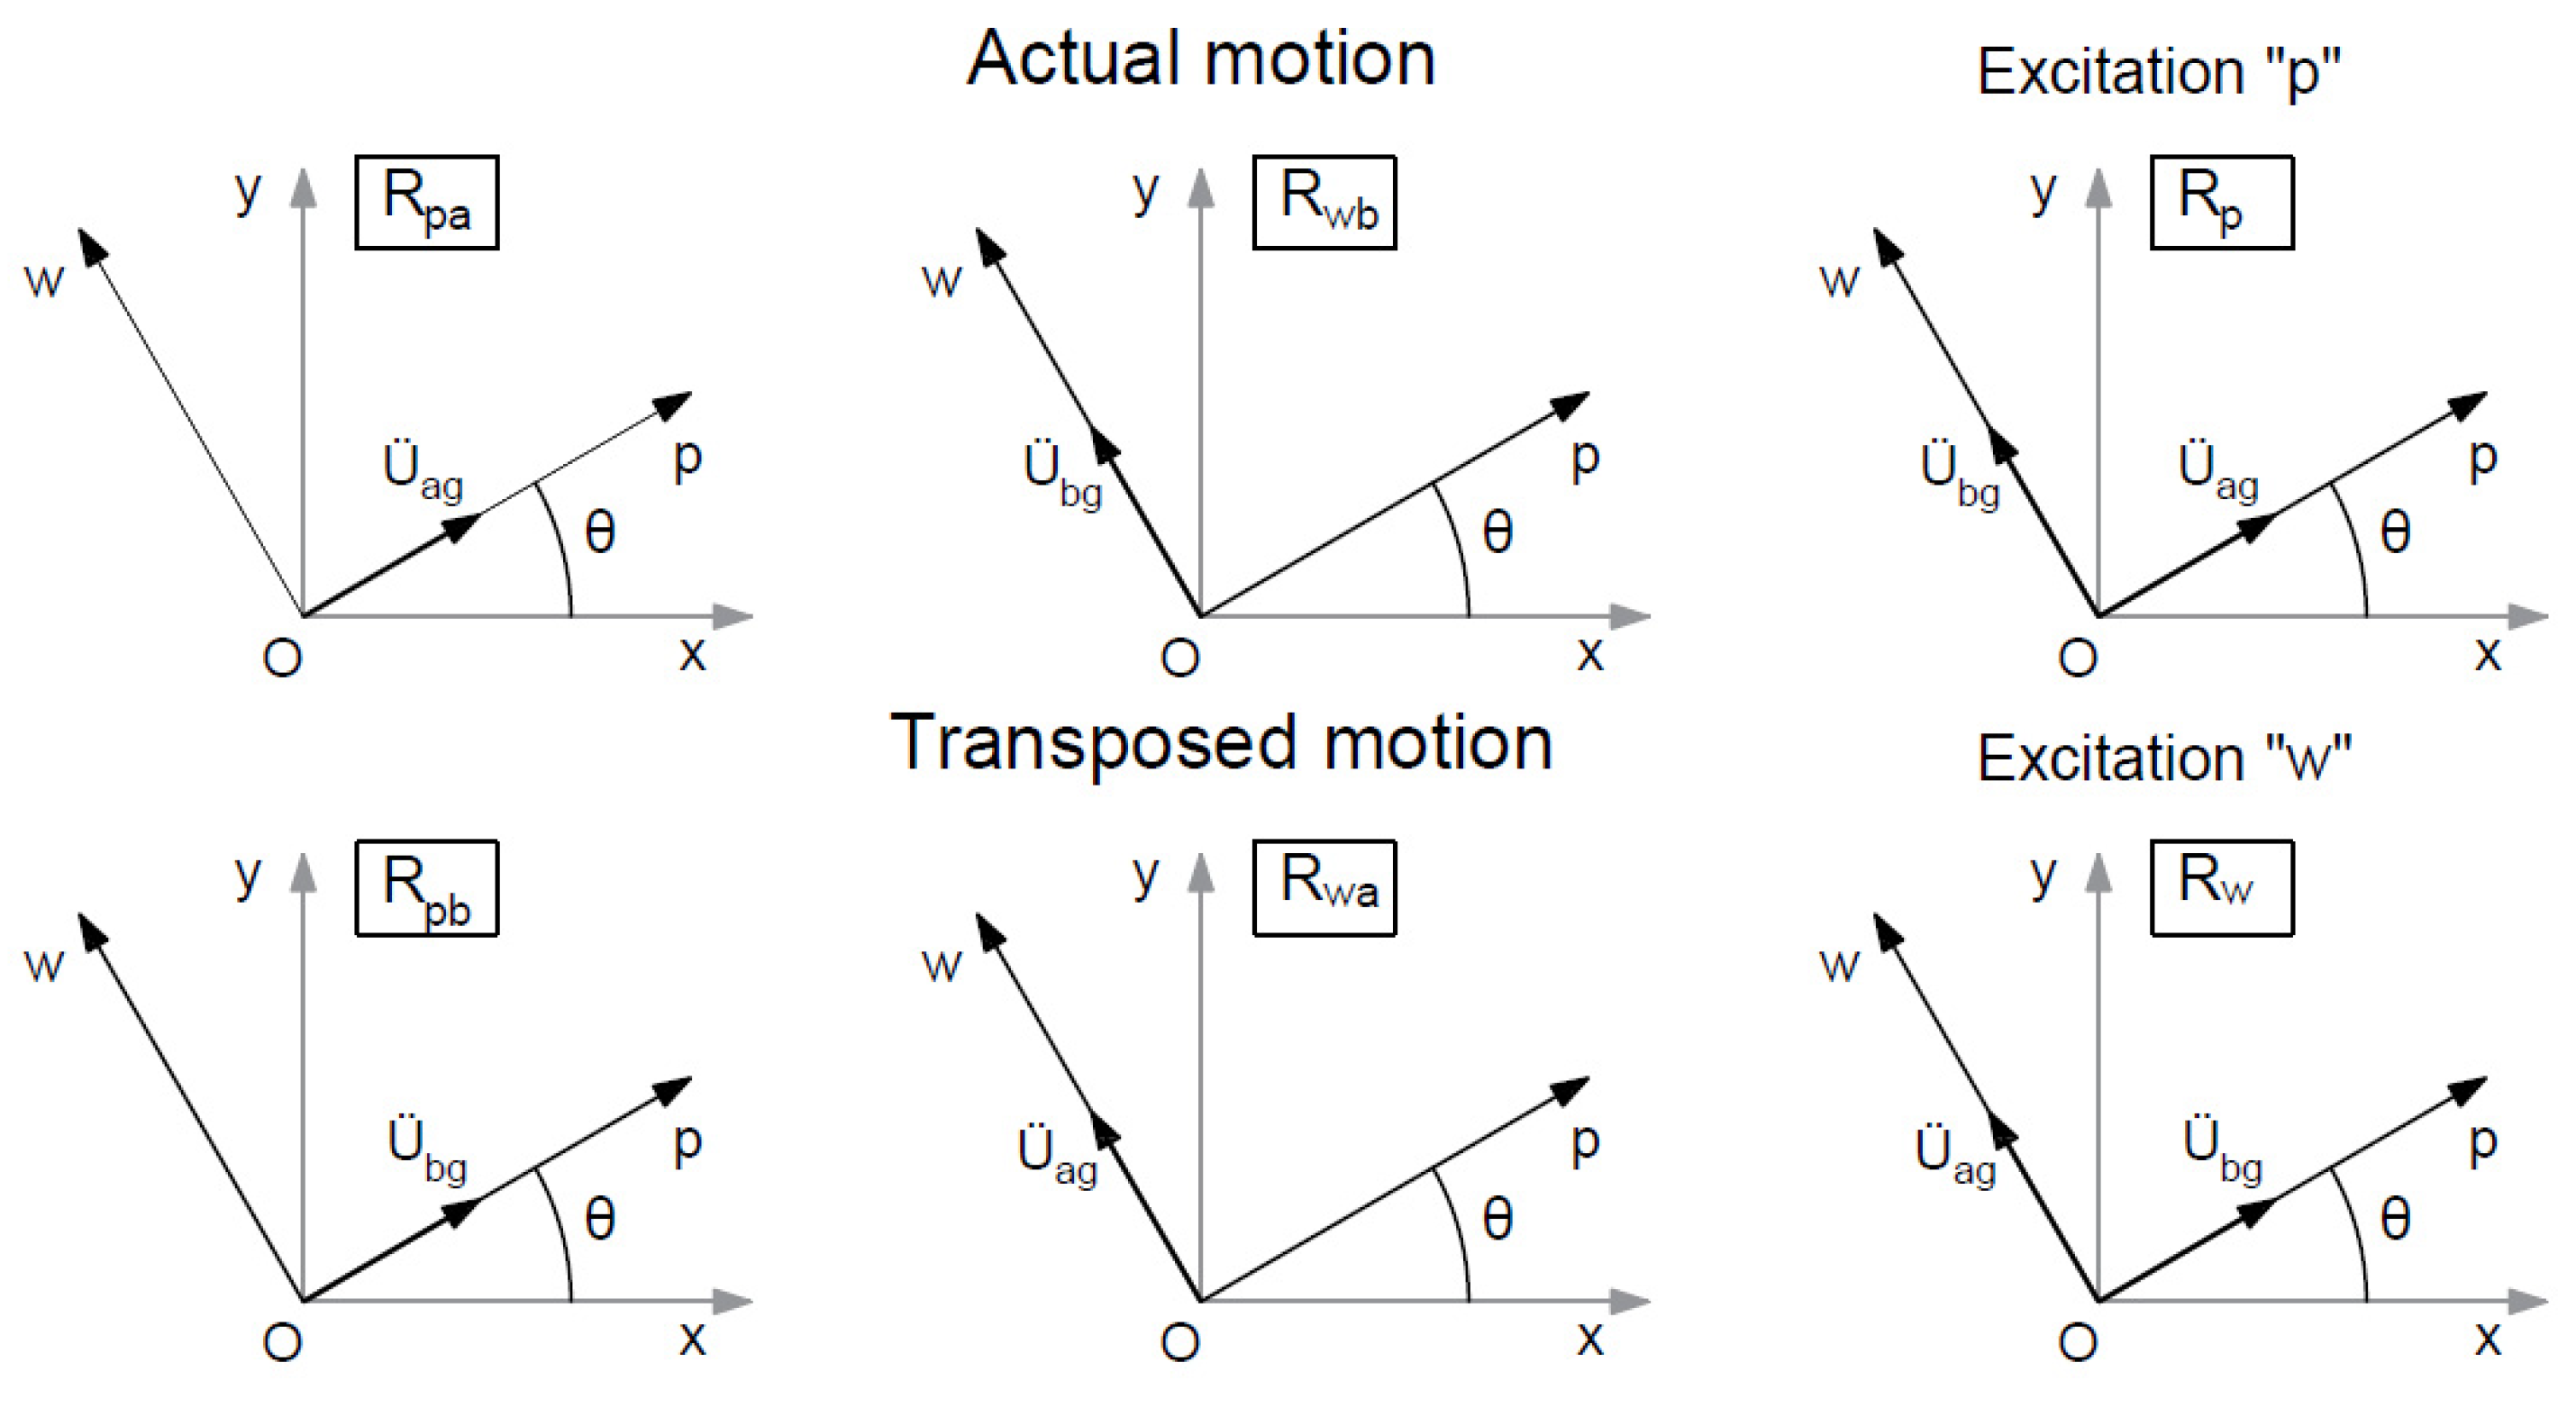
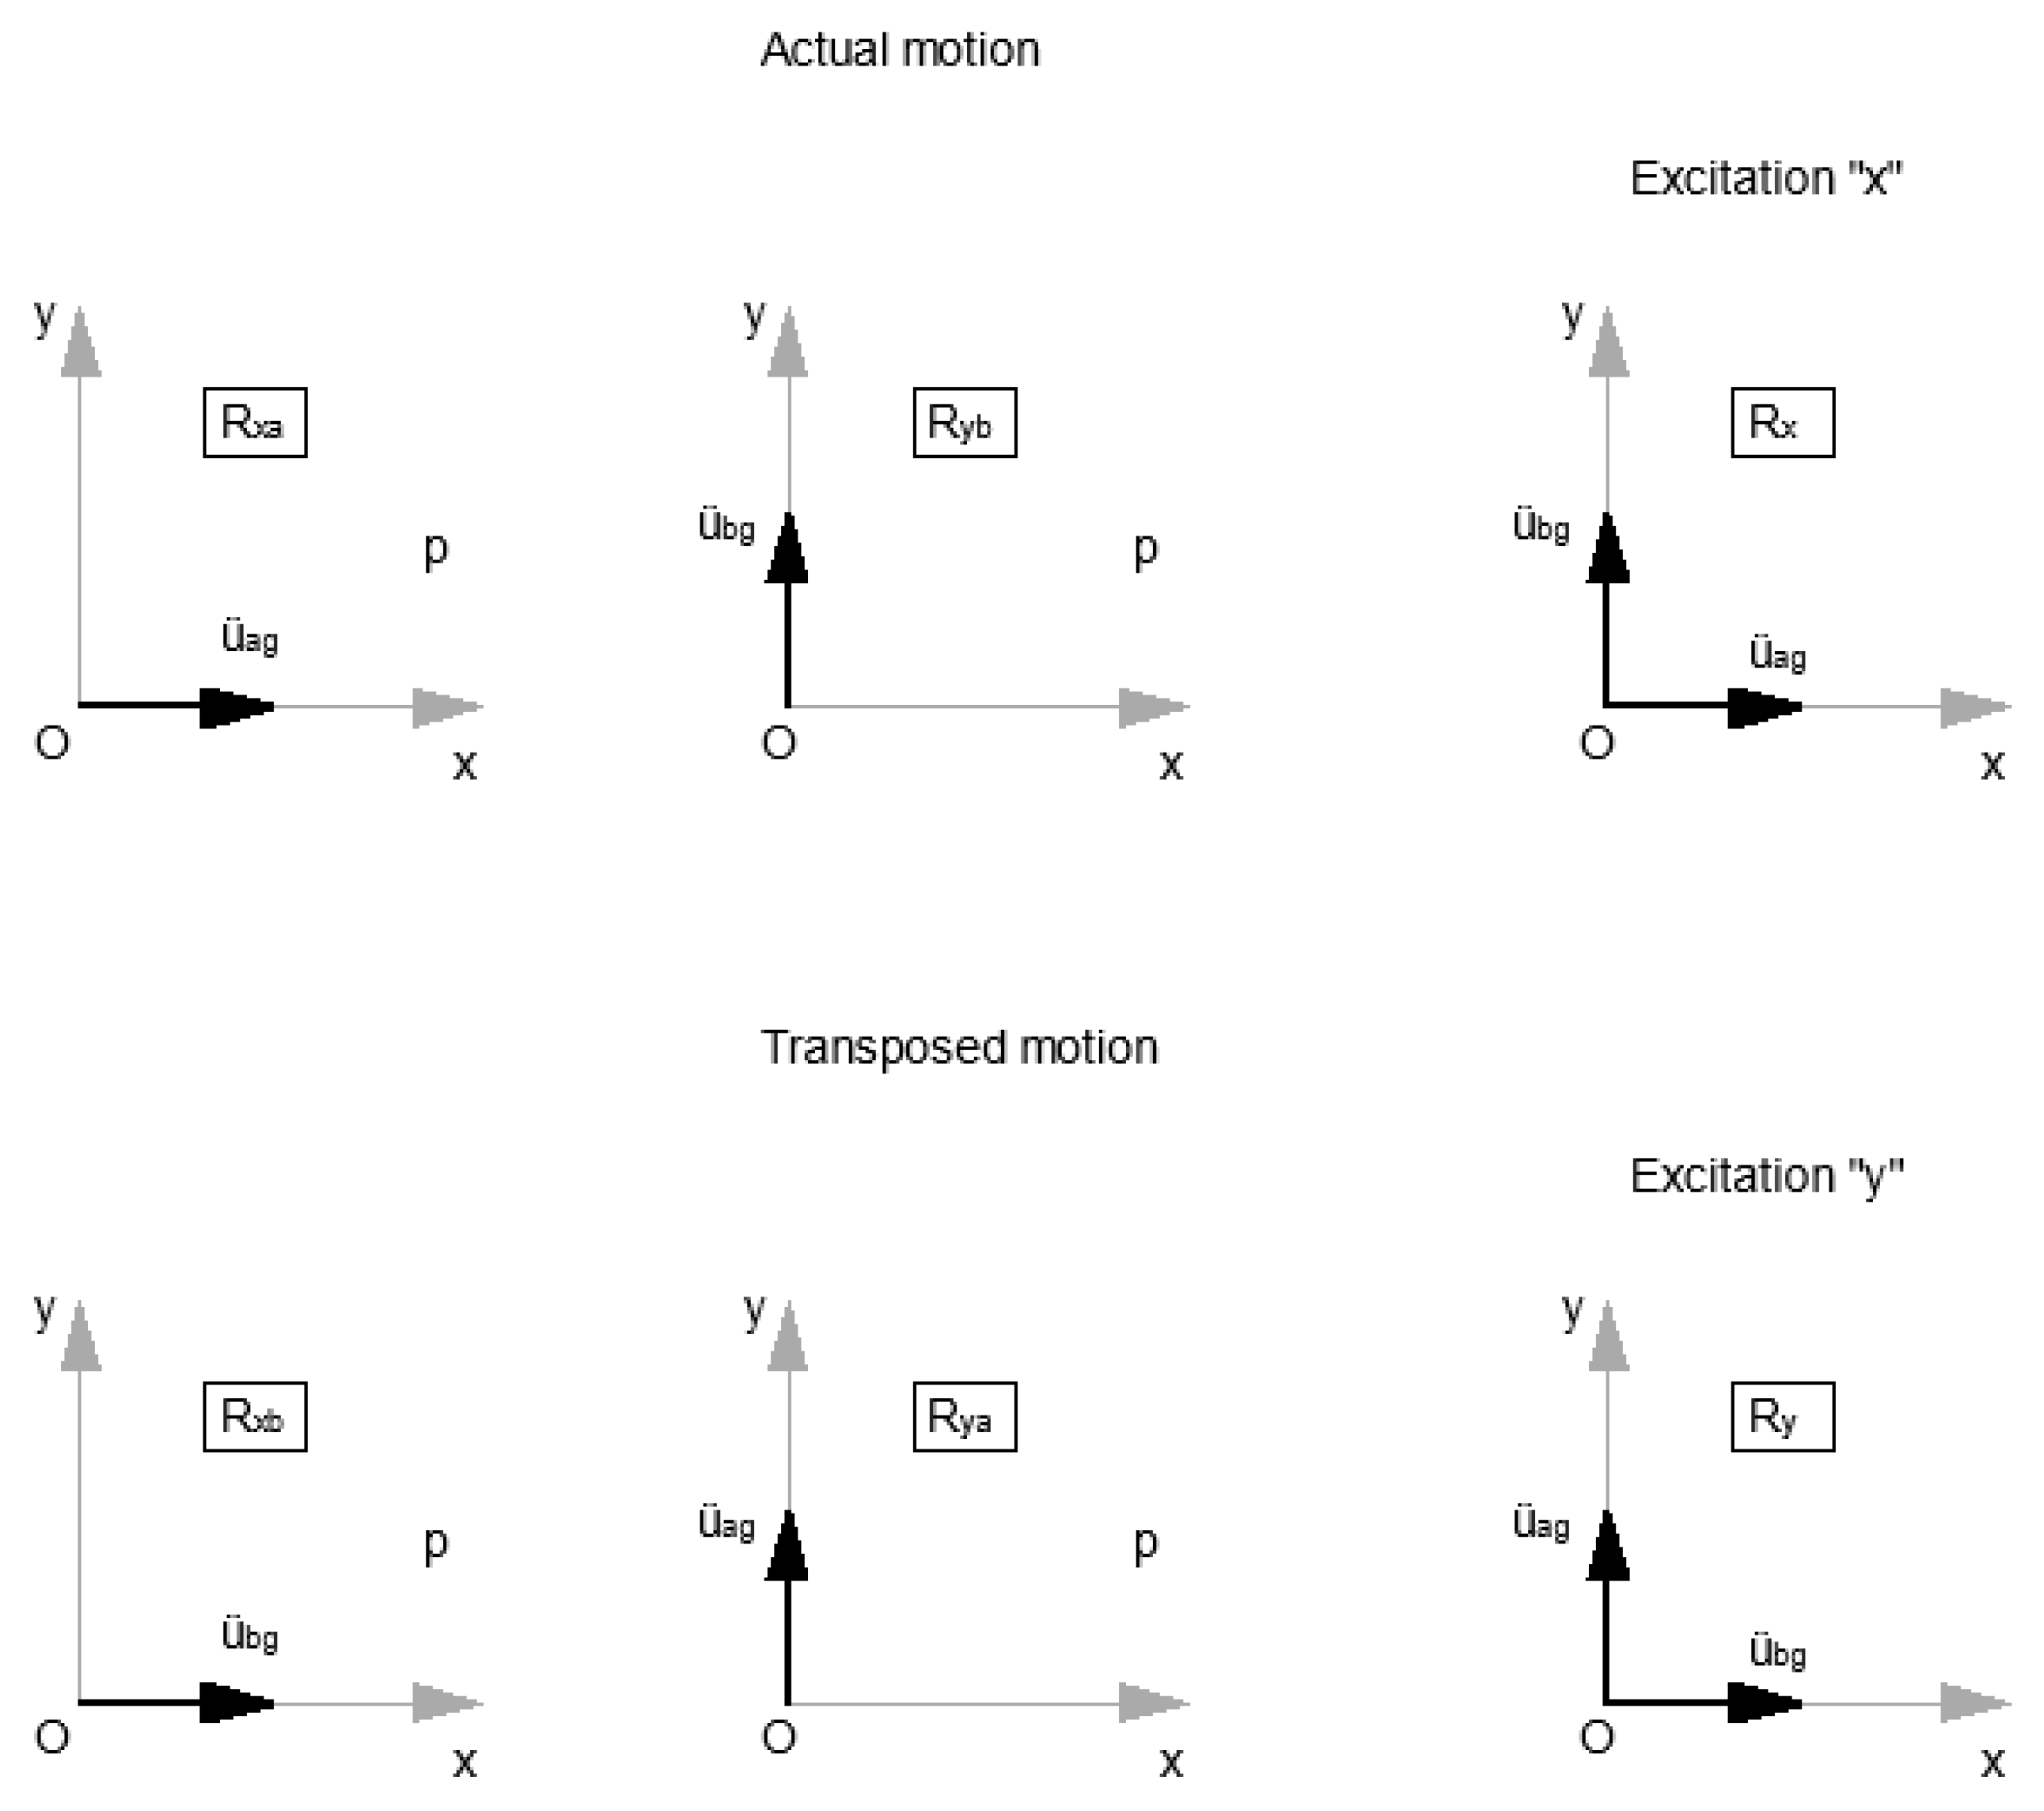
1.7. Athanapoulou et al.

The authors presented an analytical formula to determine the critical incidence angle for structures subjected to three correlated seismic components. This implies solving three time-history cases (one for each component) without the use of the model of Penzien and Watanabe [24] and assuming linear behavior, as response spectra cannot be used because correlation of the records is assumed. The object of the study was an irregular structure with five stories [26]. Figure 3 and Figure 4 show the reference axes considered and a graphic representation of the reactions indicated.
The equations necessary for the calculation of the critical angle are presented below, where θ c r 1 corresponds to the angle for which the maximum response is obtained and θ c r 2 to the minimum response of the envelope R 0 , both taking into account the signs.
R 0 ( t c r ) 2 = R x ( t c r ) 2 + R y ( t c r ) 2
θ c r 1 = t a n 1 ( R y ( t c r 1 ) R x ( t c r 1 ) )
θ c r 2 = t a n 1 ( R y ( t c r 2 ) R x ( t c r 2 ) ) π
where t c r 1 and t c r 2 are the critical times when the maximum positive and minimum negative displacements occur.

1.8. Lagaros

Multidirectional incremental dynamic analysis (MIDA), using pairs of records and incident angles generated by Latin hypercube sampling (LHS), has been proposed to take into account the variability of seismic excitation and the angle of incidence, focused on the implementation of incremental dynamic analysis for performance-based design [29]. One symmetric and one asymmetric structure (both of three stories) were analyzed, considering fifteen records and an incidence angle between 0° and 180°, uniformly distributed for the generation of the sample using LHS. Subsequently, the MIDA and its respective representative MIDA curve were performed.
To perform the MIDA, intensity measurement must be selected, such as peak ground velocity (PGA), peak ground acceleration (PGV), a spectrum related to the damping and the first period, and so on. Then, the engineering demand parameter must be determined, which was categorized into maximum deformation, cumulative damage, and global parameters [30]. The interstory drift measurements are based on maximum displacements, and are used in this analysis as there is an established relationship between such measurements and the performance of the structures: immediate occupation, life safety, and collapse prevention (FEMA 273 [31]).
In summary, the method consists of the following:
  • Selection of records;
  • Selection of intensity;
  • Selection of engineering demand parameter;
  • Sample generation using LHS;
  • Carrying out MIDA and its curves.

1.9. Summary of the Studies That Analyze the Influence of the Angle of Incidence

The studies shown so far include relevant procedures that are directly applied to determine the seismic response of structures, either at the regulatory level [27] or at the level of research carried out on structures whose importance or irregularity requires more refined procedures of analysis [29]. On the other hand, these procedures serve as a basis for questioning the regulatory application of address combinations [19,21,26], among which is the combination of 100% and 30%, or the way in which the results are combined [19,22,28] to obtain the stresses that will be applied in the structural design. These studies have served as the basis for determining the influence of the seismic action’s incidence angle on different structural types that are presented below. A numerical study will be applied to a set of representative archetypes of various structural typologies, which will make it possible to obtain the maximum demands in displacements (produced by means of a nonlinear time-history analysis combining the two components of strong earthquakes that occurred in Chile), and in which the angle of incidence has been allowed variation in order to determine under which angle the highest demands are reached.

2. Methodology

The following steps summarize the methodology applied to determine the influence of the angle of incidence on the response of structures subjected to the seismic action typified by accelerograms.
  • Definition of the archetypes to be analyzed, representative of the structural typologies conventionally used in reinforced concrete buildings.
  • Selection of demand parameters, in this case corresponding to roof displacement and interstory drift.
  • Selection of records to be used, considering strong earthquakes recorded in Chile.
  • Matching of the selected records with respect to the elastic design spectrum for a type-B soil (fractured rock, stiff or dense soil) and reduction of the duration by means of Arias intensity.
  • Application of transverse and longitudinal component of each record pair of components simultaneously to the archetypes.
  • Normalization of the results obtained based on the maximum response obtained for the archetype and record in question, considering all the angles of incidence used.
  • Combination of the engineering demand parameters by SRSS, as shown in the following equation:
    R i , θ , j = [ ( max | R i , θ , x | ) 2 + ( max | R i , θ , y | ) 2 ] 0.5
    where m á x ( R i , θ , x ) is the maximum reaction for archetype i in the angle of incidence θ in direction x , or y in the case of m á x ( R i , θ , y ) .
  • Calculation of the demand parameters for each archetype as the average of the maximums given the records used.

3. Definition of Case Studies

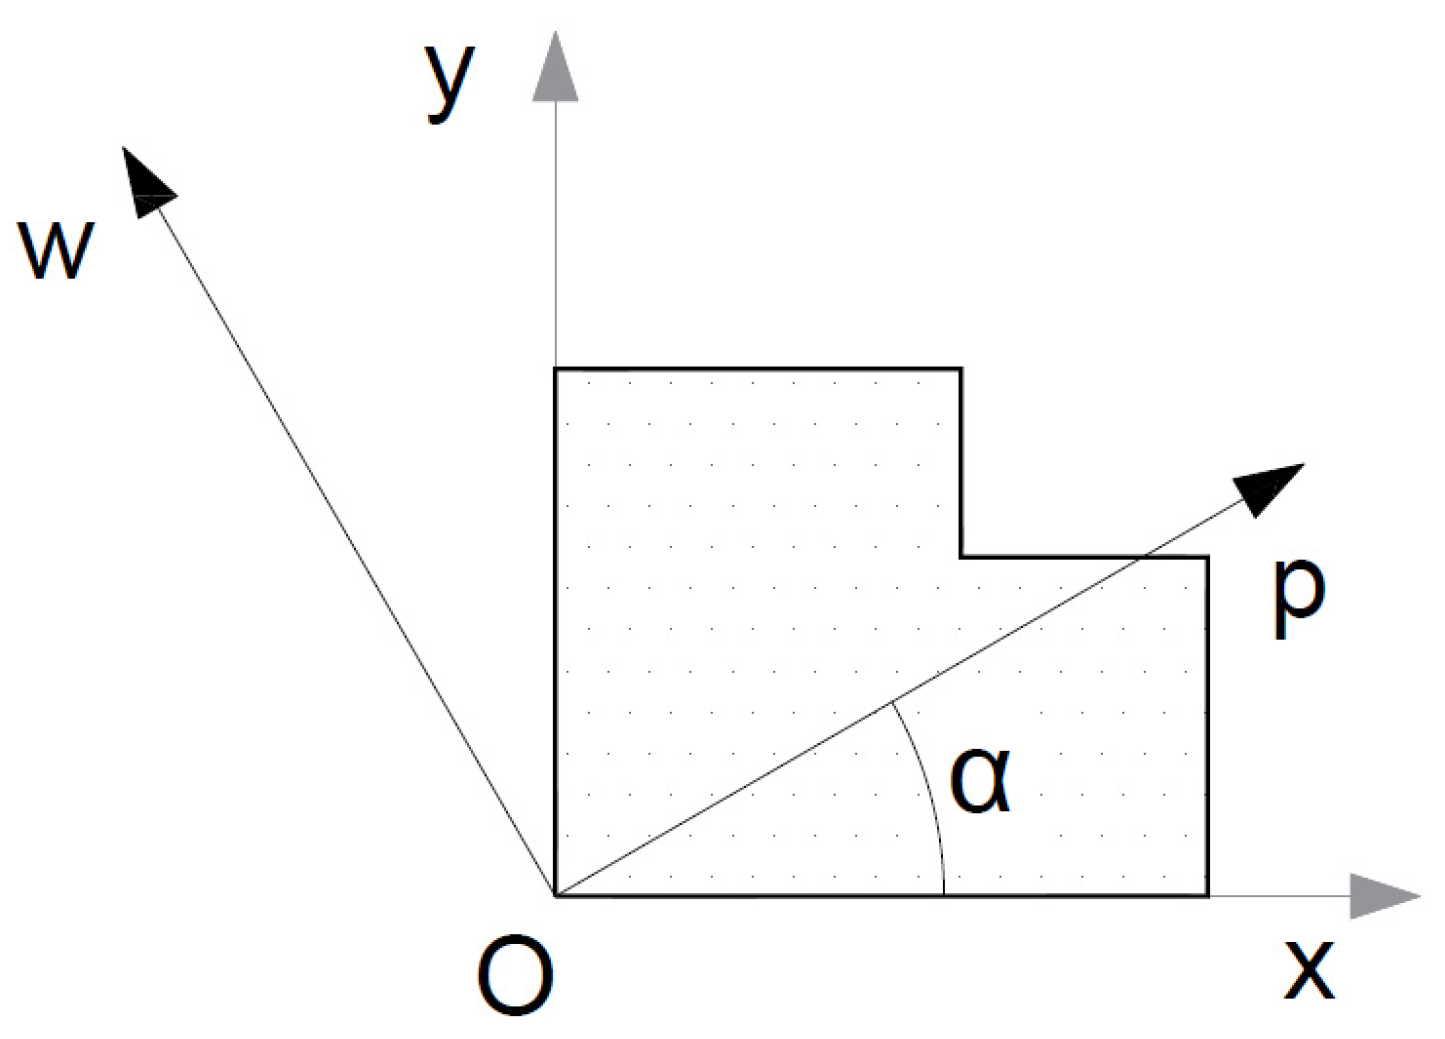
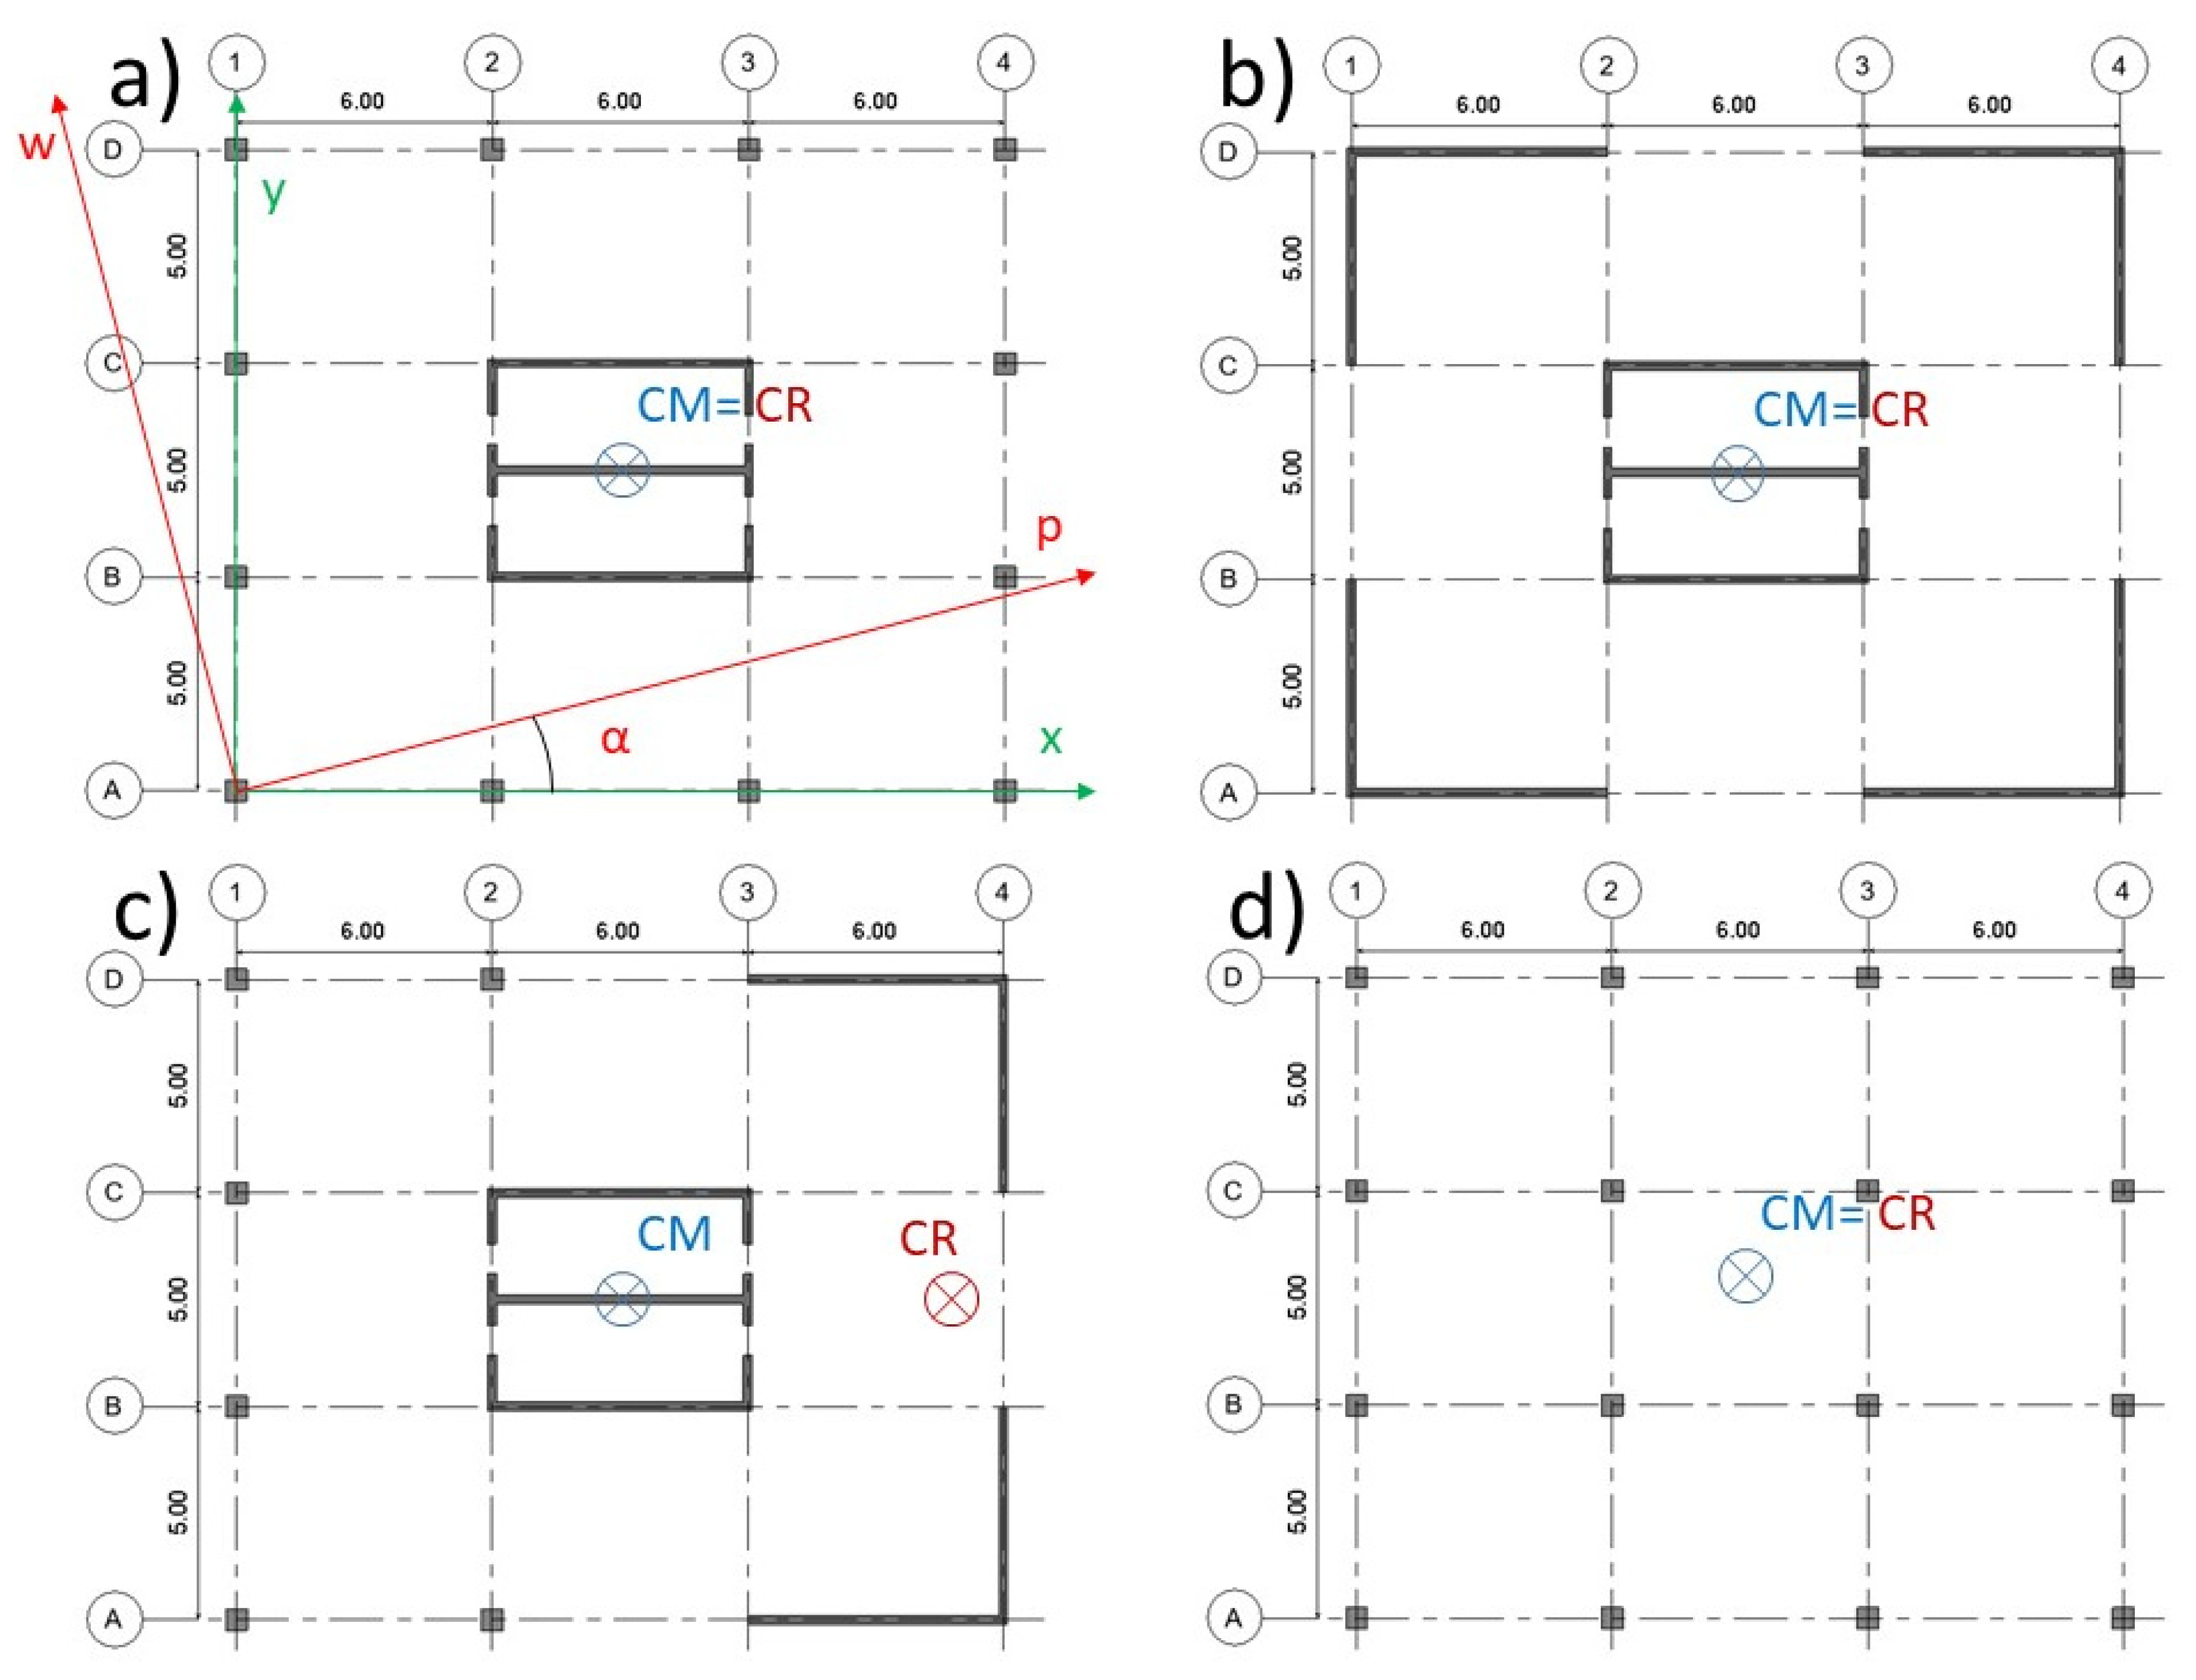
To study the combined effect of the angle of incidence of the seismic action and the symmetry of the structures, a set of archetypes was defined in which different structural typologies were used that gave rise to symmetric and asymmetric configurations. It is important to clarify that the symmetry being studied refers to the orientation plane of the structural axes ( x and y ), as asymmetry in elevation (with respect to the z axis) is outside the scope of this study. The conventional axes found in the literature (shown in Figure 5) were used as reference axes, where x and y correspond to the orthogonal axes that define the structure and that are commonly used in its design and analysis. Meanwhile, w and p are the axes upon which the pair of records was applied to perform the nonlinear time-history analysis, with w being the longitudinal component and p the transverse component. The pair of components of each record was applied with a variation at every 22.5°, making a sweep between the 0° position and the 360° position.
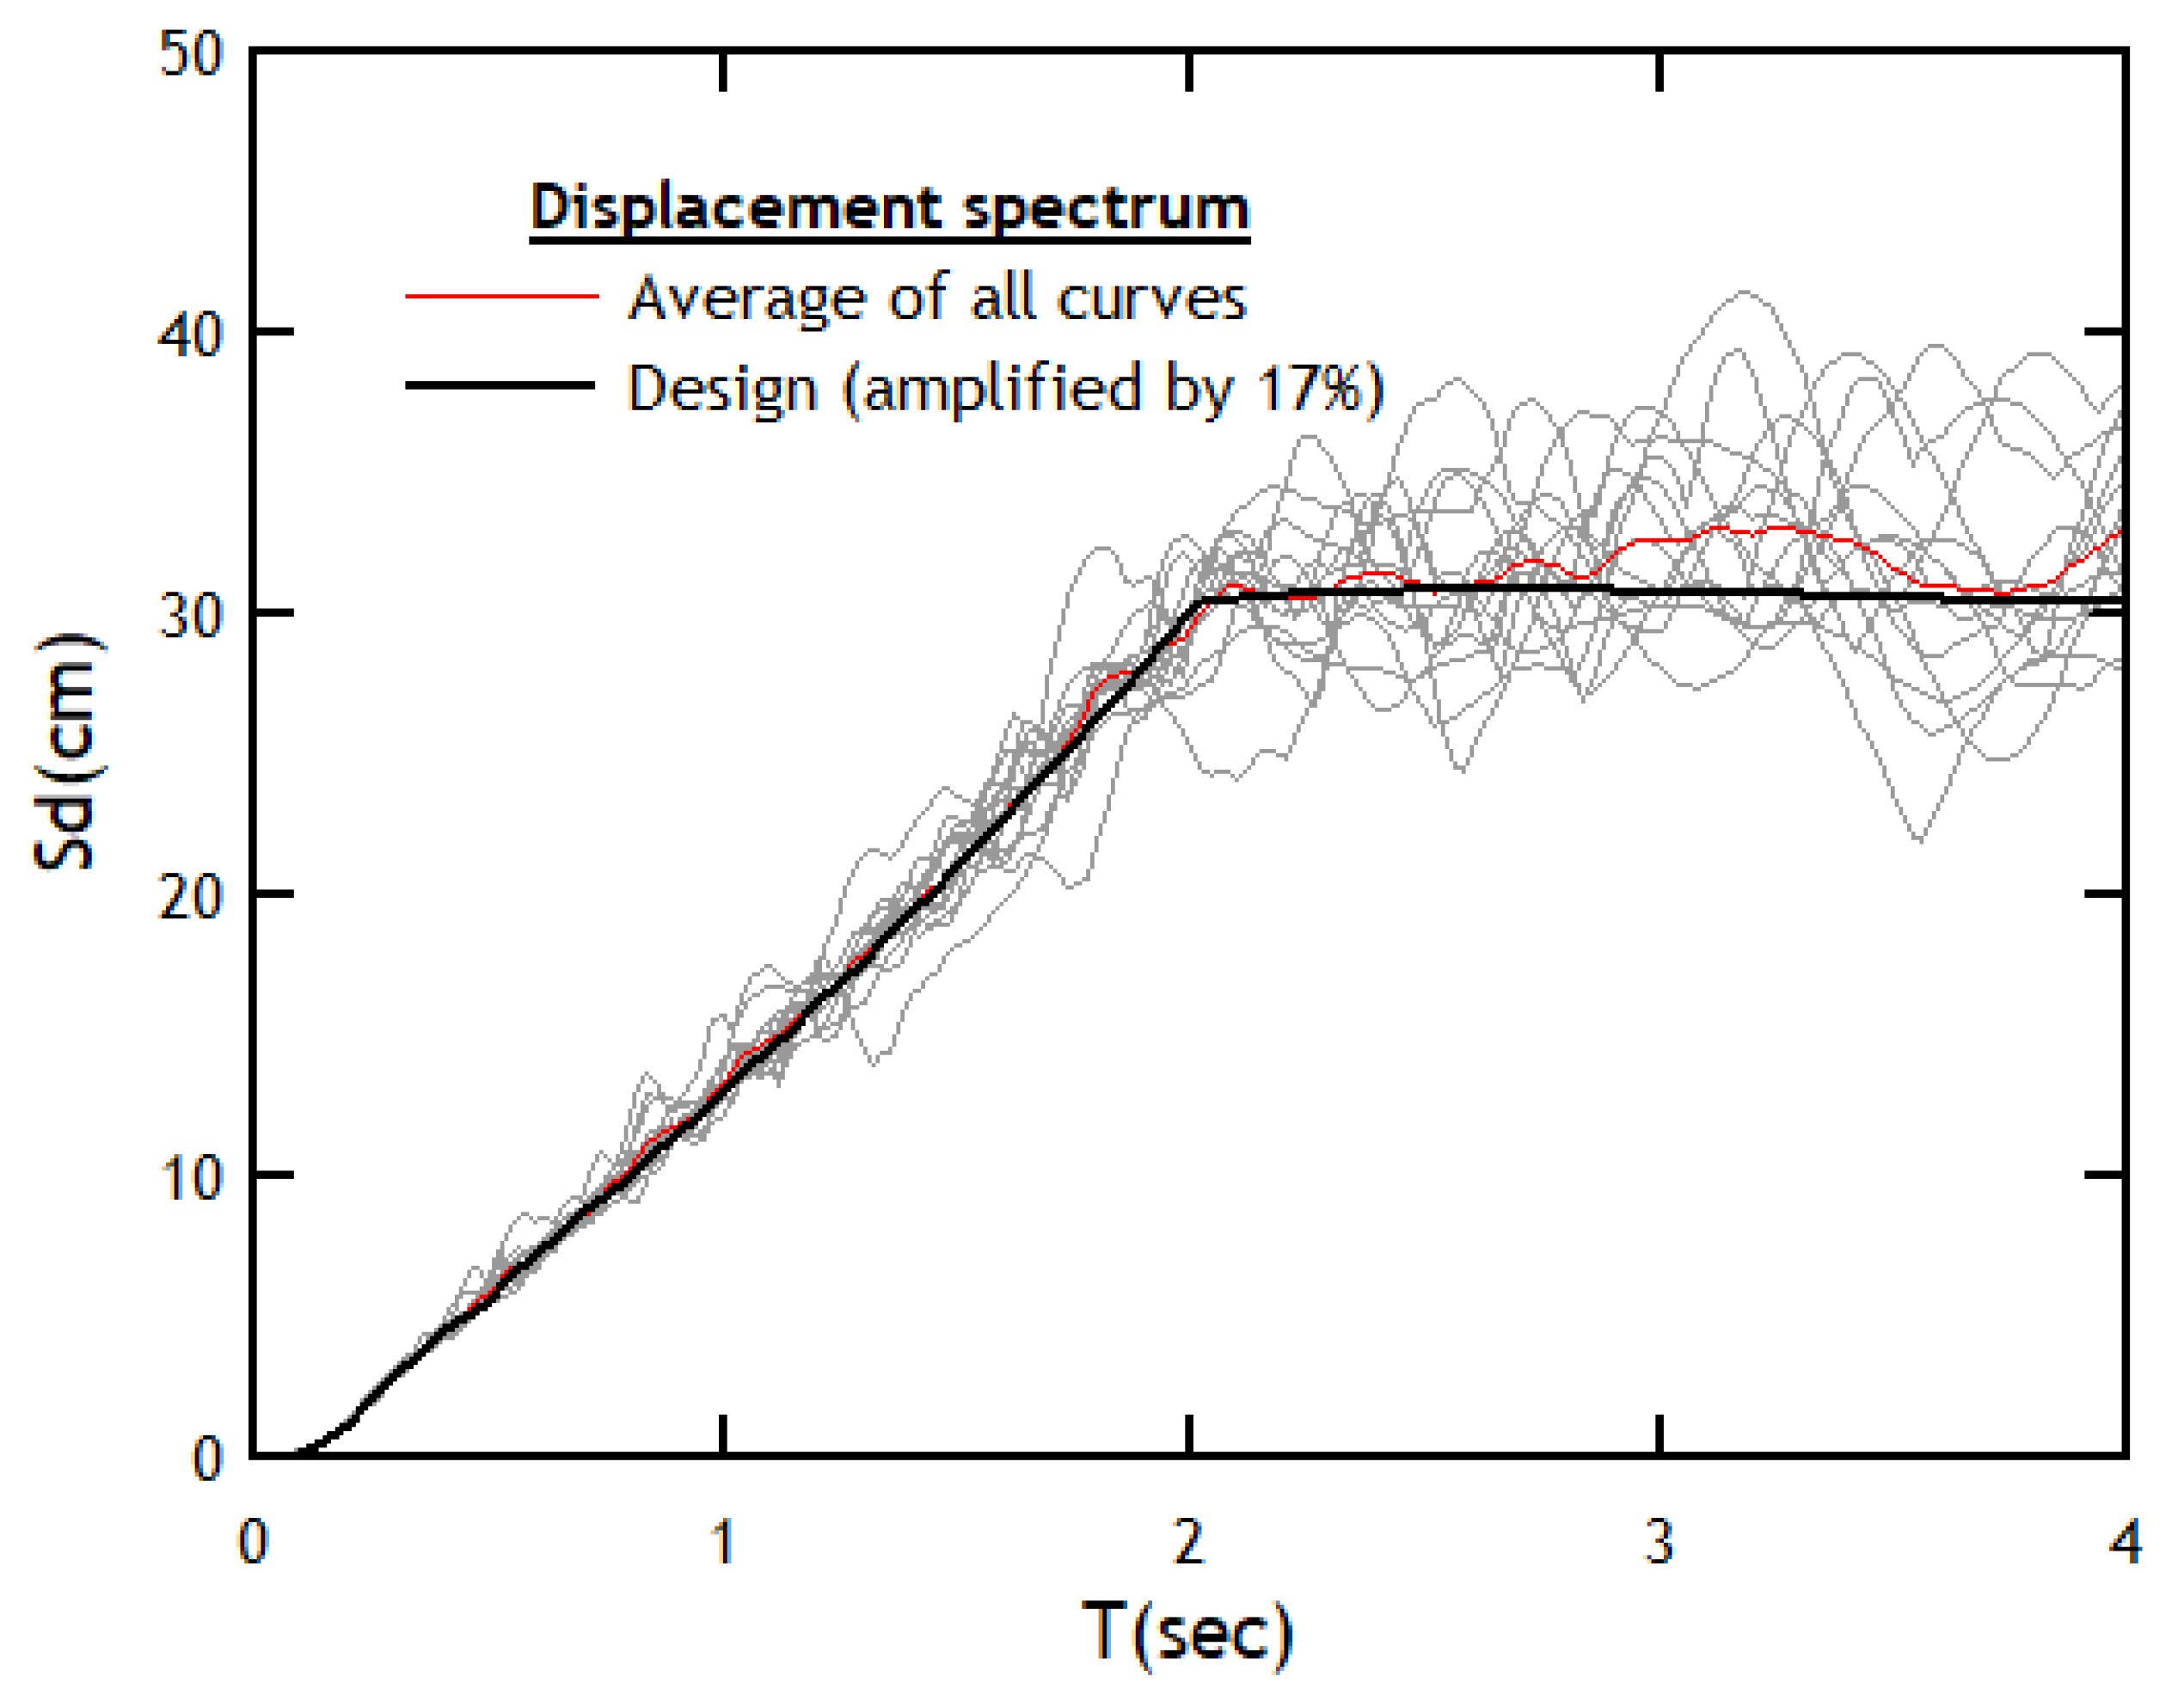
A set of strong motions recorded in Chile, which have been used in a recent study [32], were used to perform the nonlinear analysis; the information of the records is summarized in Table 1. A matching process was carried out, considering a Type-B soil (fractured rock, stiff or dense soil) characterized by shear wave velocity greater than 500 m/s, modifying the records so that the average of the combined displacement spectra for all pairs of records is not less than 1.17 times the elastic spectrum of displacements of the Chilean seismic code NCh433 [33], according to the procedure defined by Achisina [34]. The above spectrum was determined for a high level of seismic hazard (0.4 g). The seismic records were matched using the SeismoMatch software [35], which allows for the ordinates of the resulting response spectra to be adjusted to the ordinates of a spectrum specified by the user. The algorithm developed by Al Atik and Abrahamson [36], available in the software, was used. The results of the pairing process are shown in Figure 6. The significant duration of the seismic records was reduced according to the Arias intensity [37], taking into account the section equivalent to 5% to 95% of the earthquake intensity, obtaining records with different duration, with this being a variable that affects the seismic response of low-rise buildings [38].
The structural archetypes proposed for the analysis suppose a representation of certain specific conditions typical of real structures [39,40]. The archetypes represent buildings with five stories, with spacing between stories of 3 m; a floor plan of 18 × 15 m with four axes distributed every 6 m in the x axis and four every 5 m in the y axis; the sections of the columns are 0.5 × 0.5 m and the walls are 0.2 m thick; the beams used have sections of 0.30 m by 0.60 m; and the slabs are 0.15 m thick (see Figure 7). A residential use of the buildings was considered. The structural elements were designed following the procedures contained in the current versions of the Chilean regulations. Finite elements with distributed plasticity were used, modeling concrete with the model proposed by Mander et al. [41] and reinforcing steel with the Menegotto and Pinto model [42]. The slabs were modeled as rigid elements. The buildings were modeled and analyzed using the SeismoStruct software [43]. The design characteristics of the element materials are summarized in Table 2.
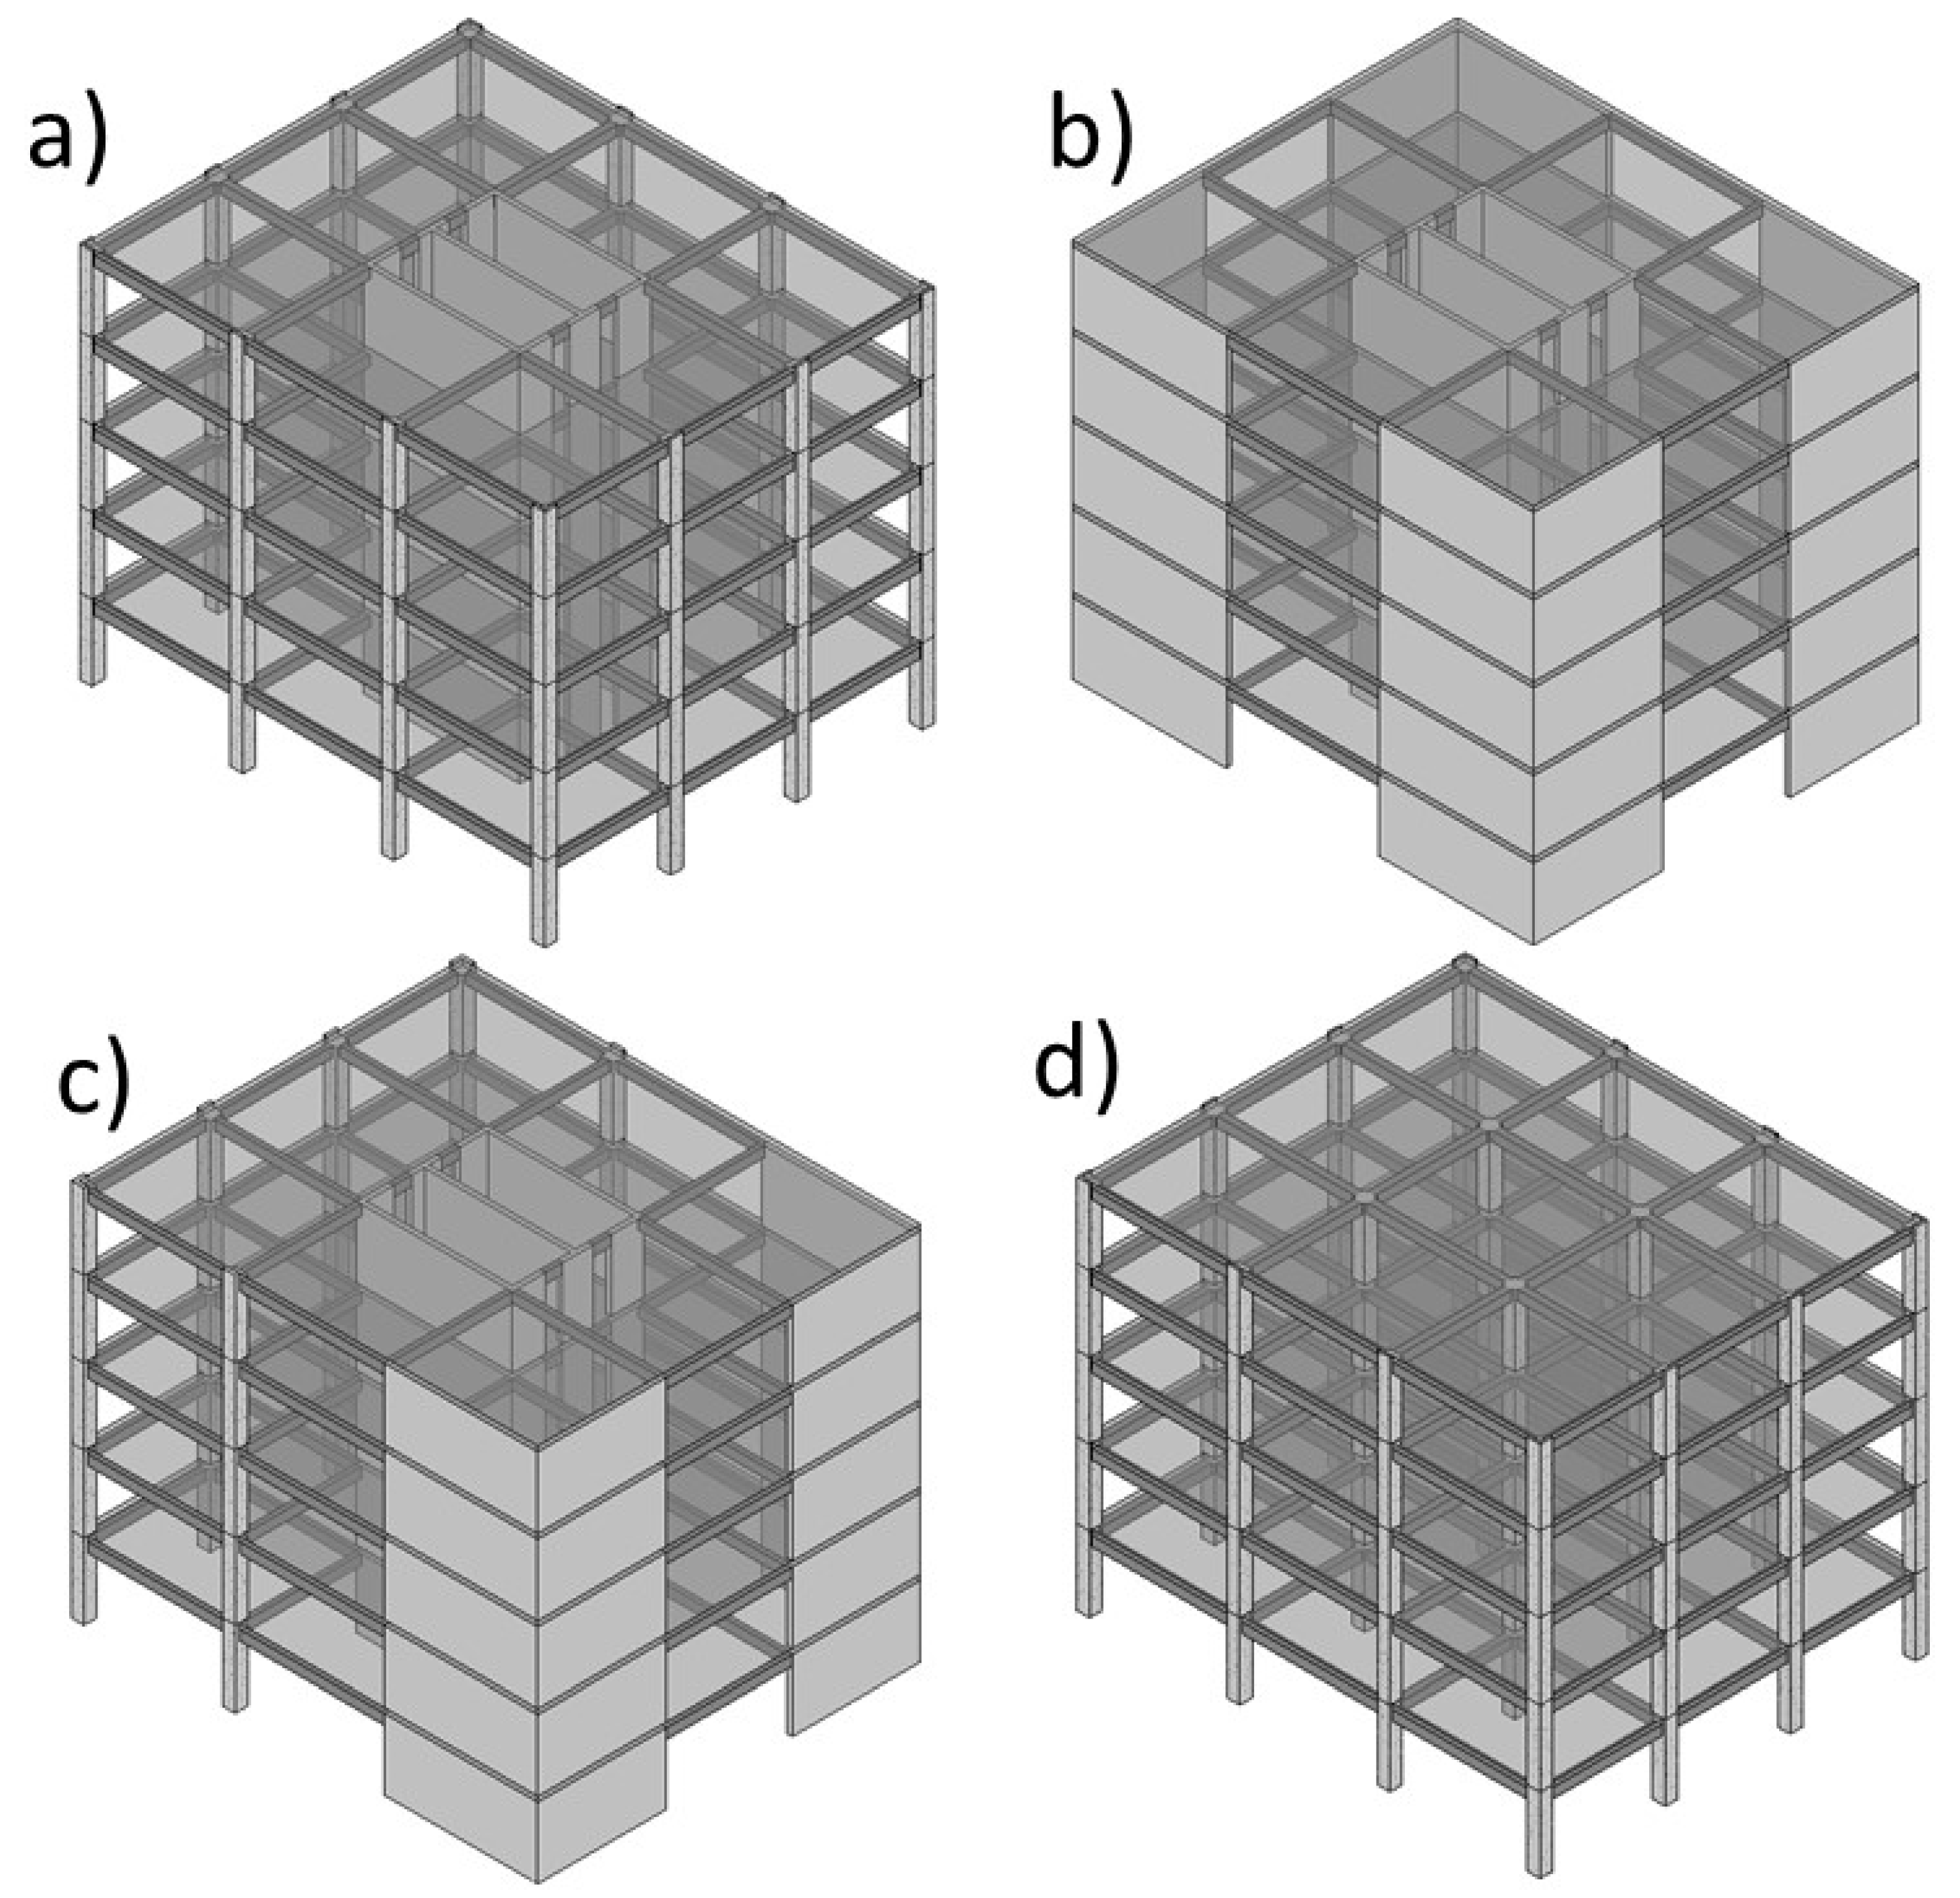
The four archetypes chosen correspond to reinforced concrete structures configured using different typologies, ranging from very stiff (building with shear walls, Archetype 2) to structures of intermediate stiffness (frame building with a core of shear walls, archetype 1) to flexible structures (frame building, Archetype 4). An archetype that presents a high plan irregularity was intentionally introduced, so that the effect of such irregularity could be studied along with the directionality of the applied seismic components. Figure 8 shows the isometric views of the four archetypes studied; note the irregular distribution of the shear walls of Archetype 3, which generates unidirectional eccentricity (according to the x axis). The irregularity of Archetype 3 is proposed in a way that influences the dynamic results. This strategy has been used in structures with another type of irregularity in plan [39]. All the Archetypes designed comply with the normative prescriptions that govern the maximum admissible drifts for the different structural typologies. Likewise, all the Archetypes, except naturally Archetype 3, satisfy the design requirements that limit irregularity in plan.
The results of the linear elastic analysis of the archetypes were obtained considering a fraction of 5% of the critical damping. Table 3 shows the periods of the first six vibration modes (obtained as a result of the dynamic analysis), specifying whether each mode is translational (along the x or y axis) or rotational (along the z axis). 
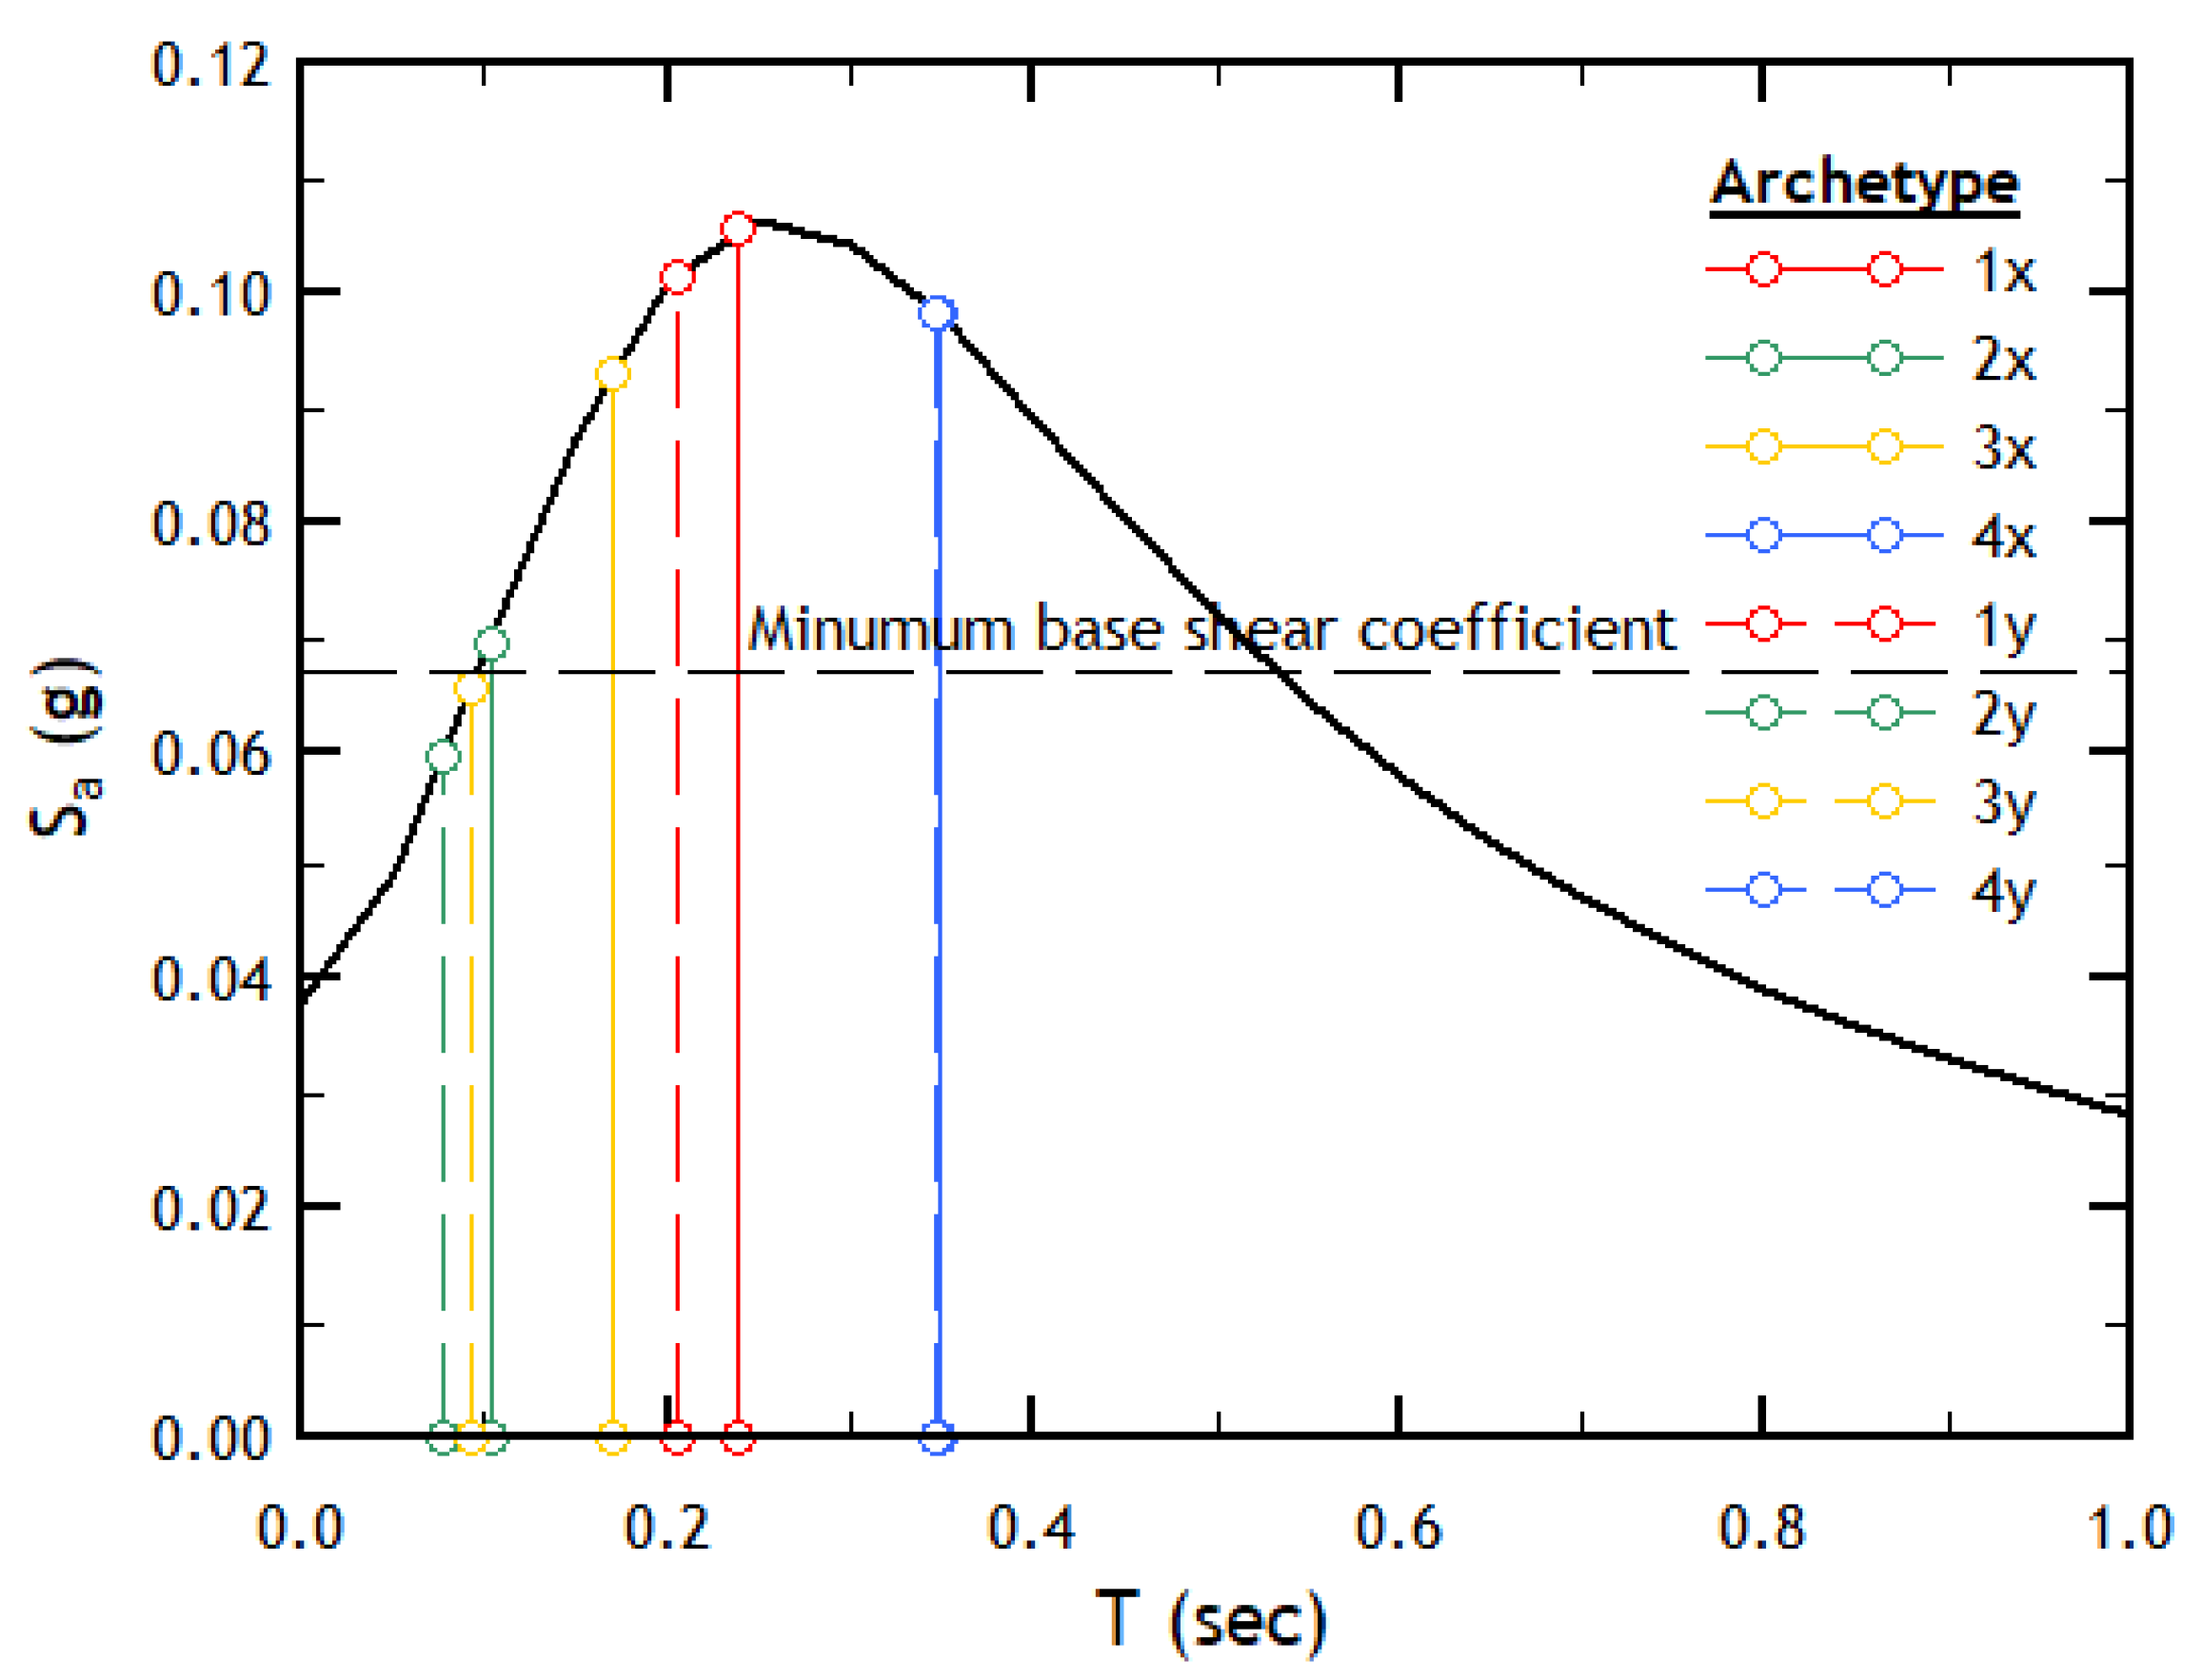
Figure 9 shows the design inelastic spectrum reduced by a regulatory response reduction factor of 11, and presents the vibration periods of the first modes in the x and y direction. Some of the most noteworthy findings are the special difference among the periods of Archetype 3 and the practically equal periods in both directions for Archetype 4. It should also be noted that some archetypes did not reach the minimum seismic coefficient in some directions (in which cases, the response reduction factors were adjusted to ensure compliance).
The stiffness and torsional properties of the archetypes were calculated and are summarized in Table 4. The results show that there is a significant difference between the stiffness of Archetypes 1 and 3. Archetype 2 presents a less notable difference in stiffness than the previous one, while Archetype 4 presents practically the same stiffness in both directions. The imbalance in the rigidity will prove to be significant in determining the influence of the angle of incidence on the response of the archetypes. The calculated value of torsional stiffness, as expected, is significantly higher in Archetype 2 (whose structure is based on shear walls), and to a lesser extent in Archetype 3 (which has shear walls only on the right side of the plan). This irregular distribution is what produces the eccentricity of 8.7 m in this archetype. It is important to point out that Archetype 1 presents insufficient torsional rigidity, when verifying that r y c < l s .
The nonlinear behavior of the archetypes was determined using fiber finite elements, with a structural damping equal to 5% of the critical damping. The structural members were incorporated into the model including the characteristics of the reinforcement, both longitudinal and transverse, previously designed according to current regulations in Chile for a high level of seismic hazard (0.4 g). In both the static and dynamic analyses, the P-Δ effect was included.
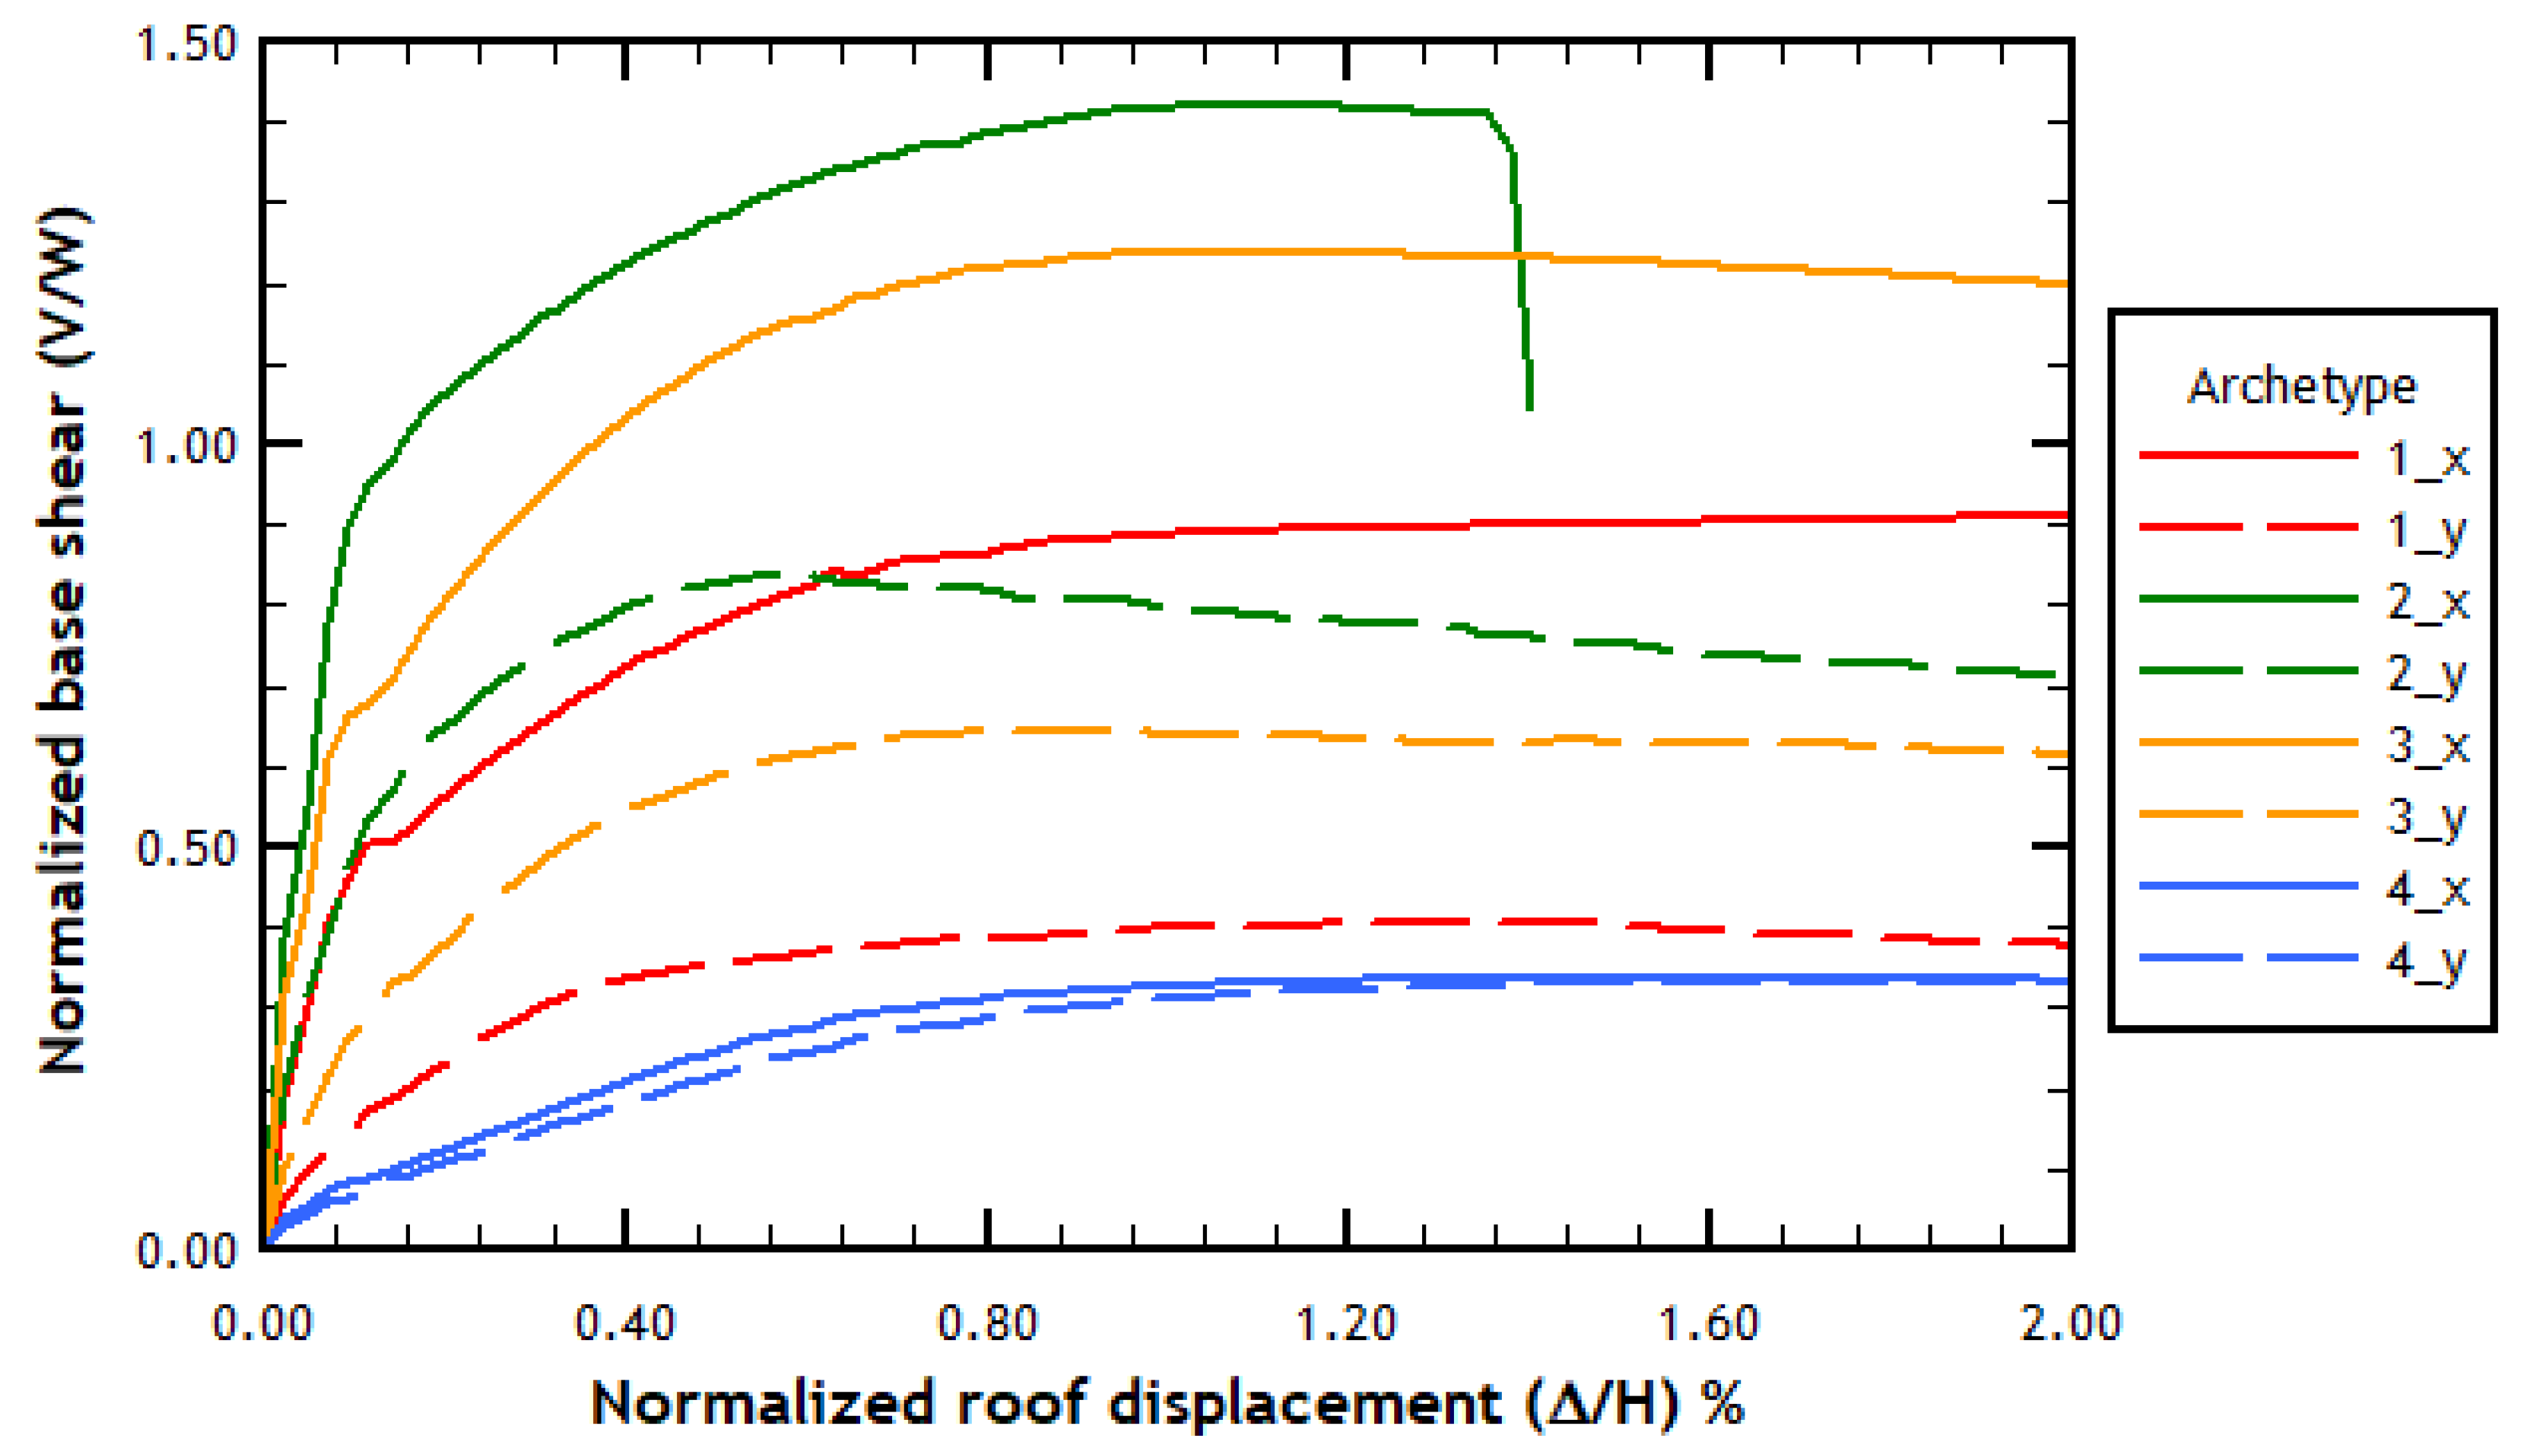
As a first approximation to the seismic response, the conventional pushover analysis was carried out in both directions for each archetype, whose capacity curves are summarized in Figure 10. The pushover analysis was carried out considering a distribution of lateral forces corresponding to the first vibration mode. This procedure, however, is not the most appropriate to determine the torsional behavior of the archetypes studied.
The results of the pushover analysis show capacity curves in which it is possible to appreciate the difference in lateral stiffness of archetypes 1, 2, and 3 in the two directions of analysis. Note that the capacity curves were represented in a normalized way with respect to height and seismic weight, so that the response of the different archetypes can be compared.

4. Results and Discussion

Among all the results of the nonlinear time-history analysis, the two parameters of the seismic response chosen are interstory drift (usually an indicator of the damage to structural elements corresponding to a specific story) and roof displacement (which usually allows the global ductility demands on a structure to be observed).
Next, figures are presented with the average results obtained for each archetype in terms of interstory drift. All displacements and interstory drifts were calculated at the centre of mass of each story. It should be noted that these figures display both the values obtained by axes as well as the values calculated by SRSS combination. Global averages refer to the average obtained by considering all the results on the indicated axis. There is a clear trend in terms of the angle of incidence for each archetype, which does not seem to be significantly affected by the story being evaluated on the structure in question.
The results presented below involving both interstory drift and roof displacement were expressed in polar graphs. Each angle of incidence was presented considering a sweep from 0° to 360° with an increment of 22.5°. To graph the values of the interstory drift or the displacement, the maximum values were calculated for each pair of components of the corresponding earthquake considered in Table 1. Then, the maximum value, both for each earthquake and for each angle of incidence, is determined between the previous maximum values and for each direction of the response. This maximum value per direction is taken in order to serve as a value against which all previous maximum values are normalized according to the same value for all stories. It is important to mention that the maximum displacements and the maximum drifts do not all occur at the same time of application of the records used in the study. Similarly, it was not determined that these maximum values occur at the times in which the PGA of the records occurs.

4.1. Interstory Drift

The results obtained in the archetypes using the accelerograms contained in Table 1 are presented below. This part shows the interstory drift measurements, which are very important in the verification of the design as they can be correlated with the damage achieved in a specific story. Figure 11a shows that Archetype 1 presents a clear trend, with the angles of incidence of 135° and 315° producing the least response in the y axis (dotted lines). For the x axis (solid lines), the trend is not so clear, because, apart from the two angles of incidence mentioned for the y axis, it is noted that the incidence angles of 112.5° and 292.5° also present low values of interstory drift. The response obtained in the y axis is similar to that obtained by the SRSS combination (see Figure 8b). Note that, in these figures, each color corresponds to a specific story, obtaining in this case greater drift on the highest stories of the archetype.
Figure 12a,b show the results obtained in Archetype 2. Given the irregular shape of the displacements and interstory drifts, it seems that the minimums are given for angles of incidence of 135° and 315°, with a clear similarity between the SRSS combination and the results obtained by the y axis. Also note that the largest interstory drift measurements are reached for angles of incidence of 45° and 225°. For the analysis in the x axis, it is noted that the angles of incidence for which the smallest drift is obtained are the 45° and 225° angles. On the contrary, the largest interstory drifts in the y axis are reached for angles of incidence of 157.5° and 337.5°.
Regarding Archetype 3, Figure 13 shows a relatively homogeneous distribution for the results obtained along the y axis. However, on the x axis, a clear influence of the angle of incidence is observed. First, it can be seen that, on the x axis, the maximum interstory drift measurements are reached for both angles of incidence of 0° and 90°, while on the y axis, the maximum interstory drift measurements are reached for angles of incidence of 157.5° and 337.5°, with a notable reduction in interstory drift for angles of incidence of 67.5° and 247.5°. The distribution obtained by means of the SRSS combination is similar to that obtained in the results with respect to the y axis. This dissimilar behavior can be attributed to the fact that the structure on the x axis is symmetric, while on the y axis, it is highly asymmetric.
Finally, the results obtained with Archetype 4 are presented. It is observed that this archetype presents the most homogeneous response, which coincides with the more regular structure obtained with structural frames in both directions, without the presence of eccentricities. Note especially in Figure 14b that the interstory drift values are uniform regardless of the angle of incidence, with a slight predominance of the 0° angle. Additionally, it can be mentioned that the drift distribution in this archetype maintains the tendency to increase with the height observed in the rest of the archetypes.
Table 5 summarizes the results obtained from all the analyses regarding interstory drift. The results show the angles of incidence under which the maximum and minimum interstory drift occurred on both the x and y axes. Note that there is no common preferential angle of incidence for the four archetypes studied, although, for Archetypes 2, 3, and 4 on the x axis, maximum interstory drift values are maintained for an angle of incidence of 67° 30′, while the minimum drift occurs for an angle of incidence of 157° 30′, which means that there is a rotation of 90° between the angle of incidence of maximum and minimum interstory drift. The same happens for the results of Archetype 1, where interstory drift on the x axis reached maximum values for an angle of incidence of 292° 30′ and minimum values for an angle of incidence of 202° 30′. Regarding interstory drift on the y axis, it can be noted that the angle of incidence that produces the highest values is different for each of the four archetypes, while the minimum values of interstory drift occur for an angle of 135° in the case of Archetypes 1, 2, and 3, and Archetype 4 reaches minimum values under an angle of incidence of 157° 30′.
Meanwhile, Table 6 shows the interstory drift values calculated with the two components of the analysis using the SRSS method. The values show that there is no clear trend regarding the angles of incidence that produce the maximum and minimum interstory drift for the different archetypes considered.

4.2. Roof Displacement

Figure 15 shows the results of the roof displacement obtained and normalized. It is observed that there is no major variation between any of the axes and the results obtained by combination. The results obtained are similar to those presented above for each story. On the other hand, the influence of the displacements reached in the y direction and on the results of the combination according to SRSS is verified.
Table 7 shows the incidence angles for which the maximum and minimum roof displacement occurs. Note the wide variety of angles of incidence that produce the maximum displacement in both directions of analysis, which shows that the different archetypes do not reach the maximum demands for a specific angle of incidence. The same can be inferred from Table 8, in which the combined roof displacement is shown using SRSS. Note the influence of the prevailing angle of incidence on the direction, which is reflected in both the minimum and maximum values.

4.3. Comparison of Results with SRSS Combination

Figure 16a–d show the results of the interstory drifts and the global drift (Du is the roof displacement normalized to the height of the building) in the axes for different angles of incidence compared with those obtained using the SRSS combination. The results shown were obtained taking into account the interstory drifts calculated in both directions of analysis and for all angles of incidence. In these figures, the mean values and the values of 1 and 1.5 standard deviation were included. It is observed that the combination has a noteworthy impact in Archetypes 2 and 4, while in the rest, it can be considered negligible. In none of the cases presented below is there a coefficient of variation greater than 5%, which reflects some uniformity in the results obtained after their normalization. However, it is observed that the structural elements could be oversized during the design process, as the variations are noteworthy compared with not using the SRSS combination, especially in Archetypes 2 and 4. From this, the following can be inferred: in buildings with very similar stiffnesses in both directions of analysis (Archetypes 2 and 4), the results obtained applying the SRSS method show less dependence to the flexible direction of the buildings, compared with Archetypes 1 and 3, in which there is a greater difference between the stiffnesses depending on the directions of analysis (see Table 3).

5. Concluding Remarks

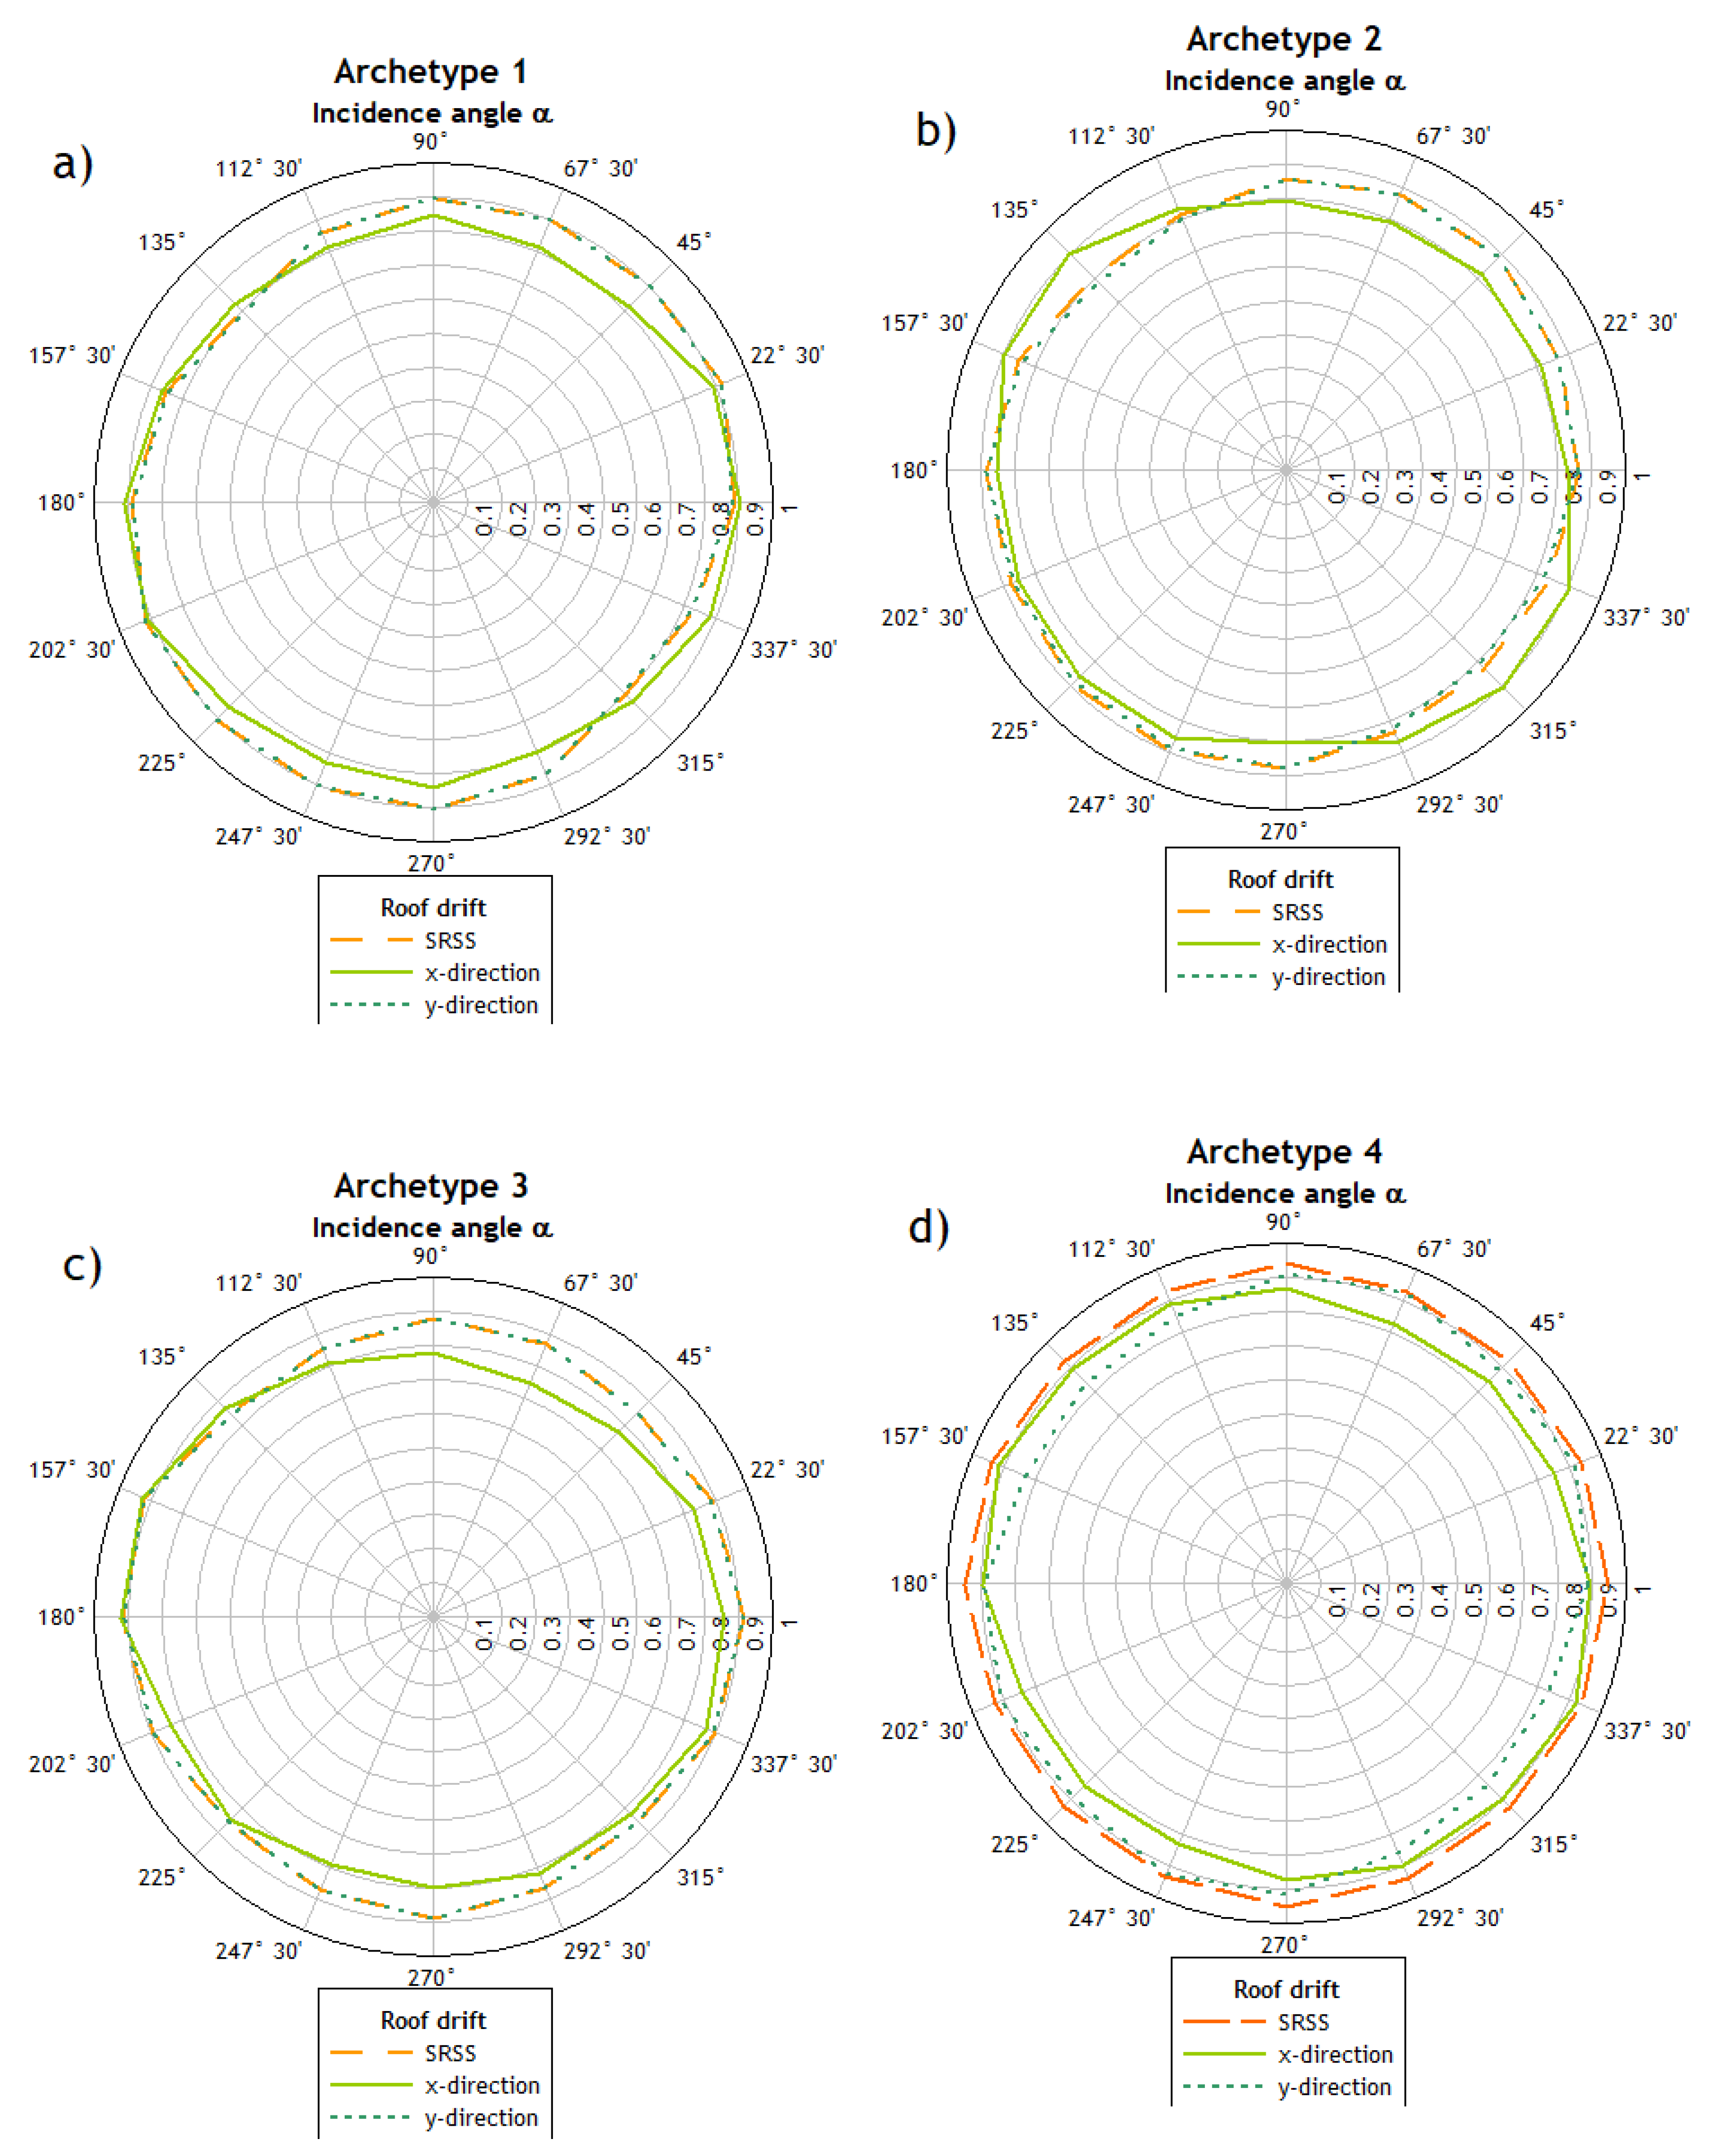
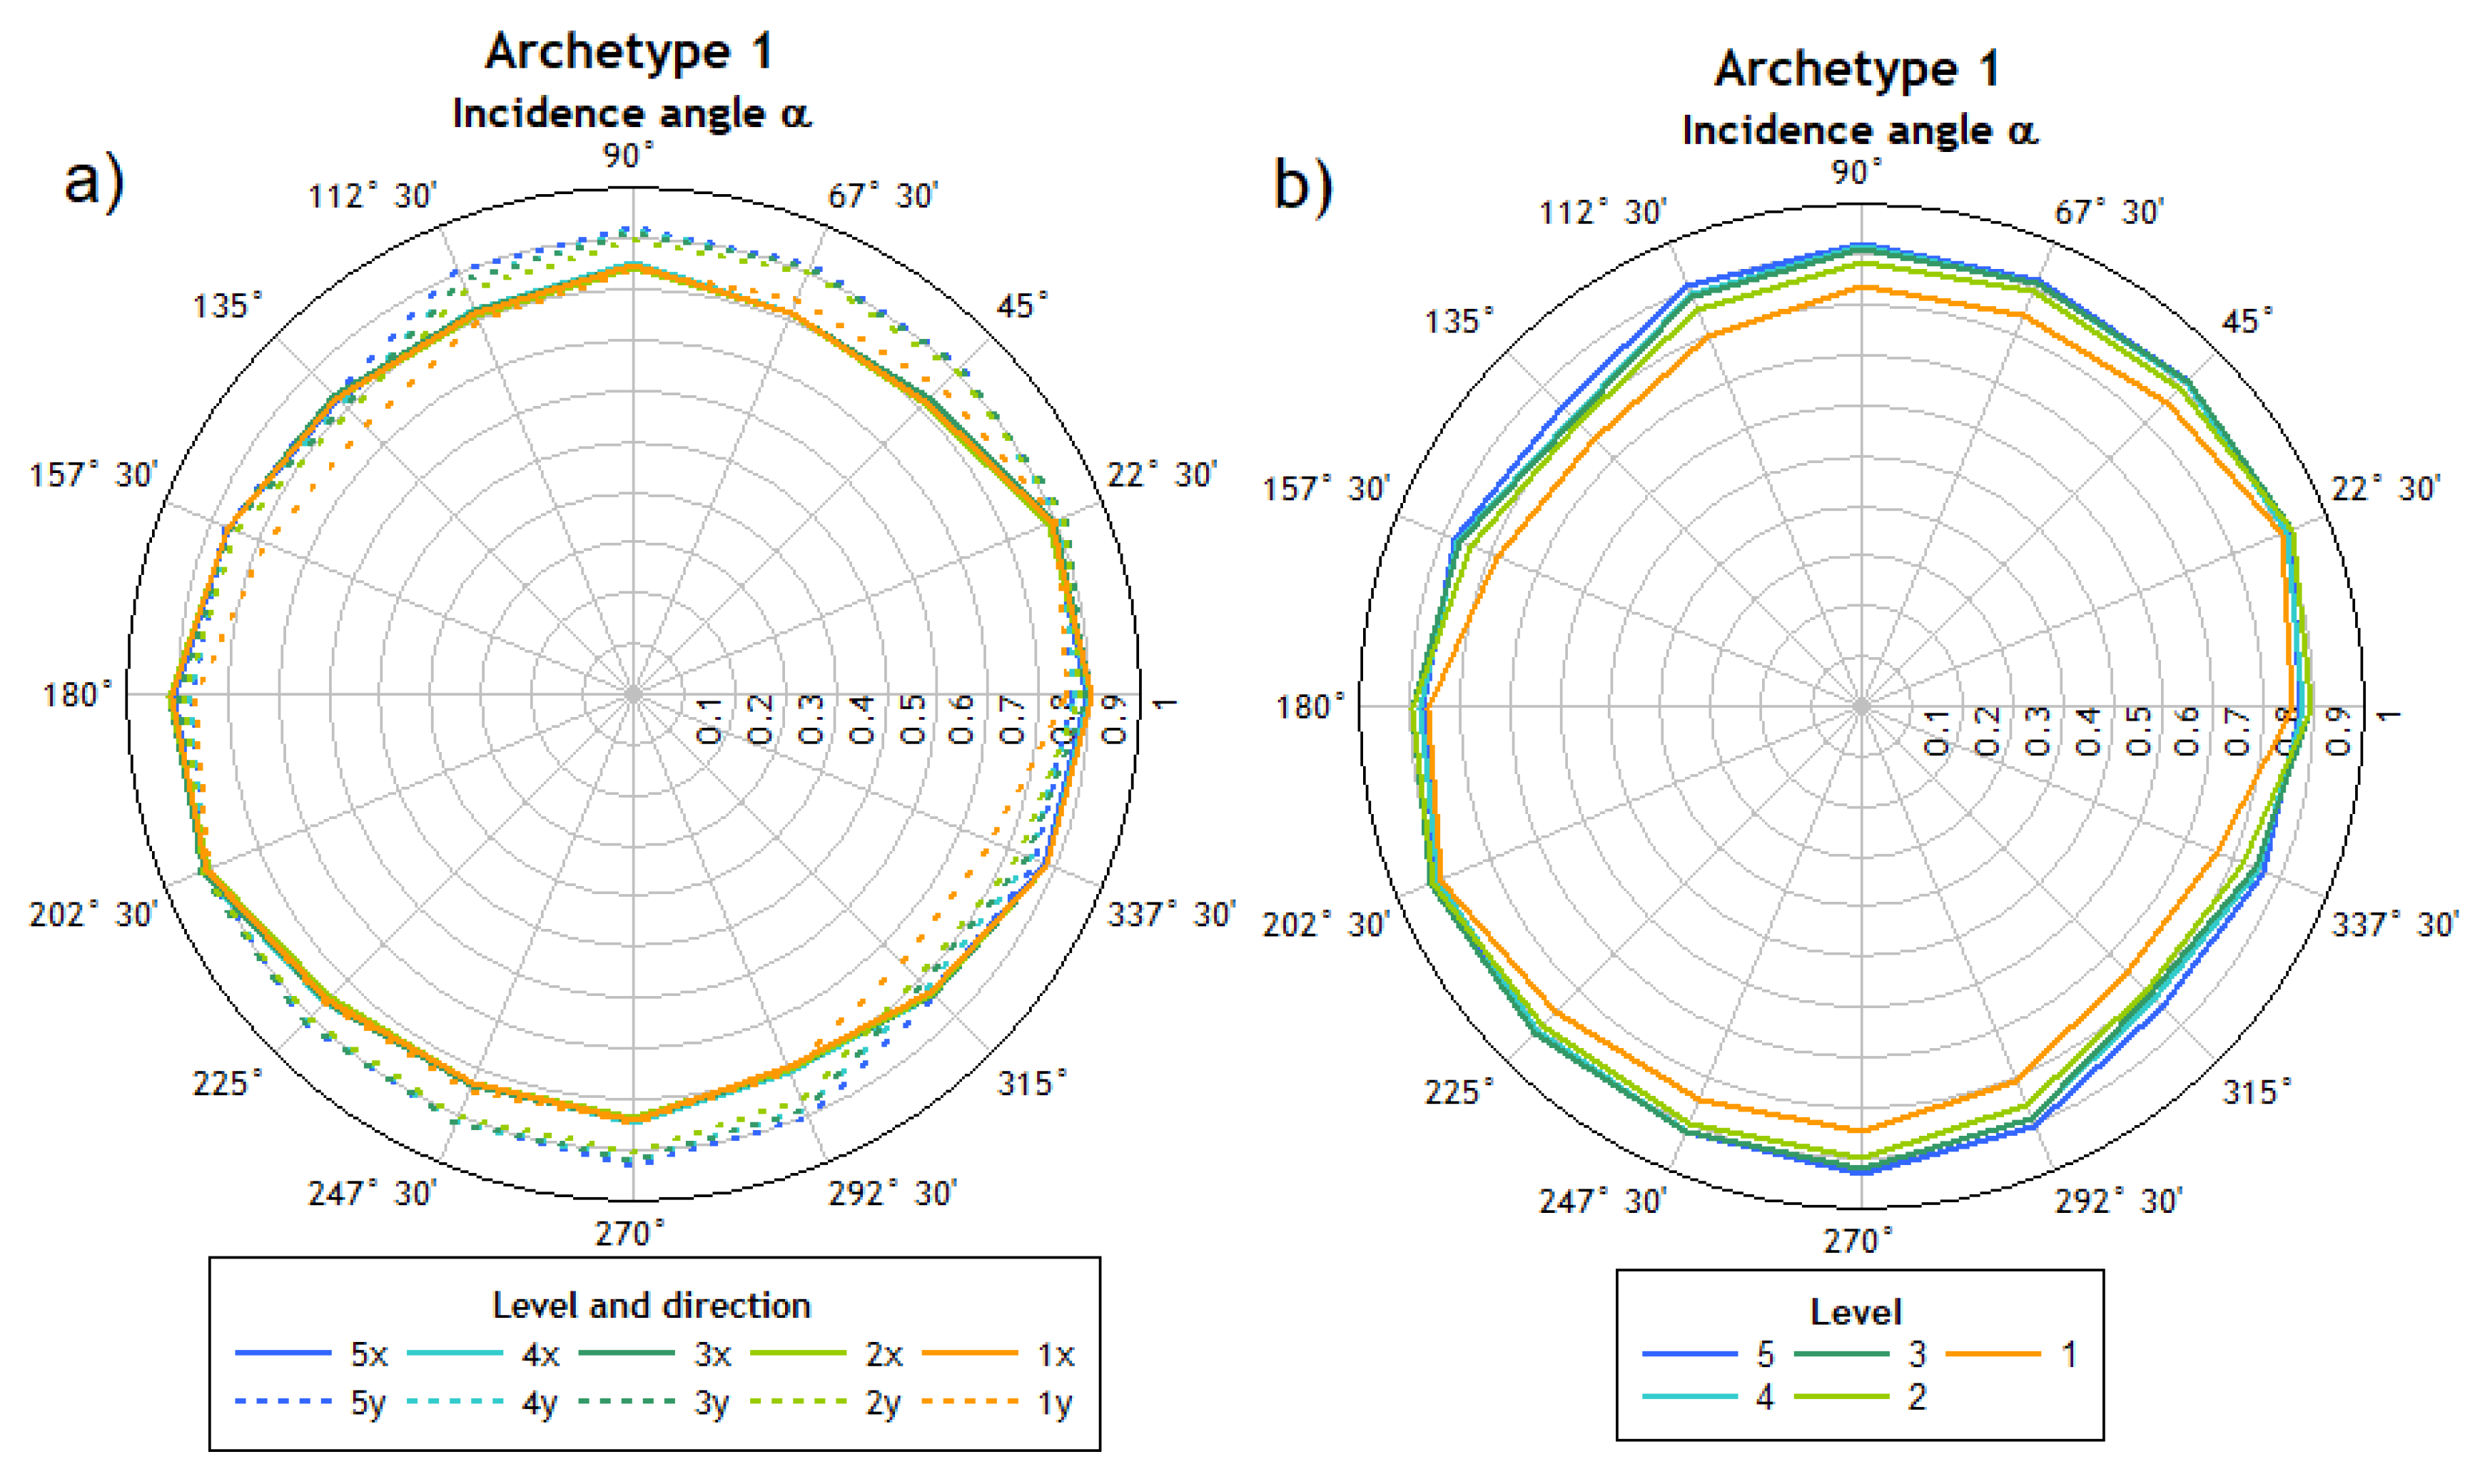
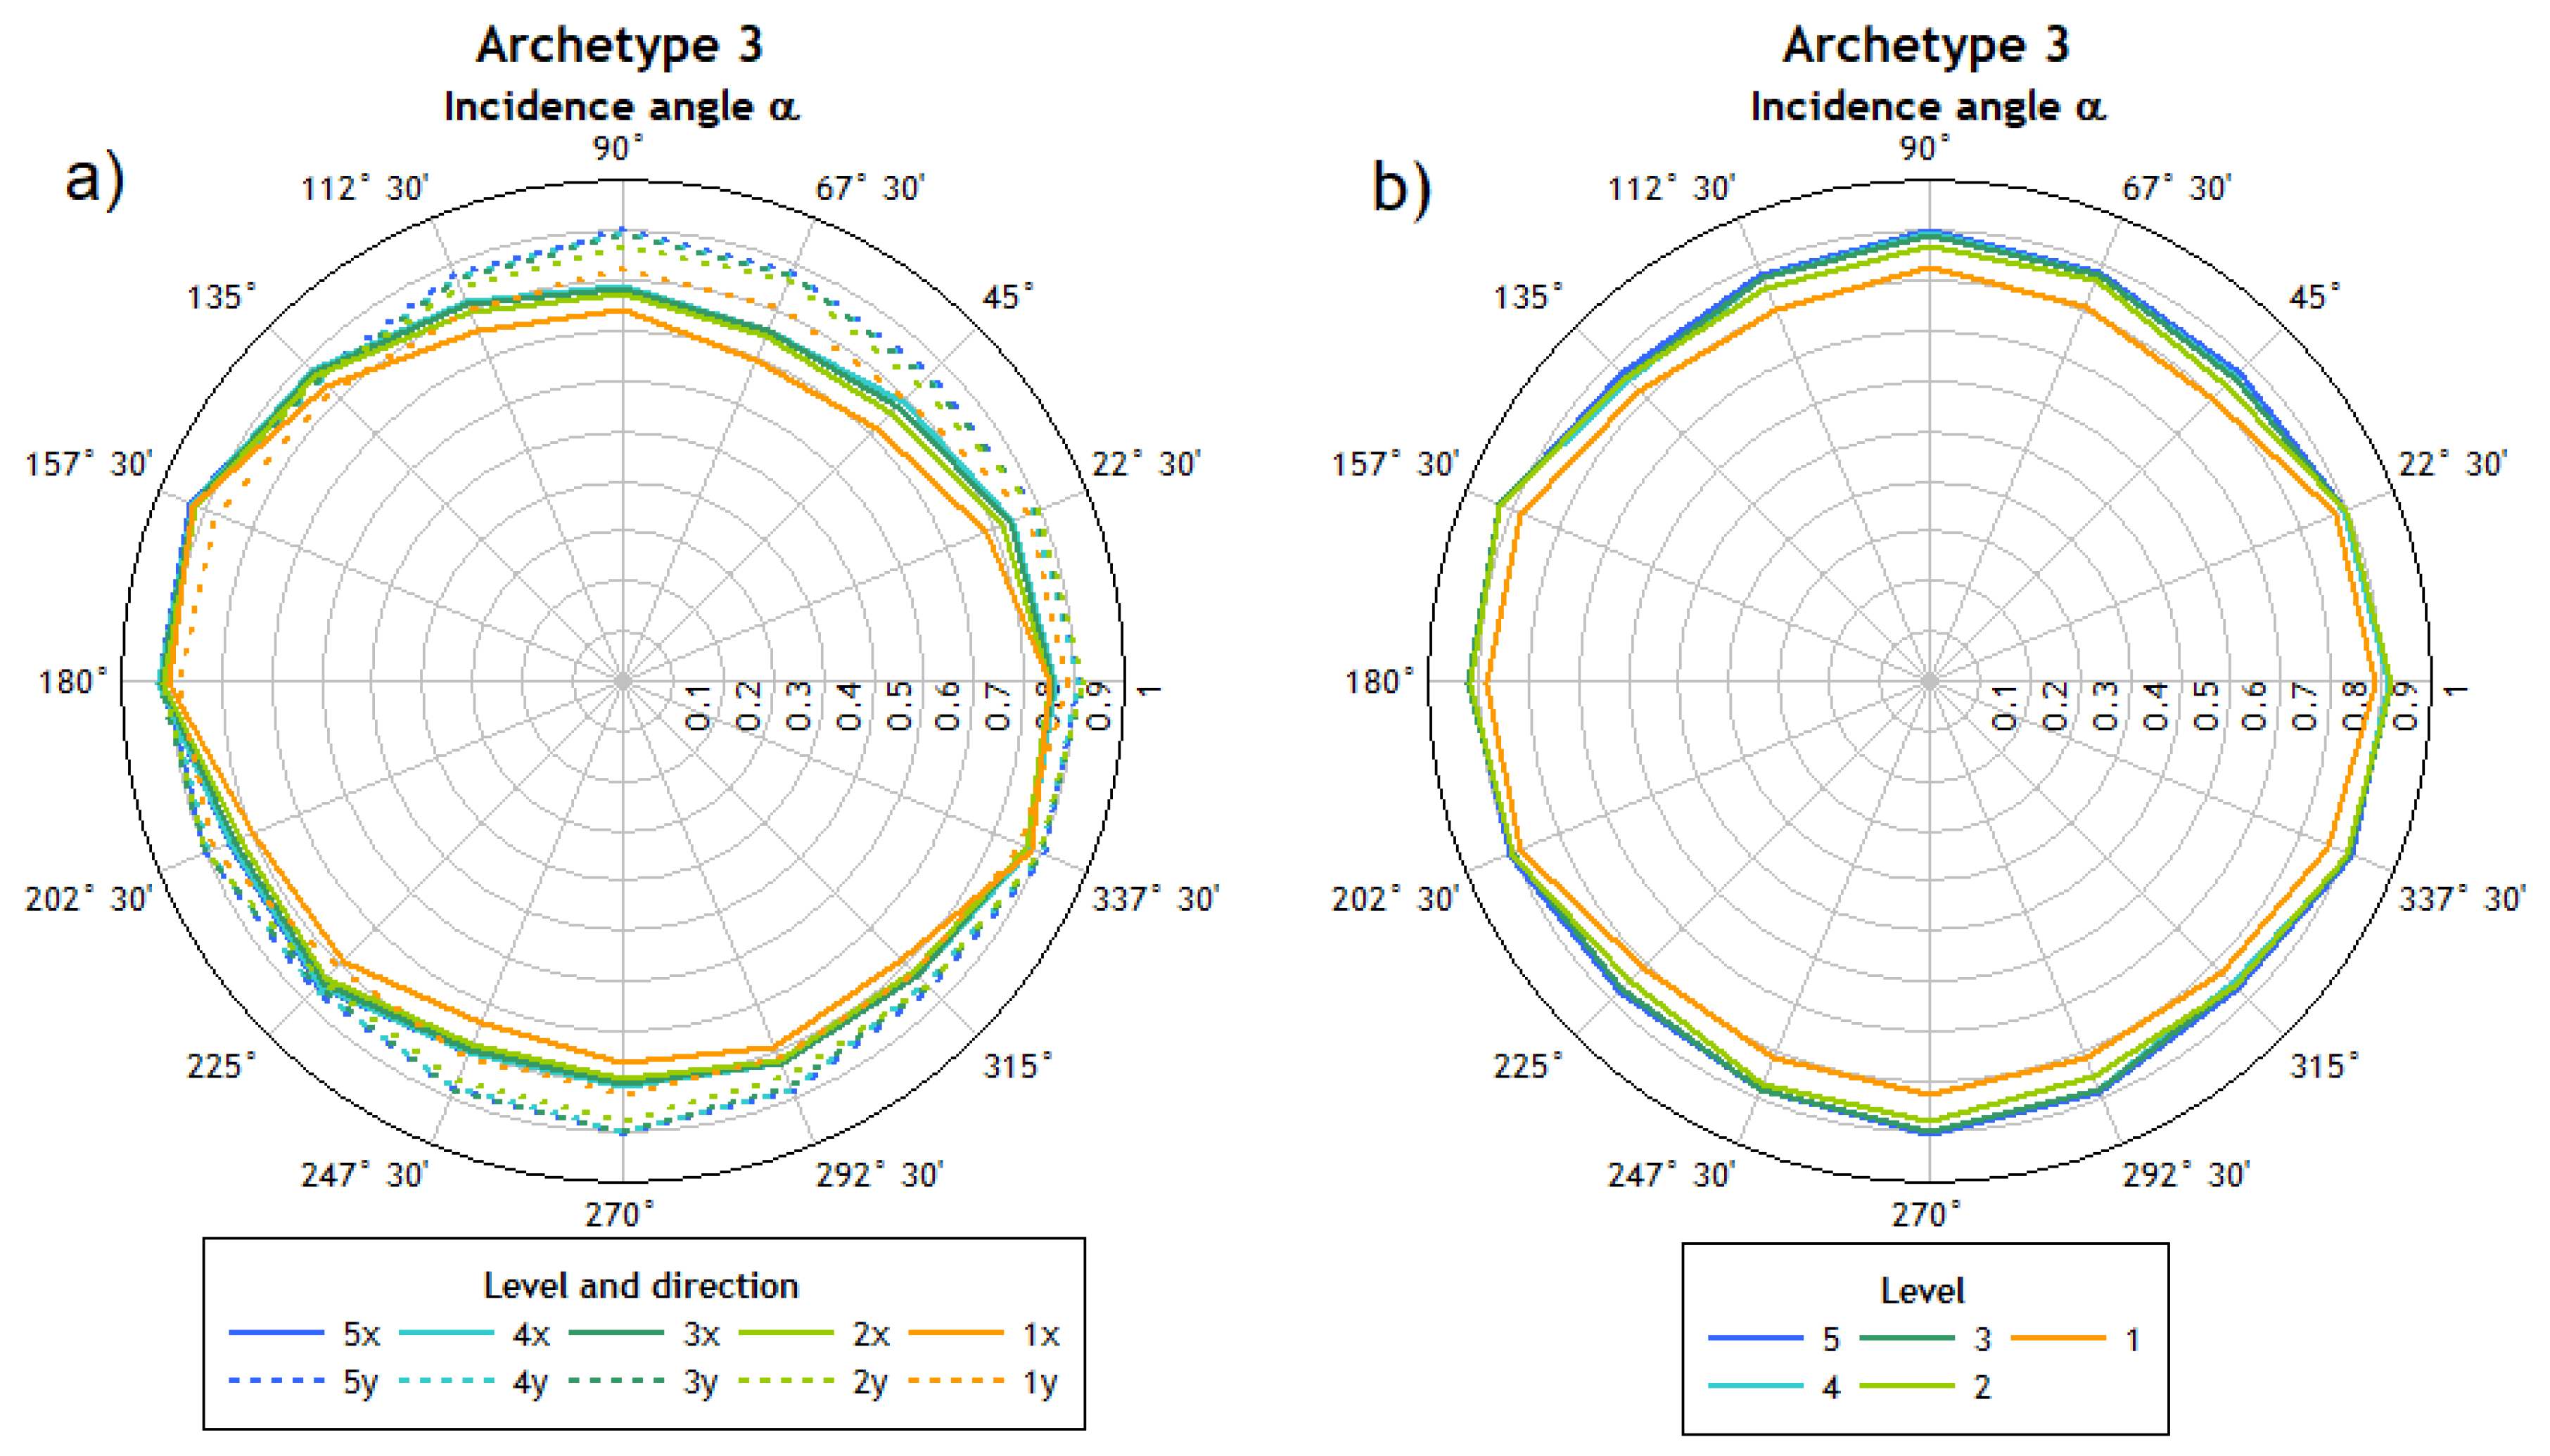
In this study, four archetypes with different structures were used, using shear walls (Archetype 2), frames (Archetype 4), and two combinations of such considering a regular distribution in plan (Archetype 1) and an irregular one (Archetype 3). The results of the nonlinear time-history analysis indicate that there is no clear predominance in the incidence angle that produces the highest values of the chosen engineering demand parameters (roof displacement and interstory drift).
When analyzing the results obtained by calculating seismic demand parameters such as roof displacement and interstory drift, there seems to be a relationship between the proportion of the stiffnesses obtained in each direction of analysis and the influence of the angle of incidence; that is, as the proportion of the stiffnesses approaches 1, the influence of the angle of incidence on the structural response decreases.
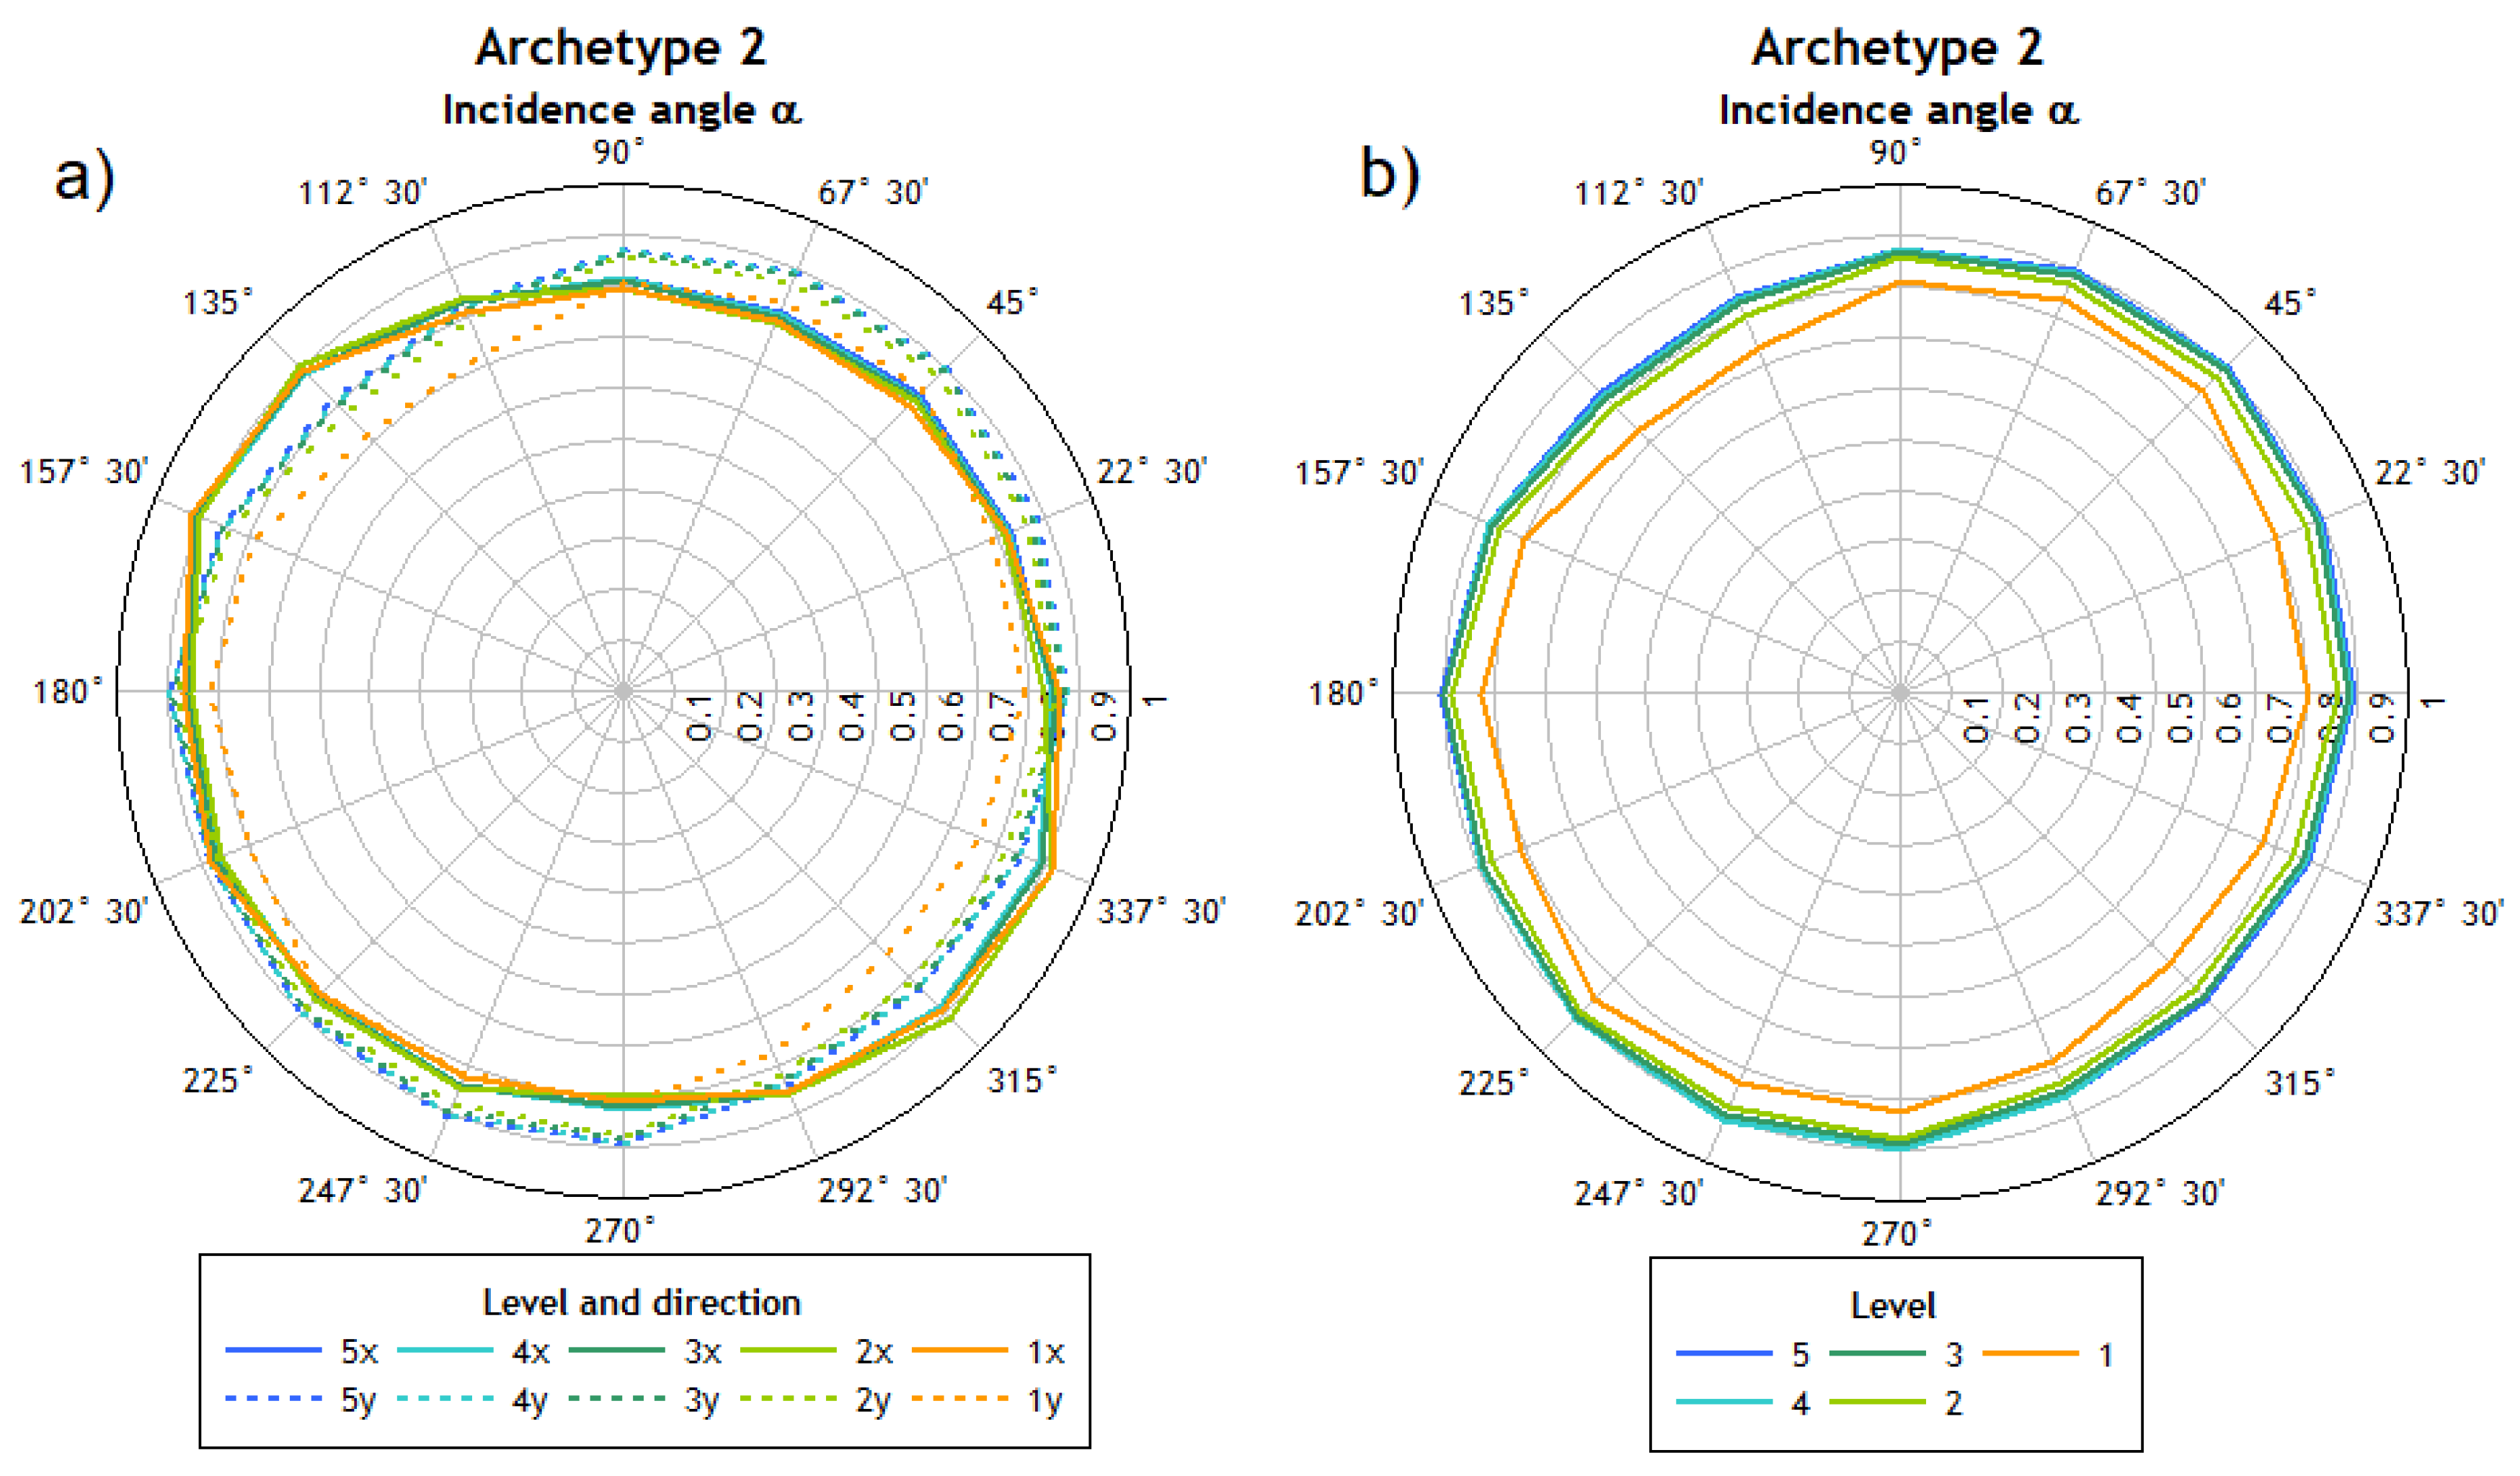
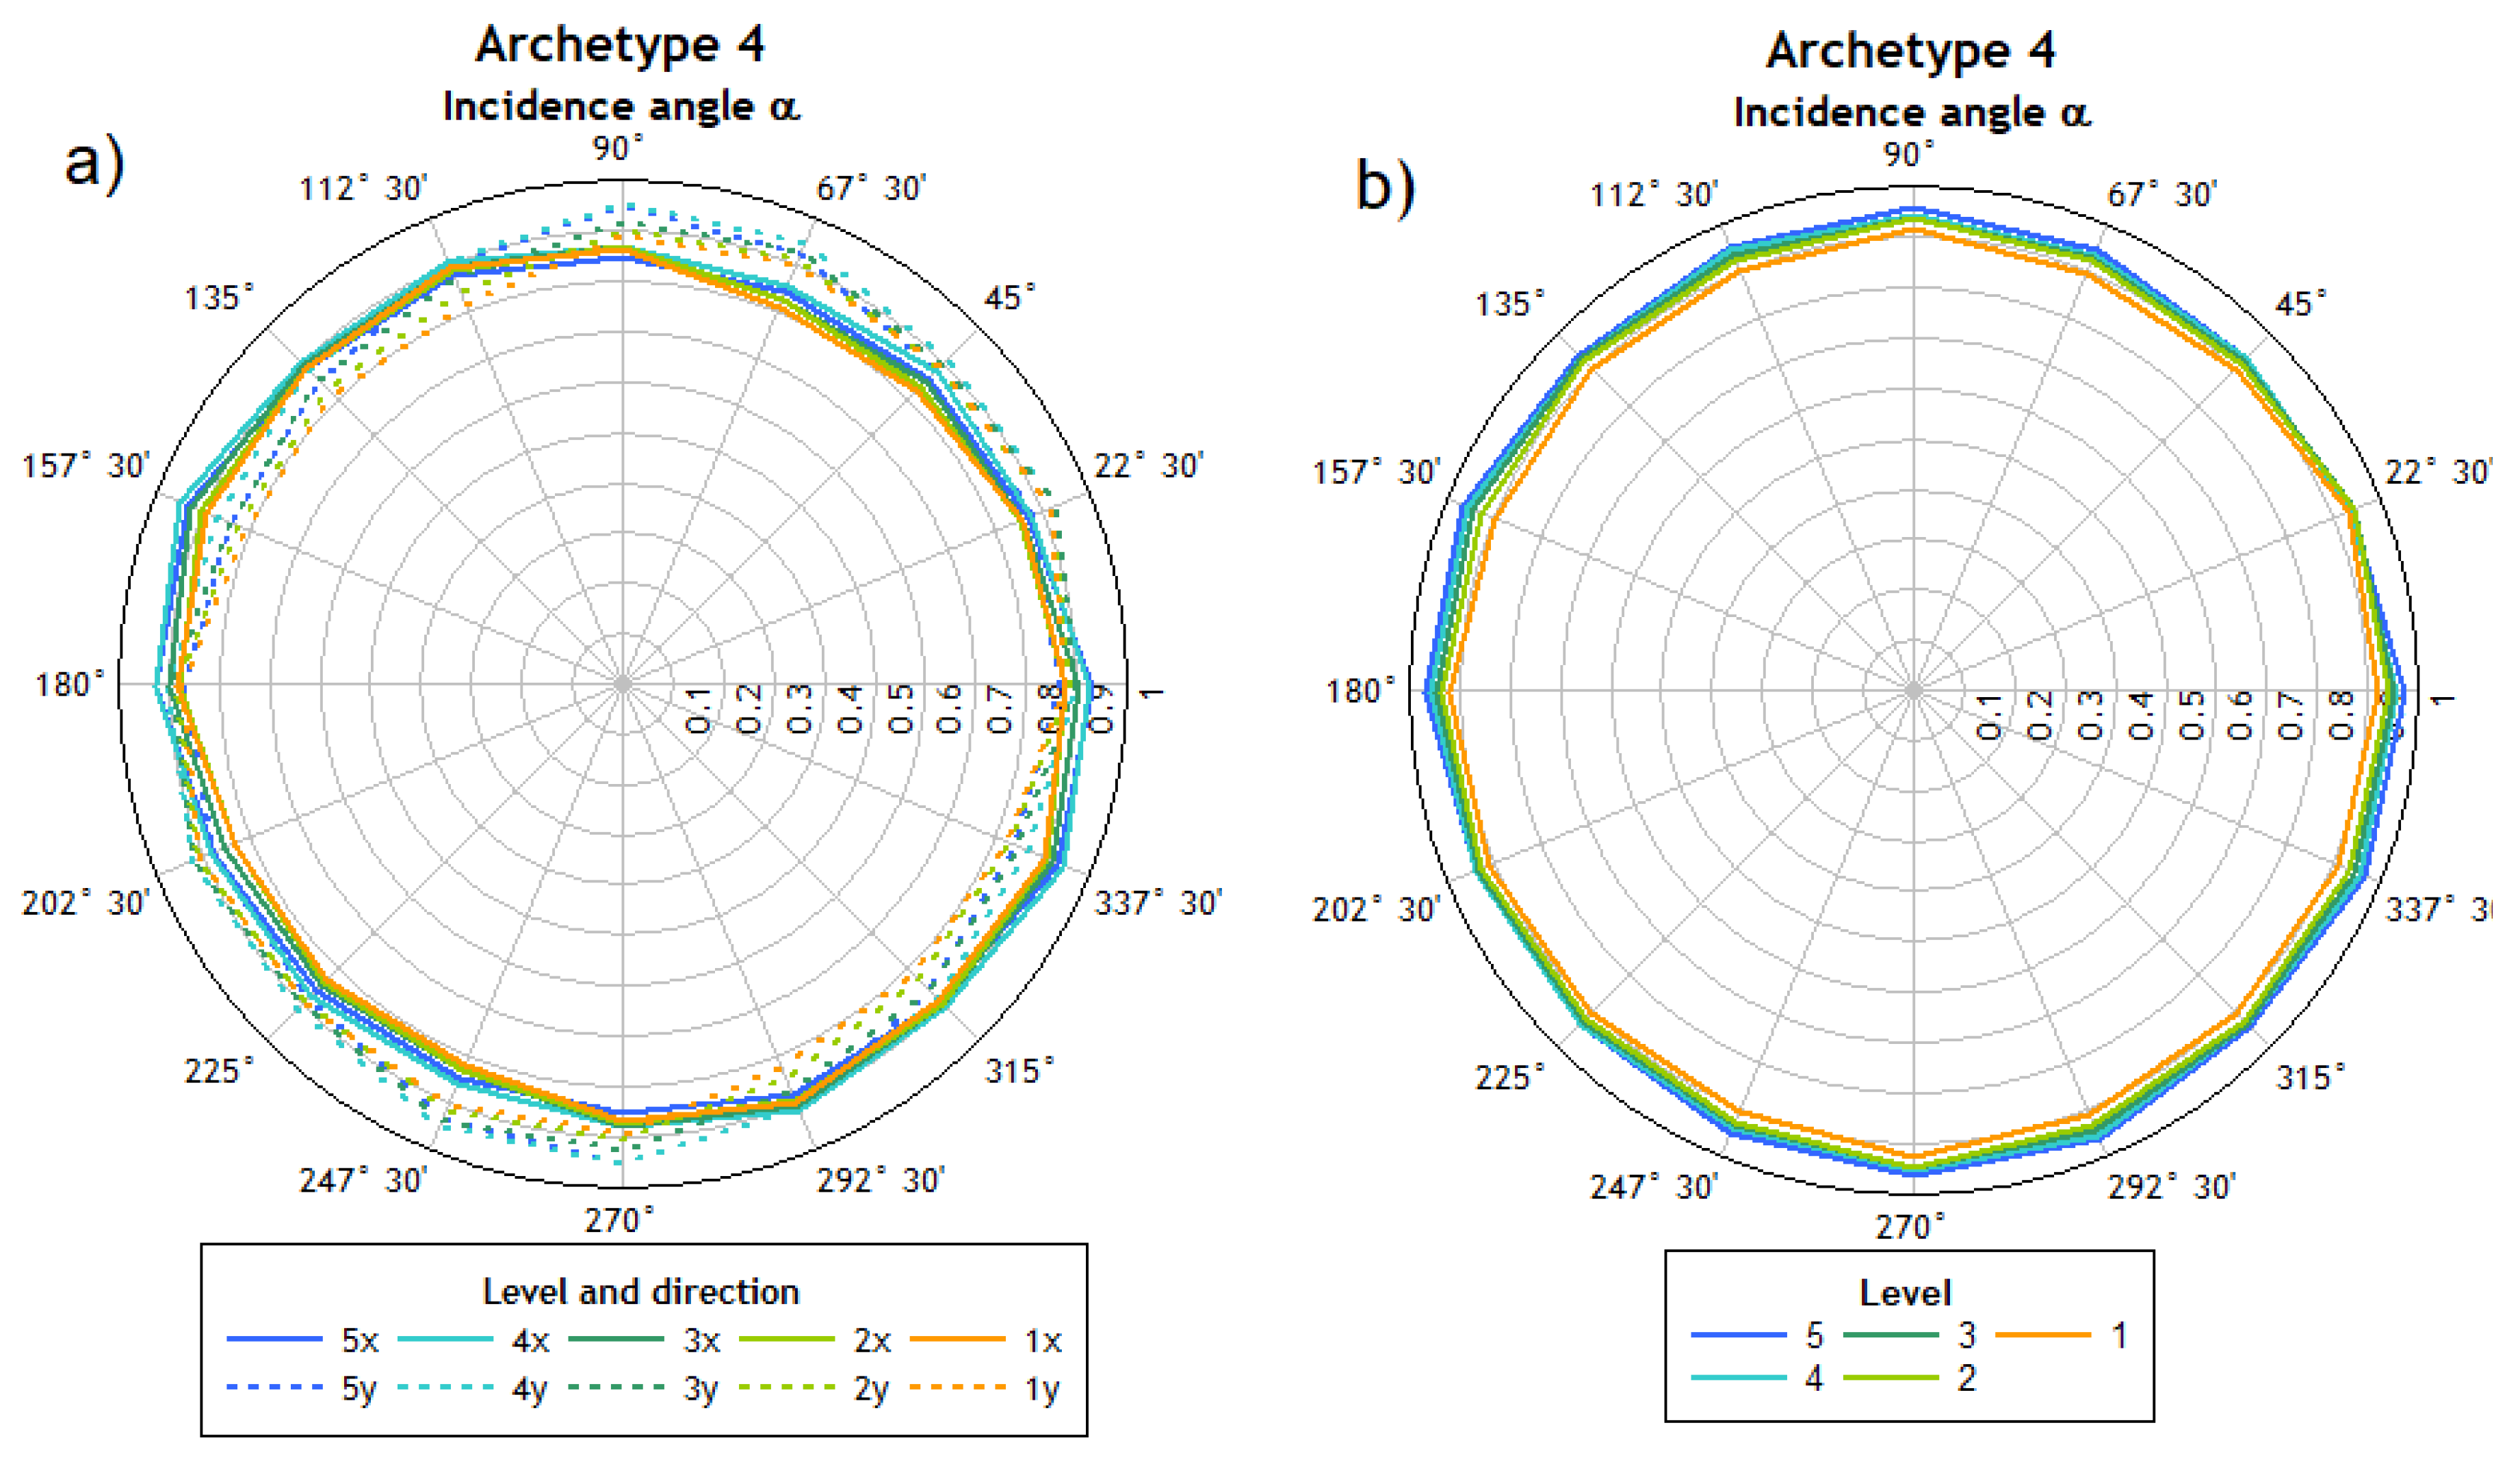
This influence is clear when comparing the shapes of the displacement distributions of Archetype 2 (oval) and Archetype 4 (circular), as seen in Figure 9b or Figure 11b. This is also supported by the results presented in Table 4. It should be noted that this difference could also be due to the structuring of the archetypes, as Archetype 2 has a flexible axis and a rigid axis if its periods are analyzed, while Archetype 4 does not have such a clear difference between its two orthogonal directions. On the other hand, Archetype 3, having significant differences between the periods of its axes, shows more uniform distributions with its flexible y axis as a reference, thus more studies are required to reach a conclusive determination regarding the influence of the period on the angle of incidence.
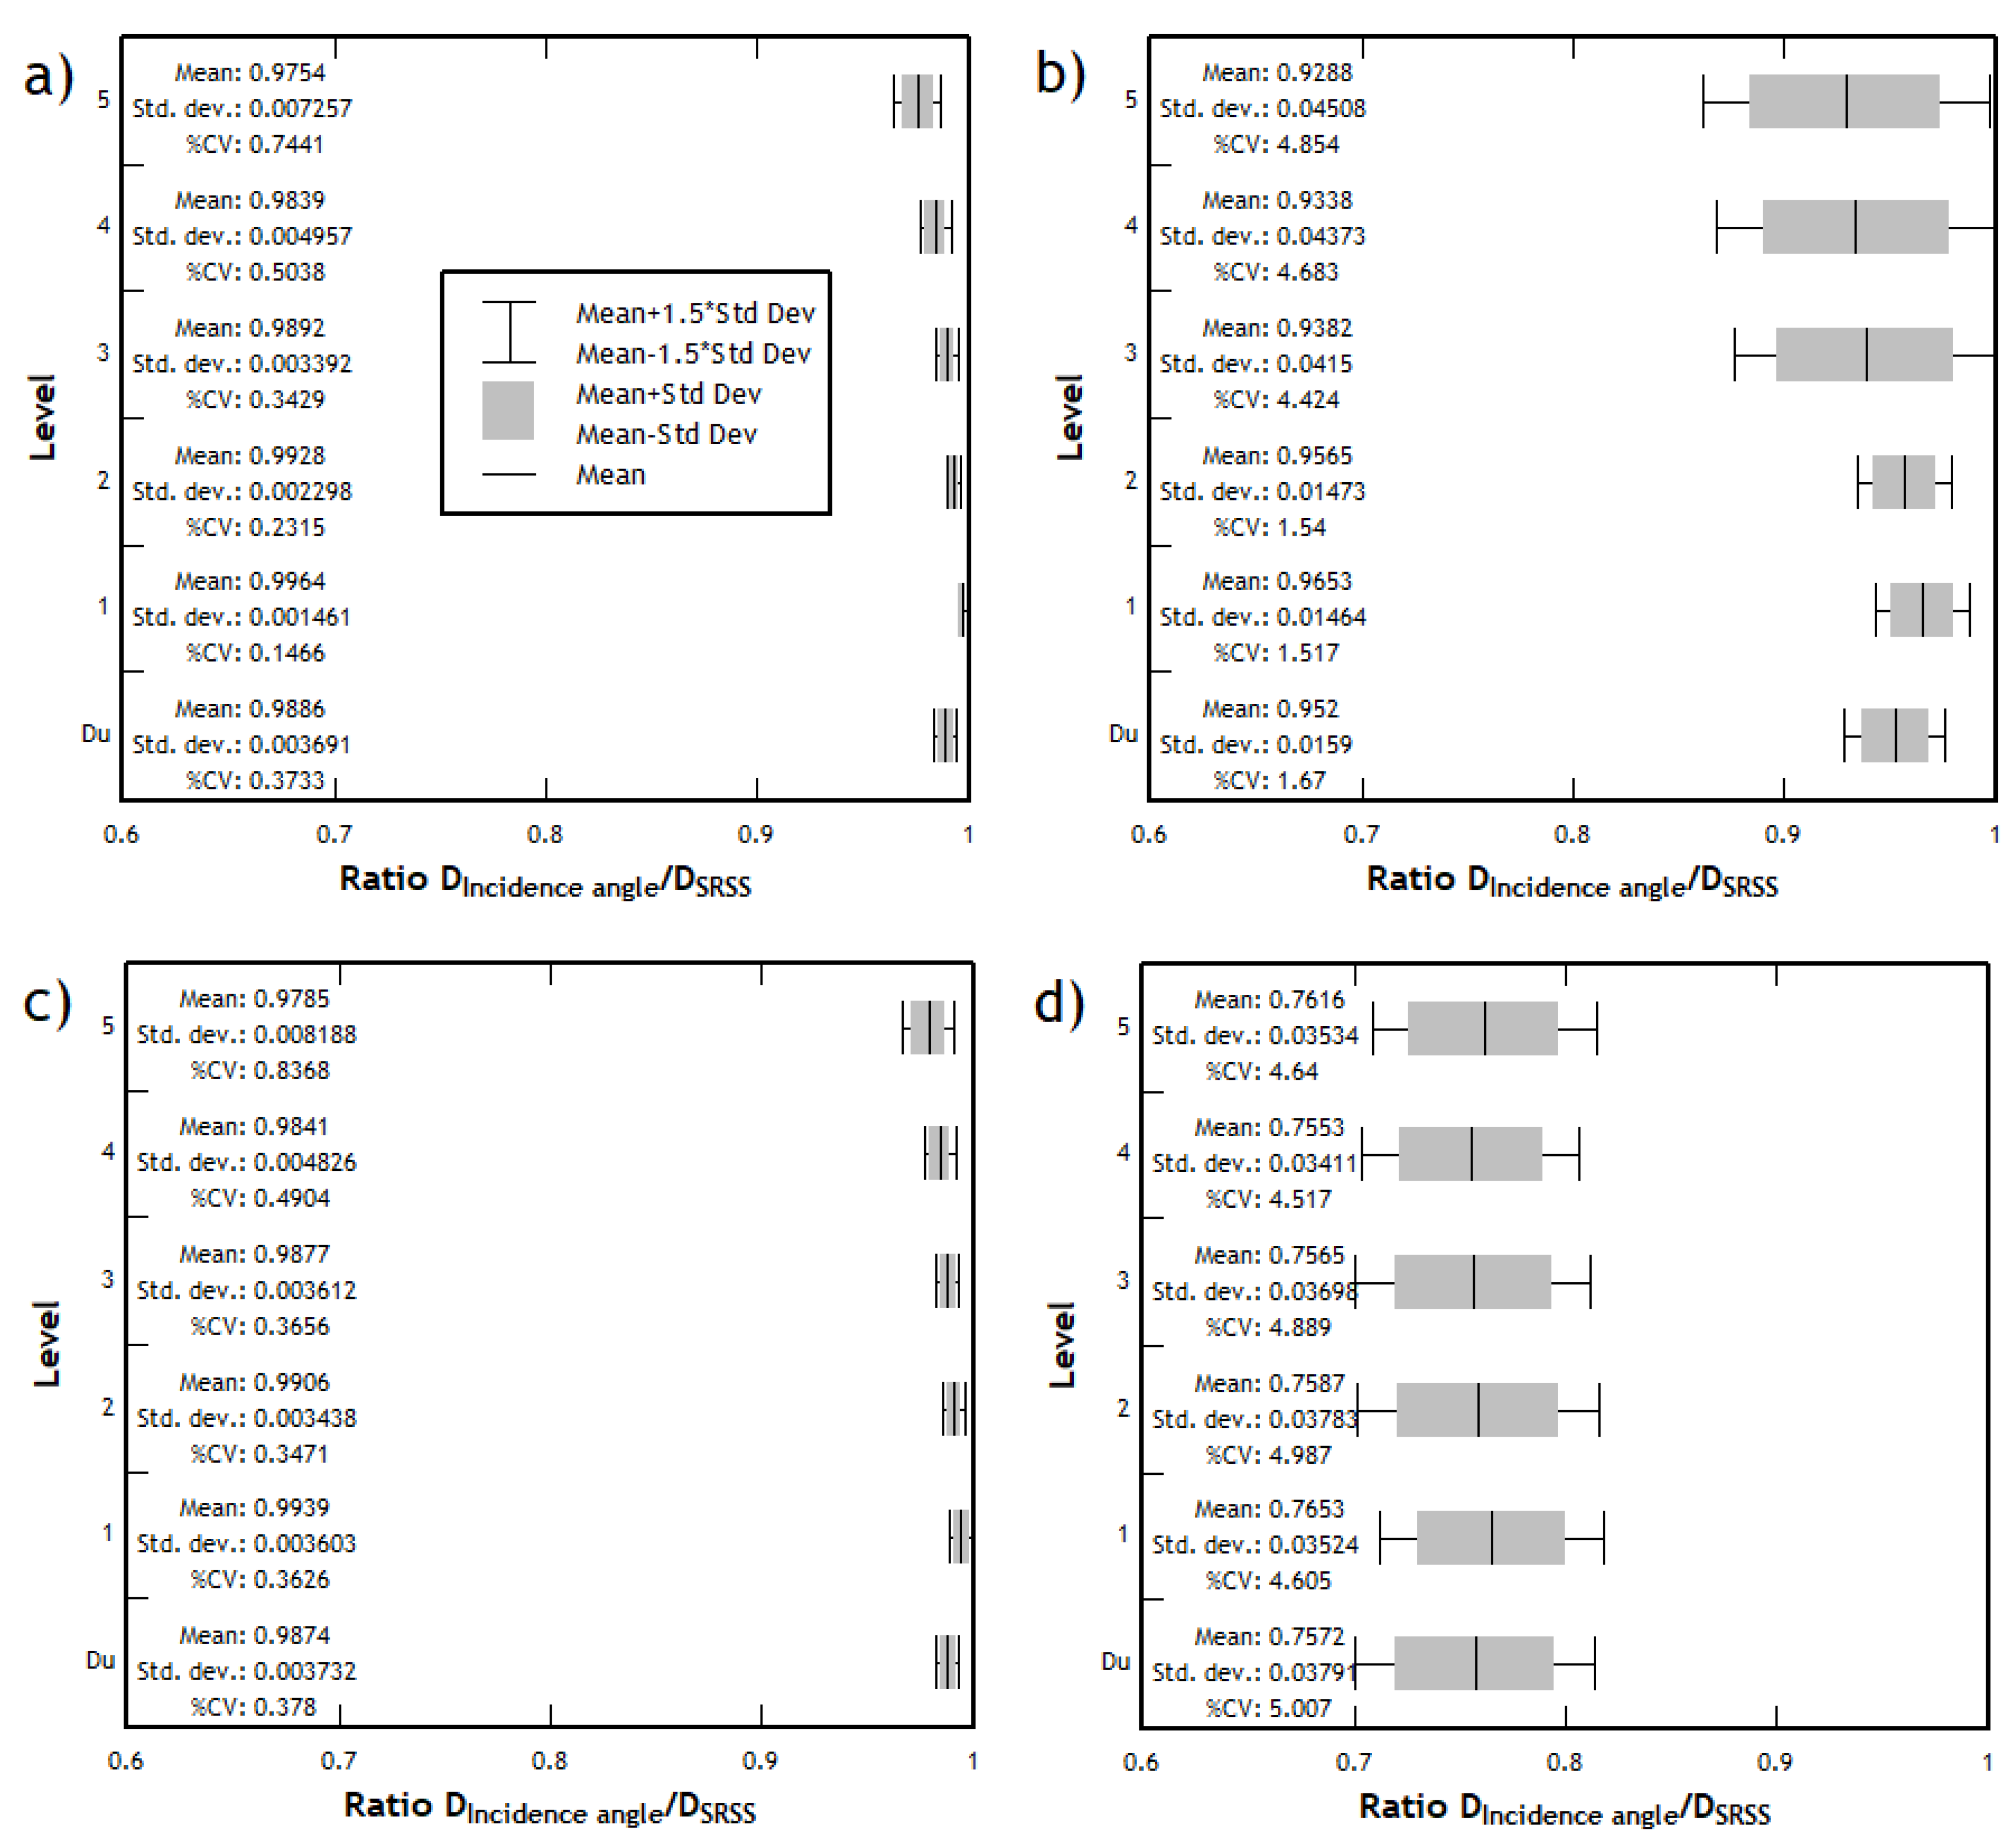
In terms of roof displacement ratios obtained with various angles of incidence (calculated with SRSS combination), structures composed of shear walls and frames (Archetypes 1 and 3) present a lower dispersion than structures composed only of shear walls (Archetype 2) or frame (Archetype 4). The moment-resisting frame archetype presents the lowest mean values of roof displacement ratios, allowing us to consider that the design driven by the values obtained with the SRSS combination should lead to a conservative design of such structural typology.
Although the literature has extensively dealt with this issue, no results are found regarding the cases of shear wall structures, so it would be prudent to carry out more nonlinear time-history analysis using real structures, of different numbers of stories and varied seismic hazard levels, given that—as indicated by various authors—the seismic hazard level is essential when calculating the critical incidence angle.
In this study, the influence of a unidirectional eccentricity was also evaluated, but no substantial differences were observed with respect to other archetypes, thus the review of bidirectional eccentricities of greater magnitude is suggested in order to verify their influence in these case studies. This case corresponds to structures with large plan irregularities.
The results obtained are limited and should go further in the study of the directionality of the earthquake to verify if other parameters of seismic demand are substantially affected or not depending on the angle of incidence considered.

Author Contributions

Conceptualization, J.C.V. and J.C.; methodology, J.C.V.; software, I.B.; validation, I.B., J.C.V., and J.C.; formal analysis, I.B.; investigation, I.B. and J.C.V.; resources, I.B.; data curation, J.C.V.; writing—original draft preparation, I.B.; writing—review and editing, J.C.V.; visualization, J.C.; supervision, J.C.V. and J.C. All authors have read and agreed to the published version of the manuscript.

Funding

This research received no external funding.

Institutional Review Board Statement

Not applicable.

Informed Consent Statement

Not applicable.

Data Availability Statement

The data produced in this study are supported by the authors and may be provided to interested persons upon request to the corresponding author.

Acknowledgments

The authors of this article want to thank Pontificia Universidad Católica de Valparaíso for sponsoring the development of this study and financing its publication in Open Access format.

Conflicts of Interest

The authors declare no conflict of interest.

References

  1. McRae, G.; Matteis, J. Three-Dimensional Steel Building Response to Near-Fault Motions. J. Struct. Eng. 2000, 126, 117–126. [Google Scholar] [CrossRef]
  2. Athanatopoulou, A.M. Critical orientation of three correlated seismic components. Eng. Struct. 2005, 27, 301–312. [Google Scholar] [CrossRef]
  3. Rigato, A.B.; Medina, R.A. Influence of angle of incidence on seismic demands for inelastic single-storey structures subjected to bi-directional ground motions. Eng. Struct. 2007, 29, 2593–2601. [Google Scholar] [CrossRef]
  4. Reyes, J.C.; Kalkan, E. Should Ground-Motion Records Be Rotated to Fault-Normal/Parallel or Maximum Direction for Response History Analysis of Buildings? U.S. Geological Survey Open-File Report; USGS: Reston, VA, USA, 2012. Available online: http://pubs.usgs.gov/of/2012/1261/ (accessed on 2 January 2019).
  5. Kashkooli, N.A.; Banan, N.R. Effect of Frame Irregularity on Accuracy of Modal Equivalent Nonlinear Static Seismic Analysis. KSCE J. Civ. Eng. 2013, 17, 1064–1072. [Google Scholar] [CrossRef]
  6. Magliulo, G.; Maddaloni, G.; Petrone, C. Influence of earthquake direction on the seismic response of irregular plan RC frame buildings. Earthq. Eng. Eng. Vib. 2014, 13, 243–256. [Google Scholar] [CrossRef]
  7. Prajwal, T.P.; Parvez, I.; Kamath, K. Nonlinear Analysis of Irregular Buildings Considering the Direction of Seismic Waves. Mater. Today Proc. 2017, 4, 9828–9832. [Google Scholar] [CrossRef]
  8. Lagaros, N.D. The impact of the earthquake incident angle on the seismic loss estimation. Eng. Struct. 2010, 32, 1577–1589. [Google Scholar] [CrossRef]
  9. Cantagallo, C.; Camata, G.; Spacone, E. The effect of the earthquake incidence angle on seismic demand of reinforced concrete structures. In Proceedings of the 15th World Conference on Earthquake Engineering, Lisboa, Portugal, 24–28 September 2012. [Google Scholar]
  10. Fontara, I.K.; Kostinakis, K.G.; Manoukas, G.E.; Athanatopoulou, A.M. Parameters affecting the seismic response of buildings under bi-directional excitation. Struct. Eng. Mech. 2015, 53, 957–979. [Google Scholar] [CrossRef]
  11. Kostinakis, K.G.; Athanatopoulou, A.M.; Avramidis, I.E. Evaluation of inelastic response of 3D single-story R/C frames under bi-directional excitation using different orientation schemes. Bull. Earthq. Eng. 2013, 11, 637–661. [Google Scholar] [CrossRef]
  12. Kalkan, E.; Reyes, J.C. Significance of rotating ground motions on behavior of symmetric- and asymmetric-plan structures: Part I. Single-story structures. Earthq. Spectra 2015, 31, 1591–1612. [Google Scholar] [CrossRef] [Green Version]
  13. Vielma, J.C.; Porcu, M.C.; López, N. Intensity measure based on a smooth inelastic peak period for a more effective Incremental Dynamic Analysis. Appl. Sci. 2020, 10, 8632. [Google Scholar] [CrossRef]
  14. Vielma, J.C.; Porcu, M.C.; Fuentes, M. Non-linear analyses to assess the seismic performance of RC buildings retrofitted with FRP. Int. J. Numer. Methods Calc. Des. Eng. 2020, 36. Available online: https://www.scipedia.com/public/Vielma-Perez_et_al_2019a (accessed on 2 January 2019).
  15. Porcu, M.C.; Vielma, J.C.; Panu, F.; Aguilar, C.; Curreli, G. Seismic Retrofit of Existing Buildings Led by Non-Linear Dynamic Analyses. Int. J. Saf. Secur. Eng. 2019, 9, 201–212. [Google Scholar] [CrossRef]
  16. Vielma, J.C.; Cando, M. Calibration of the response reduction factors used in Ecuador for steel SMRF. Bull. Int. Inst. Seismol. Earthq. Eng. 2018, 52, 22–37. [Google Scholar]
  17. Wilson, E.L.; Button, M.R. Three-dimensional dynamic analysis for multi-component earthquake spectra. Earthquake Engineering & Structural Dynamics. Earthq. Eng. Struct. Dyn. 1982, 10, 471–476. [Google Scholar] [CrossRef]
  18. Smeby, W.; Der Kiureghian, A. Modal combinations rules for multicomponent earthquake excitation. Earthq. Eng. Struct. Dyn. 1985, 13, 1–12. [Google Scholar] [CrossRef]
  19. González, P. Considering earthquake direction on seismic analysis. In Proceedings of the Tenth World Conference on Earthquake Engineering, Madrid, Spain, 19–24 July 1992. [Google Scholar]
  20. Wilson, E.; Iqbal, S.; Ashraf, H.A. Clarification of the Orthogonal Effects in a Three-Dimensional Seismic Analysis. Earthq. Spectra 1995, 11, 659. [Google Scholar] [CrossRef]
  21. López, O.A.; Torres, R. The critical angle of seismic incidence and the maximum structural response. Earthq. Eng. Struct. Dyn. 1997, 26, 881–894. [Google Scholar] [CrossRef]
  22. Anastassiadis, K.; Avramidis, I.E.; Panetsos, P. Concurrent design forces in structures under three-component orthotropic seismic excitation. Earthq. Spectra 2002, 18, 1–17. [Google Scholar] [CrossRef]
  23. Gao, X.A.; Zhou, X.Y.; Wang, L. Multi-component seismic analysis for irregular structures. In Proceedings of the 13th World Conference on Earthquake Engineering, Vancouver, BC, Canada, 1–6 August 2004. [Google Scholar]
  24. Penzien, J.; Watabe, M. Characteristics of 3-dimensional earthquake ground motions. Earthq. Eng. Struct. Dyn. 1974, 3, 365–373. [Google Scholar] [CrossRef]
  25. Fontara, I.K.; Kostinakis, K.G.; Athanatopoulou, A.M. Some Issues Related to the Inelastic Response of Buildings Under Bi-Directional Excitation. In Proceedings of the 15th World Conference on Earthquake Engineering, Lisboa, Portugal, 24–28 September 2012. [Google Scholar]
  26. Athanapoulou, A.M.; Tsourekas, A.; Papamanolis, G. Variation of response with incident angle under two horizontal correlated seismic components. WIT Trans. Built Environ. 2005, 81, 183–192. [Google Scholar] [CrossRef]
  27. Menun, C.; Der Kiureghian, A. A replacement for the 30%, 40%, and SRSS rules for multicomponent seismic analysis. Earthq. Spectra 1998, 14, 153–163. [Google Scholar] [CrossRef]
  28. Dongsheng, W.; Hong-Nan, L.; Wang, G.X.; Fan, Y.F. Inelastic response spectra for bidirectional ground motions. In Proceedings of the 14th World Conference on Earthquake Engineering, Beijing, China, 12–17 October 2008. [Google Scholar]
  29. Lagaros, N.D. Multicomponent incremental dynamic analysis considering variable incident angle. Struct. Infrastruct. Eng. 2010, 6, 77–94. [Google Scholar] [CrossRef]
  30. Ghobarah, A.; Abou-Elfath, H.; Biddah, A. Response-based damage assessment of structures. Earthq. Eng. Struct. Dyn. 1999, 28, 79–104. [Google Scholar] [CrossRef]
  31. FEMA. FEMA 273. NEHRP Guidelines for Seismic Rehabilitation of Buildings; FEMA: Washington, DC, USA, 1997.
  32. Bravo, F.; Tapia, J. Análisis no Lineal de Comportamiento del Edificio “Mercado Puerto” Reforzado. Pontificia Universidad Católica de Valparaíso, Valparaíso, Chile. 2019. Available online: https://biblioteca.pucv.cl/ (accessed on 2 January 2019). (In Spanish).
  33. INN, NCh433Of.1996 (last version released in 2009). Diseño Sísmico de Edificios, Norma Chilena Oficial, Instituto Nacional de Normalización, Santiago, Chile. 2012. Available online: http://normastecnicas.minvu.cl/ (accessed on 2 January 2019). (In Spanish).
  34. Achisina. Alternative Procedure for the Seismic Analysis and Design of Tall Buildings. Santiago. 2017. Available online: https://www.achisina.cl/images/PBD/ACHISINA_Procedimiento_Alternativo_para_el_An%C3%A1lisis_y_Dise%C3%B1o_S%C3%ADsmico.pdf (accessed on 21 March 2021).
  35. Seismosoft, SeismoMatch 2018—A Computer to Adjust Earthquake Accelerograms to Match a Specific Target Response Spectrum. 2018. Available online: http://www.seismosoft.com (accessed on 1 May 2018).
  36. Al-Atik, L.; Abrahamson, N.A. An improved method for nonstationary spectral matching. Earthq. Spectra 2010, 26, 601–617. [Google Scholar] [CrossRef] [Green Version]
  37. Arias, A. A measure of earthquake intensity. In Seismic Design for Nuclear Power Plants; Hansen, R.J., Ed.; MIT Press: Cambridge, MA, USA, 1970; pp. 438–483. [Google Scholar]
  38. Martineau, M.; López, A.; Vielma, J.C. Effect of Earthquake Ground Motion Duration on the Seismic Response of a Low-Rise RC Building. Adv. Civ. Eng. 2020, 2020, 8891282. [Google Scholar] [CrossRef]
  39. FEMA (Federal Emergency Management Agency). NEHRP Guidelines for the Seismic Rehabilitation of Buildings; FEMA: Washington, DC, USA, 1996.
  40. Vielma, J.C.; Mulder, M. Improved procedure for determining the ductility of buildings under seismic loads. Int. J. Numer. Methods Calc. Des. Eng. 2018, 34, 1–27. [Google Scholar] [CrossRef]
  41. Mander, J.B.; Priestley, M.J.N.; Park, R. Theoretical stress-strain model for confined concrete. J. Struct. Eng. 1988, 114, 1804–1826. [Google Scholar] [CrossRef] [Green Version]
  42. Menegotto, M.; Pinto, P.E. Method of analysis for cyclically loaded R.C. plane frames including changes in geometry and non-elastic behaviour of elements under combined normal force and bending. In Symposium on the Resistance and Ultimate Deformability of Structures Acted on by Well Defined Repeated Loads; International Association for Bridge and Structural Engineering: Zurich, Switzerland, 1973; pp. 15–22. [Google Scholar]
  43. Seismosoft, SeismoStruct 2018—A Computer Program for Static and Dynamic Nonlinear Analysis of Framed Structures. 2018. Available online: http://www.seismosoft.com (accessed on 1 May 2018).
Figure 1. Reference system; (a) maximum reactions; (b) minimum reactions [22].
Applsci 12 01534 g001
Figure 2. Representation using the circle of Mohr [22].
Applsci 12 01534 g002
Figure 3. Displacements with respect to reference axis (p, w) [26].
Applsci 12 01534 g003
Figure 4. Displacements with respect to the reference axis (x, y) [26].
Applsci 12 01534 g004
Figure 5. Definition of axes according to the angle of incidence [29].
Applsci 12 01534 g005
Figure 6. Design elastic spectrum in displacements, amplified by 17% with both average response spectra and those obtained for the records used in the investigation.
Applsci 12 01534 g006
Figure 7. Plan of archetypes used for analysis of the influence of the angle of incidence: (a) Archetype 1 plan, torsionally flexible; (b) Archetype 2 plan, torsionally rigid; (c) Archetype 3 plan, unidirectional eccentricity; (d) Archetype 4 plan, flexible.
Applsci 12 01534 g007
Figure 8. Isometric views of the archetypes studied: (a) Archetype 1 with a semi-rigid structure made up of frames and a core of shear walls, (b) Archetype 2 with a rigid structure made up of shear walls, (c) Archetype 3 with a semi-rigid structure made up of frames and shear walls distributed asymmetrically, and (d) Archetype 4 with a flexible structure made up of frames.
Applsci 12 01534 g008
Figure 9. Inelastic design spectrum with the predominant structural periods in the directions of analysis.
Applsci 12 01534 g009
Figure 10. Capacity curves obtained from conventional pushover analysis.
Applsci 12 01534 g010
Figure 11. Mean interstory drift measurements normalized for Archetype 1 per story, (a) without and (b) with SRSS combination.
Applsci 12 01534 g011
Figure 12. Mean interstory drift normalized for Archetype 2 per story, (a) without and (b) with SRSS combination.
Applsci 12 01534 g012
Figure 13. Mean interstory drift normalized for Archetype 3 per story, (a) without and (b) with SRSS combination.
Applsci 12 01534 g013
Figure 14. Mean interstory drift normalized for Archetype 4 per story, (a) without and (b) with SRSS combination.
Applsci 12 01534 g014
Figure 15. Mean roof displacement, SRSS combination for (a) Archetype 1, (b) Archetype 2, (c) Archetype 3 and (d) Archetype 4.
Applsci 12 01534 g015
Figure 16. Ratio of the interstory drifts achieved with different angles of incidence with respect to the displacements achieved using SRSS combination for (a) Archetype 1, (b) Archetype 2, (c) Archetype 3, and (d) Archetype 4.
Applsci 12 01534 g016
Table 1. Set of strong motions used to perform the nonlinear response analysis [32].
Seismic EventMwEpicenter CoordinatesStationDirectionPGA (g)PGV (cm/s)PGD (cm)Significant Duration (s)
Valparaíso 19858.0 (CSN)33.207° SMelipillaLongitudinal0.5340.306.0329.35
Transverse0.6934.2012.0129.35
7.4 (USGS)71.663° WSan IsidroLongitudinal0.7243.206.9145.40
Transverse0.7143.405.5445.40
Bío-Bío 20108.8 (CSN)36.122° SAngolLongitudinal0.9437.503.4054.01
Transverse0.7034.307.0054.01
Concepción San PedroLongitudinal0.6144.7021.1078.15
8.8 (USGS)72.898° WTransverse0.6538.1020.1078.15
ConstituciónLongitudinal0.5443.309.8066.49
Transverse0.6368.6013.9066.49
Coquimbo 20158.4 (CSN)31.573° SEl PedregalLongitudinal0.6930.6019.8052.74
Transverse0.5726.2015.6052.74
8.3 (USGS)71.674° WTololoLongitudinal0.2431.8014.5053.72
Transverse0.3538.2011.6053.72
Table 2. Properties of concrete and reinforcement steel.
MaterialDenomination f c   or   F y [ M P a ] E   [ G P a ] ν γ [ k g / m 3 ]
ConcreteG252525.70.22500
SteelA630-420H4202000.37850
Table 3. Periods of the first six modes of vibration of the archetypes.
Archetype
1234
ModeT(s)Mode TypeT(s)Mode TypeT(s)Mode TypeT(s)Mode Type
10.239y0.103y0.17y0.348y
20.205z0.077x0.093x0.346x
30.116x0.057z0.074y0.283z
40.082y0.037y0.06y0.12y
50.07z0.032z0.042z0.119x
60.05y0.03x0.037z0.097z
Table 4. Torsional properties of the archetypes.
Archetype
Parameter1234
Structural eccentricity e x (m)0.000.008.700.00
e y (m)0.000.000.000.00
Structural stiffness K x (kN/m)3,209,720.857,330,165.605,072,777.75325,002.45
K y (kN/m)737,992.794,069,043.811,610,221.60320,719.98
Torsional stiffness J T C (kN.m/rad)49,469,906.05706,687,893.34237,687,881.8729,340,630.20
Trosional radius r x c (m)8.1913.1812.159.56
r y c (m)3.939.826.859.50
Radius of gyration l s (m)6.766.766.766.76
Table 5. Summary of the angles of incidence that produce the maximum and minimum drifts on the archetypes in the x and y directions.
Min. Interstory Drift xMax. Interstory Drift xMin. Interstory Drift yMax. Interstory Drift y
ArchetypeInc. AngleStoryInc. AngleStoryInc. AngleStoryInc. AngleStory
1292° 30′1202° 30′5135°1270°5
267° 30′2157° 30′1135°1247° 30′5
367° 30′1157° 30′545°1157° 30′5
467° 30′1157° 30′4157° 30′190°4
Table 6. Summary of the angles of incidence that produce the maximum and minimum interstory drifts on the archetypes.
ArchetypeMin. Interstory DriftMax. Interstory Drift
1135°270°
2135°247° 30′
3315°157° 30′
4225°
Table 7. Summary of the angles of incidence that produce the maximum and minimum roof displacement on the archetypes in each direction.
ArchetypeMin. Displ. xMax. Displ. xMin. Displ. yMax. Displ. y
1292° 30′202° 30′135°22° 30′
267° 30′315°135°247° 30′
367° 30′157° 30′135°157° 30′
467° 30′337° 30′157° 30′247° 30′
Table 8. Summary of the angles of incidence that produce the maximum and minimum roof displacement on the archetypes, SRSS combination.
ArchetypeMin. Displ. Max. Displ.
1135°22° 30′
2135°247° 30′
3135°157° 30′
4225°270°
Publisher’s Note: MDPI stays neutral with regard to jurisdictional claims in published maps and institutional affiliations.

