1. Introduction
Bar codes are widely used in the field of warehouse identification. In many cases, they are gradually replaced by RFID tags to provide greater automation, increase reading speed and reduce error rates. Reading RFID tags has a number of advantages over barcodes. It can be performed without the need for direct visibility and it is also possible to load multiple pieces of tags at once, see Sue et al. [
1]. The reading of these identifiers is performed mainly in two ways, namely by reading with a hand-held reader or by a reading gate. In the case of a hand-held reader, there is always a need for human effort, which is associated with low speed, probability of error and omission. The reading gate finds its use where the flow of goods passes through one place, such as a gate through which a goods forklift or a belt conveyor passes. However, in the case of goods placed in a large outdoor warehouse, we can imagine two tasks, where both of these options meet their limits.
The first task is a quick and automatic inventory of the entire outdoor warehouse. A warehouse worker with a hand-held reader would have to go around all the places and load every item, which of course would take him a lot of time, open up space for human error and it may also be difficult to access some places (such as boxes of goods above human reach). The second case is the automatic localization of specific goods to determine the coordinates on the area of the outdoor warehouse. Using a reading gate at the entrance and exit of the warehouse, we provide an overview of what entered the warehouse and what left the warehouse, but we are no longer able to say exactly where the goods are located. In our paper we try to optimize both of these tasks using a combination of UAV’s and a lightweight RFID reader. The UAV, equipped with GPS and tracking and positioning system, carrying the reader can perform the inventory automatically according to the specified trajectory, faster, without errors, with a defined and repeatable route.
For each implementation of UHF RFID (ultra high frequency, radio frequency identification), it is necessary to design an optimal solution regarding the nature of the environment, identified objects and the required reading distance. However, the use of this technology in outdoor warehouses is associated with new problems connected to the readability of UHF RFID tags on objects containing larger amounts of water, such as raw wood or snow and ice. Specific approaches will also require the placement of a high-performance reader on a movable carrier—UAV. The main goal of this paper is to find the optimal height for reading UHF RFID tags using a reader with an antenna placed on a UAV. The first steps to determining altitude are to find statistically significant differences in the RFID tag’s radio frequency response to the tag retrieval attempt and the response properties of neighboring tag.
1.1. Related Work
Su et al. [
1] presented a study where they dealt with published papers on radio frequency identification (RFID) applications from an academic database. The aim was to explore the topic’s development trajectory and predict future development trends. They presented a forecast in their paper, based on some data analysis, where the size of the global RFID market is predicted at a 7.7% compound annual growth rate from 2017 to 2023 and that by 2023, the RFID market would be worth US
$31.42 billion.
RFID technology is widely used in many applications. There are many benefits to deploying RFID technology. Su et al. [
1] presented a main conclusion for using RFID applications in supply chain management. “Such applications enhance the operating time, reduce management costs and perceived risk, and eliminate idle time. Thus, in these RFID applications, multiple targets can be simultaneously and rapidly identified, and information storage advantages more favorable than those offered barcodes are provided.”
Motroni et al. [
2] dealt with the problem of determining the location of pallets carried by forklifts inside a warehouse, which are recognized thanks to an onboard radio frequency identification system at the ultra-high-frequency band. By reconstructing the forklift trajectory and orientation, the location of the pallets can be associated with the forklift position at the time of unloading events. The products are organized in pallets, which are tagged with passive UHF-RFID tags that allow their identification. The forklift is equipped with a series of sensors that enable its self-localization thanks to an on-site processing unit. In particular, the smart forklift is equipped with a UWB tag, which receives the signal from a set of UWB (ultra-wideband) anchors installed on the warehouse ceiling.
Park et al. [
3] proposed a passive RFID-based indoor inventory localization method for small and medium-sized enterprises to effectively manage their indoor inventory tracking in terms of the multi-stacking racking. They presented a concept of reference tags and a calculation of measurement for the distance between the RFID reader and reference tag to improve the accuracy of the item location recognition. The main contribution of this paper is that it demonstrates how passive RFID can be used by SMEs (small and medium sized enterprises) to identify the location of the stock loaded in MSR (multi-stacking racking) as part of a low-cost WMS (warehouse management system).
Quino at al. [
4] describes efforts to link RFID technology and UAVs (unmanned aerial vehicle) to automate warehousing and inventory processes in a specific agricultural environment. The experiments were performed in two phases, first in laboratory conditions and then directly in the field. During the experiment, they tested numerous different RFID tags from four directions at different heights of 1.5 m, 3 m, 4.5 m, 6 m and 7.6 m. When analyzing the results, they managed to identify a suitable combination of the used tag and direction and the given reading distance for a specific application.
Tubis et al. [
5] presented a paper describing the theoretical deployment of UAVs in the warehouse environment. Experts from practice who already have experience with the deployment of drones in the warehouse have compiled a risk assessment model. The model includes various events that may occur when deploying UAVs in warehouses and assesses their risks using fuzzy logic in the Matlab environment.
Kalinov et al. [
6] provides an insight into the use of drones in the internal warehouse as an inventory tool. In their work they focus on the use of barcodes. They use two types of robots to move in the warehouse. The first is a ground robot that brings the UAV to a given location in the warehouse and then the UAV starts in the horizontal direction and reads the barcodes on the shelves.
Wu [
7] presented an intelligent parking management system utilizing radio frequency identification (RFID). His system can detect empty parking spaces thanks to the RFID reader mounted on the drone, and guide vehicles looking for a parking space to the nearest one. To validate the system feasibility and reliability, Wu [
7] has conducted some preliminary studies and experiments. The experimental results showed that the deployed reader can detect the tag successfully in both indoor and outdoor environments.
The aim of the article presented by Chocholac et al. [
8] is to demonstrate the use of logistic technologies and automatic identification for tracking of manufactured passenger cars on consolidation areas in the form of an interpretive case study. Their article compares the potential implementation of GPS (global position system) technology and RFID (radio frequency identification) technology in combination with a drone for tracking of manufactured passenger cars in consolidation areas. The main conclusion of this paper [
8] can be presented as follows. The article tested three scenarios in the form of an interpretative case study. The best solution for tracking of manufactured passenger cars on consolidation areas was identified in Scenario B (implementation of RFID technology) based on the results of an interpretative case study and selected criterion.
Liu et al. [
9] established a trajectory planning model for UAVs (unmanned aerial vehicles) equipped with RFID readers based on inventory tasks. The performance constraints of UAVs are considered, and the cost-effectiveness ratio of UAVs was studied from the perspective of work. The algorithm’s hybrid DE (differential evolution) algorithm uses the variability of the DE algorithm and introduces the roulette strategy and the population grading system strategy into the algorithm, which improves the global search ability of the lion algorithm, makes the algorithm more uniform and avoids the lion group. The authors presented a conclusion that it is easy for the algorithm to fall into a local optimal problem when dealing with the trajectory planning problem in the complex 3D environment. It improves the efficiency and safety factor of the UAV’s inventory with high-precision portable RFID readers and effectively reduces the length of the flight path during inventory to reduce energy consumption. By comparing with other trajectory planning methods and manual inventory methods, they presented that the effectiveness of the algorithm in inventory has been verified. However, after obtaining the trajectory information, there is still a need for a flight controller to control the UAV equipped with RFID readers so that the UAV can strictly follow the planned flight path, the next step of their research is how to make the warehouse drone complete a self-made flight, but it requires more accurate mapping and positioning of the warehouse.
Almaki [
10] proposed a model that aims to measure resonant frequency of goods dielectric constants (permittivity) wirelessly from an aerial drone for safety and security purposes. As the author mentioned in [
10], the proposed sensor uses a chipless RF, which has steadily emerged due to its low cost and strong identification system. A chipless RFID transponder has two parts and potentially multi-layer labels to re-radiate the electromagnetic wave in the vicinity of a reader and planar. Simulation results using CST (computer simulation technology) microwave studio and MATLAB tools confirm that enabling-RFID and drones for detecting the quality and safety of food is a promising and cost-effective approach.
1.2. Motivation
This research is closely linked to a research and development project called Inventory Control Platform Using AI based Drone with inventory exploration and recognition. The main goal of the project is to develop, test, pilot and deploy an RFID reader operating in the 865–868 MHz band, in a compact design with an antenna, power supply and communication interface (up to 1.5 kg), suitable for mounting on an UAV. The SW module will be developed for determining the legibility of the tag and used to define the height from which the placed tag in the environment can be effectively read. Based on this research, the methodology will be written. This methodology will describe the algorithm and the most suitable combinations of RFID tags and their placement on objects in the outdoor warehouse.
This paper is organized as follows.
Section 1 describes the introduction and main motivation for this research as well as related work.
Section 2 presents materials, methods and methodology of the paper and performed tests.
Section 3 analyses the experimental results.
Section 4 is focused on discussing the results and offers the possibilities of future work. Then
Section 5 brings the final conclusions.
2. Materials and Methods
There are many universal antennas that can be used for a very wide range of different applications. For many others, however, it is necessary to design special antennas that meet and guarantee functionality in given conditions. Several professional publications are devoted to the design of antennas [
11,
12,
13,
14,
15,
16,
17,
18,
19,
20,
21,
22]. As can be seen, the physical properties of the antenna and the reader play a very important role in the design of the RFID system.
Aslam et al. [
11] proposed an antenna structure which achieves free space and an on-metal reading range of better than 8 m and 11 m, respectively, in the US RFID band of 902–928 MHz. Their design topology brings some benefits such as bandwidth enhancement in the single band and the possibility of attaining a tunable dual band coverage in the UHF RFID band.
Rao et al. [
12] presented an overview of antenna design for passive UHF RFID tags. The various requirements have been discussed.
Additionally, Marrocco [
13] presents a homogeneous survey of relevant methodologies for the design of UHF passive tag antennas.
Huang et al. [
14] discuss the basics of antenna design and theory. Finding the requirements for antenna in a radio frequency system is very difficult task. These requirements or antennas’ parameters can be various even for similar RFID applications in the same frequency band.
Dobkin et al. [
15] studied the effects of nearby objects on the read range of several types of RFID tags, and the impedance, pattern and radiative efficiency of antennas that closely emulate the tag structures, using measurements and simulations. They present that detuning of the load impedance of antenna plays an important role only when the tag is very close to the object.
Other authors [
16,
17,
18,
19,
20,
21,
22] also describe procedures for antenna design, describe how to properly tune the antenna for a given type of application, etc.
For the antenna, we are mainly interested in the impedance, reflection coefficient, radiating directional characteristic, gain, bandwidth, as well as the polarization of the antenna. Parameters of used antenna are listed in
Table 1. The key parameters of the reader include the values of transmission power and sensitivity, which indicates the minimum value of the received signal that the reader can detect.
To read the tag correctly, it is necessary to meet two basic conditions. The first condition must ensure sufficient transmitted power to activate the tag. The second necessary condition is that the power reflected by the tag is large enough for the reader to record it.
Free-space path loss (FSPL). To calculate the attenuation of the signal (electromagnetic wave) due to the scattering of the wave into free space, we use the following formulas:
Variables are defined in
Table 2. To calculate the attenuation of free space in decibels, we use the following relation:
The calculation of the specific free space attenuation at 4 m, where in the ETSI band (European Telecommunications Standards Institute) it is allowed to transmit on the frequency 865–868 MHz, is therefore the following:
The following figure,
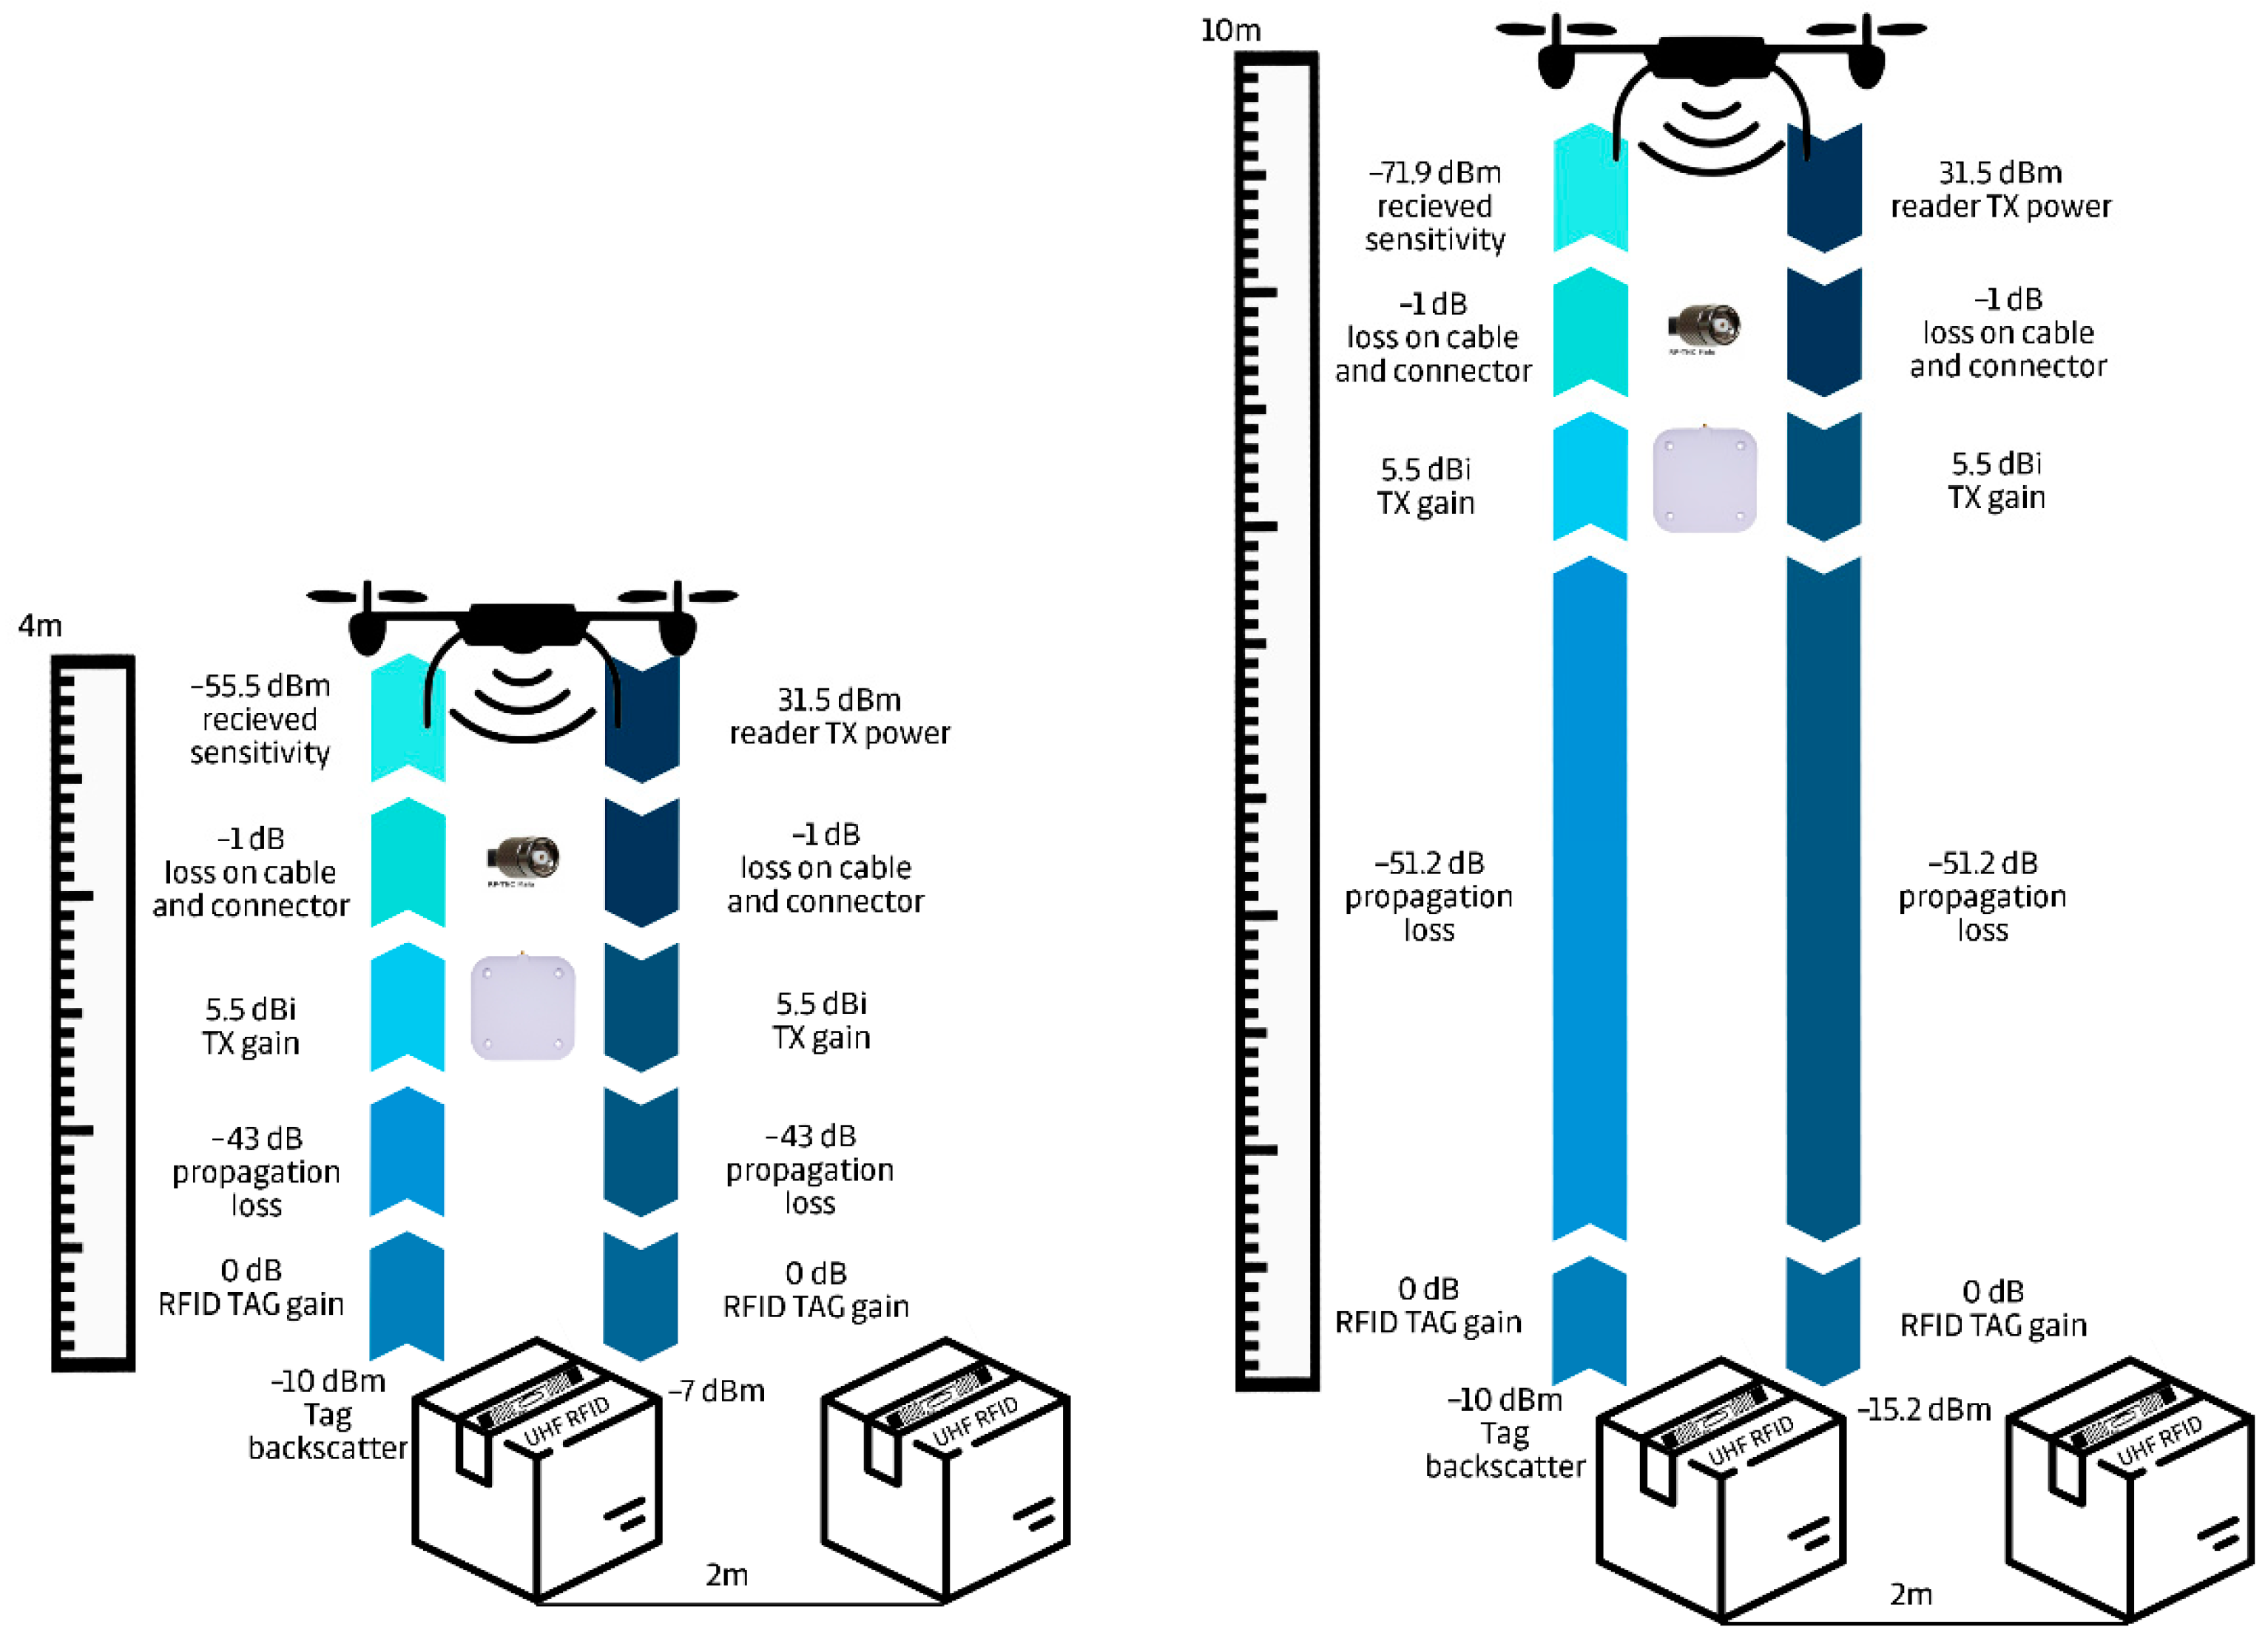
Figure 1, shows an illustrative case for how important the above-mentioned parameters are to be considered. This is an example where we have signal propagation in free space. The main intended application is the use for identification purposes using a drone in an outdoor warehouse, where there is no permanent obstacle between the read object and the drone. In a real installation, other properties that affect the signal strength play a key role in the whole chain.
In the considered case, which is shown in
Figure 1, the transmission power of the RFID reader is set to 31.5 dBm. The attenuation on the cable must also be considered. The longer the cable, the greater the signal attenuation. In the case under consideration, the loss is 1 dB. The antenna itself has a “transmit” gain (Tx Gain) of 5.5 dB. Due to the permeability of the environment and the propagation of the signal, there is a loss of power in it. In this case, a loss of 43 dB at about 4 m is considered, see
Table 3. In the end, a signal with a strength of −7 dBm arrives at the RFID tag.
The sensitivity of the RFID tag with the Monza
® 5 UHF Gen 2 RFID Tag chip is −20 dBm in the considered case, see [
23], so there is a 13 dB margin. The RFID tag absorbs part of the signal strength, using 10 dBm to charge the tag and send a response. If the tag with a signal strength of −17 dBm responds, the attenuation of the free space is again −43 dB, in this case a signal with a strength of −55.5 dBm is returned to the RFID reader. In the end, this means that if the reader had a sensitivity of only −50 dBm, it would not be able to read the tag at a distance of 4 m at a given transmission power and antenna gain.
The considered RFID reader has a sensitivity of −80 dBm, so it has sufficient sensitivity for reading the tag even at a greater distance, see
Table 4. However, it is necessary to consider the real conditions when the attenuation of the free space could be for any reason greater, part of the signal strength would be absorbed by the material on which the tag is placed, etc.
The following table,
Table 3, summarizes the FSPL for each RFID tag distance from the RFID antenna.
For the purposes of this experiment, a Confidex Survivor UHF RFID passive transponder was used. The selected model is a Class 1 Generation 2 tag working in frequency band 885–869 MHz with a maximum read range of up to approximately 8 m.
The next table,
Table 5, presents UHF RFID tags that are suitable for the intended purposes, i.e., inventory management using UAVs, long read range and use in outdoor conditions (IP rating 68).
At this point, it could be interesting to define the situation as an optimization problem based on means of radiation patterns of both interrogator and RFID tag antennas, polarization mismatch, signal fading due to interferences produced by multiple reflections and solving it mathematically.
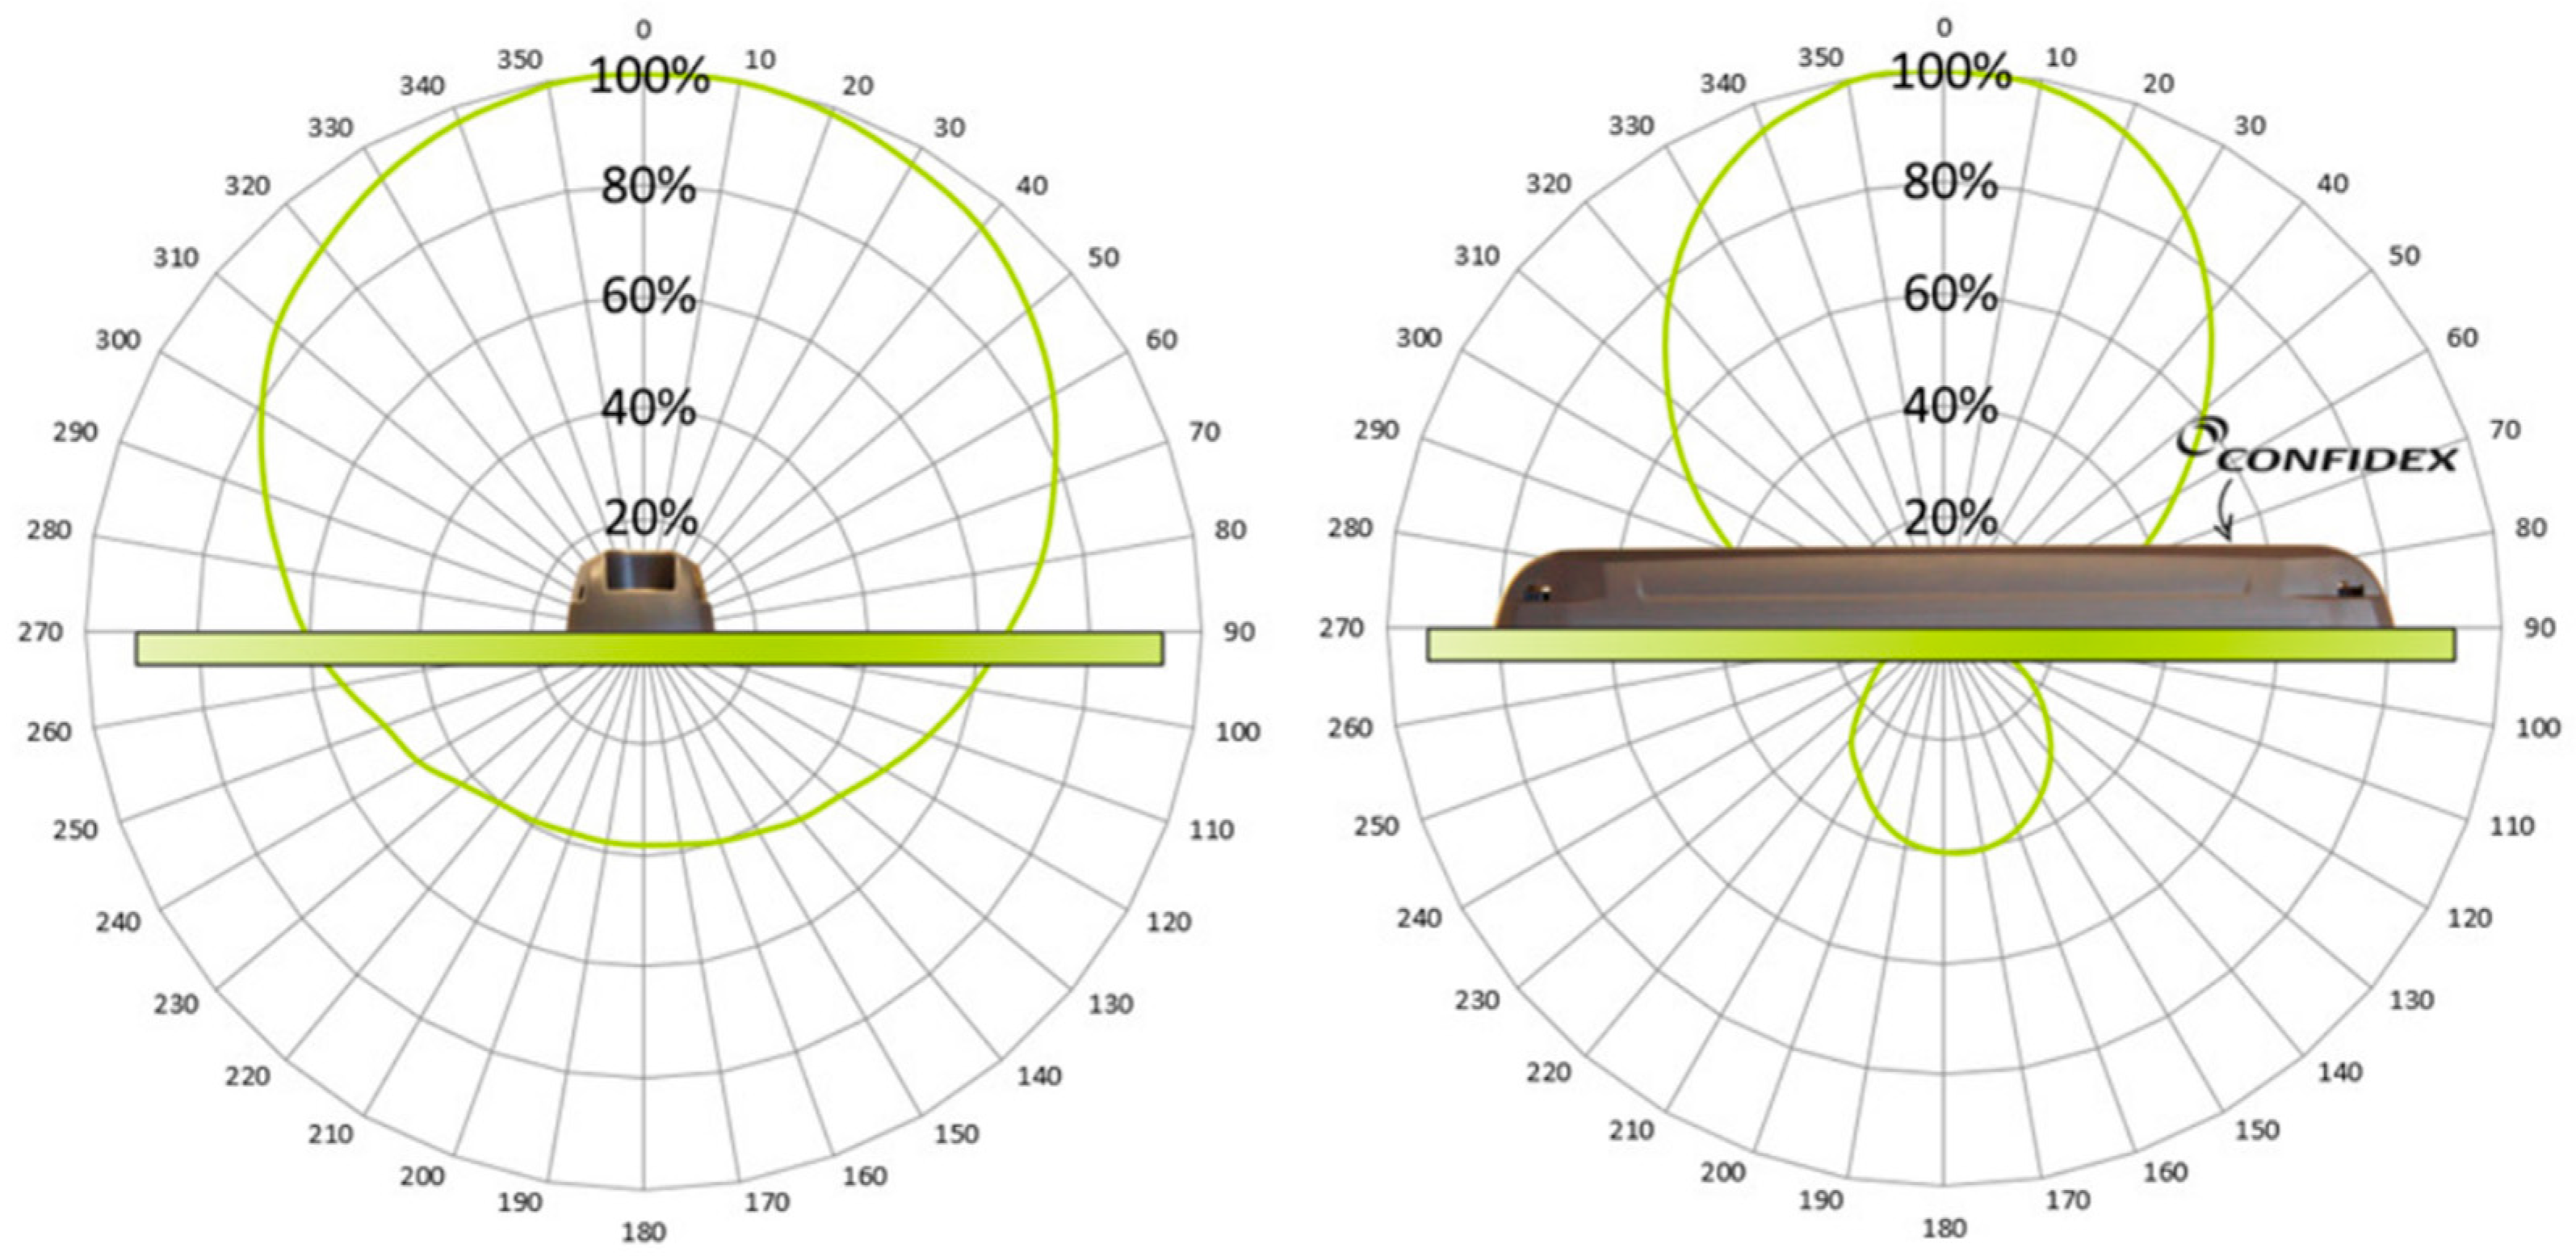
However, the detailed specifications of radiation patterns (or equation describing the shape of the lobe boundary surface) of interrogator antennas and especially those incorporated in RFID tags are not available in datasheets. For example, the information to be found for interrogator antenna is “Radiation lobe width is 75°” and “Antenna gain is 5.5 dB”. For tag antenna properties, only a picture (
Figure 2) without any exact numbers is published.
The depicted and expected radiation pattern of both mentioned antennas gives us presupposition of the difference in RSSI values of tag right under the interrogator antenna and in the neighboring 2 m distance. Therefore, we were forced to rely completely on experimental character data and its statistical comparison based on measured RSSI.
The localization subsystem must be able to distinguish between two neighboring locations. The smallest logistic units used in the selected warehouse has dimensions of 2 m by 2 m. The distinguishing process and its result are based on the value of RSSI (received signal strength indication), while the statistically significantly stronger signal (we decided that 95% confidence level is fully sufficient) is considered to come from the tag that is located directly under the reading antenna. The selected RFID tag (Confidex Survivor) must be placed in the center of the top side of the logistic unit, therefore the distance between two different RFID tags is at least 2 m. To test the boundary conditions of the identification and distinction process, a specific test scenario was proposed.
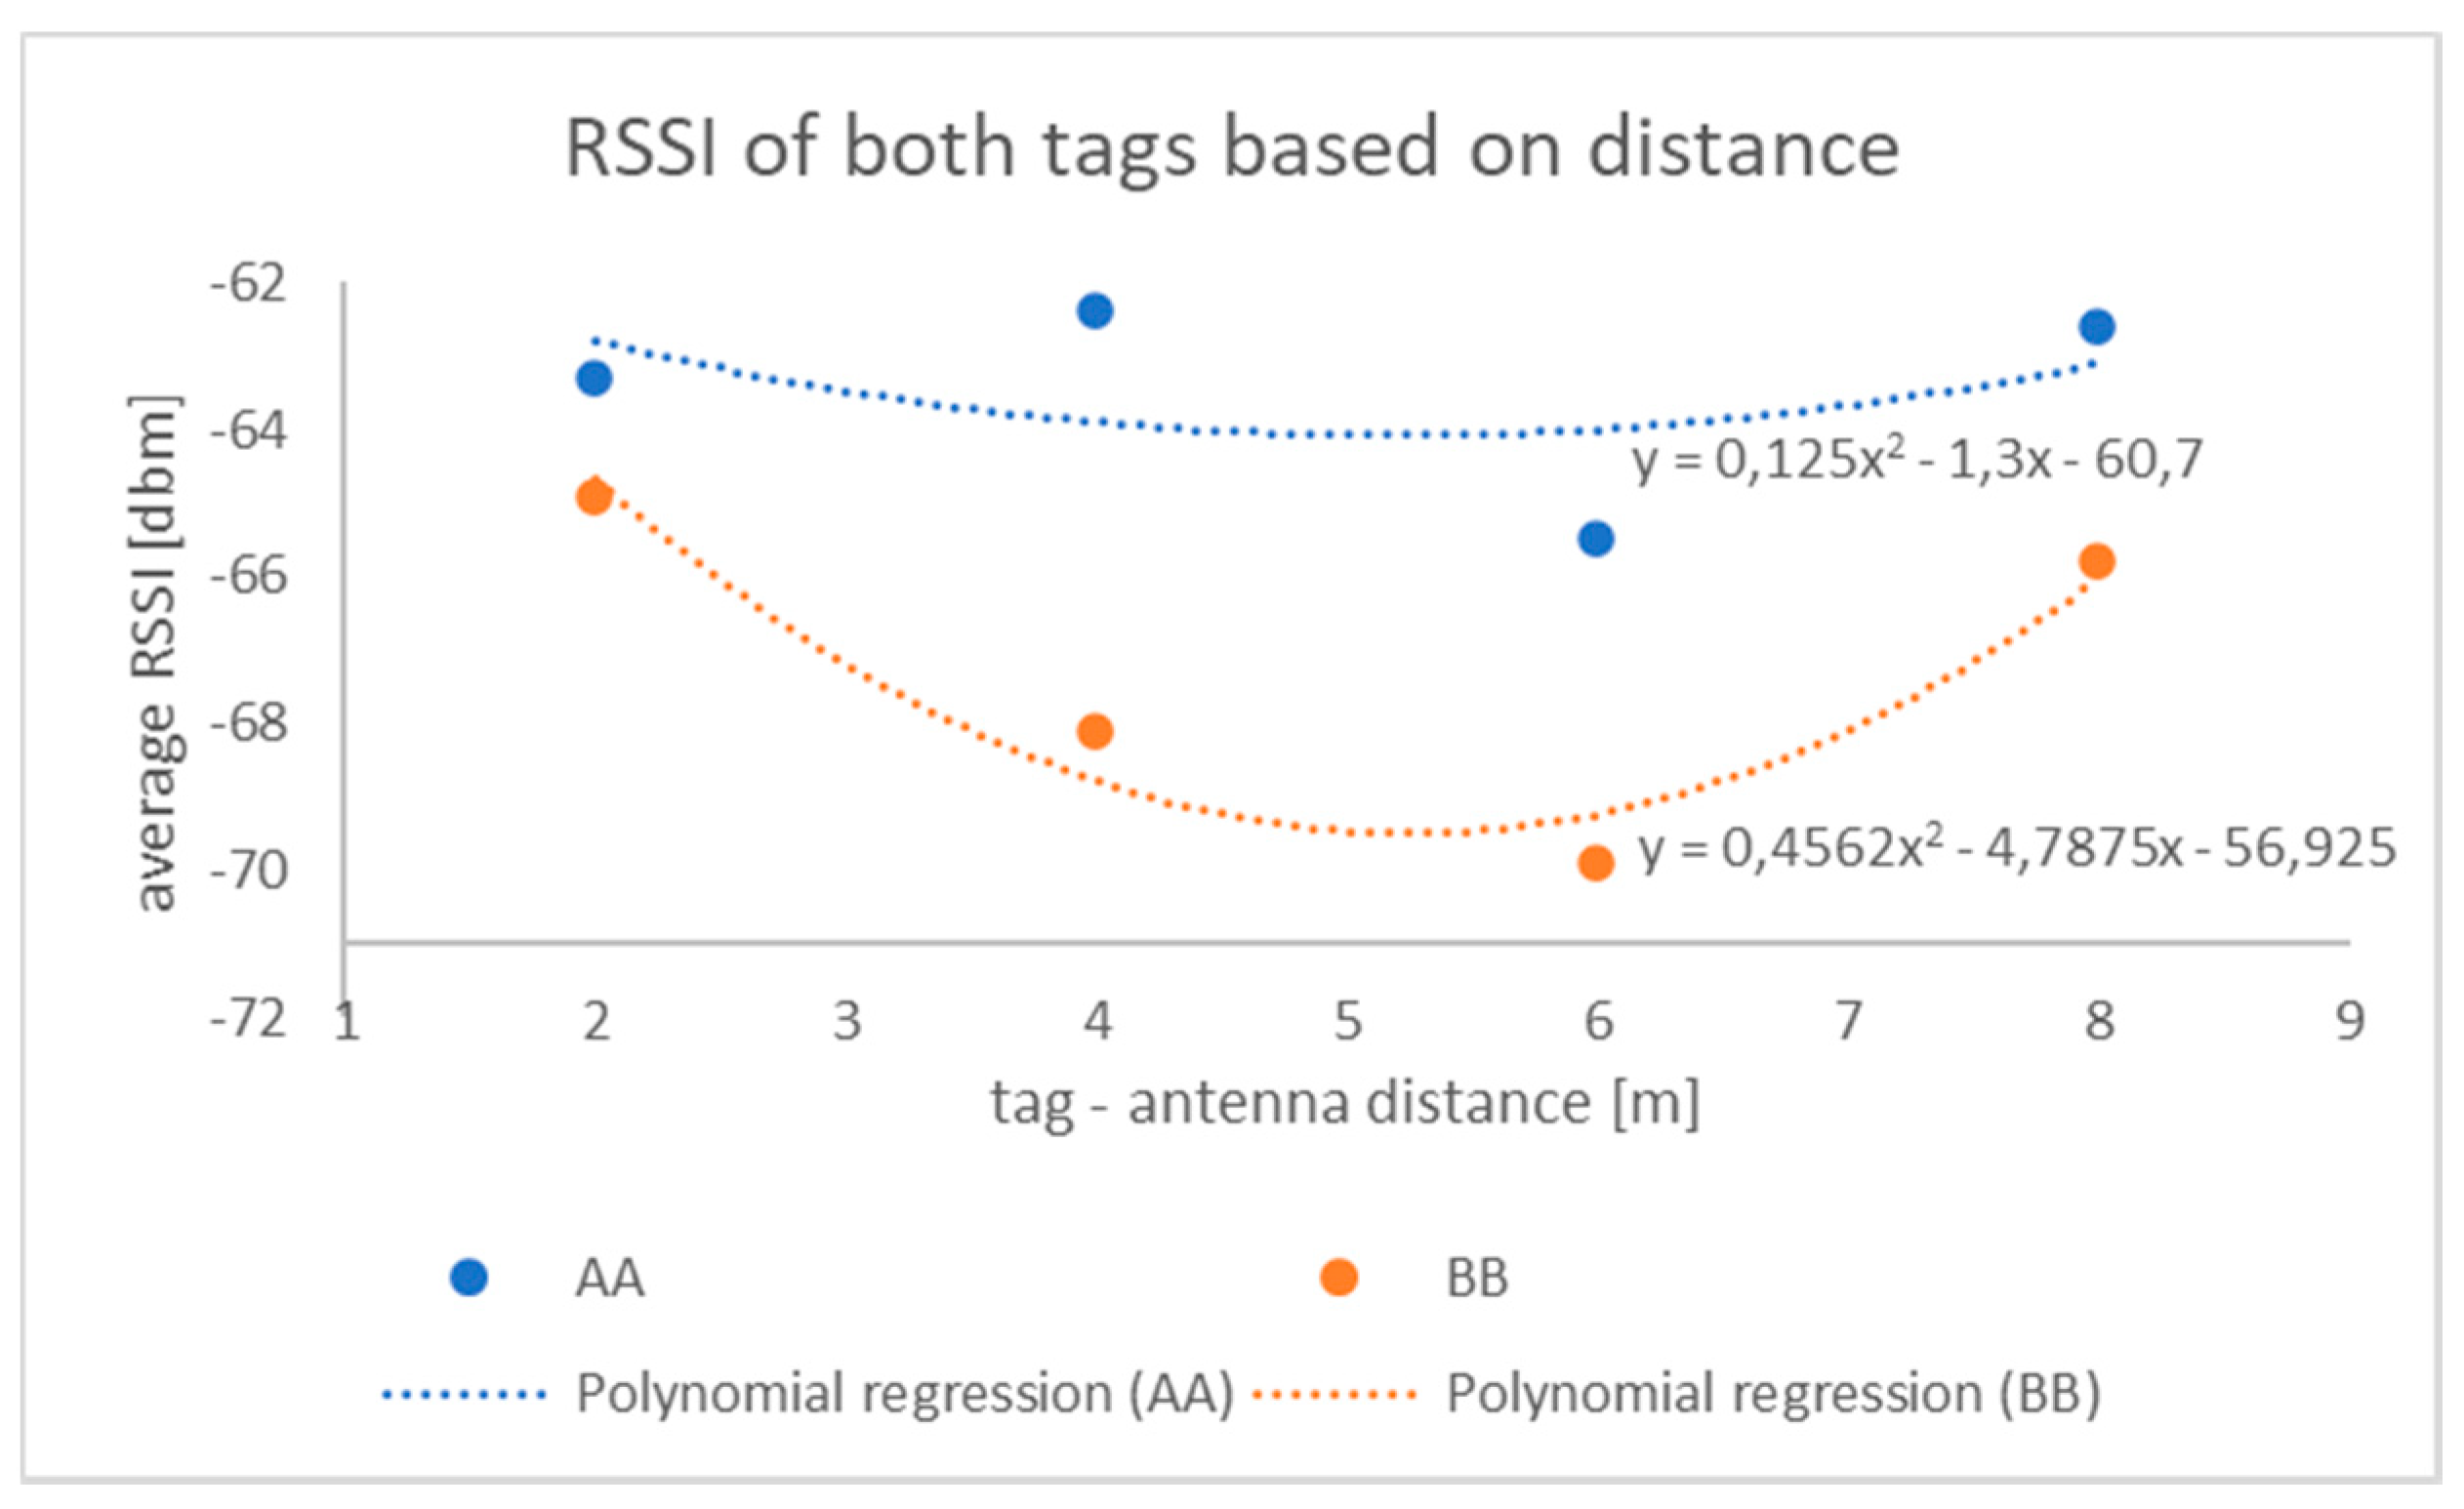
To perform the experiment, the overall power of the reading system (reader power and antenna gain) of 33 dBm ERP was used. The minimum distance between the tag under test (in figures denoted as AA) and the reader’s antenna was specified at 2 m. At this distance the reader tried to identify the tag under test as well as the neighboring tag (in figures denoted as BB) and measure RSSI values of both (if read). The measurement was made 100 times. In the next iteration the same procedure was used to obtain RSSI values of both tags from a distance of 2 m more and the process continued to a distance of 8 m between reader antenna and the tag under test, that appeared to be the maximum read distance in accordance with the datasheet values.
Based on the data hypothesis test for a difference in two population means and medians that were performed for each measured distance, the significance of the difference between pairs of measurements (for tag AA and BB) were determined. The determination was based on the set of hypothesis tests for a difference in means as well as for medians of two populations (measurements for tags AA and BB) that were performed at various distances. Based on the hypothesis tests it could be possible to find a maximal distance that allows for the distinction between the tag under test and surrounding tags.
3. Results
To process and analyze the measured data, see
Table A1 in
Appendix A, it was decided to compare all measured pair data sets. According to the fact that skewness and kurtosis of the measured data sets was out of normal values, not only comparison of means, but also comparison of medians were chosen to be processed. To determine the statistically significant differences between data sets, hypothesis tests were used. Reasons for disruption of data distribution normality was also discussed and probable reason was found in the properties of the measuring device. All commercially available UHF RFID readers that offer the possibility to measure RSSI values offer the measurement resolution of 1 or 0.5 dBm, which is possibly not detailed enough.
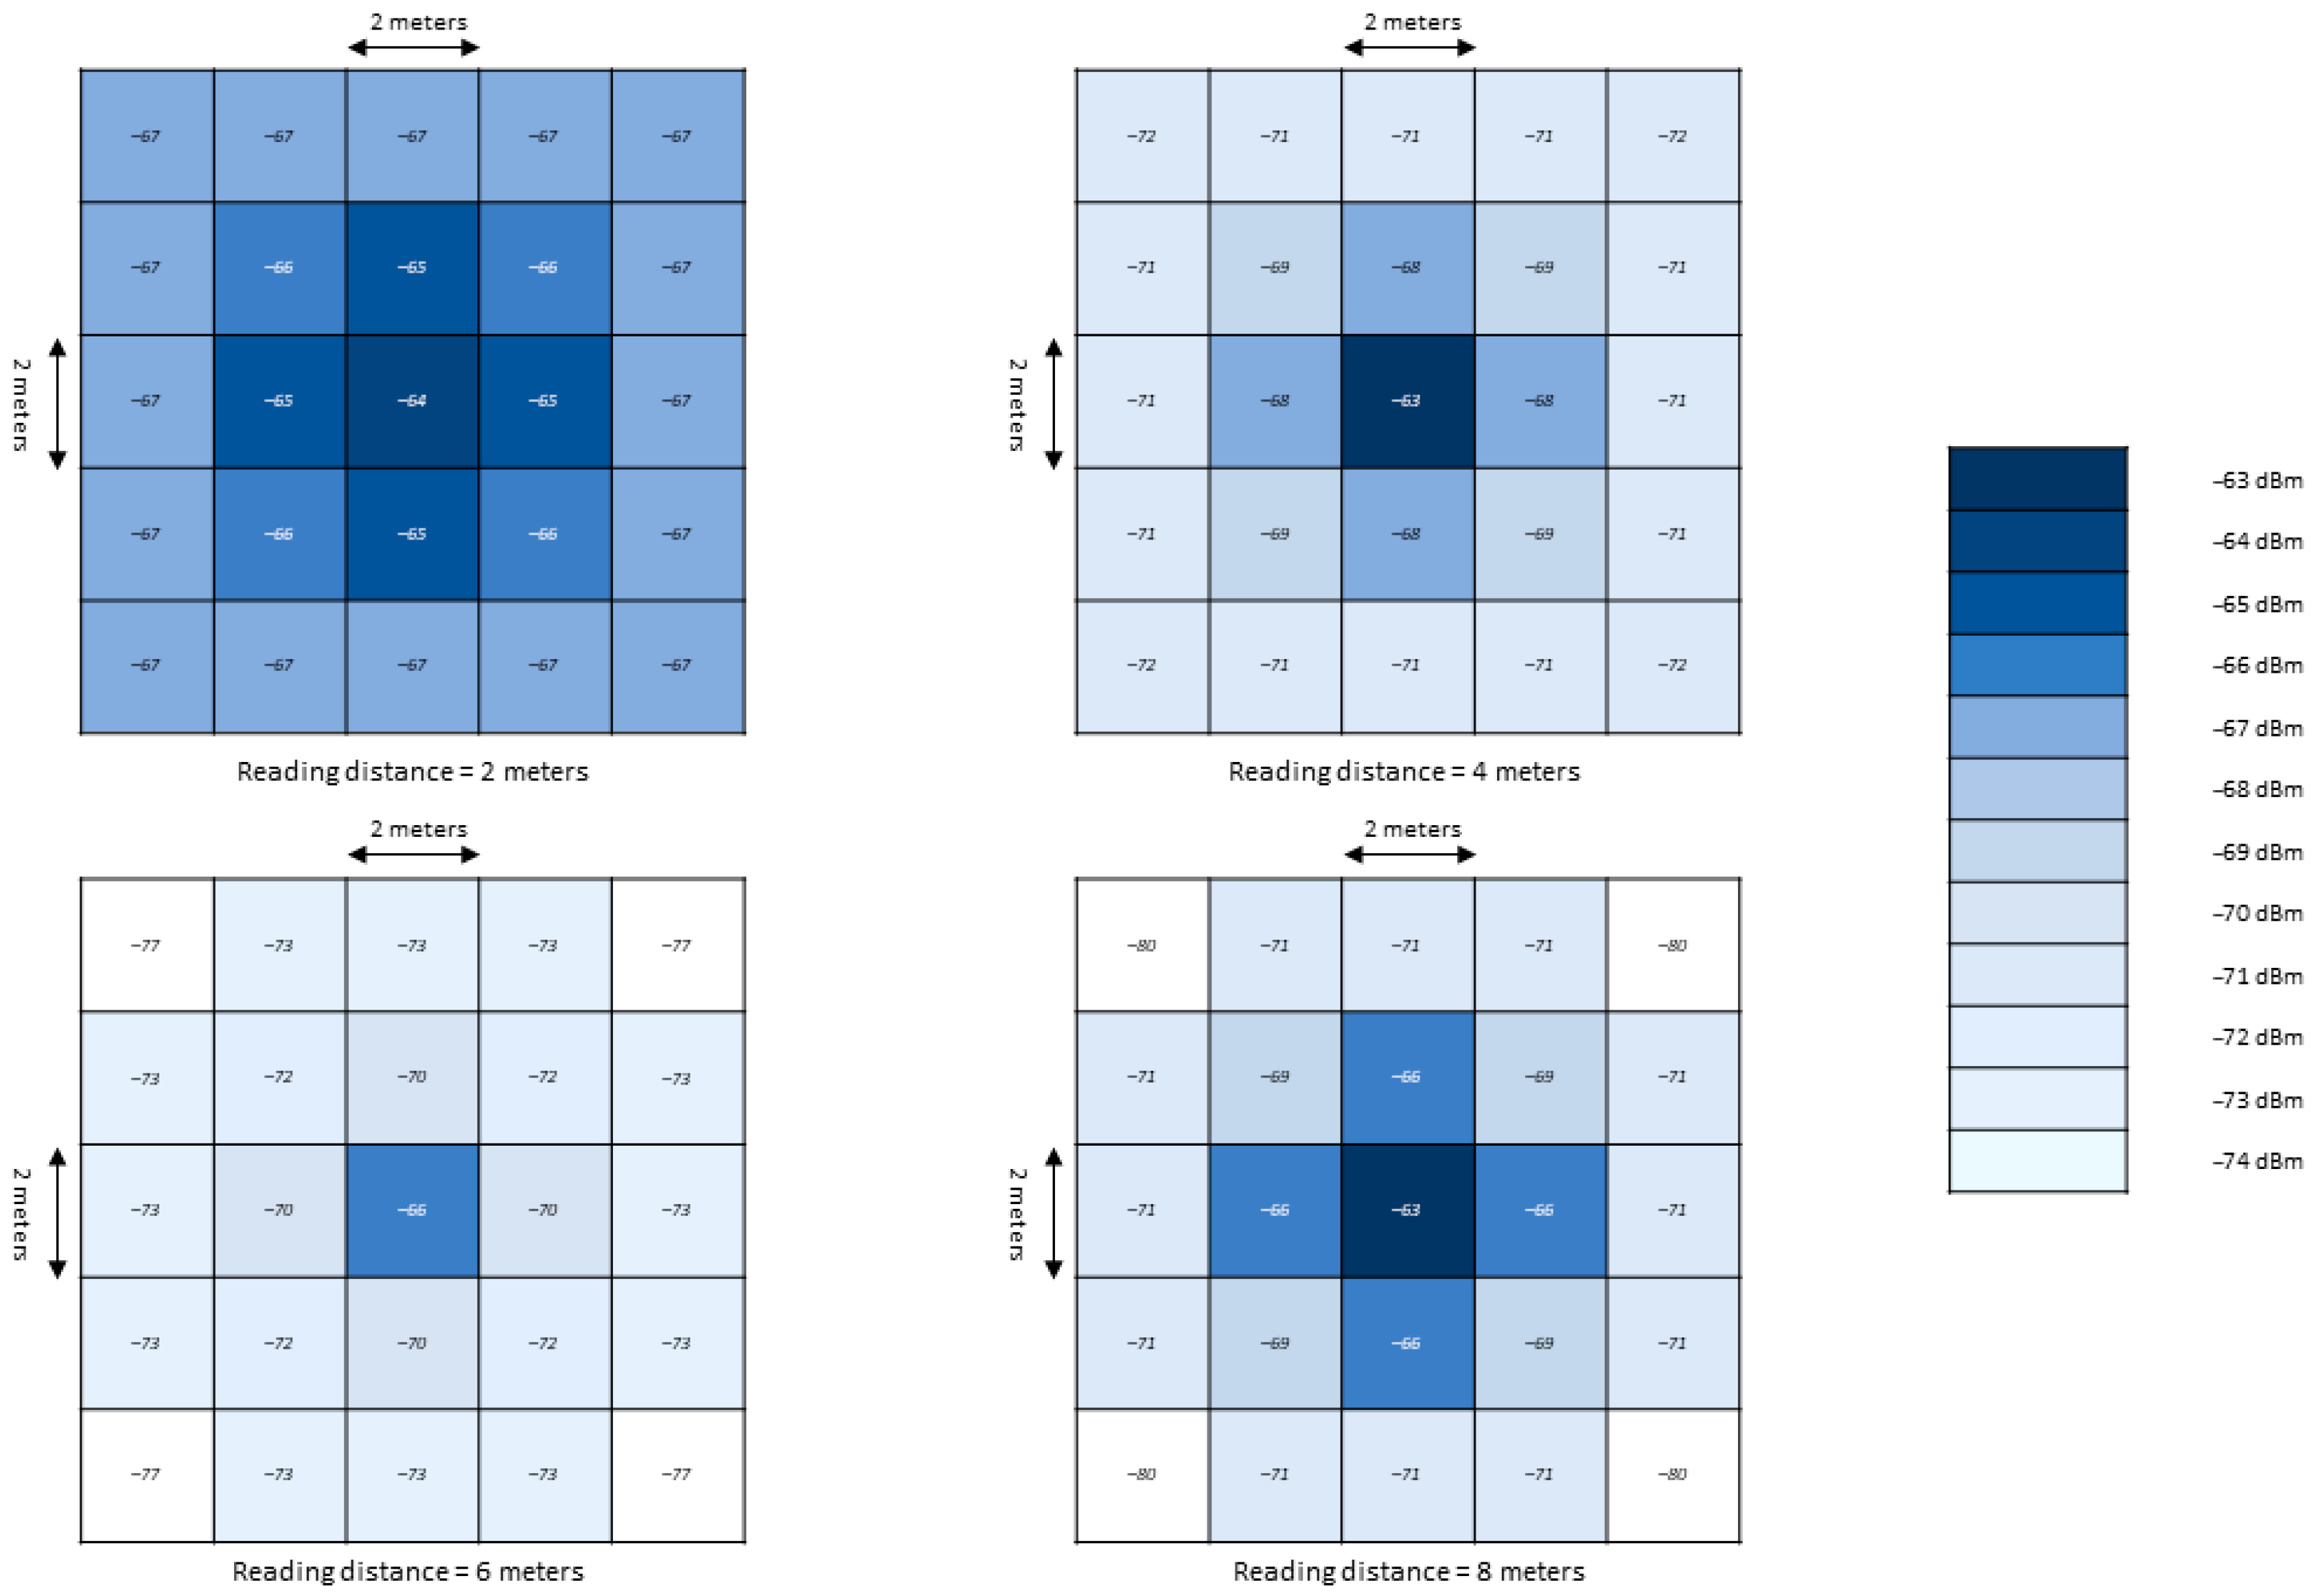
The matrix, see
Figure 3, was derived based on measured RSSI for individual items that are located 2 m from each other.
Figure 3 illustrates the average value of measured RSSI (rounded to an integer) of an RFID tag located in the center of the cell, with the RFID antenna above the center of that matrix. From the picture, it can be read that in the case of a distance of 2 m the difference of RSSI is minimal, as well as in the case of a reading distance of 8 m, where it is slowly beginning to merge. The biggest difference in RSSI values is around 4 and 6 m, where the position of individual tags on a given matrix can be easily determined based on RSSI.
RF tags are further limited by the need, in passive systems, to power up their radio frequency integrated circuits through rectification of the incoming signal. There is a powerful analogy between the optical-polarizer experiment and the backscatter link of an RF tag system as described in [
25]. The performed measurements were based on a real situation where a drone flies over an item in a warehouse. Because in real conditions it is not always possible to guarantee from which side the drone will fly over the RFID tag, we also chose RFID antenna as well as RFID tags with circular polarization.
3.1. Comparison of Means
A usual 95.0% confidence interval for all means, see [
26], as well as for the difference between means, was set to construct confidence intervals for each mean and for the difference between the means. The null hypothesis meanAA = meanBB and the two-sided alternative hypothesis meanAA ≠ meanBB were set. A
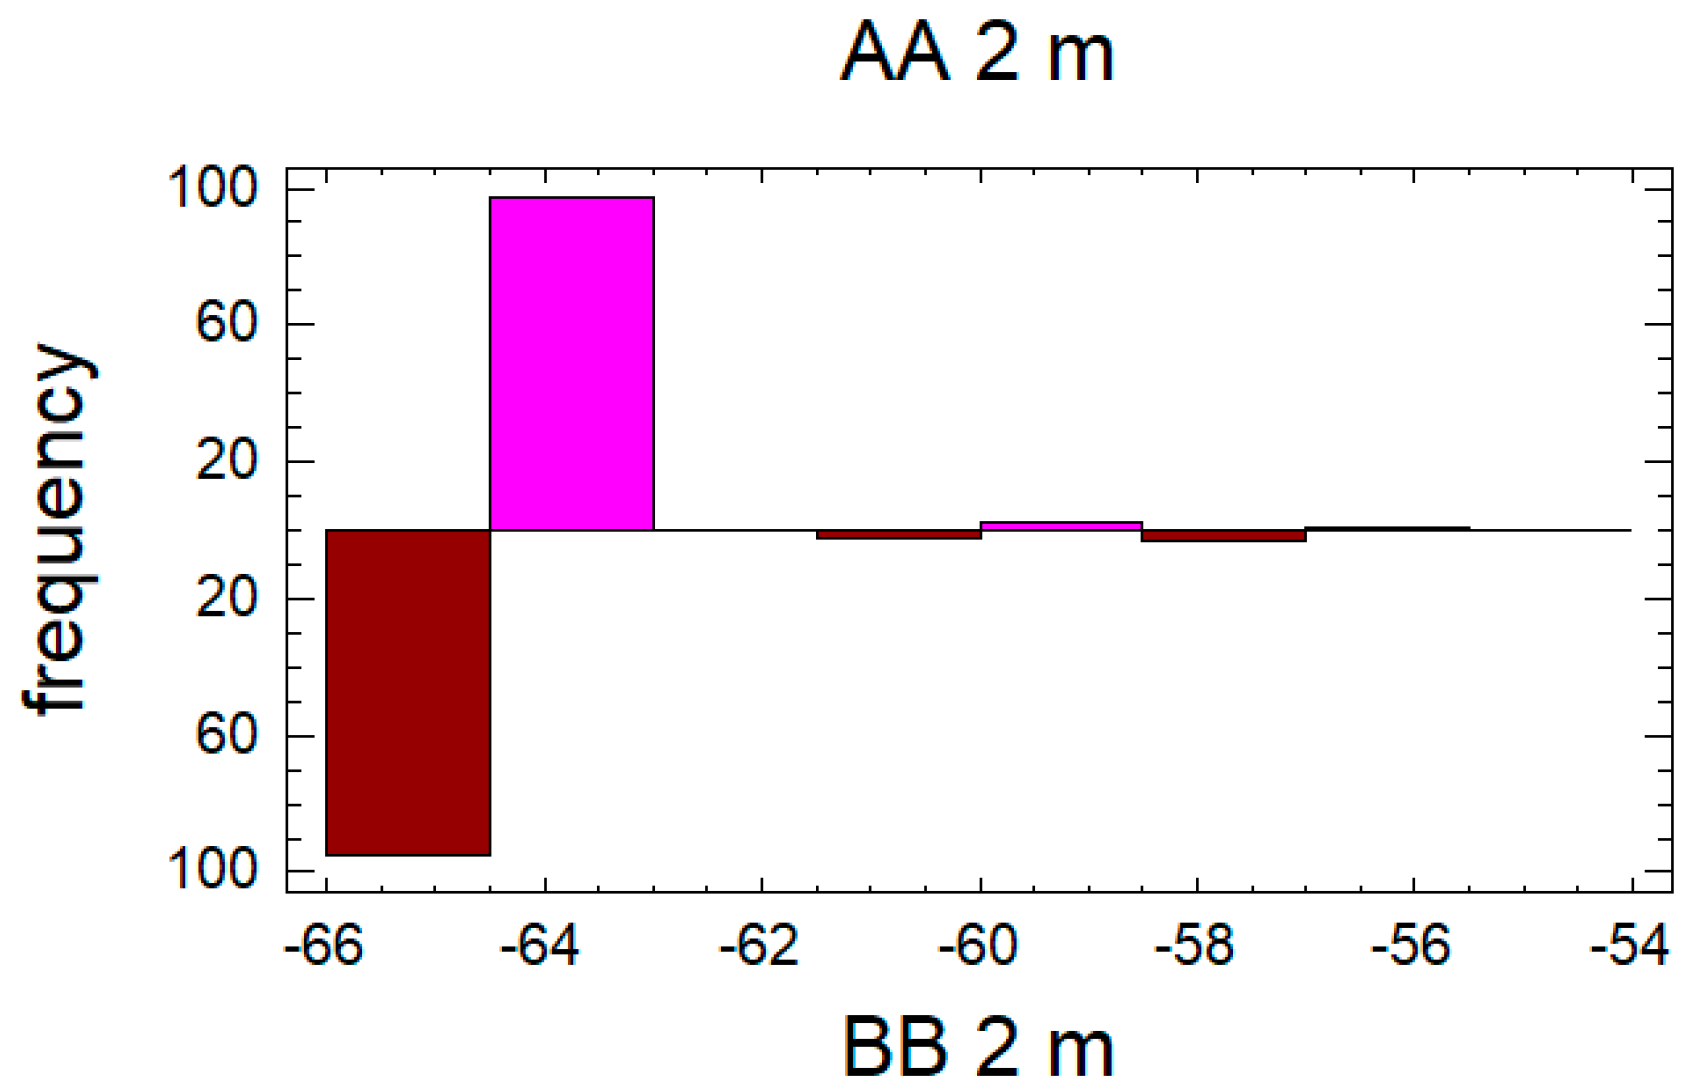
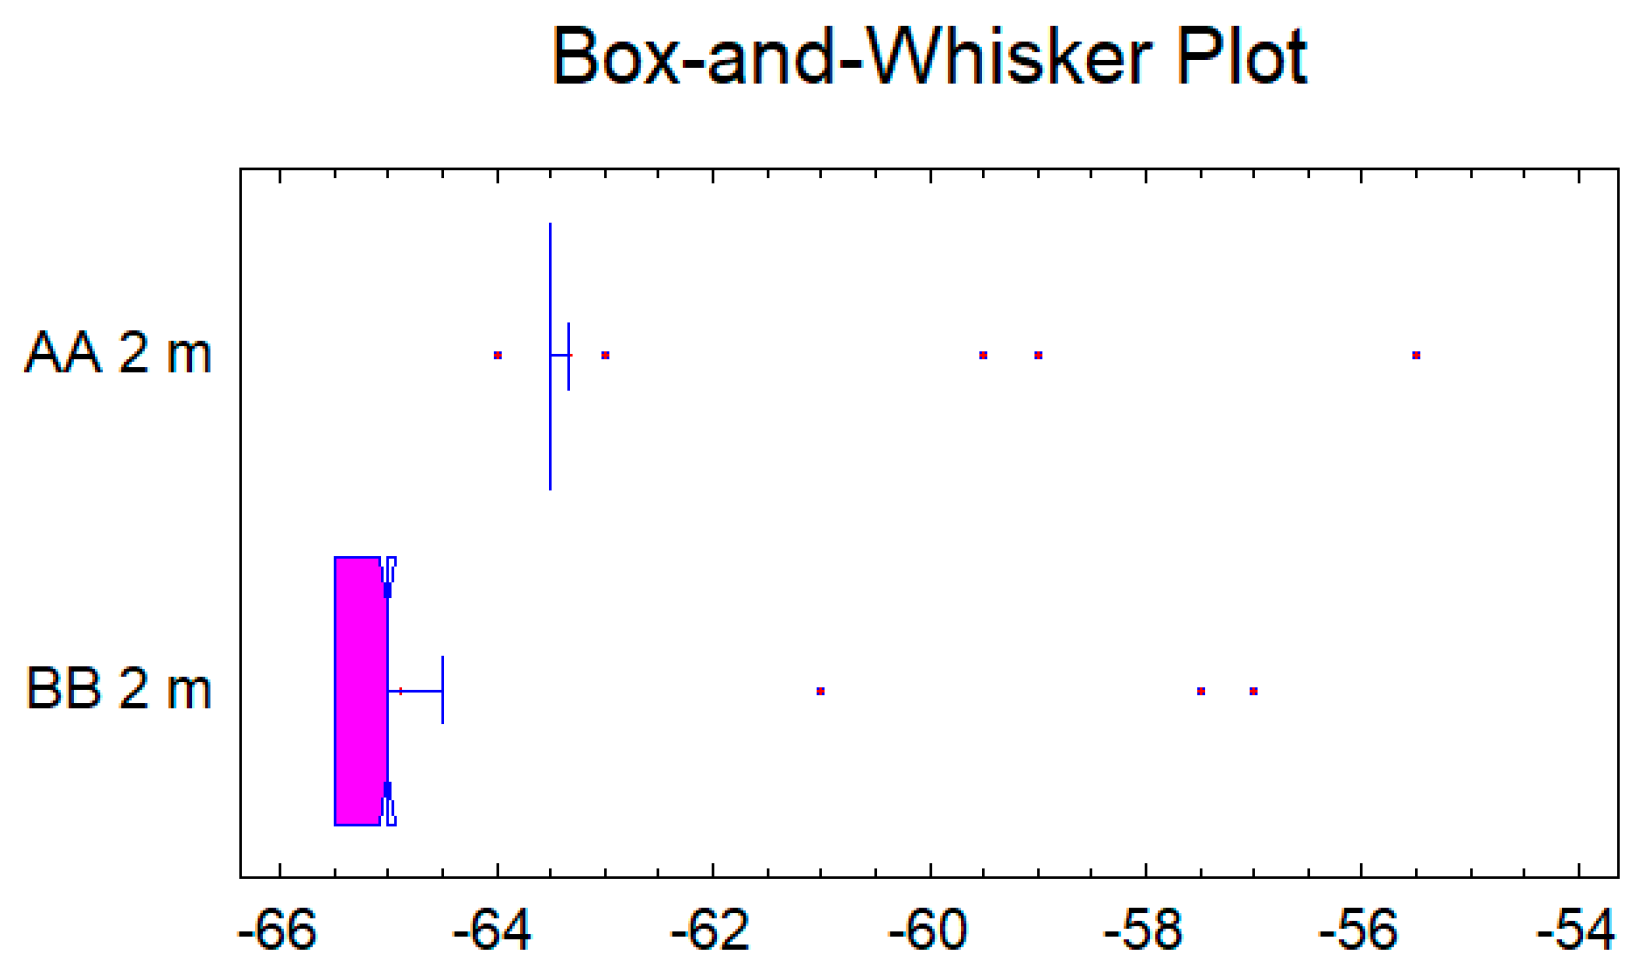
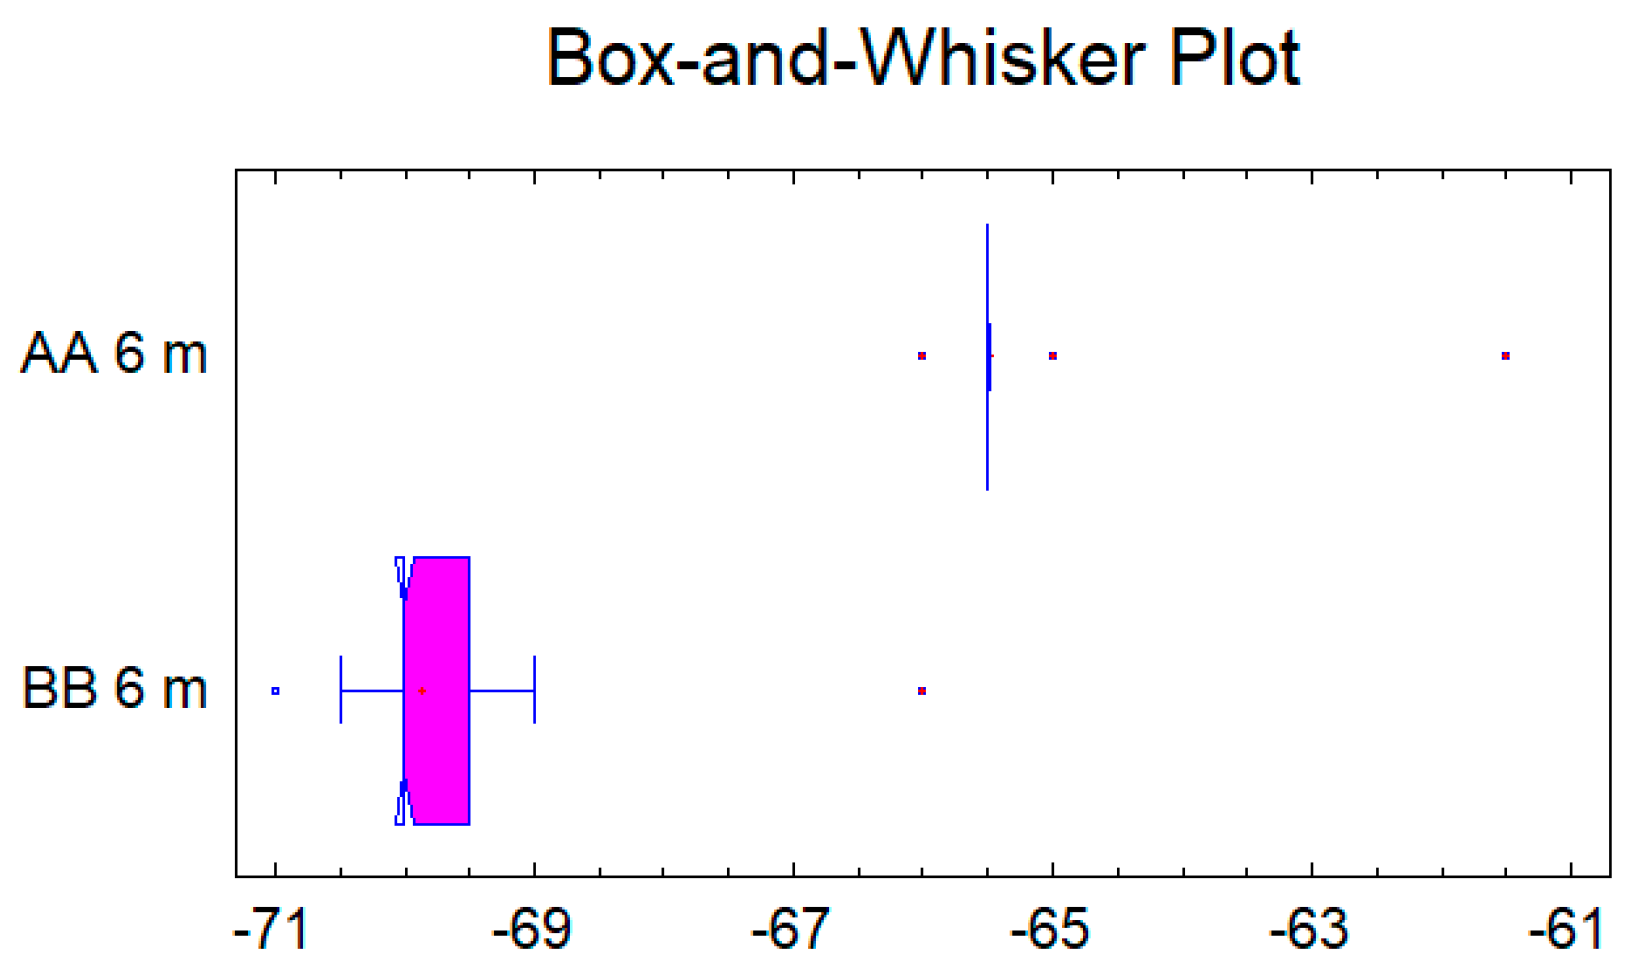
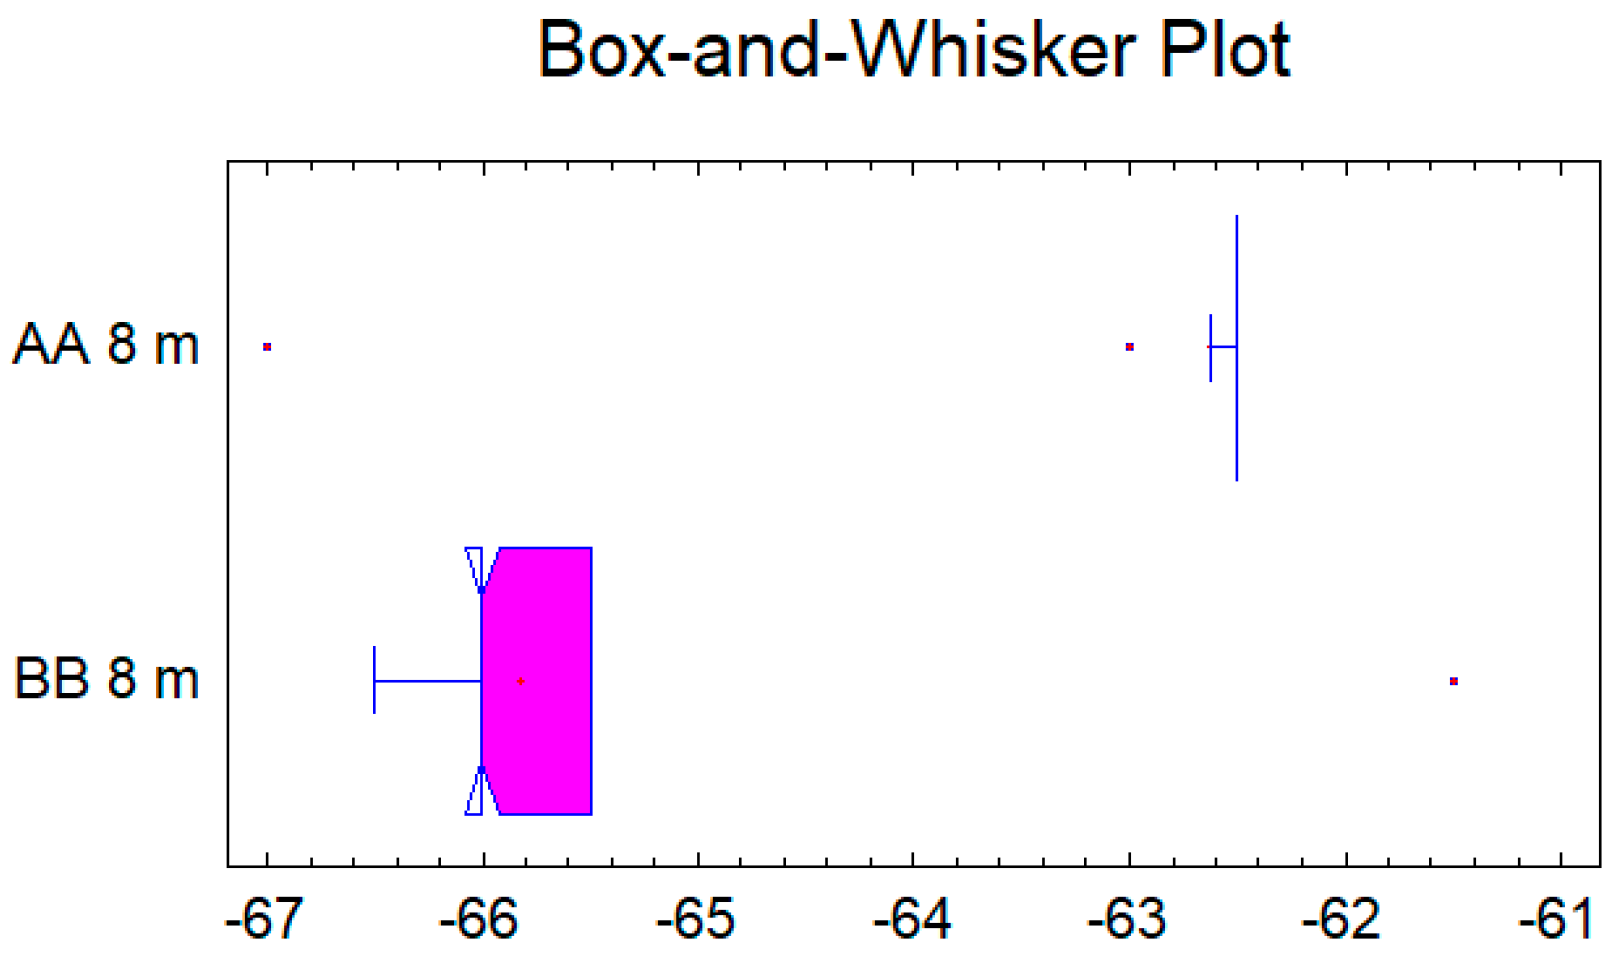
t-test was run to compare the means of each two paired samples. Data were also simply visualized in histograms, and box-and-whiskers plots, where mean (red cross), median (blue arrowed vertical line), minimum, maximum, quartiles and remote observations can be seen.
In the case of the first pair data set for the distance of 2 m, see
Figure 4 and
Figure 5, the confidence interval for the difference between the means, which extends from 1.19409 to 1.91591, as the interval does not contain the value 0.0, there is a statistically significant difference between the means of the two samples at the 95.0% confidence level. A
t-test may also be used to test a specific hypothesis about the difference between the means of the populations from which the two samples come. In this case, the test has been constructed to determine whether the difference between the two means equals 0.0 versus the alternative hypothesis that the difference does not equal 0.0. Since the computed
p-value is less than 0.05 (
p-value = 0.0), the null hypothesis can be rejected in favor of the alternative.
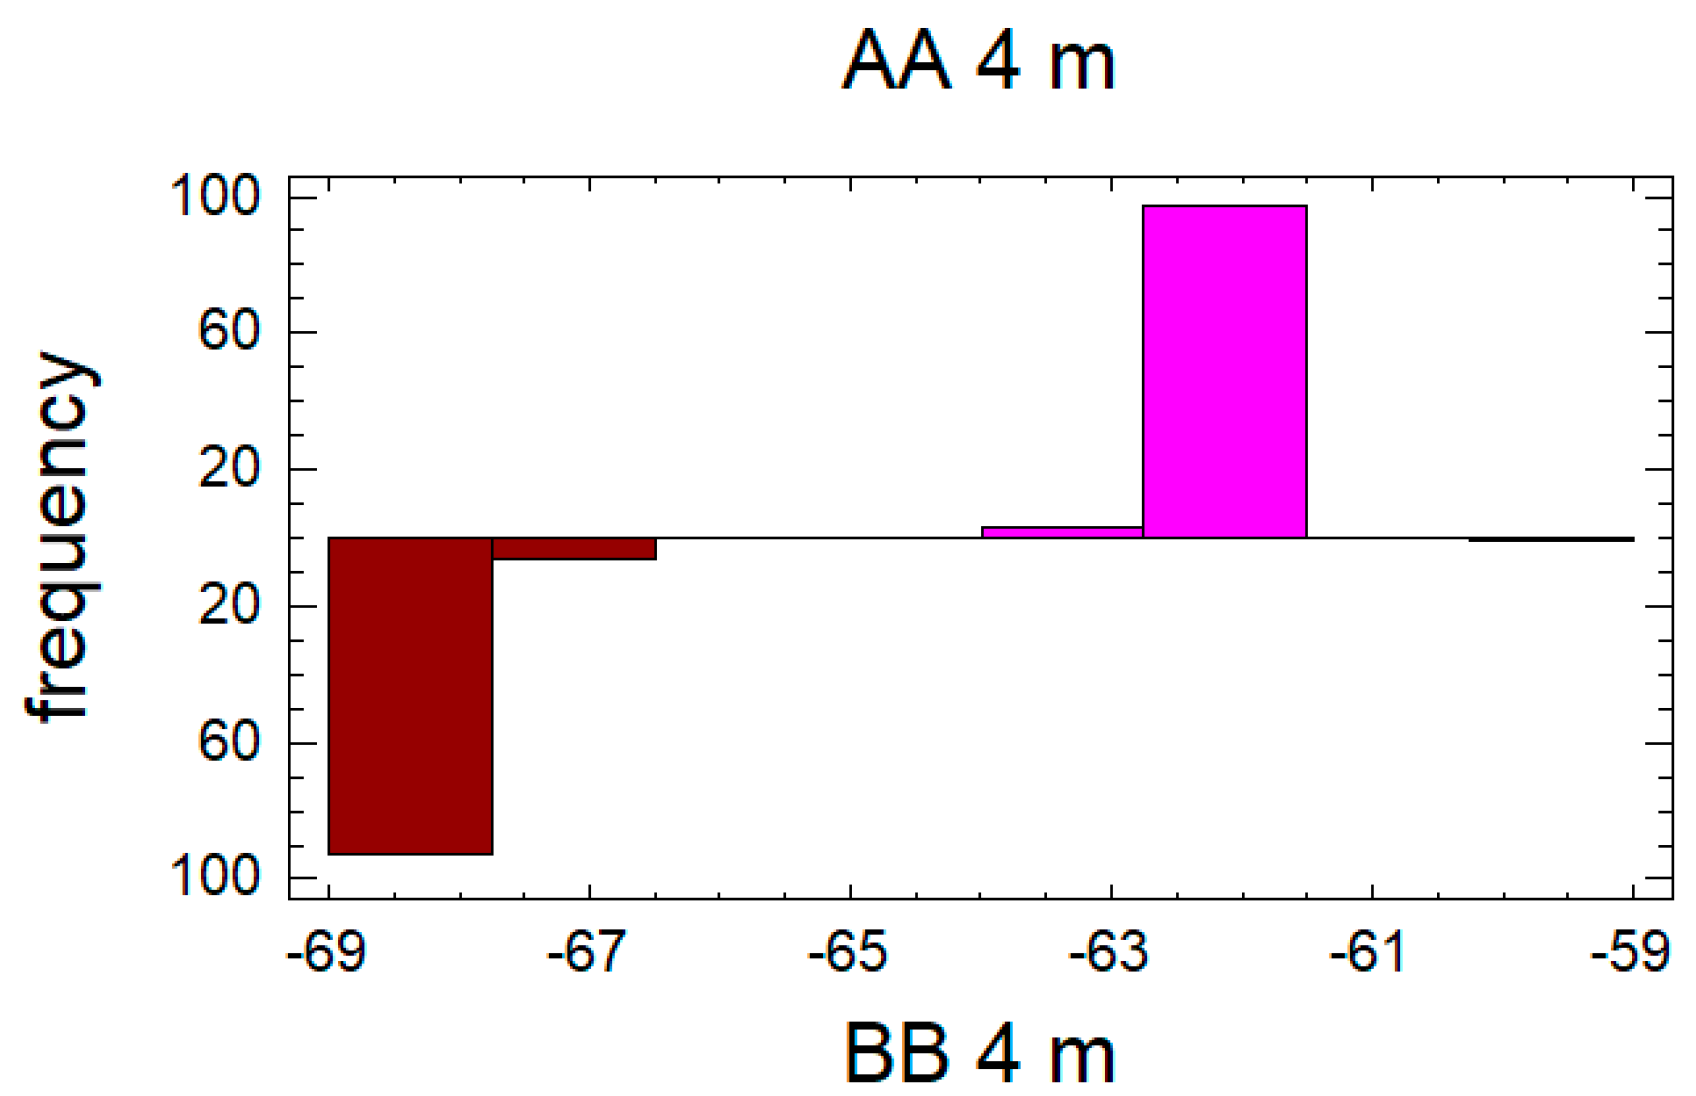
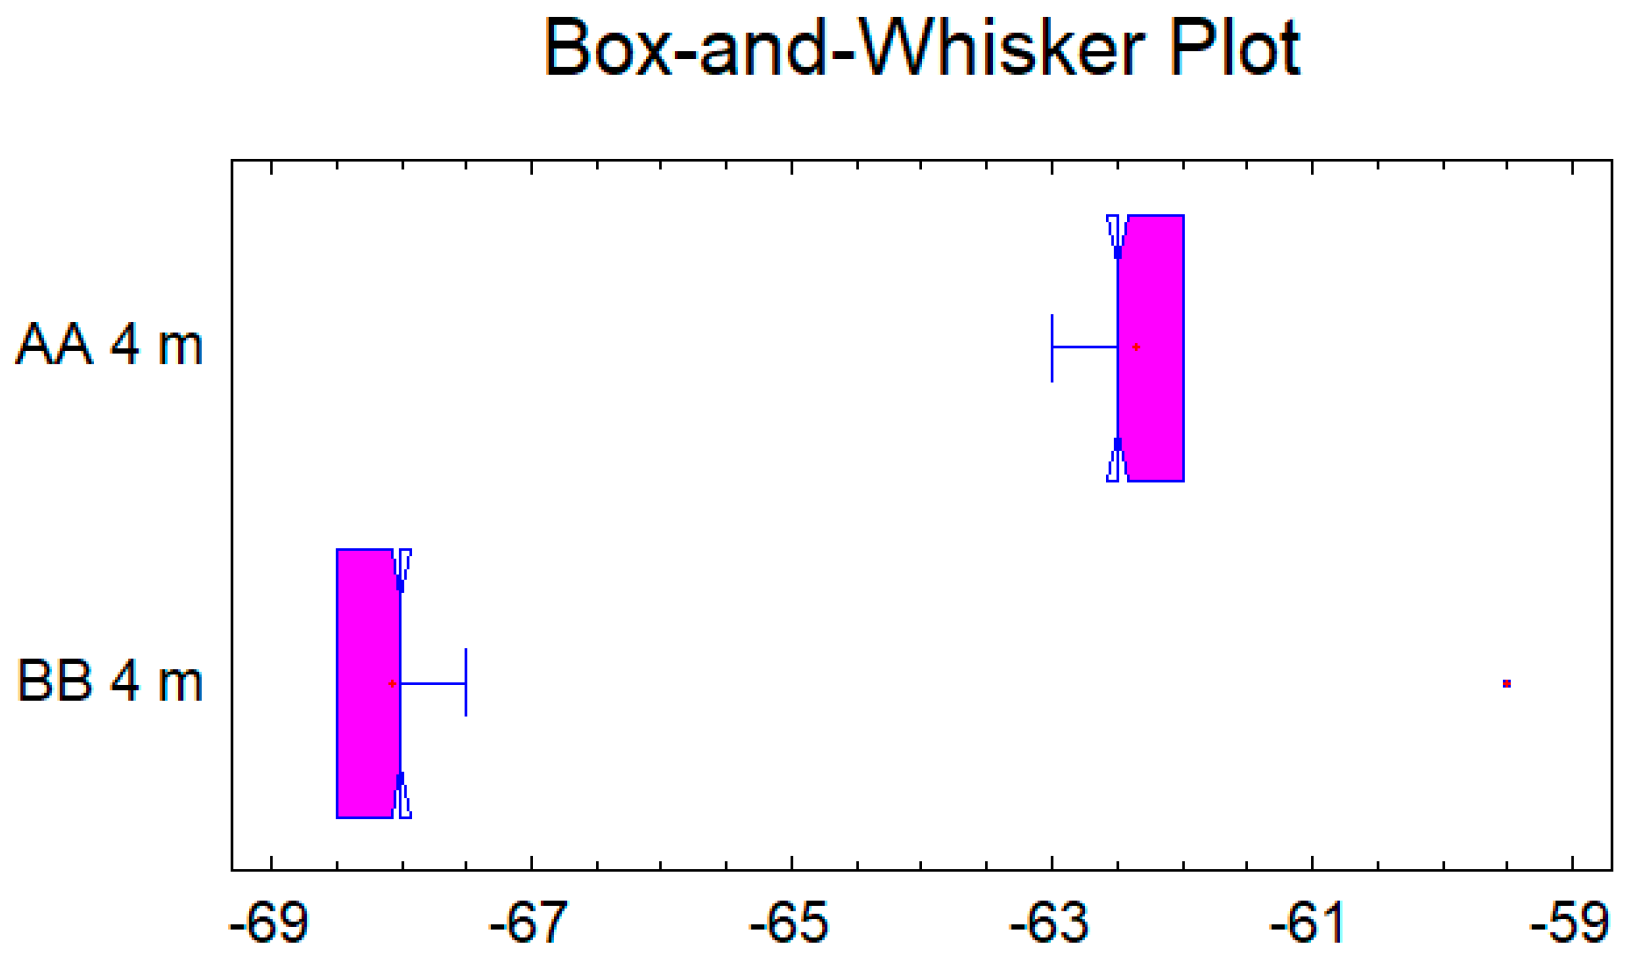
In the case of the second pair data set for the distance of 4 m, see
Figure 6 and
Figure 7, the confidence interval for the difference between the means, which extends from 5.52297 to 5.89703, as the interval does not contain the value 0.0, there is a statistically significant difference between the means of the two samples at the 95.0% confidence level. A
t-test may also be used to test a specific hypothesis about the difference between the means of the populations from which the two samples come. In this case, the test has been constructed to determine whether the difference between the two means equals 0.0 versus the alternative hypothesis that the difference does not equal 0.0. Since the computed
p-value is again less than 0.05 (
p-value = 0.0), the null hypothesis can be rejected in favor of the alternative.
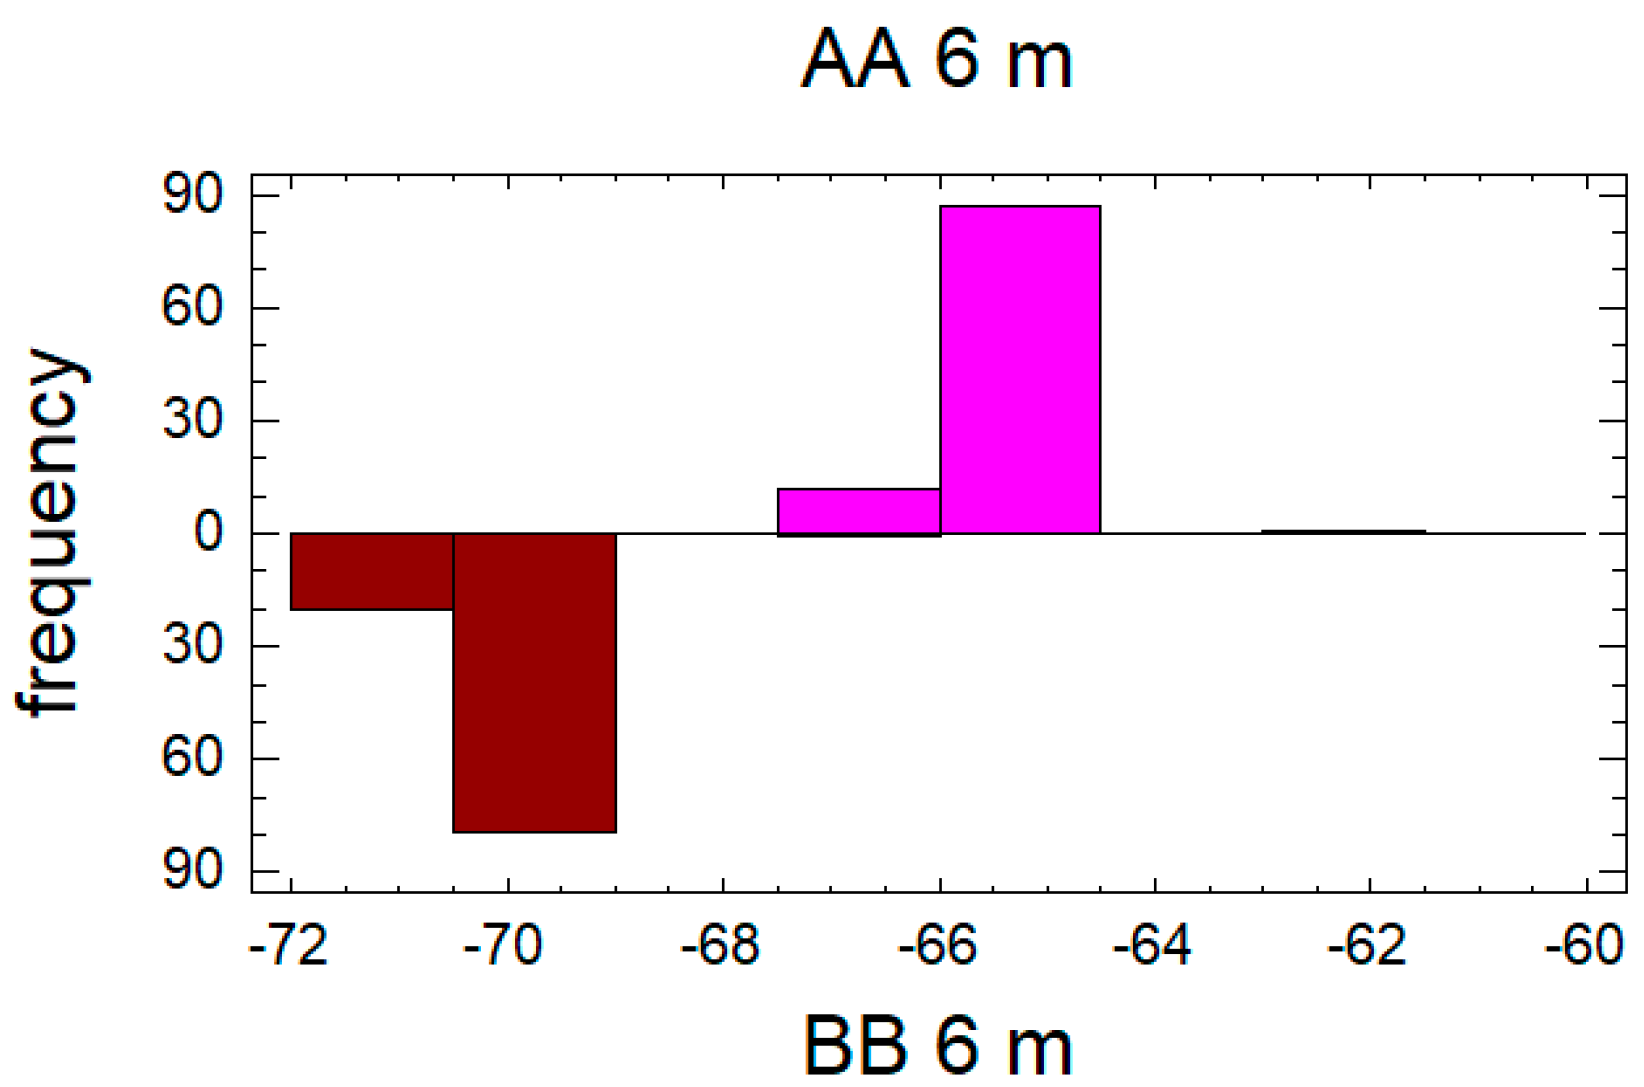
In the case of the third pair data set for the distance of 6 m, see
Figure 8 and
Figure 9, the confidence interval for the difference between the means, which extends from 4.23891 to 4.54109, as the interval does not contain the value 0.0, there is a statistically significant difference between the means of the two samples at the 95.0% confidence level. A
t-test may also be used to test a specific hypothesis about the difference between the means of the populations from which the two samples come. In this case, the test has been constructed to determine whether the difference between the two means equals 0.0 versus the alternative hypothesis that the difference does not equal 0.0. Since the computed
p-value is again less than 0.05 (
p-value = 0.0), the null hypothesis can be rejected in favor of the alternative.
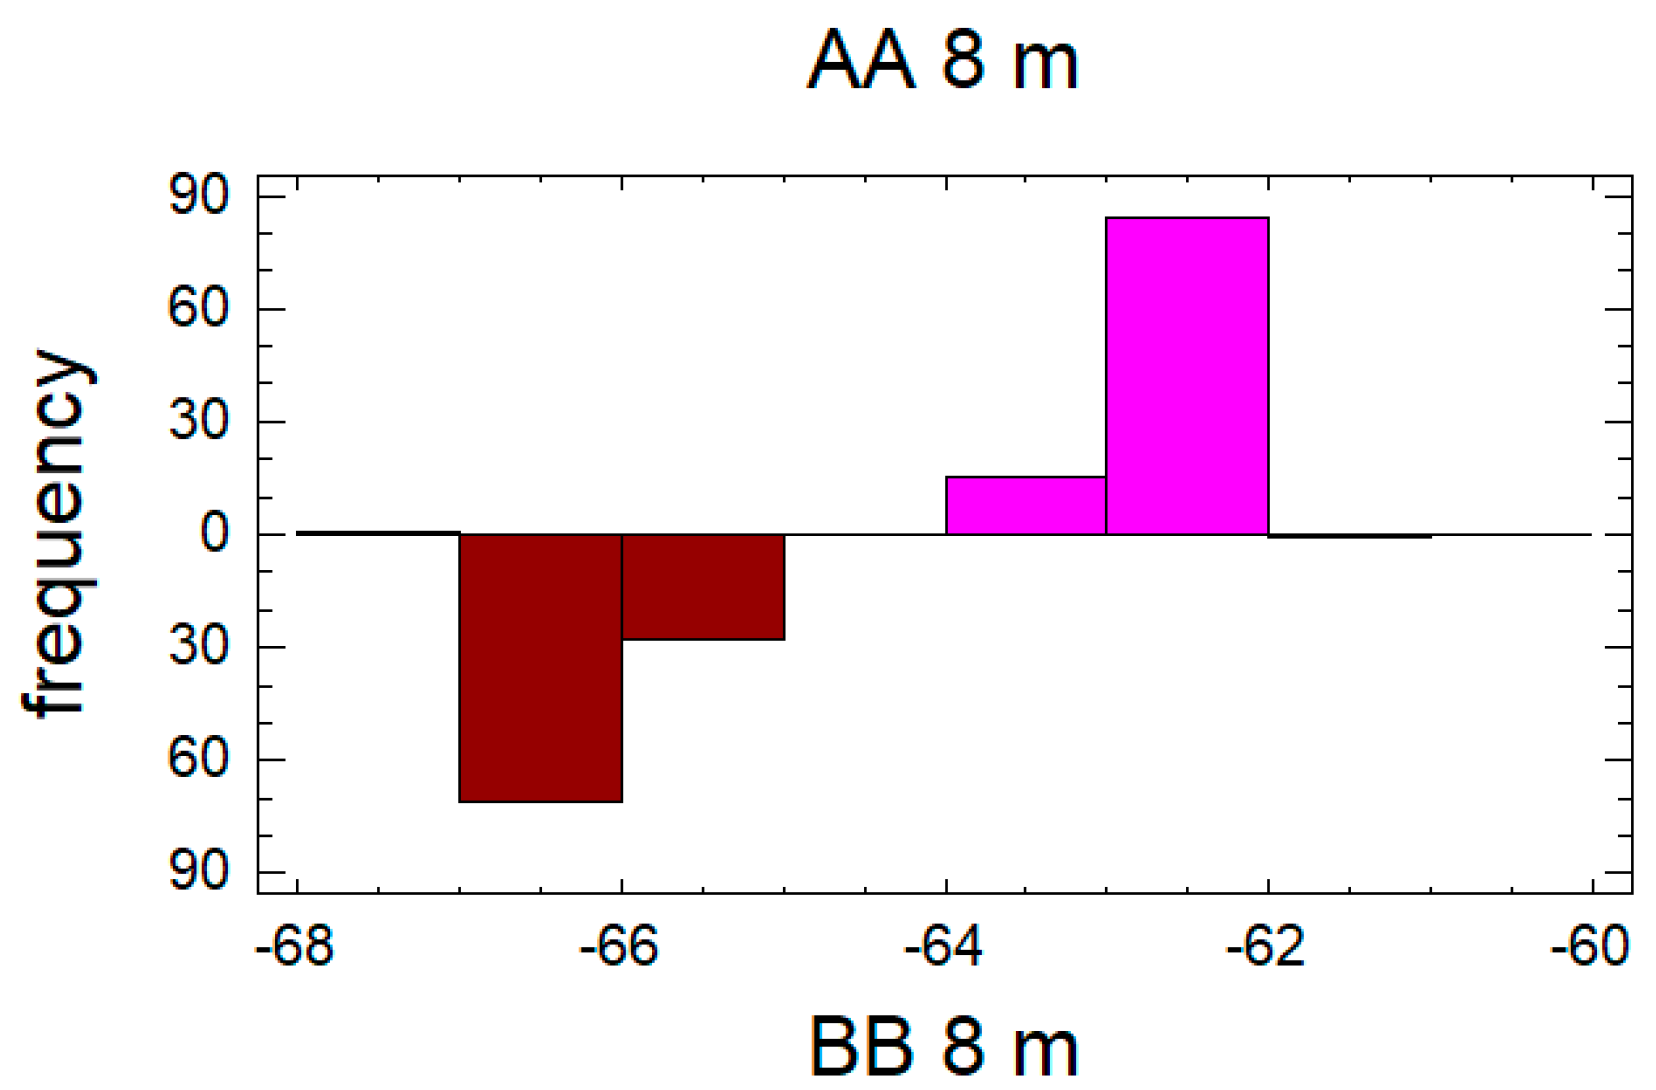
In the case of the fourth pair data set for the distance of 8 m, See
Figure 10 and
Figure 11, the confidence interval for the difference between the means, which extends from 3.07316 to 3.34684, as the interval does not contain the value 0.0, there is a statistically significant difference between the means of the two samples at the 95.0% confidence level. A
t-test may also be used to test a specific hypothesis about the difference between the means of the populations from which the two samples come. In this case, the test has been constructed to determine whether the difference between the two means equals 0.0 versus the alternative hypothesis that the difference does not equal 0.0. Since the computed
p-value is again less than 0.05 (
p-value = 0.0), the null hypothesis can be rejected in favor of the alternative.
3.2. Comparison of Medians
In this case a Mann–Whitney U test (also called the Mann–Whitney–Wilcoxon, MWW, Mann–Whitney W test, Wilcoxon rank-sum test or Wilcoxon–Mann–Whitney test; see [
27,
28,
29]) was run to compare the medians of the two samples. This test is constructed by combining the two samples, sorting the data from smallest to largest and comparing the average ranks of the two samples in the combined data. The null hypothesis medianAA = medianBB and the two-sided alternative hypothesis medianAA ≠ medianBB were set.
The p-value of the 2 m data set was less than 0.05 (p-value = 0.0), there is a statistically significant difference between the medians at the 95.0% confidence level.
The p-value of the 4 m data set was less than 0.05 (p-value = 0.0), there is again a statistically significant difference between the medians at the 95.0% confidence level.
The p-value of the 6 m data set was less than 0.05 (p-value = 0.0), there is again a statistically significant difference between the medians at the 95.0% confidence level.
The p-value of the 8 m data set was less than 0.05 (p-value = 0.0), there is again a statistically significant difference between the medians at the 95.0% confidence level.


 ,
, 
