Article

First Report on the Bioremediation of Textile Industrial Effluents by Piptoporus Betulinus IEBL-3 by Using Response Surface Methodology

1
Department of Biotechnology, Mirpur University of Science and Technology (MUST), Mirpur 10250, Azad Jammu & Kashmir, Pakistan
2
National Center of Industrial Biotechnology, PMAS-Arid Agriculture University Rawalpindi, Rawalpindi 46000, Punjab, Pakistan
3
Department of Biochemistry, University of Agriculture, Faisalabad 38000, Punjab, Pakistan
4
Department of Biotechnology, University of Sialkot, Sialkot 51310, Punjab, Pakistan
5
Department of Public Health, Khamis Mushait Campus, College of Applied Medical Sciences, King Khalid University, Abha 61421, Saudi Arabia
6
Department of Basic Medical Sciences, Khamis Mushait Campus, College of Applied Medical Sciences, King Khalid University, Abha 61421, Saudi Arabia
7
Department of Biochemistry and Molecular Biology, University of Sialkot, Sialkot 51310, Punjab, Pakistan
*
Authors to whom correspondence should be addressed.
Appl. Sci. 2022, 12(3), 1090; https://doi.org/10.3390/app12031090
Submission received: 22 September 2021 / Revised: 18 December 2021 / Accepted: 20 December 2021 / Published: 21 January 2022
(This article belongs to the Special Issue Bioremediation in Environmental Engineering)

Abstract

:
The current study was performed to optimize three different industrial textile effluent biodegradation potentials of a brown rot fungus, Piptoporus betulinus IEBL-3, to reduce environmental pollution. The Response Surface Methodology under the Box Bhenken Design was used for the optimization steps. Three ligninolytic enzymes named lignin peroxidase, manganese peroxidase and laccase were also studied during the biodegradation process. The biodegradation rate of the 3 industrial effluents varied between 67 and 76% at the initially optimized conditions. There was a 10%, 7% and 9% increase in the biodegradation of Mujahid textile (MT), Five Star textile (FST) and Sitara textile (ST) effluent, respectively, after the addition of various additional carbon and nitrogen sources in different ratios. The biological treatment decreases the Biological Oxygen Demand and Chemical Oxygen Demand values of the effluents well below the WHO-recommended values for the industrial effluents. The HPLC monitoring of the effluent’s biodegradation showed the appearance of new peaks, some of which may correspond to secondary amines. Study of ligninolytic enzymes during the biodegradation process confirmed their role in the biodegradation process, with lignin peroxidase having highest activity among the others. These findings suggest that P. betulinus is a potential fungus for the biodegradation of the dyes and effluents and can be a suitable candidate for this process.

1. Introduction

During last two decades, the textile industry has been revolutionized much due to an increase in the world population. To meet the demand, there was an increase in the production of synthetic dyes, having chemical stability and color variation [1]. During their application, about 20% of dyes released into the environment are effluent, being stable and resistant to the degradation [2], but dyes remain in the environment for a long period of time and are a source of environmental pollution as well as health hazards [3,4]. Researchers are continuously working on the development of techniques for the treatment of these effluents. The physical and chemical degradation techniques are not preferred because these are costly and not environmentally friendly [5]. There is much focus on the development of cost-effective biological treatment methods for industrial effluents [6,7].
Biological treatment of dyes involve the application of microbes i.e., bacteria and fungi or their enzymes to degrade the dyestuff. Fungi can survive under strict environmental conditions and are preferred for the biodegradation process [8,9]. Brown rot fungi (BRF) is a group of wood decaying fungi that produced non-specific ligninolytic enzymes including lignin peroxidase (LiP), manganese peroxidase (MnP) and laccase, which hydrolyze and modify the cell wall of plants. These extracellular enzymes of BRF are also reported to degrade the dyes/coloring agents present in textile industrial effluents [2,10]. The exploration of new microbes having dyes/effluents biodegradation potential will be very important for the protection of the environment from pollution. In the current study, the biodegradation potential and ligninolytic enzyme production ability of P. betulinus IEBL-2 was monitored and optimized with three industrial effluents. Effectiveness of the biological process was checked by performing an HPLC of the treated and untreated effluents and by the determination of BOD and COD after the treatment. The biodegradation process shall be considered successful and efficient if it results in the reduction of BOD and COD of treated effluents below the WHO recommended level (i.e., 80 mg/L for BOD and 250 mg/L for COD).

2. Methodology

Chemicals and Reagent: 2,2’-azino-bis3-ethylbenzothiazoline-6-sulfonic acid (ABTS), Manganese sulfate and veratryl alcohol were of Sigma-Aldrich and purchased from the local supplier. Ligninolytic enzymes (Laccase, lignin peroxidase and manganese peroxidase) were produced from P. betulinus IEBL-3. Untreated industrial effluents (Mujahid textiles (MT), Sitara Textiles (ST) and Five Star Textile (FST) were collected from the local industrial units. All other chemicals used for the enzymatic assay, media preparation were of analytical grade, for HPLC analysis chemicals were of HPLC grade and purchased from local chemical supplier.
Fungal collection, isolation and maintenance:P. betulinus IEBL-3 was obtained from the IEBL Laboratory, Department of Biochemistry Arid Agriculture University Rawalpindi. It was isolated and maintained on the malt extract agar media having pH 5.5. The culture plates were streaked aseptically with a loop full of fungal spores from the pure culture obtained from IEBL. The plates were rapped and put in an incubator at 30 °C for 4 days. The culture obtained after day 4 was used to prepare the broth culture. Agar-less malt extract broth media (malt extract 20 g/L, glucose 20 g/L, peptone 3 g/L and distilled water) was prepared in a flask, inoculated aseptically and placed in a shaking incubator for 3–4 days. The fungal spores in the broth were maintained at 1 × 10⁷ to 109 spores/mL and monitored with a Biomass Monitor (ABER-220). It was used for the biodegradation of effluents [11].
Biodegradation of textile effluents: Considering the dyes biodegradation potential of P. betulinus IEBL-3 [12] the biodegradation of industrial effluents was optimized in the current study for expanding its industrial applications. For this, 90 mL of effluent was taken in a 250 mL flask, mixed with 10 mL broth media and fungal inoculum, and the effluent concentration was maintained as mentioned in Table 1. The experimental mixture was put on a shaking incubator at 120 rmp for a specified time period (Table 1). The absorbance was checked before and after the experiment at λmax of each effluent by withdrawing 2 mL of the sample from the mixture. The biodegradation process was optimized at two stages with a variation of physical and nutritional parameters by using the Response Surface Methodology (RSM) under the Box Bhenken Design (BBD) [5]. At each stage five parameters were optimized simultaneously, and experiments were designed using the JMP software [13].
The MT effluent has a burgundy color, λmax = 513 nm and initial pH 10.92. The FST effluent has dark blue color, λmax = 642 nm and initial pH 10.45. Finally, the ST effluent has dark red color, λmax = 518 nm and initial pH 13.32. For the biodegradation process, the pH was adjusted in an acidic range by adding acid.
Optimization of physical parameters: The fungal growth and its biodegradation potential is associated with certain factors such as pH, temperature, time period, dye conc. and fungal inoculum size [14]. These parameters were optimized simultaneously by using RSM under BBD. The experimental design results in 46 experimental combinations with six central points (Table 1).
Optimization of nutritional parameters: The presence of nutrients increases the growth of the strain, and, as a consequence, the biodegradation (co-metabolic biodegradation) process may be enhanced. To check this, two carbon sources (i.e., glucose and fructose) and three nitrogen sources (i.e., ammonium sulfate, ammonium nitrate and ammonia) were added simultaneously as a mixture in the biodegradation medium. There were 46 with 6 central points, under BBD and all were run in triplicate (Table 2) [15,16].
Study of ligninolytic enzymes: Three ligninolytic enzymes, i.e., LiP, MnP and Laccase, were studied during the biodegradation optimization, to check their role in the process. Lignin peroxidase activity assay was performed by the method of [17] by using veratryl alcohol (3,4-dimethoxybenzylalcohol) as a substrate. The reaction mixture contained 1 mL of tartarate buffer (100 mM, pH = 4), 1 mL veratryl alcohol and 500 μL H2O2 (0.2 M). The reaction started after the addition of 100 μL of biodegradation mixture as an enzyme sample. The blank contained distilled H2O instead of enzyme sample. The activity was measured by taking the absorbance after the interval of 10 min at 310 nm and was calculated by using following formula.
A = Є310 × c × L
   Є310 = 9300 M−1cm−1
where:
Є = molar extinction coefficient,
c = concentration,
A = absorbance,
L = path length.
Manganese peroxidase activity assay was performed by the method described by [18]. Manganese sulfate (MnSO4) was used as a substrate and H2O2 as an oxidizing ag/ ent. The reaction mixture consisted of 1 mL of MnSO4, 1 mL sodium melonate buffer (50 mM, pH = 4.5) and 500 μL H2O2. The addition of 100 μL of enzyme solution started the reaction. The complex products were monitored spectrophotometrically at 270 nm initially and after 10 min. The activity of MnP was calculated by using following formula.
A = Є270 × c × L
   Є270 = 11,590 M−1cm−1
Laccase activity assay was performed by the method reported by [19] by using ABTS as substrate. Laccase activity assay was performed by mixing 1 mL ABTS solution in 1 mL of sodium melonate buffer (50 mM, pH = 4.5) and a 100 μL enzyme sample. The absorbance was noted at 410 nm initially and after 10 min. The difference in absorbance was used to calculate the laccase activity by using following formula.
A = Є436 × c × L
   Є436 = 36,000 M−1cm−1
Determination of efficiency of biodegradation process: To monitor the efficiency of P. betulinus IEBL-3 during biodegradation and to check the efficacy of the process, BOD and COD values were measured before and after the treatment.
Determination of BOD: The Biological Oxygen Demand was measured for 5 days by following the method reported by [20] and described earlier in [16]. The effluent under observation was packed in an airtight bottle for 5 days, and dissolved oxygen was measured initially as well as at the last day. The oxygen taken during these days was oxygen used by microorganisms for the biodegradation of the material. The BOD was calculated by the following formula:
BOD5 = Initial dissolved oxygen - Final dissolved oxygen (after 5 days)
Determination of COD: The COD value of effluent gives information about the oxygen required to oxidize total organic material. Determination of COD involves the oxidation of organic material in the effluent with a strong oxidizing solution/digestion solution (K2Cr2O7, HgSO4 and (98%) H2SO4). A catalyst solution was used to enhance the oxidation process, which comprised of 10 g of Ag2SO4 in 500 mL of H2SO4. To determine the value of COD in effluents, 1.5 mL of digestion mixture was placed in a closed vial along with 3.5 mL of catalyst solution and 2.5 mL of effluent at 150 °C in an oven for 2 h. The values of COD were estimated by taking the absorbance at 600 nm. The blank consisted of all solutions except effluents, while Potassium hydrogen phthalate (KHP) was used as the standard. The standard solution of 425 ppm concentration gave a 500 mg O2/L COD value.
It was calculated by the procedure described by [20]. The COD was calculated by following formula:
COD = Standard factor × Absorbance at 600 nm
where:
Standard factor = Concentration of standard/ absorbance of standard
HPLC analysis of the industrial effluent: HPLC analysis of the untreated and treated effluents was performed to monitor the products during the biodegradation of textile industrial effluents. The treated samples with maximum biodegradation at the most suitable conditions were selected for the HLPC analysis. The HPLC was performed on the model SHIMAZDU LC-20AT with a C-18 column having a length of 25 mm and a 4.6 mm diameter. It was performed in the isocratic mode with a 1 mL/minute flow and a reverse phase mode. Acetonitrile to water (H2O) with a ratio of (60:40) was used as solvent system, while 20 μL of the sample was injected for the analysis of each sample with a detection wavelength set at 254 nm [21,22]. Retention time (tR) was used to identify the compounds in the sample by comparing with the retention time of the standards. The stock solutions of the standards were prepared having a concentration of 0.1 mg/mL and injected volume of 20 μL.

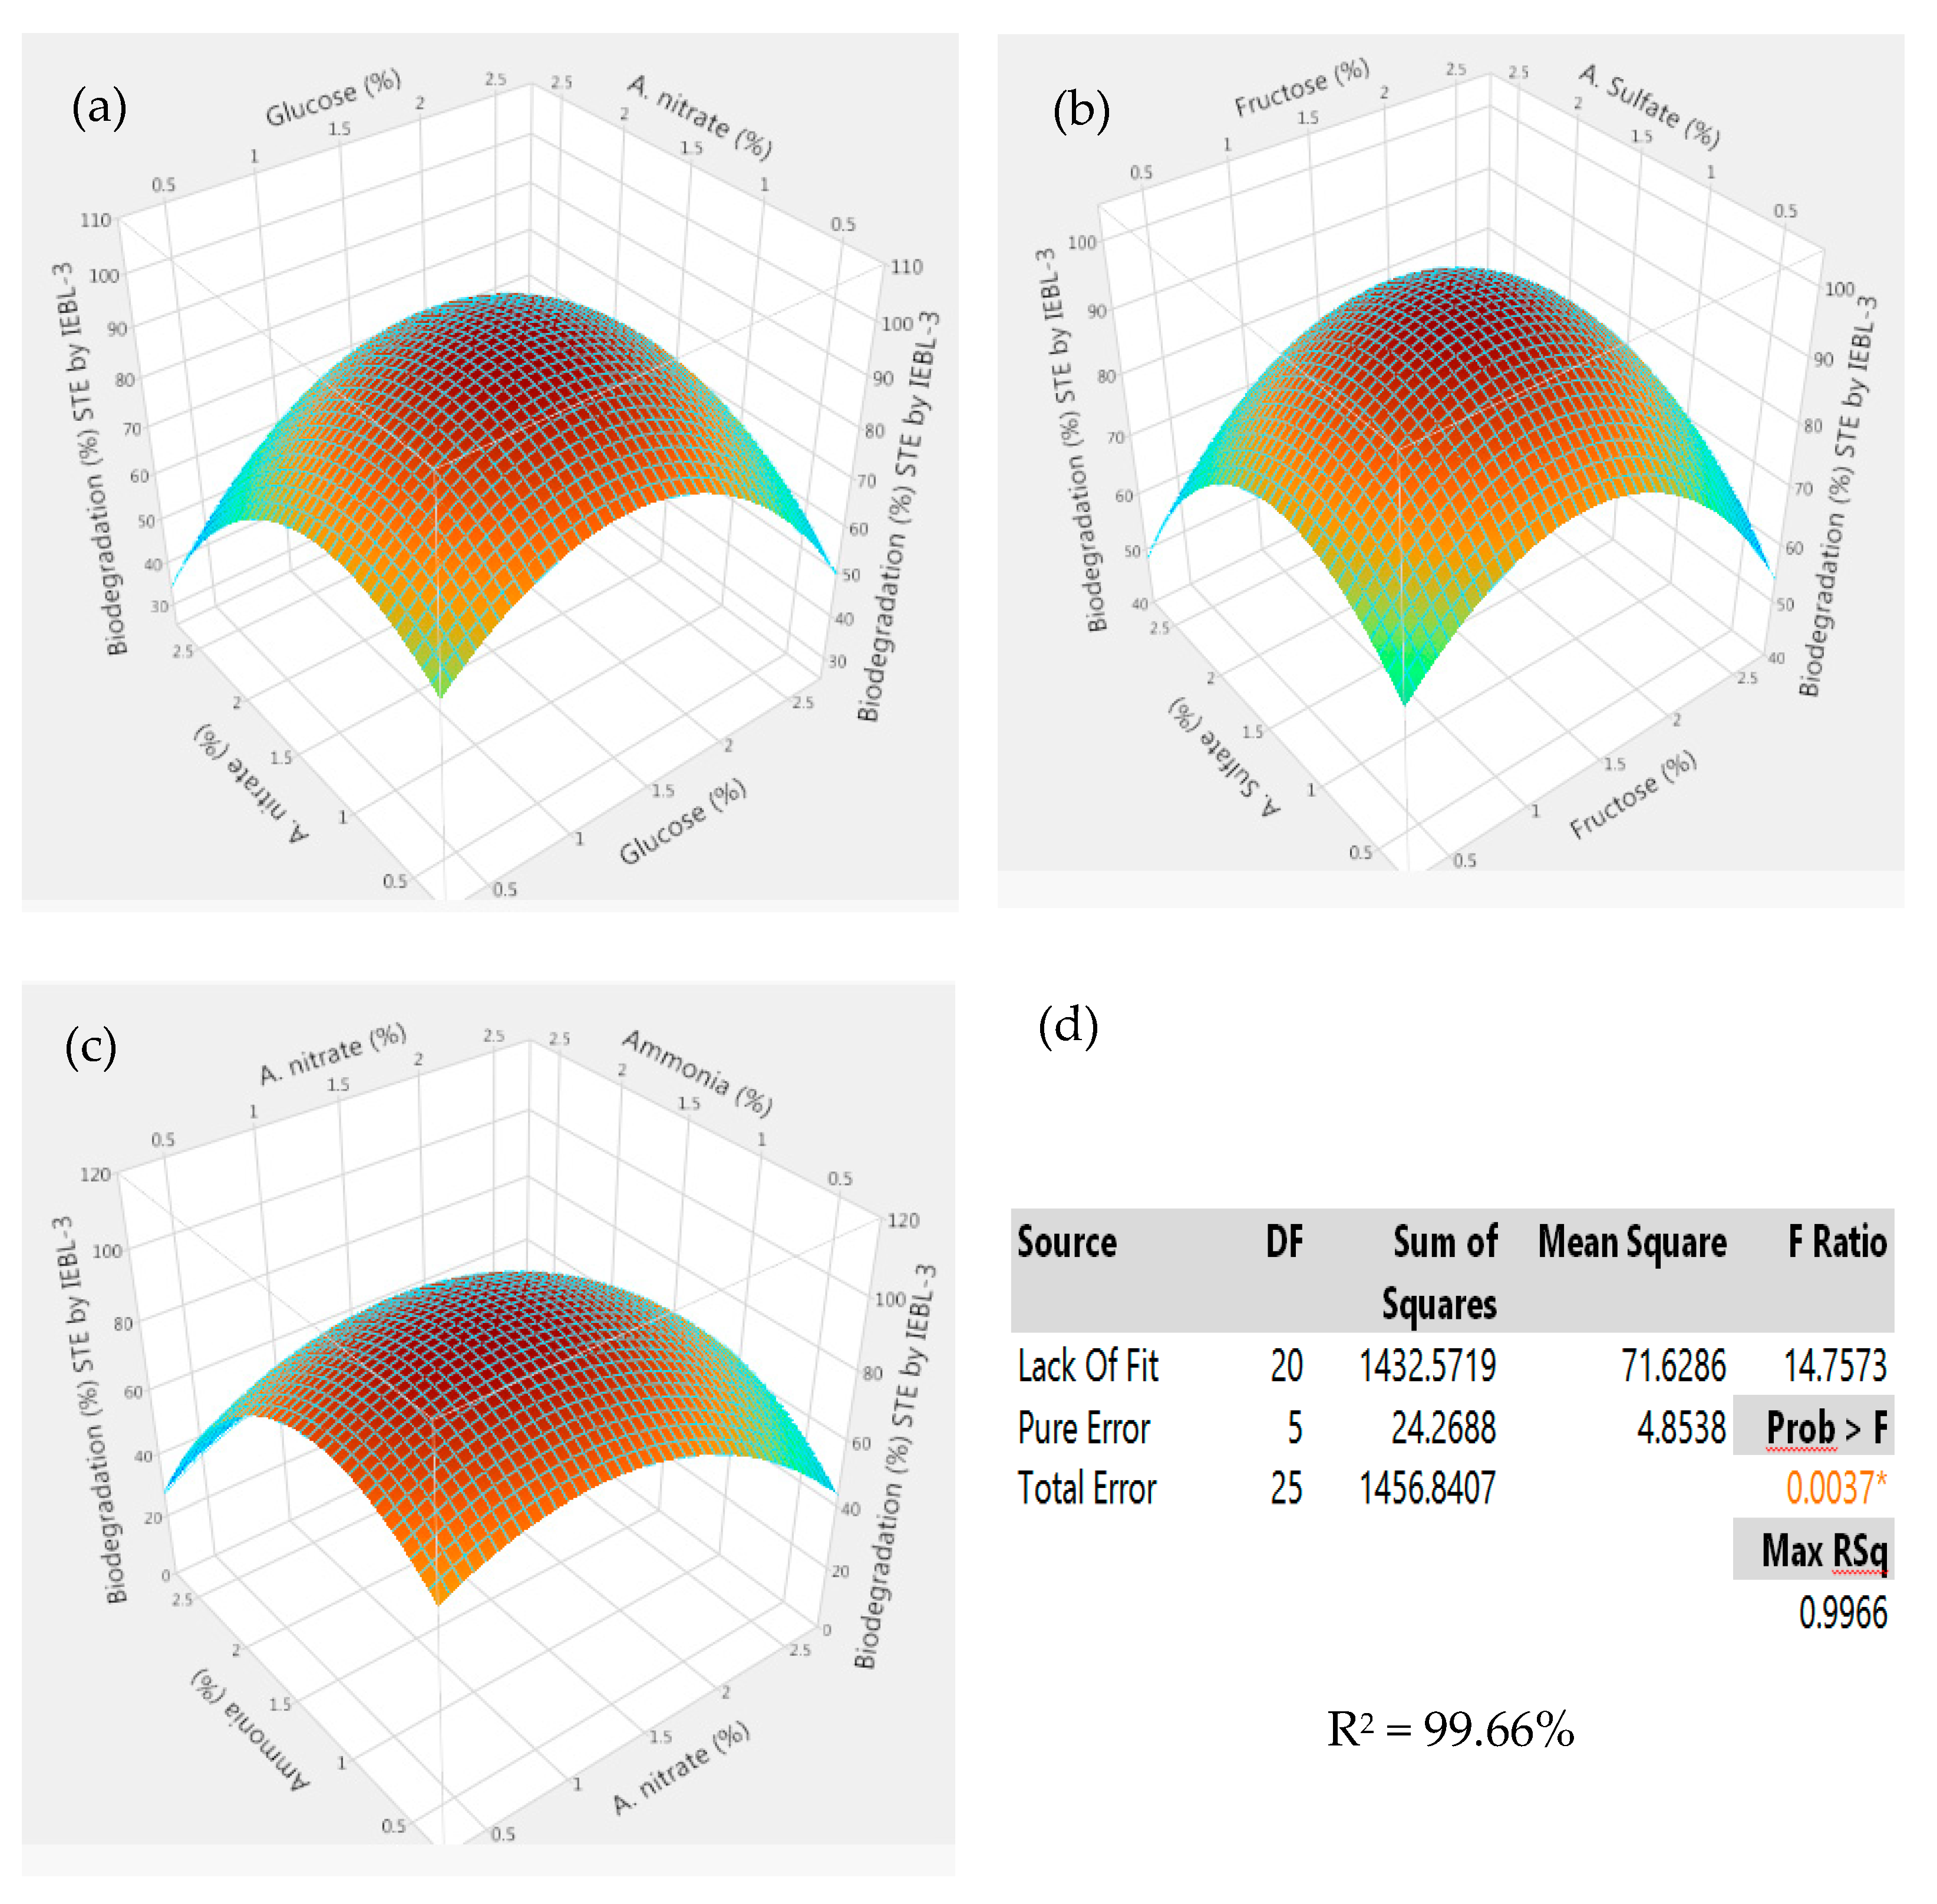
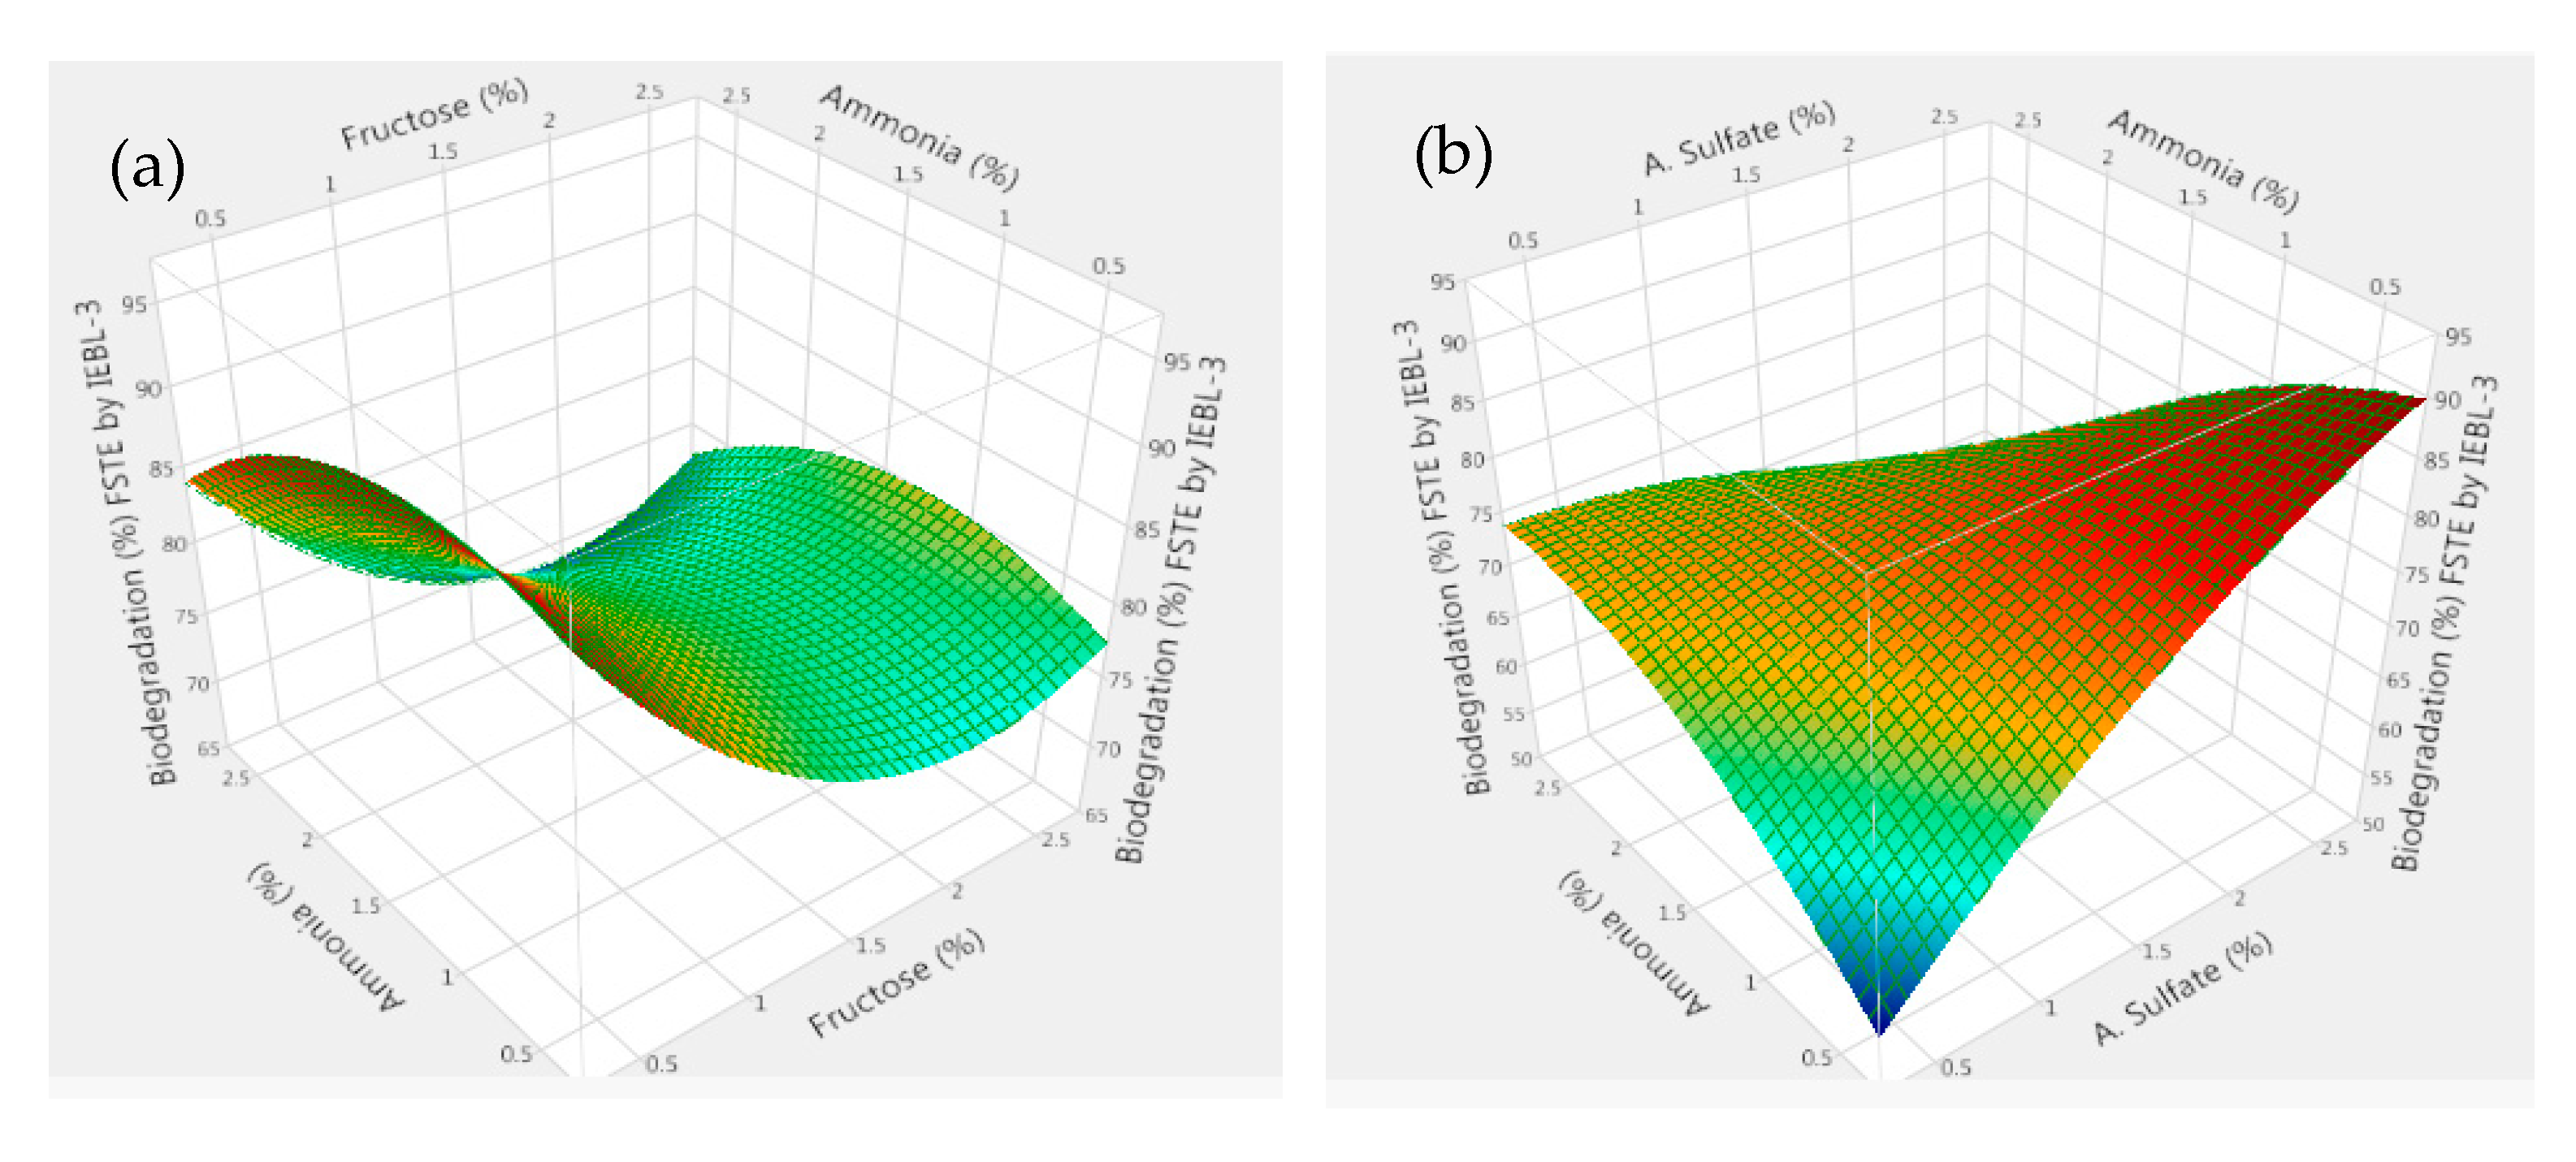
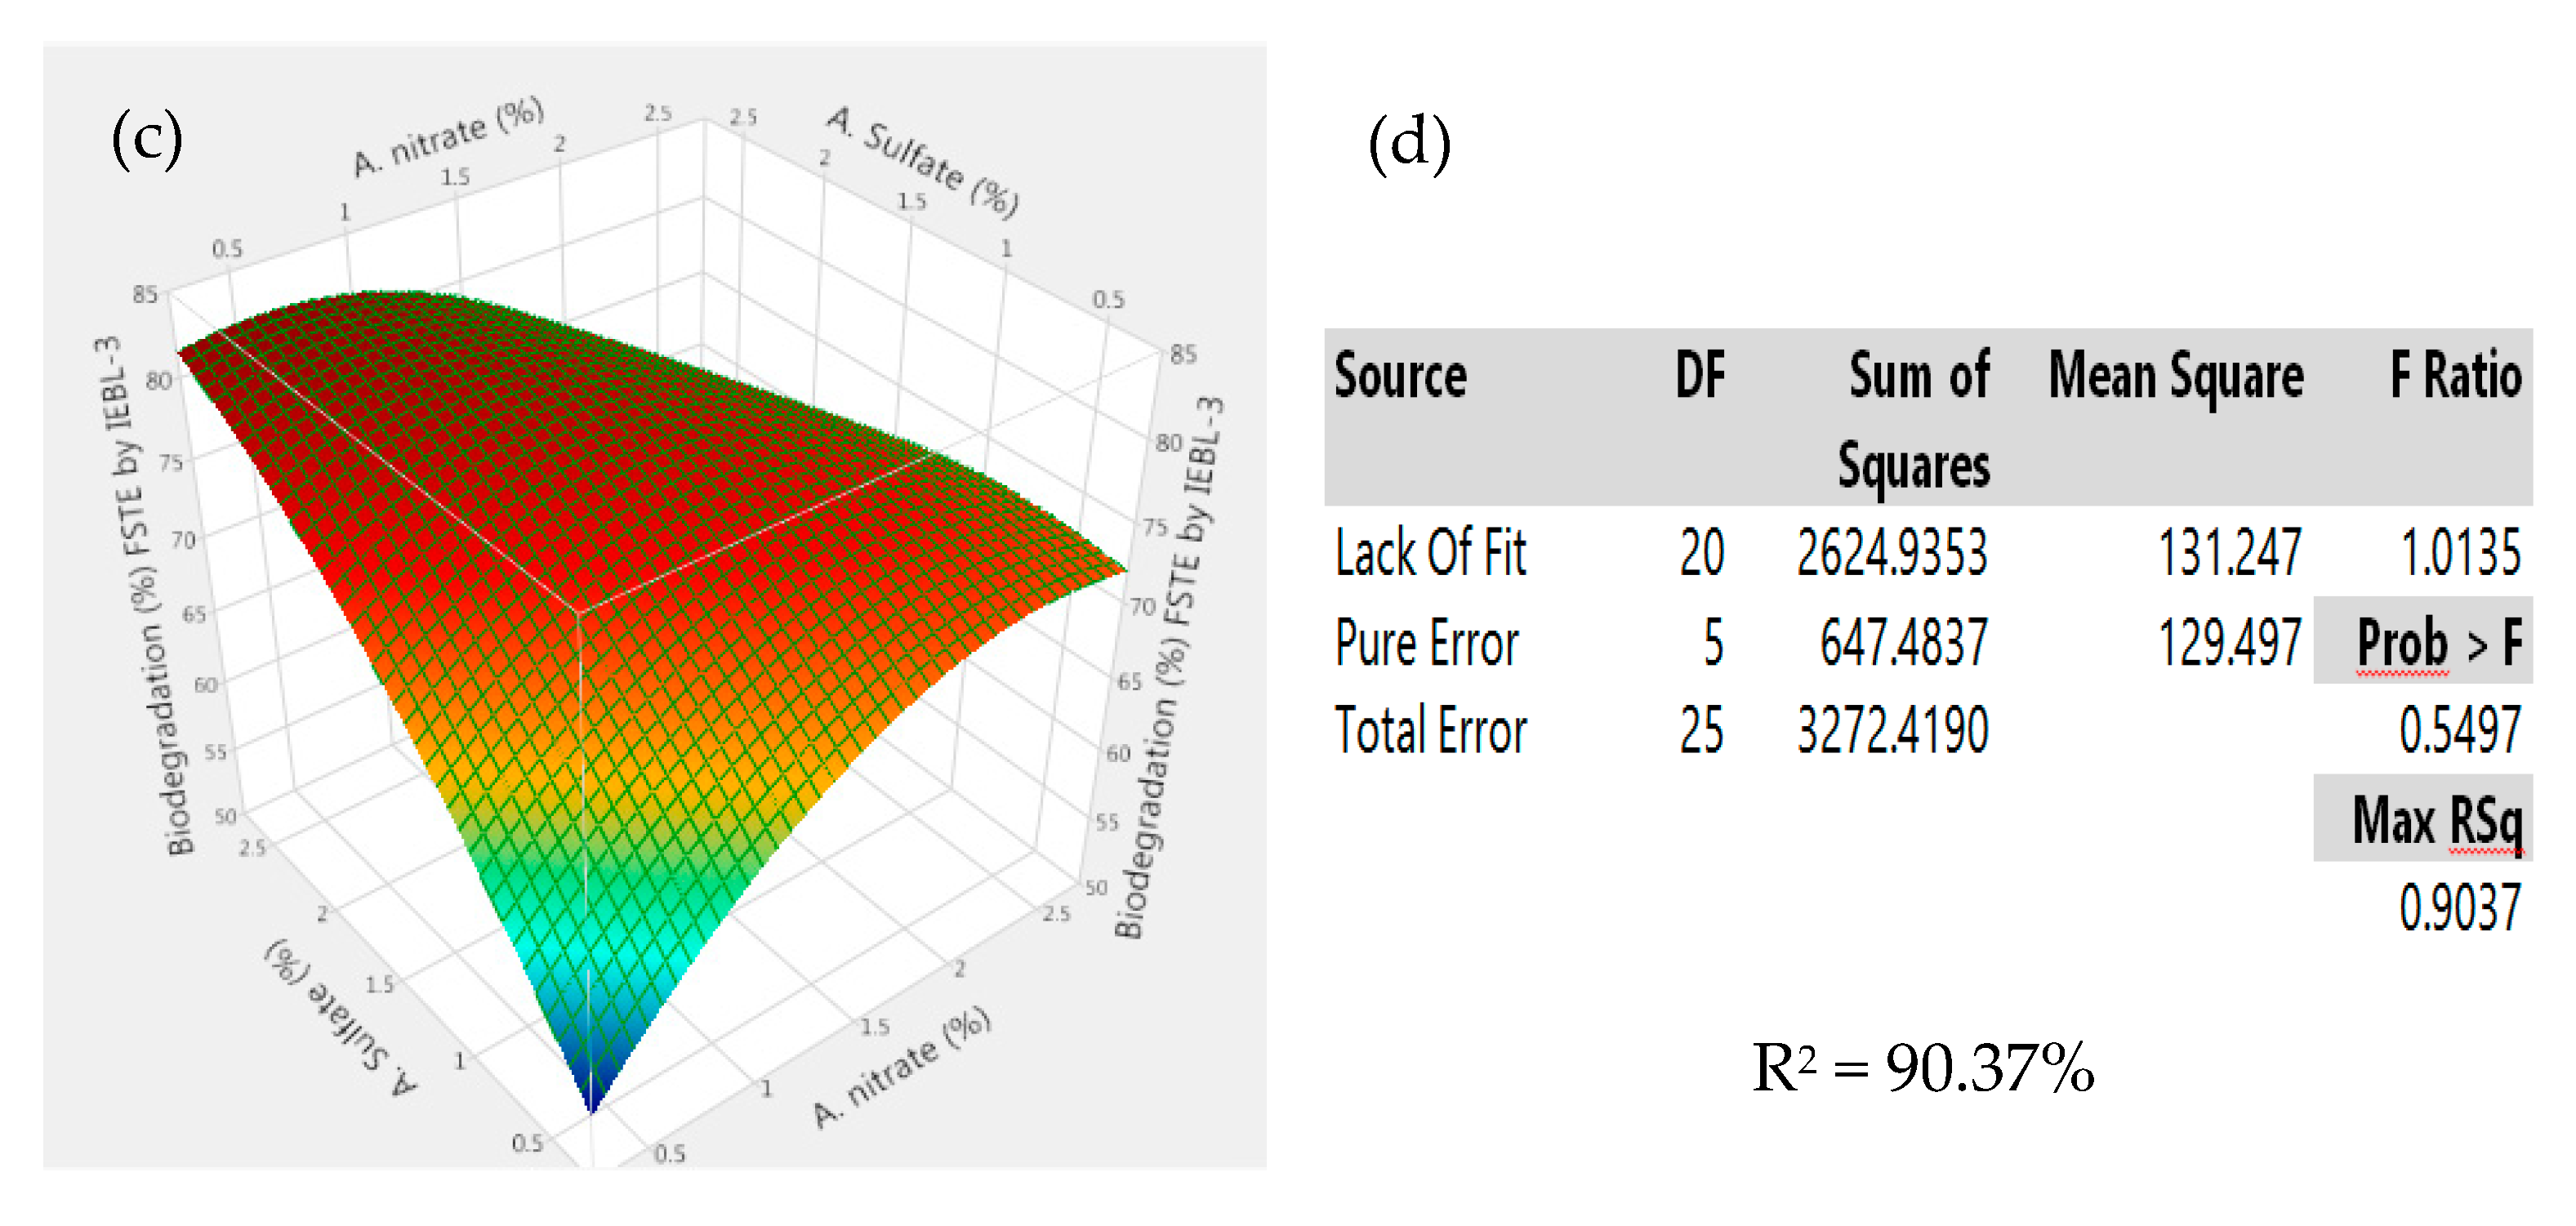
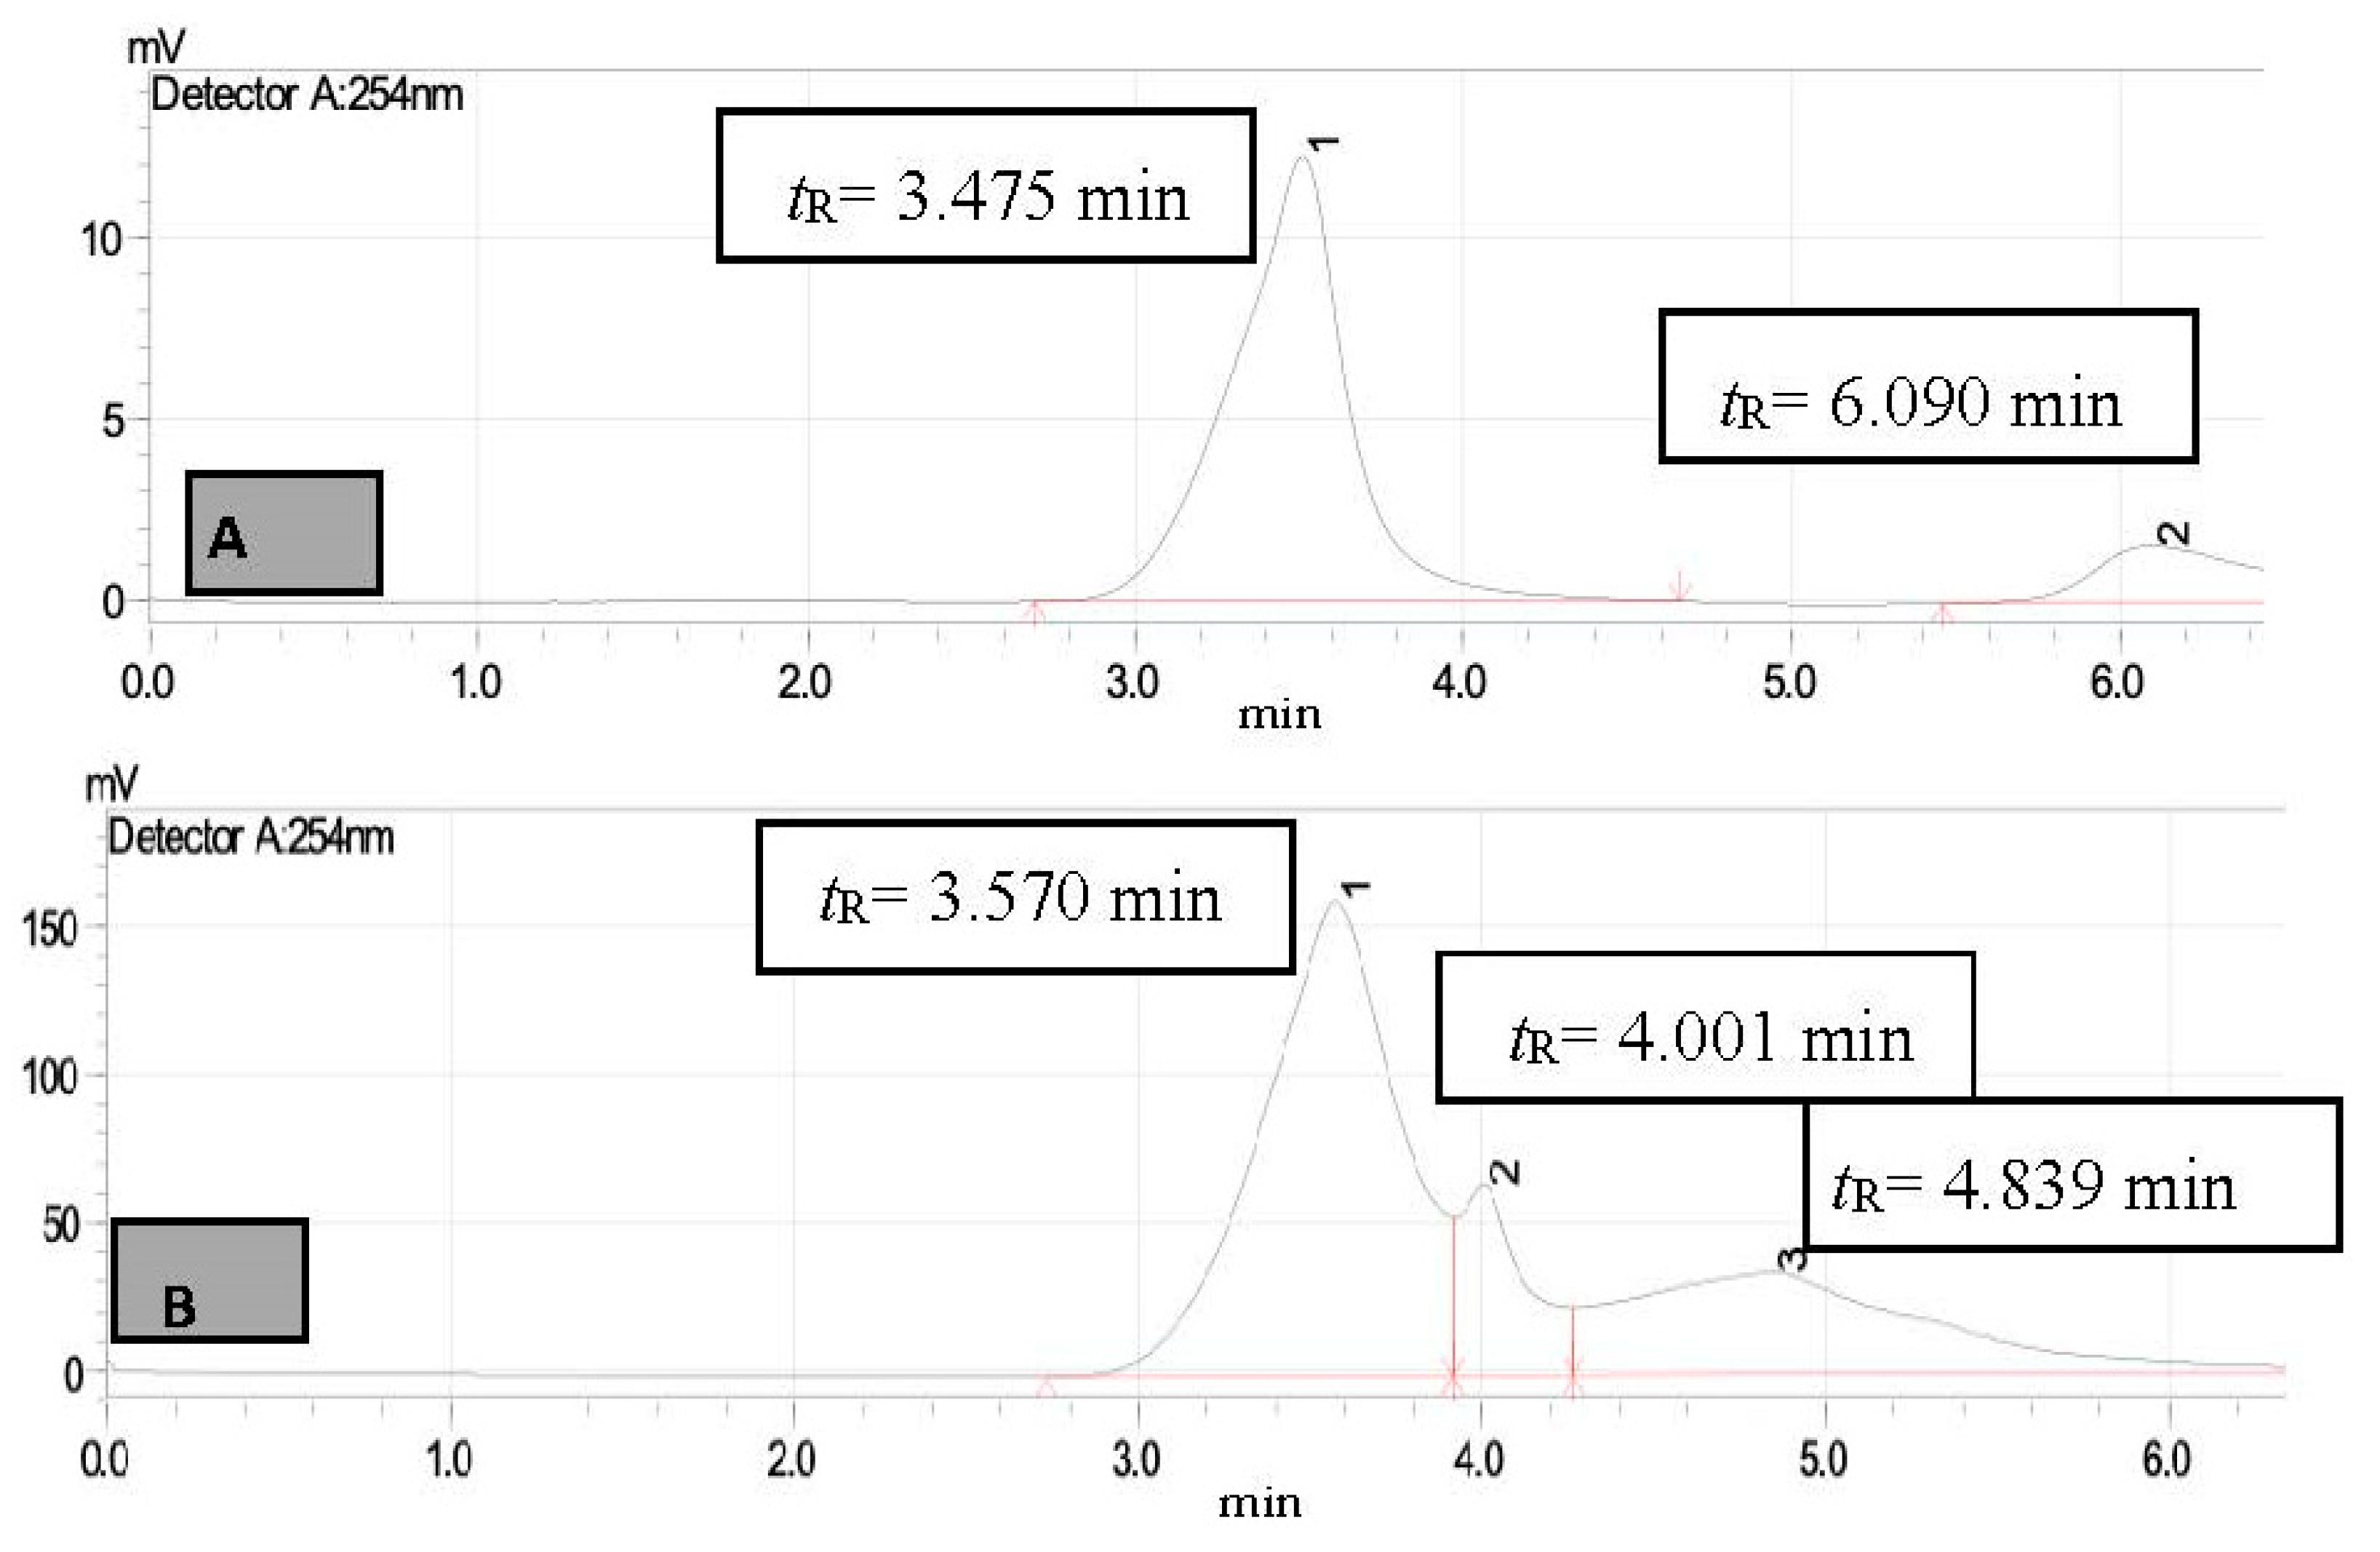
3. Results and Discussion

In a previous study we reported that P. betulinus IEBL-3 has a very good potential of biodegradation of vat textile dyes [17]. Vat dyes are a group of textile dyes named such because of the use of a bucket or vat during their dyeing process during the old times. It gave 66–70% and 47–59% biodegradation of vat and disperse textile dyes, respectively, after initial screening experiments. The biodegradation of vat dyes was enhanced above 80% after the optimization of conditions by using P. betulinus IEBL-3. Considering the previous results, in the current study this fungus was used for the biodegradation of three different untreated textile effluents, Mujahid Textiles (MT), Sitara Textiles (ST) and Five Star Textiles (FST).
Optimization of physical parameter for biodegradation: The process of biodegradation depends on the fungal growth in the mixture which is dependent on various physical parameters including pH, temperature, time period, dye concentration and fungal inoculum size. The effect of all five parameters on the biodegradation of three effluents was checked by employing RSM. The results obtained were used to generate the 3D graphs, showing the influence of every parameter on biodegradation and also the interaction of these parameters with each other during the process. The results showed that 76.20 ± 1.4% biodegradation of MT effluent was obtained at pH 5.2, a time period of 08 days, a size of inoculum 6.40 mL, temperature 26.90 °C and dye concentration 0.04%. There was positive interaction between all the parameters during the biodegradation process as indicated by the 3D response surface graphs (Figure 1) [15]. The significant effect of these parameters on the biodegradation process was confirmed by statistical analysis and indicated by low p value (p > 0.001), high F. ratio (26.48) and high R2 value (R2 = 95.70%).
There was almost 72.09 ± 1.2% biodegradation of FS industrial effluent, and the most suitable conditions were pH 5.6, time of 08 days, size of inoculum 6.60 mL, temp. 27.09 °C and dye concentration 0.038%. The biodegradation obtained was the combinatorial effect of all of the five parameters under study, indicated by the 3D graphs obtained from the results (Figure 2). There was a significant effect on all the parameters on the biodegradation, which was also confirmed by a low p value (p > 0.001), high F. ratio (30.86) and high R2 value (R2 = 96.40%) [4].
During the current study, there was 67.10 ± 1.2% bio-degradation of ST industrial effluent obtained. The most favorable conditions were pH 5.4, time of 08 days, size of inoculum 6.06 mL, temperature 26.90 °C and dye concentration 0.04%. The analysis of 3D graphs indicated that the maximum biodegradation achieved was the result of the positive and combinatorial effect of all five parameters (Figure 3). The significant effect of all parameters on the process of biodegradation of ST effluent was confirmed by the statistical analysis and indicated by a low p value (p > 0.001), high F. ratio (32.42) and high R2 value (R2 = 96.50%) [3].
Optimization of nutritional parameters for the biodegradation: The presence of nutrients (carbon and nitrogen sources) in addition to media may support fungal growth in the presence dyestuff and will lead to an enhanced biodegradation process. Five carbon and nitrogen sources selected on the basis of previous studies (Table 2) were added simultaneously as a mixture and their effect on the biodegradation was monitored. The physical parameters were used as mentioned above for each of the effluents. The results confirmed that there is a significant increase in the biodegradation of all three textile industrial effluents after the addition of additional C and N sources [13,15].
There was almost a 10.00% increase (76.23 ± 1.43% to 86.17 ± 1.02%) in the biodegradation MT industrial effluent after the addition of carbon and nitrogen sources in the biodegradation mixture (Figure 4). The 3D response surface graphs indicated the positive response between different nutrients which lead to enhanced biodegradation of the effluents. The increase in the biodegradation was almost 7.00% (72.09 ± 1.22% to 79.14 ± 1.12%) in the FST industrial effluent (Figure 5). There was a 9.00% increase (67.16 ± 1.24% to 76.22 ± 1.16%) observed in the biodegradation of the ST industrial effluent after the addition of carbon and nitrogen sources in different ratios (Figure 6). Further analysis of the 3D response surface graphs showed that biodegradation increased when there was a low and equal amount (1:1) of all carbon and nitrogen sources present in the biodegradation mixture [15,22]. Presence of carbon sources up to 2.20% and nitrogen sources up to 1.20% (except ammonia) showed a positive effect on the biodegradation process. There was a decrease in the biodegradation% when ammonia was more than 1.25% in the biodegradation mixture. A higher concentration of ammonia than certain limits causes stress, which leads to lower microbial growth [23]. This may be due to the inhibitory effect of ammonia on proteins involved in microbial growth by degrading nutrients. Similarly, there is a lower biodegradation% in the current study at a higher ammonia concentration, possibly due to the inhibitory effect on enzymes involved in the process [4]. Further, additional nutrients in the media increased the biodegradation process only when present in the right amount and ratio; otherwise, it leads to the instability of the enzymes and lowers the biodegradation. There are other studies that have reported the positive roles of various carbon and nitrogen sources in the biodegradation of different dyes [13,24].
Study of ligninolytic enzymes during biodegradation: Fungi have a non-specific ligninolytic enzyme system; they produce these enzymes in response to nutrients in the surrounding. The dyes have aromatic structures and induce the production of ligninolytic enzymes, which lead to dye oxidation and degradation [2].
The ligninolytic enzymes including lignin peroxidase (LiP), manganese peroxidase (MnP) and laccase were studied parallel to the biodegradation during each optimization step. It was observed that the activities of all three ligninolytic enzymes were increased with their increase in the biodegradation process. These findings confirmed the involvement of these enzymes in the biodegradation of textile effluents. After the optimization of physical parameters, maximum activities were 831.65 ± 5.43 UmL−1min−1, 609.86 ± 2.98 UmL−1min−1 and 325.27 ± 4.12 UmL−1min−1 for LiP, MnP and laccase, respectively. The increase in the activities were observed after the addition of carbon and nitrogen sources that cause an increase in the biodegradation of the effluents. The enzymatic activities were 925.54 ± 4.98 UmL−1min−1, 687 ± 3.21 UmL−1min−1 and 398.20 ± 2.34 UmL−1min−1 for LiP, MnP and laccase, respectively. These results suggest the role of ligninolytic enzymes of P. betulinus IEBL-3 in the biodegradation of the textile industrial effluents. A higher enzymatic activity of LiP indicated that this enzyme has a more active role in the biodegradation of industrial effluents under the study compared to the other two enzymes [25,26]. The ligninolytic enzymes were involved in the oxidation of phenolic substrates, which are part of the dyes in the effluents. The oxidized products of phenolics dyes act as a substrate for other enzymes, which are produced in fewer amounts by the fungi [27]. Kunjadia et al. [27] also reported the biodegradation of dyes by ligninolytic enzymes from fungi and found that there was an enhancement in the biodegradation with an increase in enzymatic activity. The azo dyes are decolorized by ligninolytic enzymes produced by fungi when the mixture is supplemented with optimized conditions. This decolorization is achieved by the oxidative degradation of dyes contents in the mixture by ligninolytic enzymes including LiP, MnP and laccase [3,28].
HPLC analysis of the effluents: During the biodegradation process, fungi degrade the complex dyes by an oxidation process, absorbing some into its biomass or mineralizing them into resultant elements. To monitor this, HPLC was performed before and after the biological treatment of the effluents by P. betulinus IEBL-3. There were three secondary amines available as standards, i.e., N-methylaniline, 3-methyldiphenylamine and phenylamin (Figure 7). Monitoring of the industrial effluents by HPLC showed a degradation of the dyes and the apparition of new peaks. Some of them may correspond to smaller molecules such as N-methylaniline, 3-methyldiphenylamine and phenylamine, while others remain unknown (Figure 8, Figure 9 and Figure 10) [29]. The current findings indicated that P. betulinus IEBL-3 has the ability of biodegrading textile industrial effluent under optimized conditions and can be used for wastewater treatment at industrial scale. The degradation or mineralization of dyes in the effluents is due to the activity of ligninolytic enzymes including manganese peroxidase, lignin peroxidase and laccase. These enzymes are secreted by the BRF in response to the dyes and may degrade or completely mineralize them into less or non-toxic forms [26,30,31]. The microbial biodegradation of effluents degrade most of the dyes while producing the other less toxic amines in small quantity [32]. The previous studies indicate that the secondary amines produced during the current study have a very low toxicity [33].
Biological oxygen demand (BOD) and Chemical oxygen demand (COD): The textile industrial effluents have higher values of BOD and COD than recommended by the WHO, i.e., below 80 mg/L for BOD and 250 mg/L for COD, due to the high concentration of the chemicals and contaminants in them. The initial values of BOD were 358 mg/L, 347 mg/L and 412 mg/L for MT, ST and FST industrial effluents, respectively, while, the initial values of COD were 1032 g/L, 1176 mg/L and 1237 mg/L for MT, ST and FST Industrial effluents, respectively.
The reduction in BOD and COD, respectively, after the optimization of physical parameters were 48.32% and 56.20% for the MT effluent, 44.09% and 56.46% of the ST effluent and 47.81% and 56.10% of the FST effluent. After optimization of nutritional parameters, the biodegradation process was enhanced, and there was further reduction in the BOD and COD values of each effluent. The reduction of BOD and COD, respectively, were 86.31% and 82.94% for the MT effluent, 83.57% and 81.03% of the ST effluent and 82.76% and 79.70% of the FST effluent. The process of the biodegradation reduced the values within recommended values, which confirmed the significance of this process. High BOD and COD make aquatic life difficult, while a reduction in these values make water suitable for aquatic life [15].

4. Conclusions

Industrial effluents are the major cause of the water and environmental pollution. There is a need to develop economic strategies for effluents treatment. Biological treatment processes are more reliable compared to physical and chemical methods. During the current study, it was observed that P. betulinus, a brown rot fungus, and causes almost 80% biodegradation of textile industrial effluents after the optimization of various parameters. The fungus also produces highly active ligninolytic enzymes including LiP, MnP and Laccase during the process, from these LiP being the most active. The biodegradation process reduces the BOD and COD values of the effluents well below the WHO recommended values, indicating that the process is quite efficient.

Author Contributions

Writing—original draft preparation, R.T.M.; methodology, M.J.A.; software, R.T.M. and M.A. (Muhammad Asgher); validation, F.S.K.; formal analysis and funding acquisition M.J.A., K.M. and N.N.; investigation, M.J.A.; resources, M.A. (Muhammad Asgher) and M.A. (Muhammad Awais); data curation, R.T.M.; editing and reviewing, P.A.; supervision and project administration, M.J.A., R.T.M. and M.A. (Muhammad Awais). All authors have read and agreed to the published version of the manuscript.

Funding

The authors extend their appreciation to the Deanship of Scientific Research at King Khalid University for funding this work through a research group program under grant number RGP.1/345/42.

Data Availability Statement

Not applicable.

Acknowledgments

Authors are thankful to the Department of Public Health, College of Applied Medical Sciences, KKU, Abha for all the technical help.

Conflicts of Interest

The authors declare that there is no conflict of interest in the publication of this research work.

References

  1. Asgher, M.; Yasmeen, Q.; Iqbal, H.M.N. Enhanced decolorization of solar brilliant red 80 textile dye by an indigenous white rot fungus Schizophyllum commune IBL-06. Saud. J. Biol. Sci. 2013, 20, 347–352. [Google Scholar] [CrossRef] [PubMed] [Green Version]
  2. Rani, B.; Kumar, V.; Singh, J.; Bisht, S.; Teotia, P.; Sharmaand, S.; Kela, R. Bioremediation of dyes by fungi isolated from contaminated dye effluent sites for bio-usability. Braz. J. Microbiol. 2014, 45, 1055–1063. [Google Scholar] [CrossRef] [PubMed] [Green Version]
  3. Singh, L.; Singh, V.P. Decolourization of Azo (Acid red) and Anthraquinonic (Basic blue) Dyes by the Fungus Aspergillus flavus. Int. J. Biomed. Engine Clin. Sci. 2017, 3, 1–5. [Google Scholar]
  4. Vijayalakshmidevi, S.; Muthukumar, K. Improved biodegradation of textile dye effluent by coculture. Ecotoxicol. Environ. Saf. 2015, 114, 23–30. [Google Scholar] [CrossRef]
  5. Asgher, M.; Jamil, F.; Iqbal, H.M.N. Bioremediation Potential of Mixed White Rot Culture of Pleurotus Ostreatus IBL-02 and Coriolus Versicolor IBL-04 for Textile Industry Wastewater. J. Bioremediation Biodegrad. 2012, 6, 233–241. [Google Scholar] [CrossRef] [Green Version]
  6. Roselin, L.S.; Selvin, R. Photocatalytic treatment and reusability of textile dyeing effluents from cotton dyeing industries. Sci. Adv. Mat. 2011, 3, 113–119. [Google Scholar] [CrossRef]
  7. Ajaz, M.; Rehman, A.; Khan, Z.; Nisar, M.A.; Hussain, S. Degradation of azo dyes by Alcaligenes aquatilis 3c and its potential use in the wastewater treatment. AMB Express 2019, 9, 64. [Google Scholar] [CrossRef]
  8. Singh, L.; Singh, V.P. Microbial degradation and decolourization of dyes in semi-solid medium by the fungus-Trichoderma harzianum. Environ. We Int. J. Sci. Technol. 2010, 5, 147–153. [Google Scholar]
  9. Abd El-Rahim, W.M.; Moawad, H.; Azeiz, A.Z.A.; Sadowsky, M.J. Biodegradation of azo dyes by bacterial or fungal consortium and identification of the biodegradation products. Egypt. J. Aquat. Res. 2021, 47, 269–276. [Google Scholar] [CrossRef]
  10. Iqbal HM, N.; Asgher, M. Characterization and decolorization applicability of xerogel matrix immobilized manganese peroxidase produced from Trametes versicolor IBL-04. Protein Pep. Lett. 2013, 20, 591–600. [Google Scholar] [CrossRef]
  11. Mahmood, R.T.; Asad, M.J.; Asgher, M.; Gulfraz, M.; Mukhtar, T.; Akram, M. Study of disperse dyes biodegradation and lignolytic enzymes production potential of indigenous Coniophora puteana IBL-01, a brown rot fungi. Adv. Environ. Bio. 2015, 9, 139–150. [Google Scholar]
  12. Mahmood, R.T.; Asad, M.J.; Asgher, M.; Gulfraz, M.; Mukhtar, T. Analysis of lingolytic enzymes and decolorization of disperse violet S3RL, yellow brown S2RFL, red W4BS, yellow SRLP and red S3B by brown rot fungi. Pak. J. Agric. Sci. 2017, 54, 407–413. [Google Scholar]
  13. Kaushik, P.; Malik, A. Process optimization for efficient dye removal by Aspergillus lentulus FJ172995. J. Hazard. Mater. 2011, 185, 837–843. [Google Scholar] [CrossRef] [PubMed]
  14. Pavko, A. Fungal decolourization and degradation of synthetic dyes some chemical engineering aspects. Waste Water Treat. Reutili. 2011, 2, 65–88. [Google Scholar]
  15. Kaushik, P.; Malik, A. Effect of nutritional conditions on dye removal from textile effluent by Aspergillus lentulus. World J. Microbiol. Biotechnol. 2010, 26, 1957–1964. [Google Scholar] [CrossRef]
  16. Mahmood, R.T.; Asad, M.J.; Asgher, M.; Zainab, T.; Zafar, M.; Hadri, S.H.; Ali, I.; Zaman, N.; Wattoo, F.H. First report on implementation of response surface methodology for the biodegradation of textile industrial effluents by Coniophora puteana IEBL-1. Arch. Environ. Proc. 2019, 45, 48–59. [Google Scholar]
  17. Tien, M.; Kirk, T.K. Lignin peroxidases of Phanerochaete chrysosporium. Methods Enzymol. 1988, 161, 238–249. [Google Scholar]
  18. Wariishi, H.; Vallim, K.; Gold, M.H. Manganese(II) oxidation by manganese peroxidase from the basidiomycete Phanerochaete chrysosporium kinetic mechanism and role of chelators. J. Biol. Chem. 1992, 267, 23688–23695. [Google Scholar] [CrossRef]
  19. Wolfenden, B.S.; Willson, R.L. Radical-cations as reference chromogens in kinetic studies of ono-electron transfer reactions: Pulse radiolysis studies of 2,2′-azinobis-(3-ethylbenzthiazoline-6-sulphonate). J. Chem. Soc. Perkin Trans. 1982, 2, 805–812. [Google Scholar] [CrossRef]
  20. Greenberg, A.E.; Trussell, R.R.; Clesceri, L.S.; Franson, M.A.H. Standard Methods for the Examination of Water and Wastewater, 16th ed.; American Public Health Association: Washington, DC, USA, 1985. [Google Scholar] [CrossRef]
  21. Zhao, X.; Hardin, I.R. HPLC and spectrophotometric analysis of biodegradation of azo dyes by Pleurotus ostreatus. Dye. Pigment. 2007, 73, 322–325. [Google Scholar] [CrossRef]
  22. Lade, H.; Govindwar, S.; Paul, D. Low-Cost Biodegradation and Detoxification of Textile Azo Dye C.I. Reactive Blue 172 by Providencia rettgeriStrain HSL1. J. Chem. 2015, 2015, 1–10. [Google Scholar] [CrossRef] [Green Version]
  23. Luther, K.L. Ammonia Toxicity in Bacteria and Its Implications for Treatment of and Resource Recovery from Highly Nitrogenous Organic Wastes. P.D. Dissertation, The State University of New Jersey, New Brunswick, NJ, USA, 2015. [Google Scholar]
  24. Jafaria, N.; Soudib, M.R.; Kermanshahic, R.K. Biodegradation Perspectives of Azo Dyes by Yeasts. Microbiology 2014, 83, 484–497. [Google Scholar] [CrossRef]
  25. Kumar, V.V.; Kirupha, S.D.; Periyaraman, P.; Sivanesan, S. Screening and induction of laccase activity in fungal species and its application in dye decolorization. Afr. J. Microbiol. Res. 2011, 5, 1261–1267. [Google Scholar] [CrossRef]
  26. Shahid, A.; Singh, J.; Bisht, S.; Teotia, P.; Kumar, V. Biodegradation of Textile Dyes by Fungi Isolated from North Indian Field Soil. EnvironmentAsia 2013, 6, 51–57. [Google Scholar]
  27. Kunjadia, P.D.; Sanghvi, G.V.; Kunjadia, A.P.; Mukhopadhyay, P.N.; Dave, G.S. Role of ligninolytic enzymes of white rot fungi (Pleurotus spp.) grown with azo dyes. SpringerPlus 2016, 5, 1487. [Google Scholar] [CrossRef] [Green Version]
  28. Wesenberg, D.; Kyriakides, I.; Agathos, S.N. White-rot fungi and their enzymes for the treatment of industrial dye effluents. Biotechnol. Adv. 2003, 22, 161–187. [Google Scholar] [CrossRef] [PubMed]
  29. Porwal, H.; Mane, A.; Velhal, S. Biodegradation of dairy effluent by using microbial isolates obtained from activated sludge. Water Resour. Ind. 2015, 9, 1–15. [Google Scholar] [CrossRef] [Green Version]
  30. Park, C.; Lee, M.; Lee, B.; Kim, S.W.; Chase, H.A.; Lee, J.; Kim, S. Biodegradation and biosorption for decolorization of synthetic dyes by Funalia trogii. Biochem. Eng. J. 2007, 36, 59–65. [Google Scholar] [CrossRef]
  31. El-Kassas, H.Y.; Mohamed, L.A. Bioremediation of the textile waste effluent by Chlorella vulgaris. Egypt J. Aquat. Res. 2014, 40, 301–308. [Google Scholar] [CrossRef] [Green Version]
  32. Prasad, A.S.A.; Rao, K. Aerobic biodegradation of azo dye Acid Black-24 by Bacillus halodurans. J. Environ. Biol. 2014, 35, 549–554. [Google Scholar] [PubMed]
  33. Prosser, R.S.; Parrott, J.L.; Galicia, M.; Shires, K.; Sullivan, C.; Toito, J.; Bartlett, A.J.; Milani, D.; Gillis, P.L.; Balakrishnan, V.K. Toxicity of sediment-associated substituted phenylamine antioxidants on the early life stages ofPimephales promelasand a characterization of effects on freshwater organisms. Environ. Toxicol. Chem. 2017, 36, 2730–2738. [Google Scholar] [CrossRef] [PubMed]
Figure 1. The 3D response surface graphs of interaction between parameters during the bio-degradation of MT industrial effluent by P. betulinus IEBL-3; there is positive interaction between (a)—pH and size of inoculum (b)—pH and time (c)—size of inoculum and temp. (d)—size of inoculum and dye conc. (e)—temp. and dye conc. (f)—statistical analysis (* indicate significance of value).
Applsci 12 01090 g001aApplsci 12 01090 g001b
Figure 2. The 3D response surface graphs of the interaction between parameters during the bio-degradation of FST industrial effluent by P. betulinus IEBL-3; there is positive interaction between (a)—pH and time (b)—pH and temp. (c)—size of inoculum and time (d)—size of inoculum and dye conc. (e)—time and dye conc. (f)—statistical analysis (* indicate significance of value).
Applsci 12 01090 g002aApplsci 12 01090 g002b
Figure 3. The 3D response surface graphs of interaction between parameters during the bio-degradation of ST industrial effluent by P. betulinus IEBL-3; there is positive interaction between (a)—pH and size of inoculum (b)—pH and temp. (c)—size of inoculum and time (d)—size of inoculum and temp. (e)—temp. and dye conc. (f)—statistical analysis.
Applsci 12 01090 g003aApplsci 12 01090 g003b
Figure 4. Response surface 3D graphs showing effect of carbon and nitrogen sources on the biodegradation of Mujahid Textile (MT) industrial effluent by P. betulinus IEBL-3; graphs represent positive interaction between (a) fructose and glucose, (b) ammonium nitrate and fructose and (c) ammonia and ammonium sulfate. (d) Statistical analysis indicating the significant effect of parameters (* indicate significance of value).
Applsci 12 01090 g004
Figure 5. Response surface 3D graphs showing effect of carbon and nitrogen sources on the biodegradation of Sitara Textile (MT) industrial effluent by P. betulinus IEBL-3; graphs represent positive interaction between (a) ammonium nitrate and glucose, (b) ammonium sulfate and fructose and (c) ammonia and ammonium nitrate. (d) Statistical analysis indicating the significant effect of parameters (* indicate significance of value).
Applsci 12 01090 g005
Figure 6. Response surface 3D graphs showing effect of carbon and nitrogen sources on the biodegradation of Five Star Textile (MT) industrial effluent by P. betulinus IEBL-3; graphs represent positive interaction between (a) ammonia and fructose, (b) ammonia and a. nitrate and (c) a. sulfate and a. nitrate. (d) Statistical analysis indicating the significant effect of parameters.
Applsci 12 01090 g006aApplsci 12 01090 g006b
Figure 7. HPLC chromatogram of standard secondary amines (A)—N-methylaniline (tR = 3.570 min) (B)—3-Methyldiphenylamine (tR = 3.870 min) and (C)—Diphenylamine (tR = 3.690 min).
Applsci 12 01090 g007
Figure 8. HPLC chromatogram of MTIE (A)—untreated sample (B)—treated sample, peak 1 for N-methylaniline (tR = 3.570 min) and peak 2 (tR = 4.001 min) and 3 (tR = 4.839 min) for unknown compound.
Applsci 12 01090 g008
Figure 9. HPLC chromatogram of FSIE (A)—untreated sample (B)—treated sample, peak 1 for N-methylaniline (tR = 3.570 min) and peak 2 (tR = 4.679 min) for unknown compounds.
Applsci 12 01090 g009
Figure 10. HPLC chromatogram of STIE (A)—untreated sample (B)—treated sample, peak 1 for diphenylamine (tR = 3.690 min) and peak 2 (tR = 4.720 min) for unknown compound.
Applsci 12 01090 g010
Table 1. Experimental design for the optimization of physical parameters during the biodegradation of effluents (Conc. are in % age by Volume).
No.pHFungal Inoculum Size (mL)DaysTemp. (°C)Effluent Conc. (%) No.pHFungal Inoculum Size (mL)DaysTemp. (°C)Effluent Conc. (%)
8.06.00232.50.030 6.06.00532.50.030
4.06.00232.50.030 6.06.00532.50.030
8.06.00532.50.010 6.06.00232.50.010
4.06.00540.00.030 8.06.00532.50.050
4.06.00532.50.010 6.06.00240.00.030
6.02.00832.50.030 4.06.00532.50.050
4.010.00532.50.030 6.06.00832.50.010
6.06.00540.00.050 6.010.00532.50.010
6.06.00532.50.030 6.06.008250.030
4.06.00525.00.030 8.06.00540.00.030
6.06.00225.00.030 6.010.00540.00.030
6.02.00532.50.010 6.02.00525.00.030
8.06.00832.50.030 6.010.00525.00.030
6.06.00232.50.050 6.06.00840.00.030
4.02.00532.50.030 6.010.00232.50.030
6.010.00832.50.030 6.02.00532.50.050
6.010.00532.50.050 6.06.00532.50.030
8.02.00532.50.030 6.06.00525.00.050
6.02.00540.00.030 6.02.00232.50.030
6.06.00525.00.010 6.06.00532.50.030
6.06.00532.50.030 6.06.00540.00.010
8.06.00525.00.030 6.06.00832.50.050
4.06.00832.50.030 8.010.00532.50.030
Table 2. Experimental design for the optimization of nutritional parameters during the biodegradation of effluents (Conc. are in % age by weight).
No.Glucose (%)Fructose (%)Amm. Nitrate (%)Amm. Sulfate (%)Ammonia (%)No.Glucose (%)Fructose (%)Amm. Nitrate (%)Amm. Sulfate (%)Ammonia (%)
1.501.501.501.501.50 1.002.001.001.002.00
2.002.002.002.002.00 2.001.001.002.001.00
1.001.001.001.001.00 2.001.002.001.002.00
1.001.001.001.002.00 1.001.001.001.001.00
1.001.001.002.002.00 2.001.001.001.002.00
1.001.002.002.002.00 1.002.001.002.001.00
1.002.002.002.002.00 2.001.002.002.001.00
2.001.001.001.001.00 1.002.002.002.001.00
2.002.001.001.001.00 2.002.001.002.002.00
2.002.002.001.001.00 1.002.002.001.002.00
2.002.002.002.001.00 2.501.501.501.501.50
2.001.002.001.001.00 1.501.501.501.500.50
2.002.001.001.002.00 1.501.501.502.501.50
1.002.001.002.002.00 1.501.501.500.501.50
1.001.002.001.002.00 0.501.501.501.501.50
2.001.001.002.002.00 1.501.500.501.501.50
2.002.002.001.002.00 1.502.501.501.501.50
1.001.001.002.001.00 1.501.502.501.501.50
1.002.002.001.001.00 1.501.501.501.502.50
2.001.002.002.002.00 1.500.501.501.501.50
1.001.002.002.002.00 1.001.501.500.501.00
2.002.001.001.001.00 1.501.001.001.500.50
2.002.001.002.001.00 0.500.501.001.001.50
Publisher’s Note: MDPI stays neutral with regard to jurisdictional claims in published maps and institutional affiliations.

