
Visual Sentiment Analysis Using Deep Learning Models with Social Media Data

 ,
, 
Abstract
:1. Introduction
- We introduced a unique approach that uses fine-tuned transfer learning models to handle the issues of image sentiment analysis.
- To mitigate overfitting, we employed additional layers, such as dropout and weight regularization (L1 and L2 regularization). By performing a grid search across several values of the regularization parameter, we were able to find the value that gives the model its maximum accuracy.
- On a typical dataset, we show that a visual sentiment analysis approach comprising fine-tuned DenseNet-121 architecture outperforms the previous state-of-the-art model.
2. Literature Survey
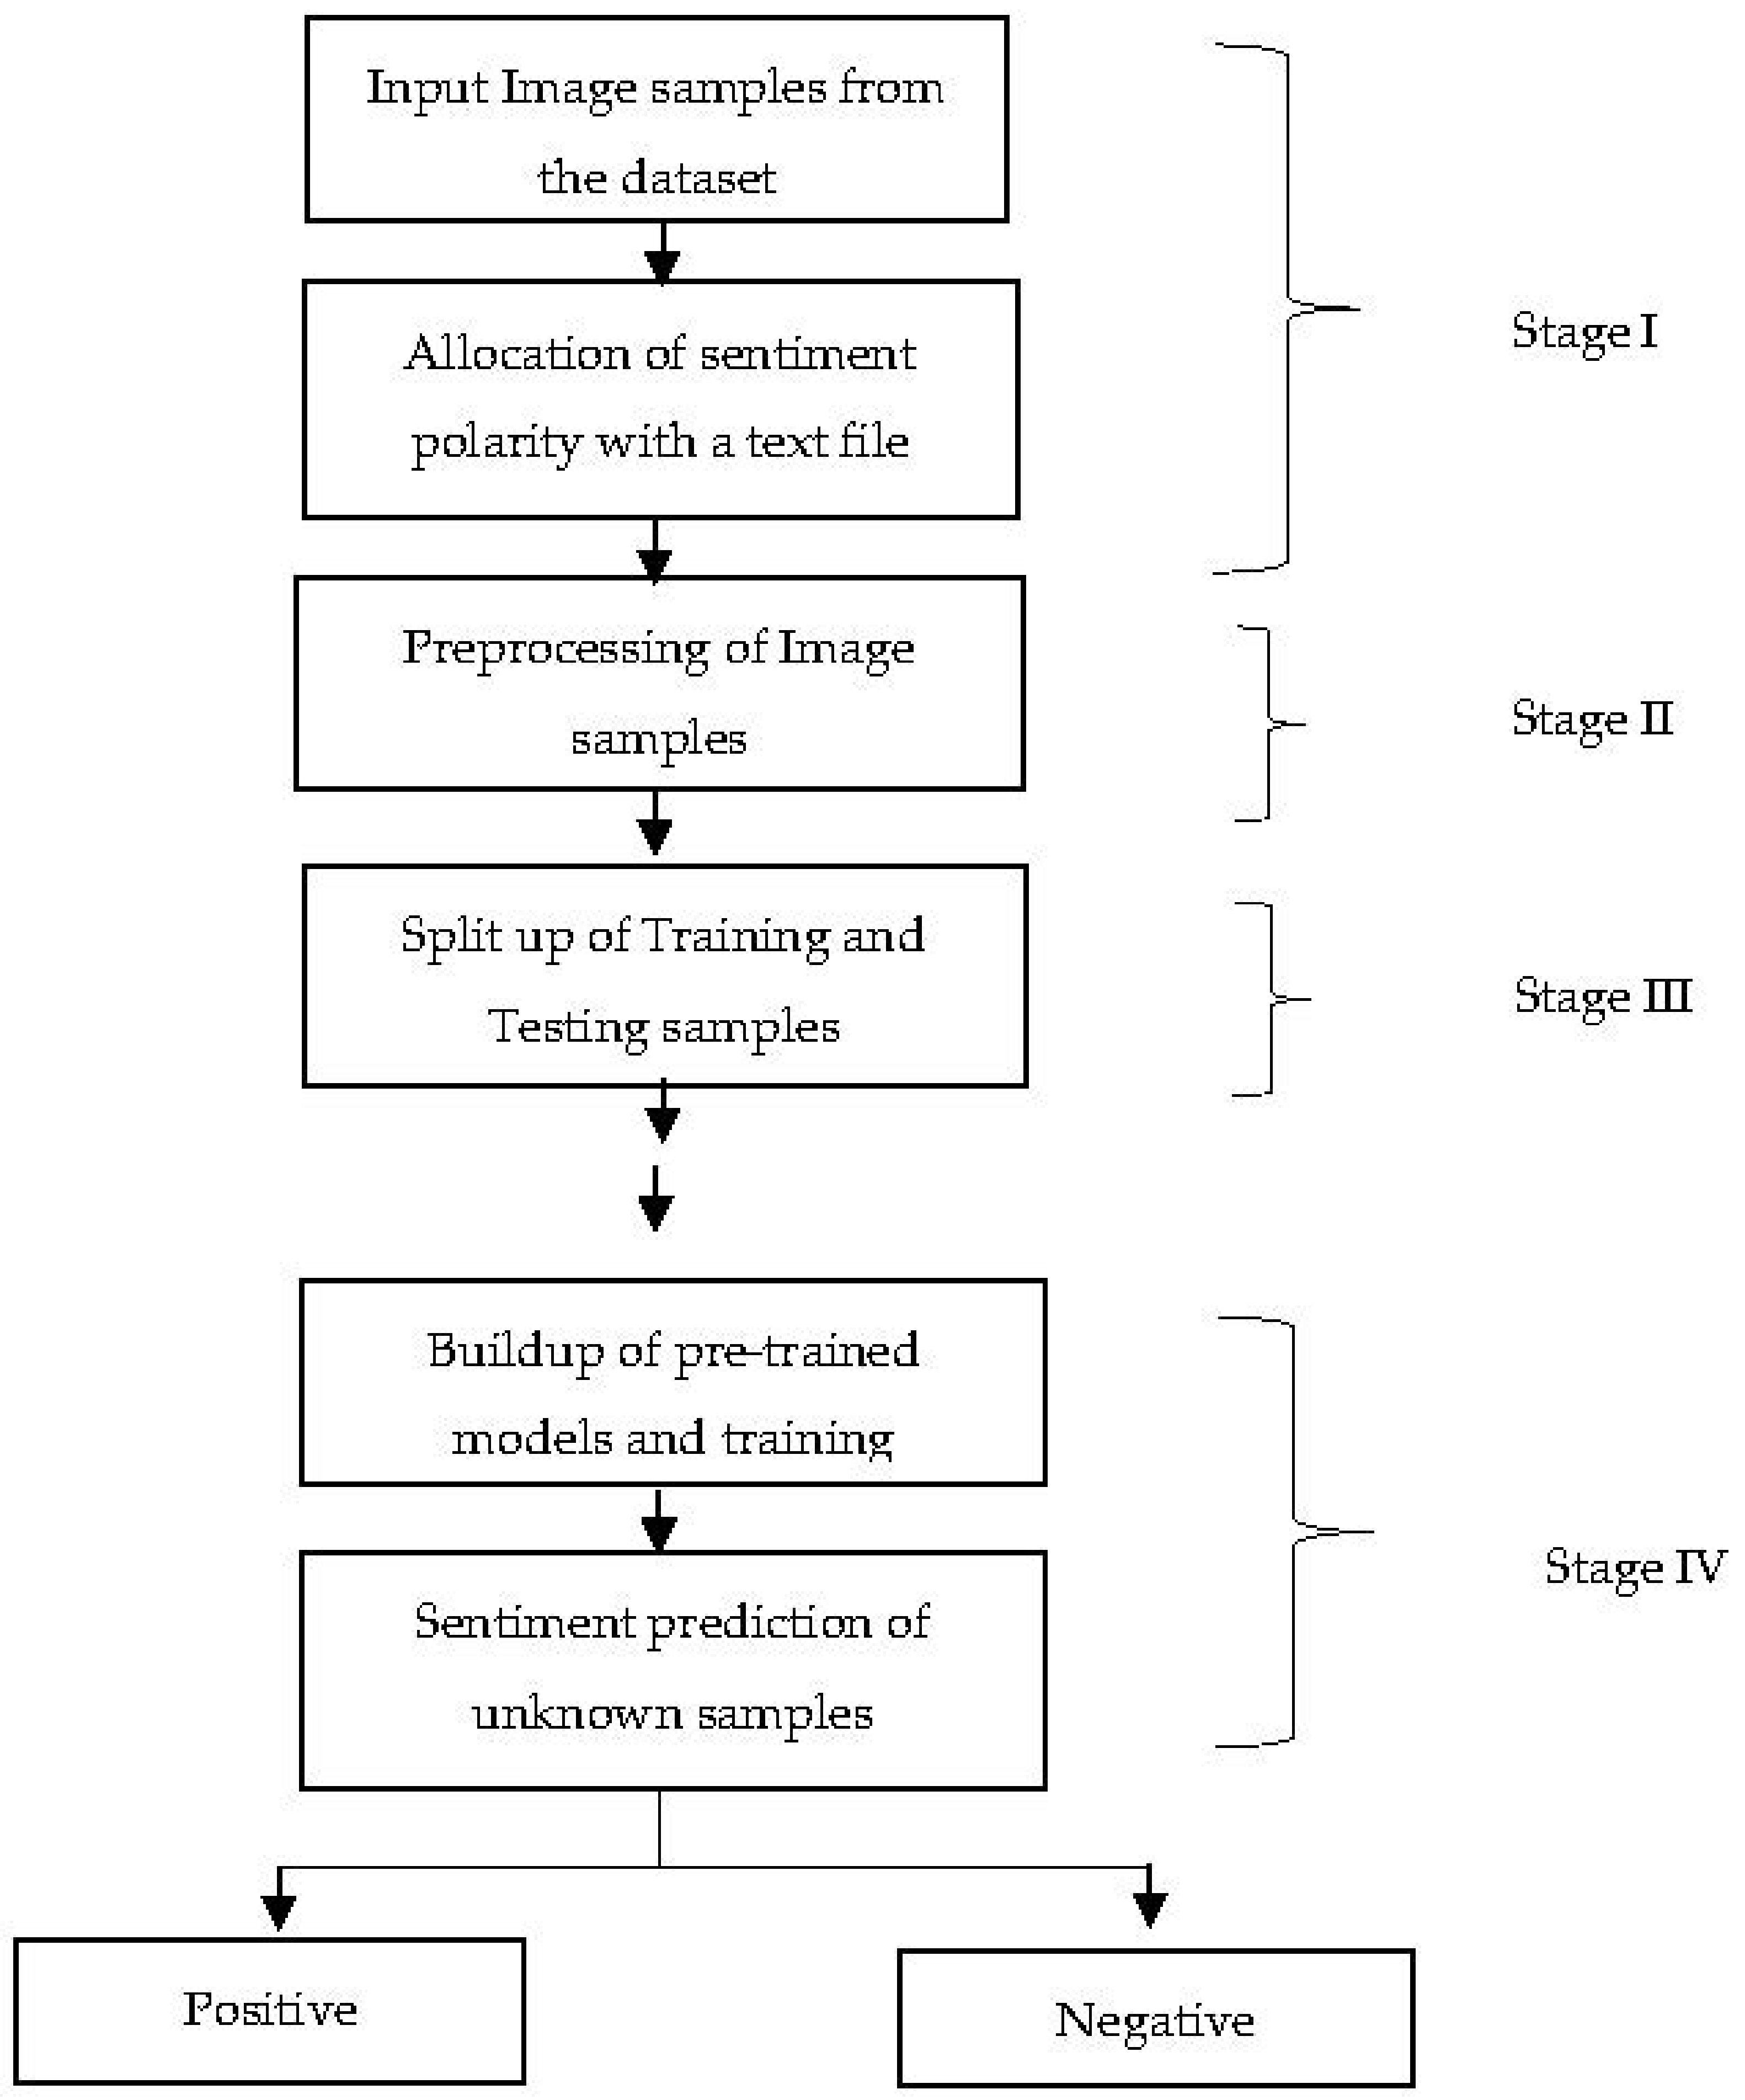
3. The Proposed Work—Block Diagram
4. Methodology
4.1. Transfer Learning
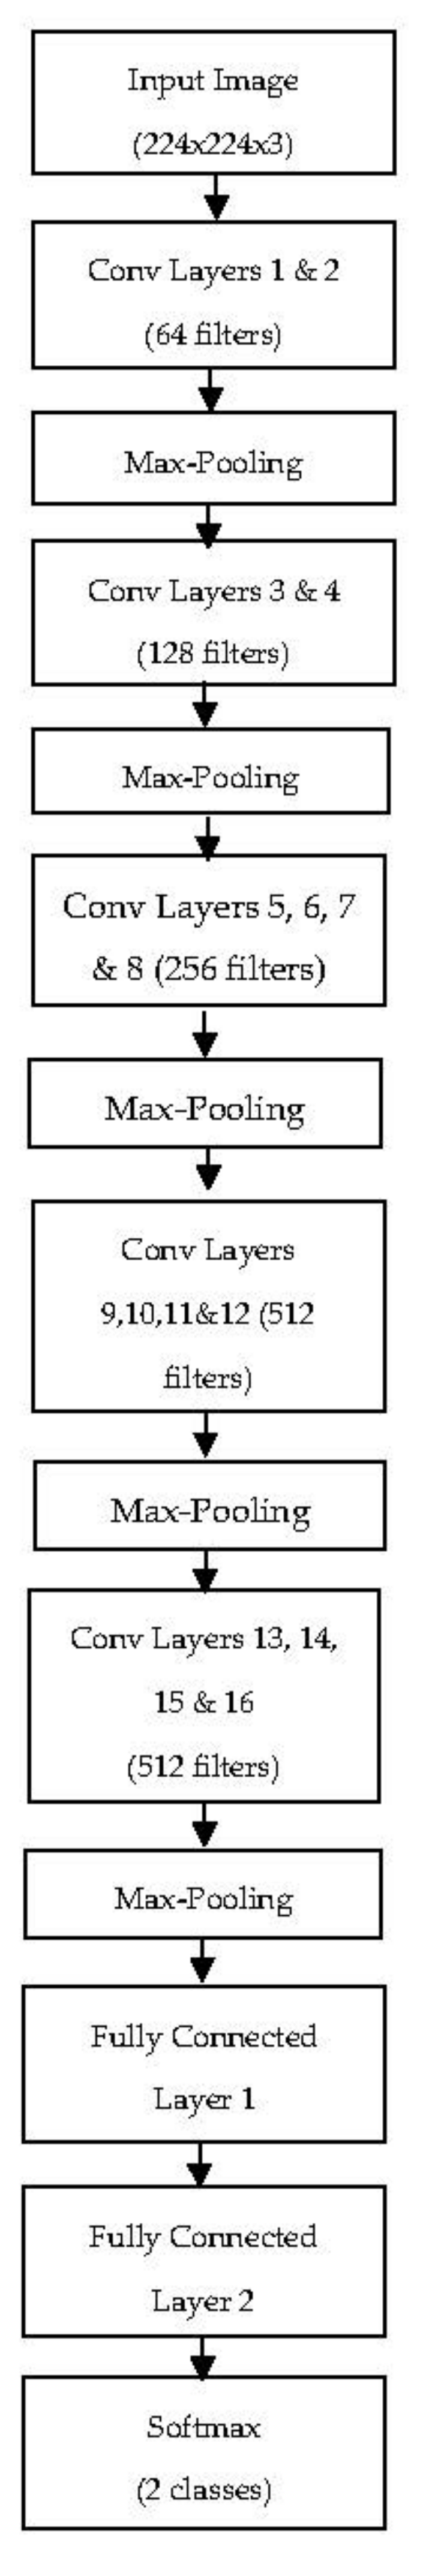
4.2. VGG-19 Architecture
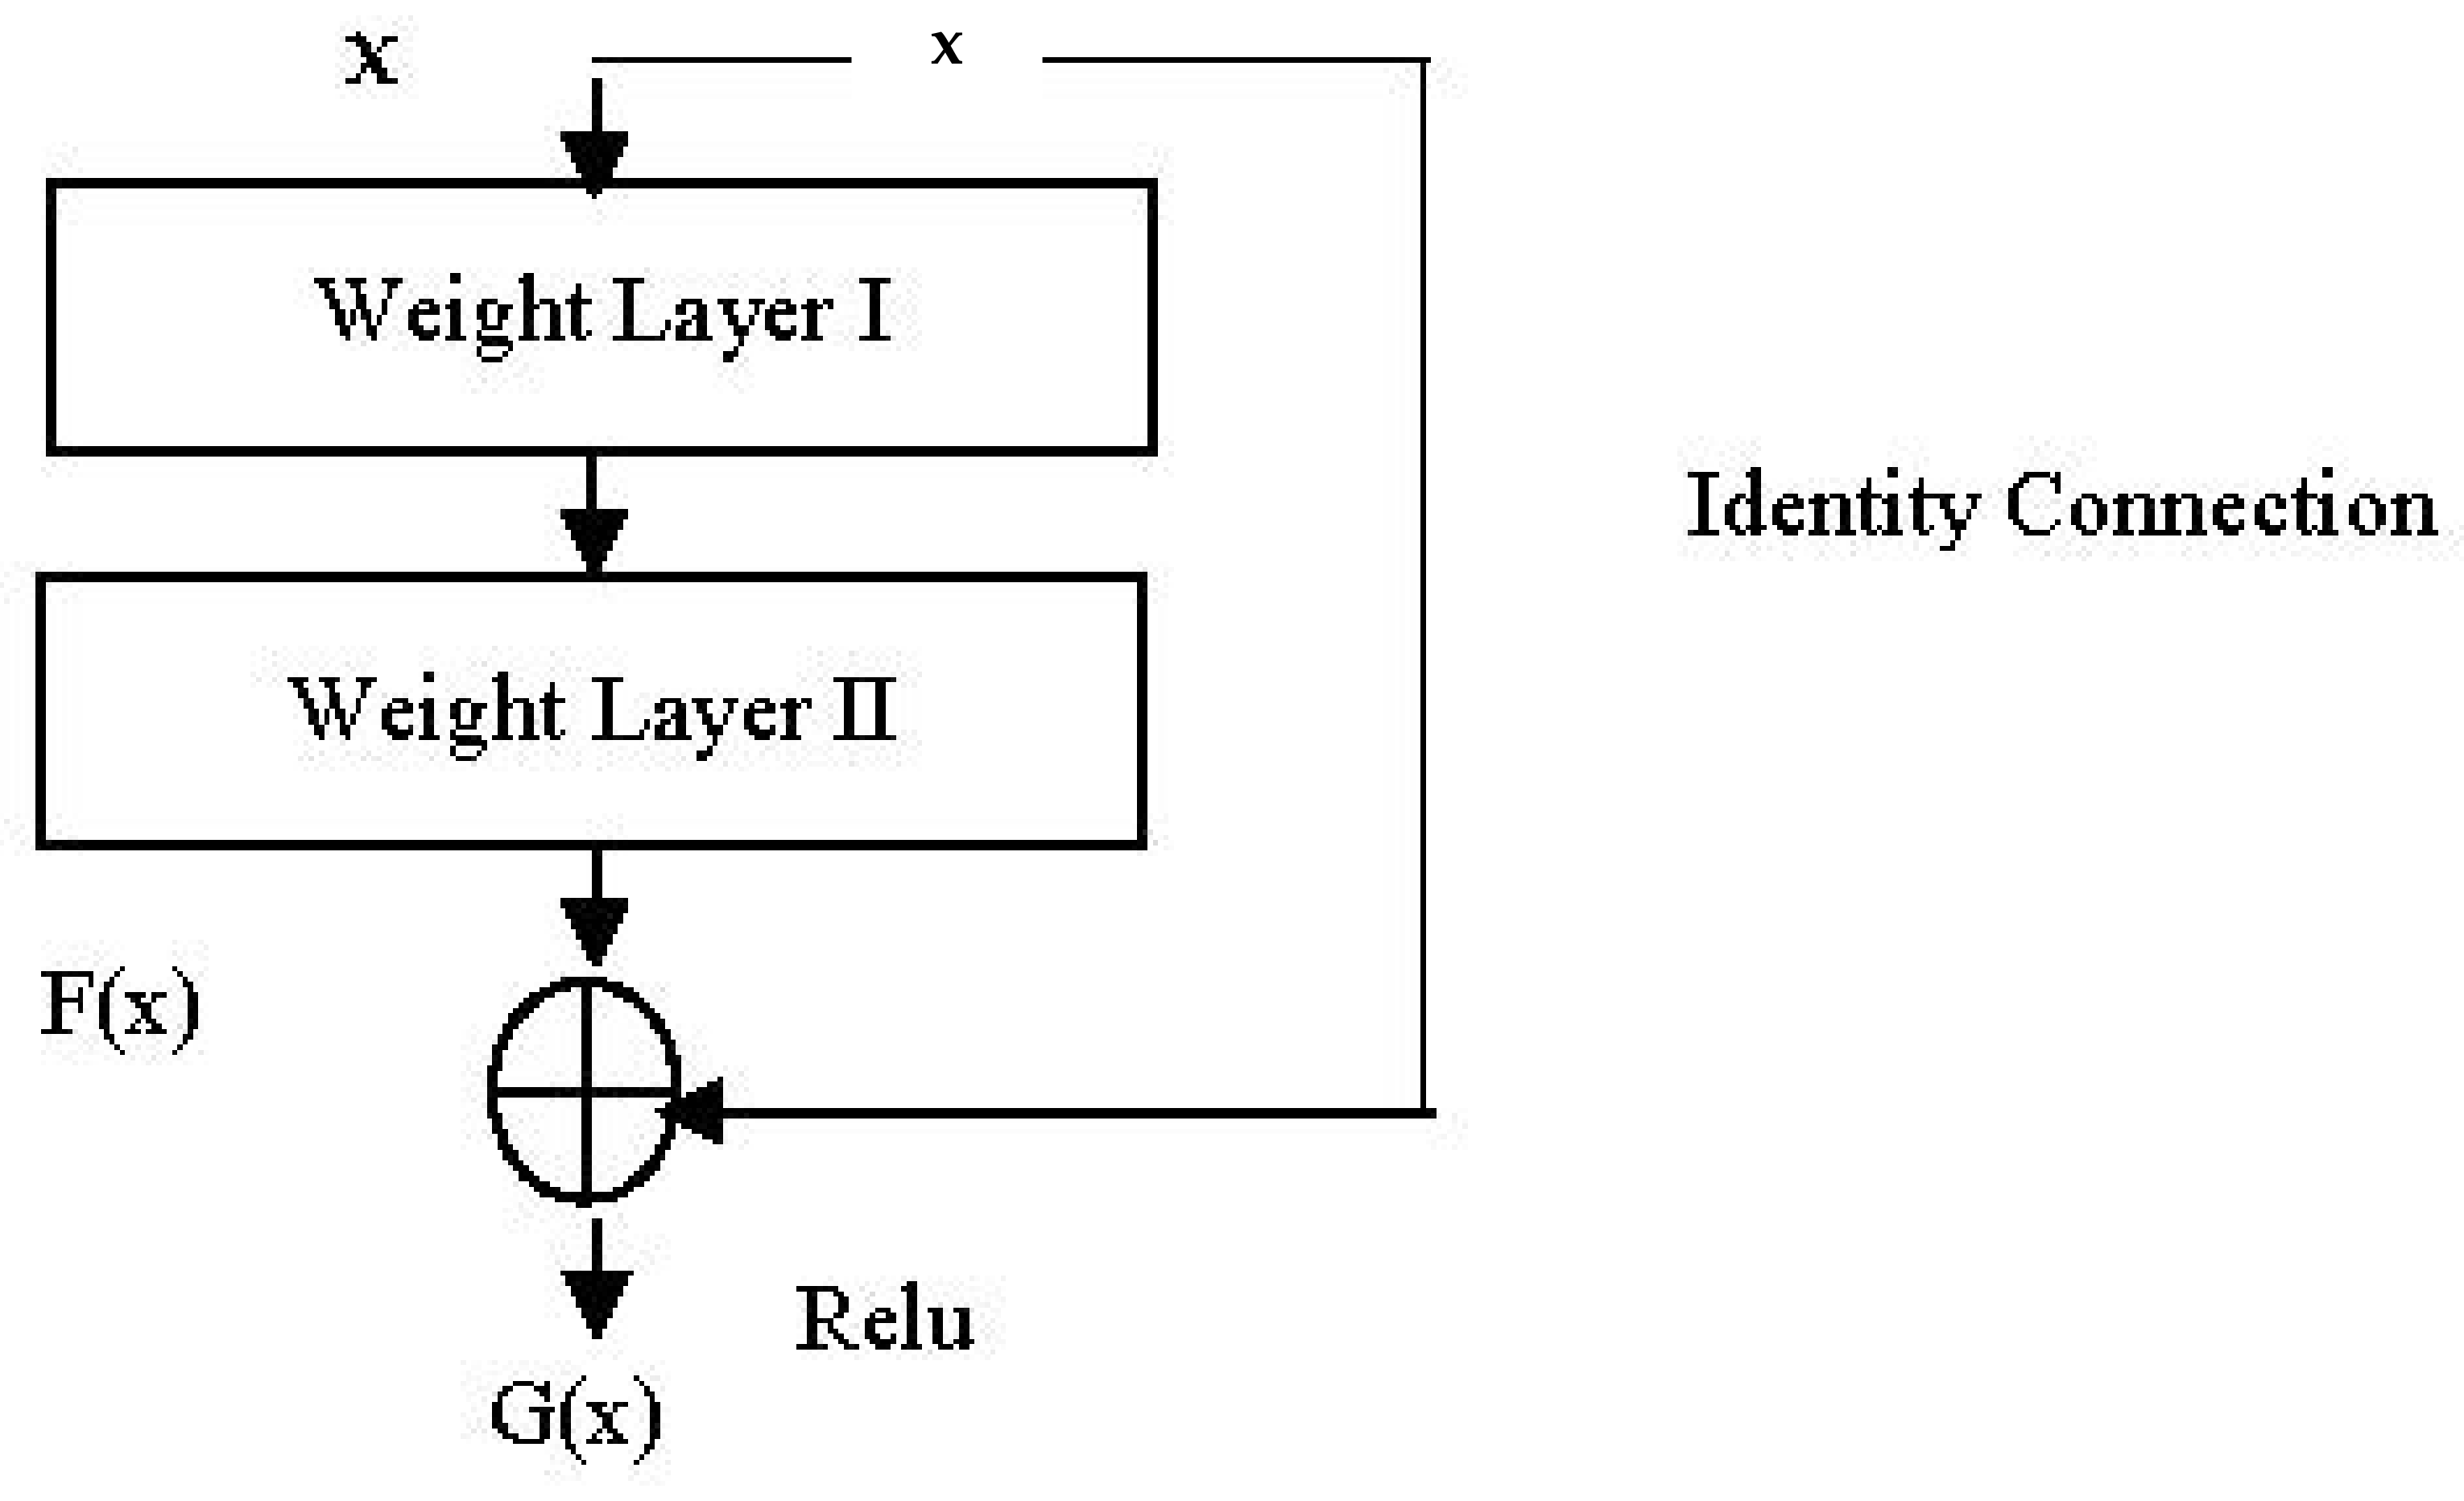
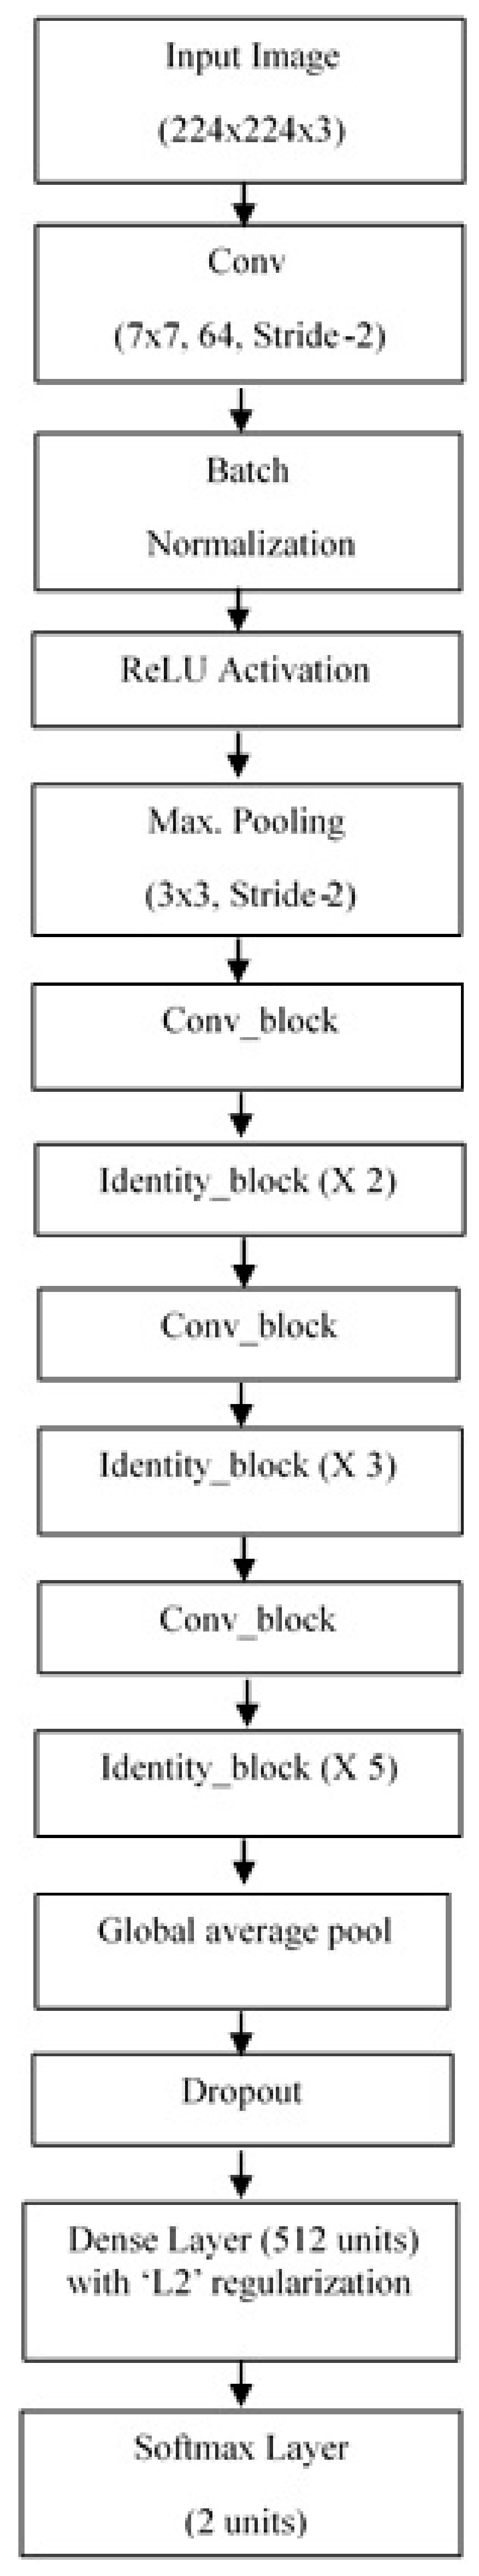
4.3. ResNet50V2 Architecture
Concept of Residual Network
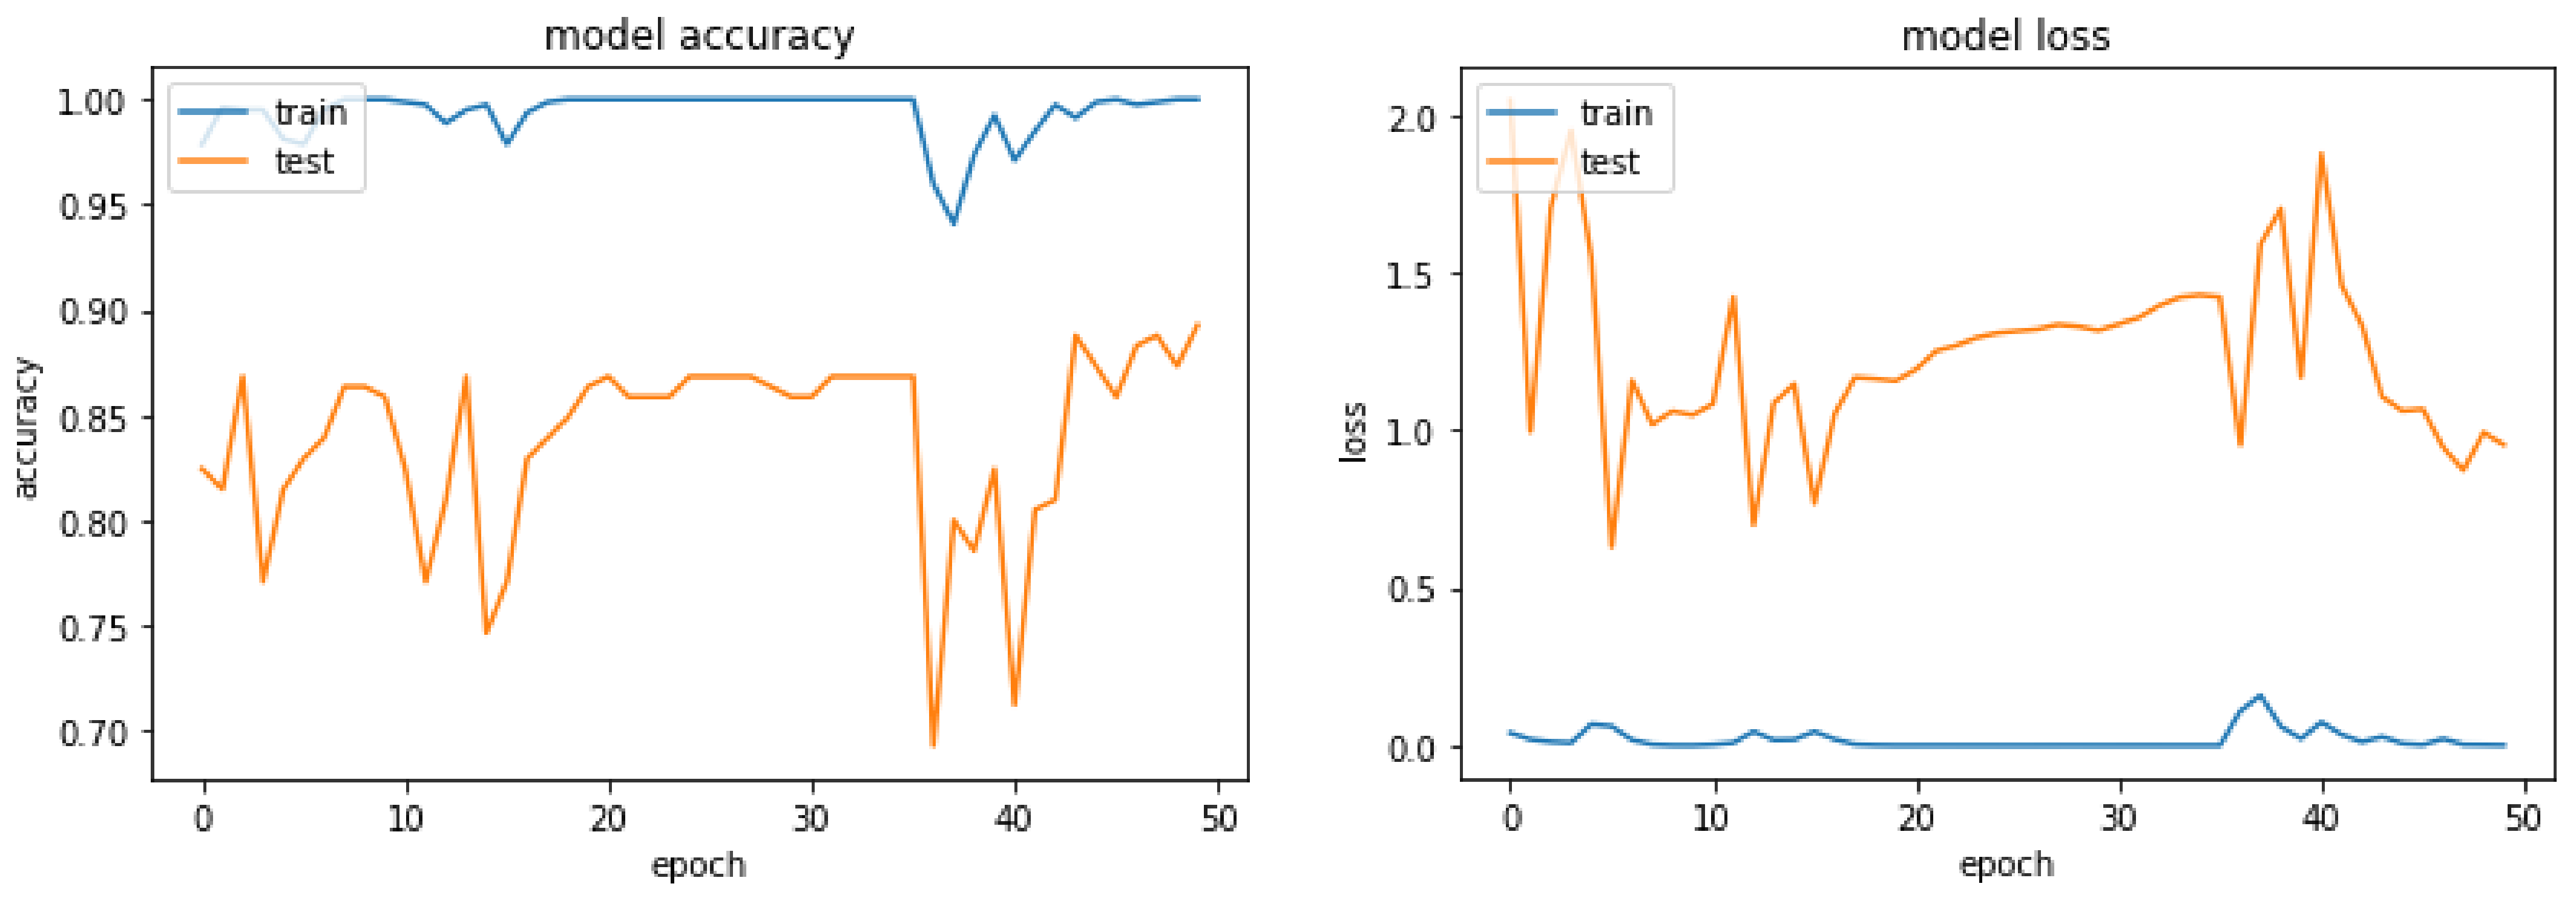
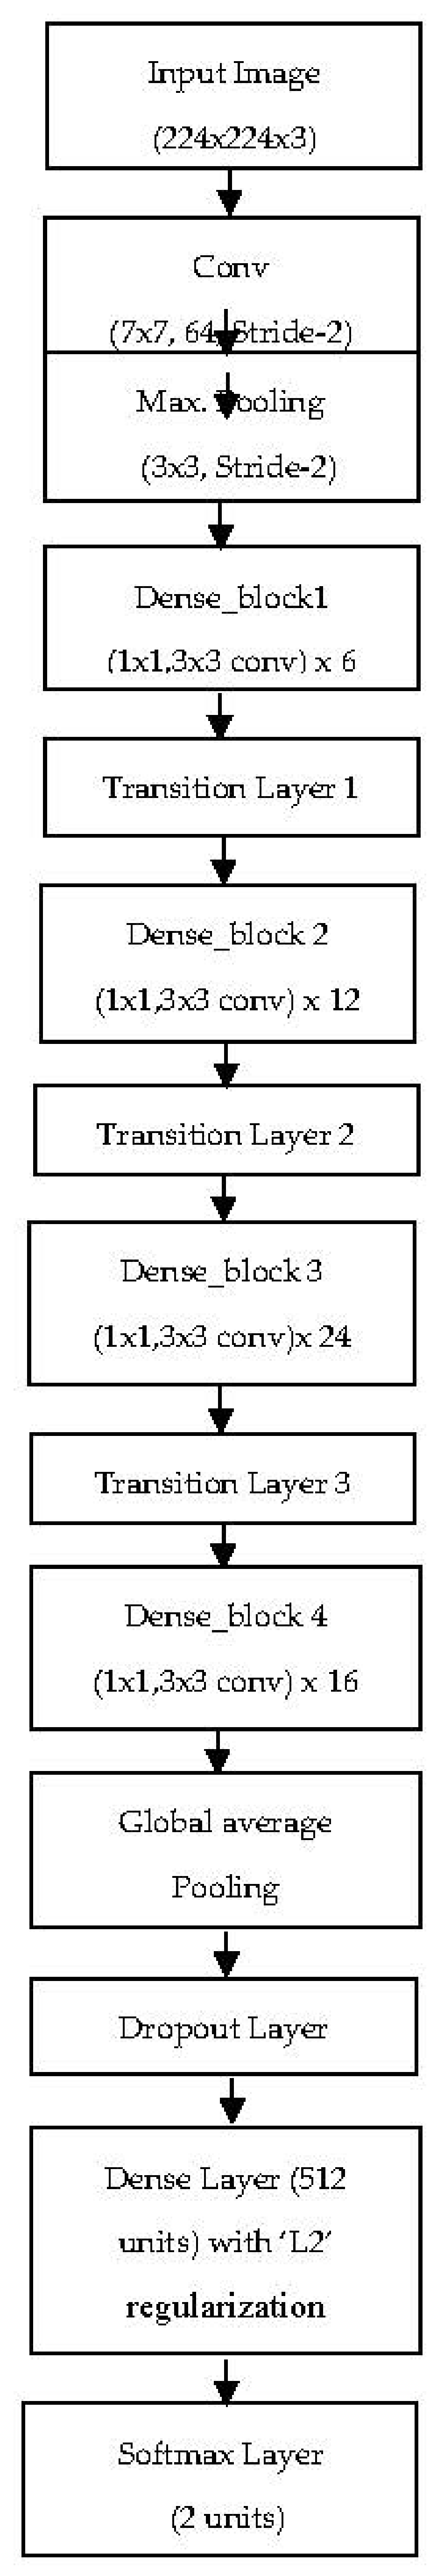
4.4. DenseNet121 Architecture
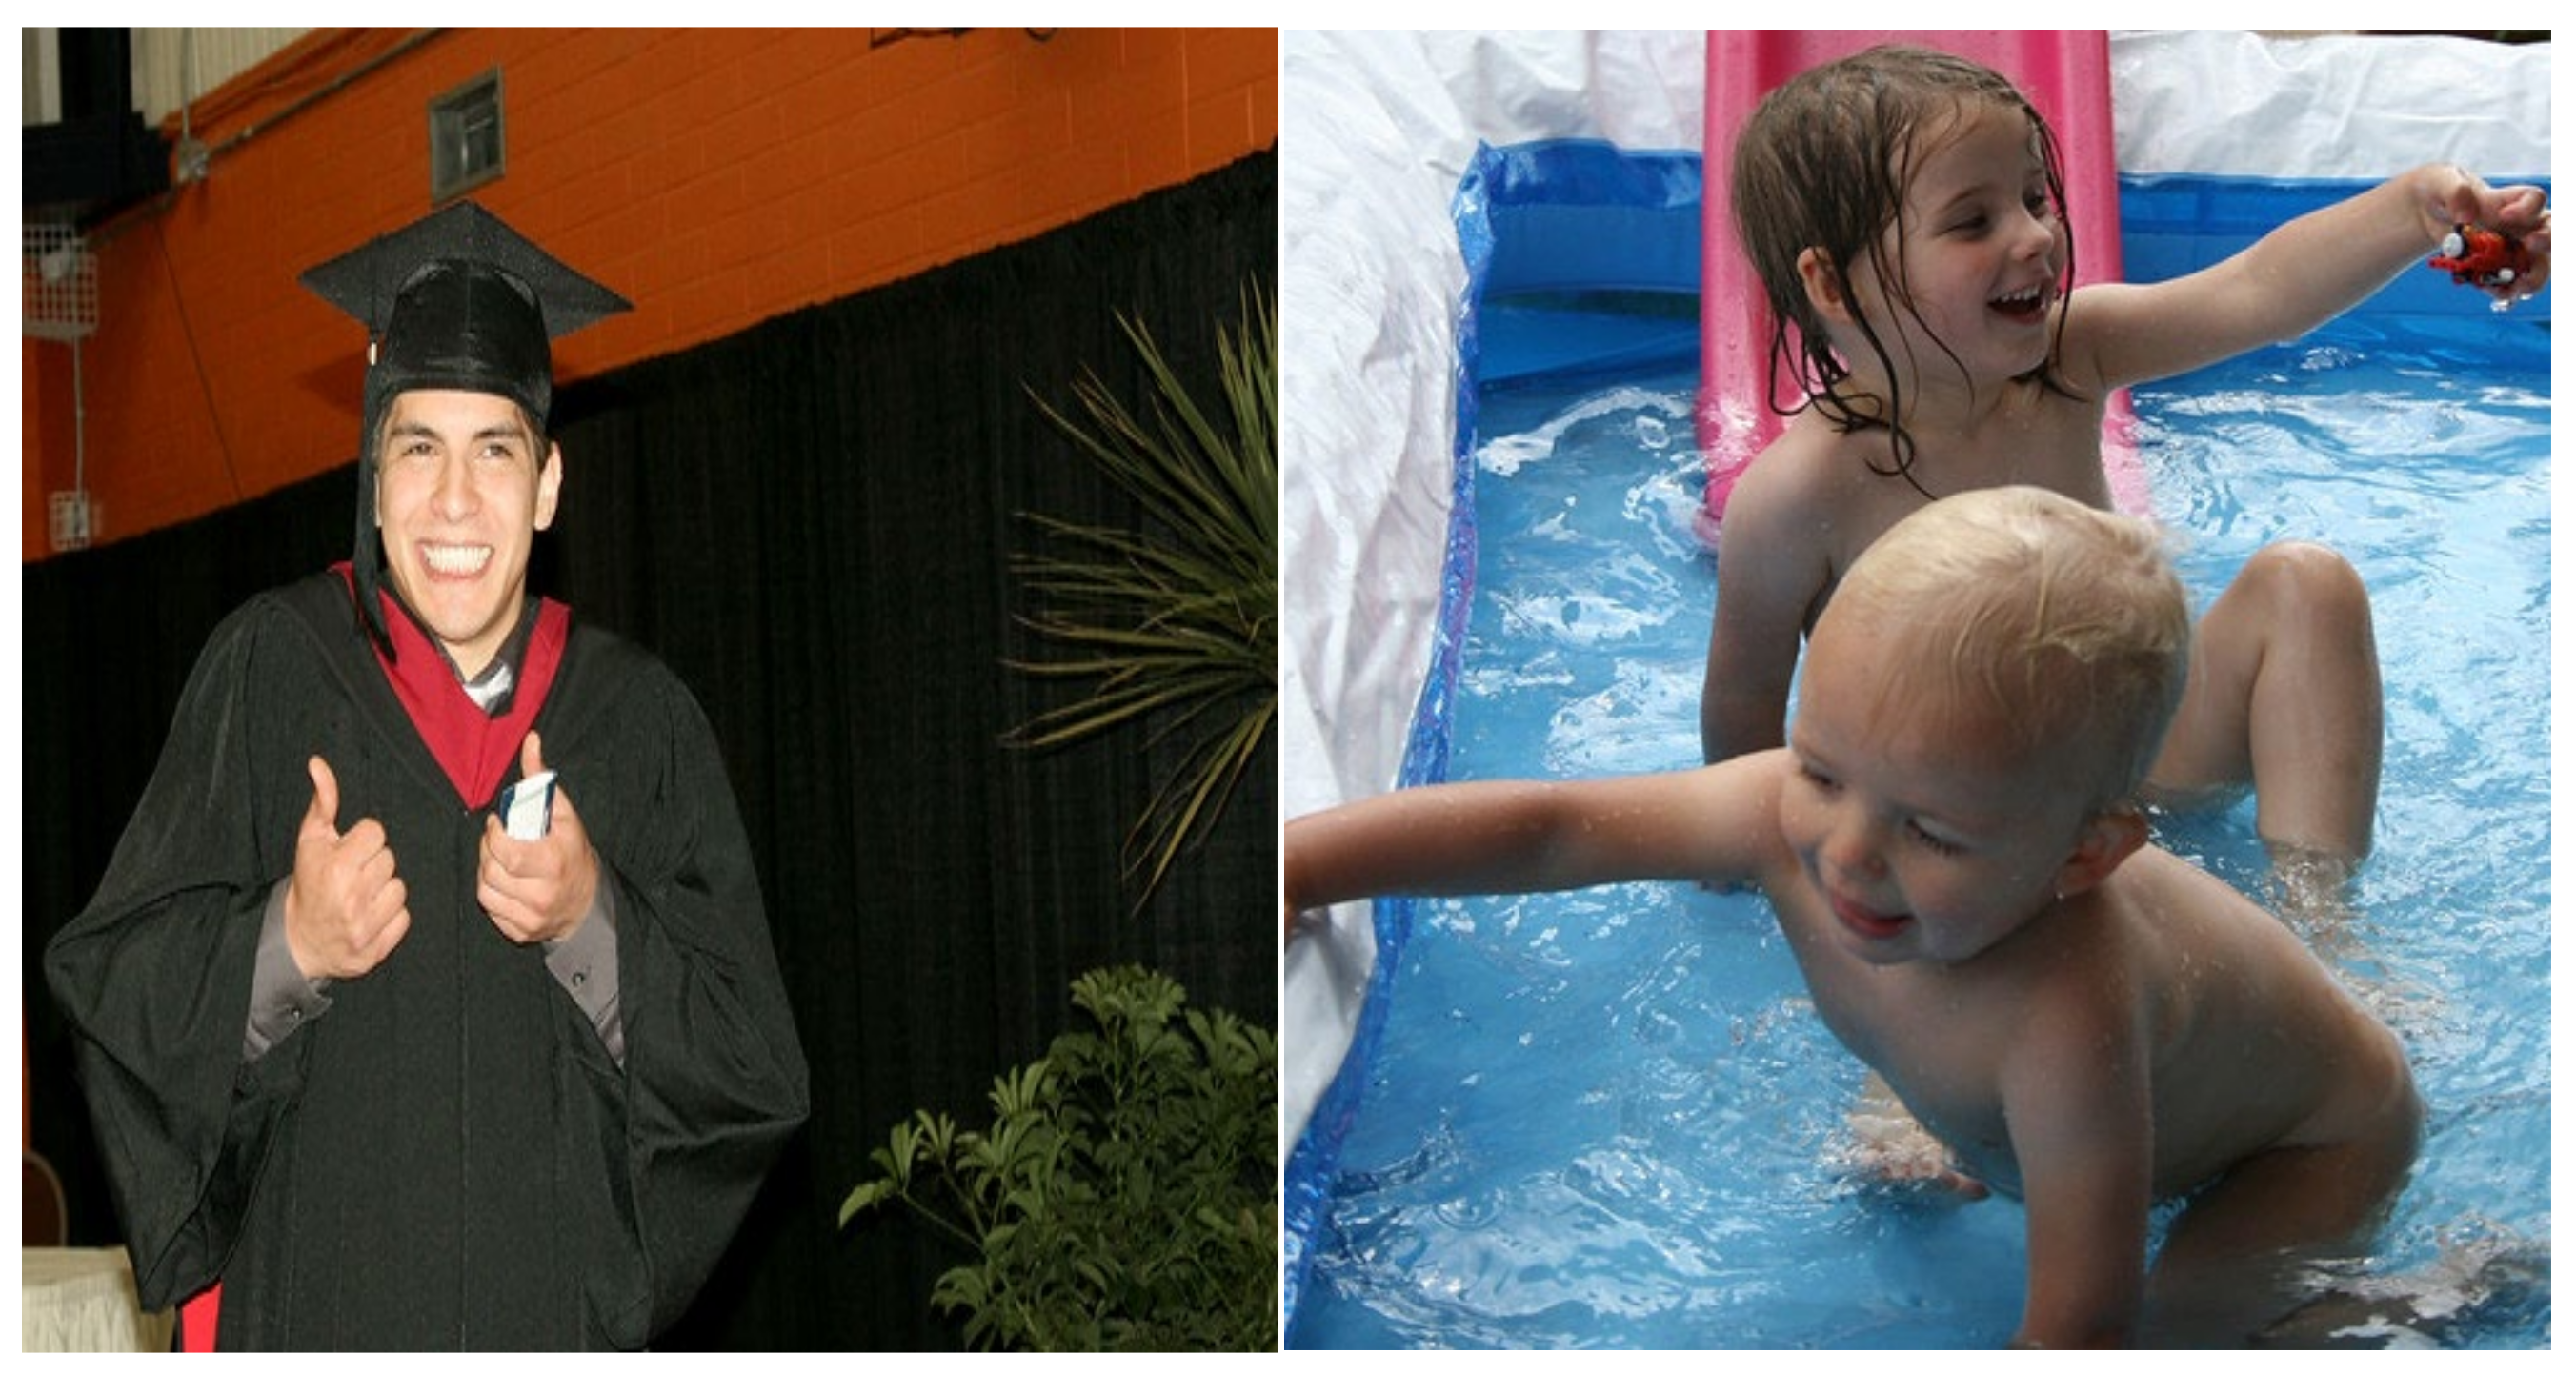
5. Dataset
6. Experimental Results and Discussion
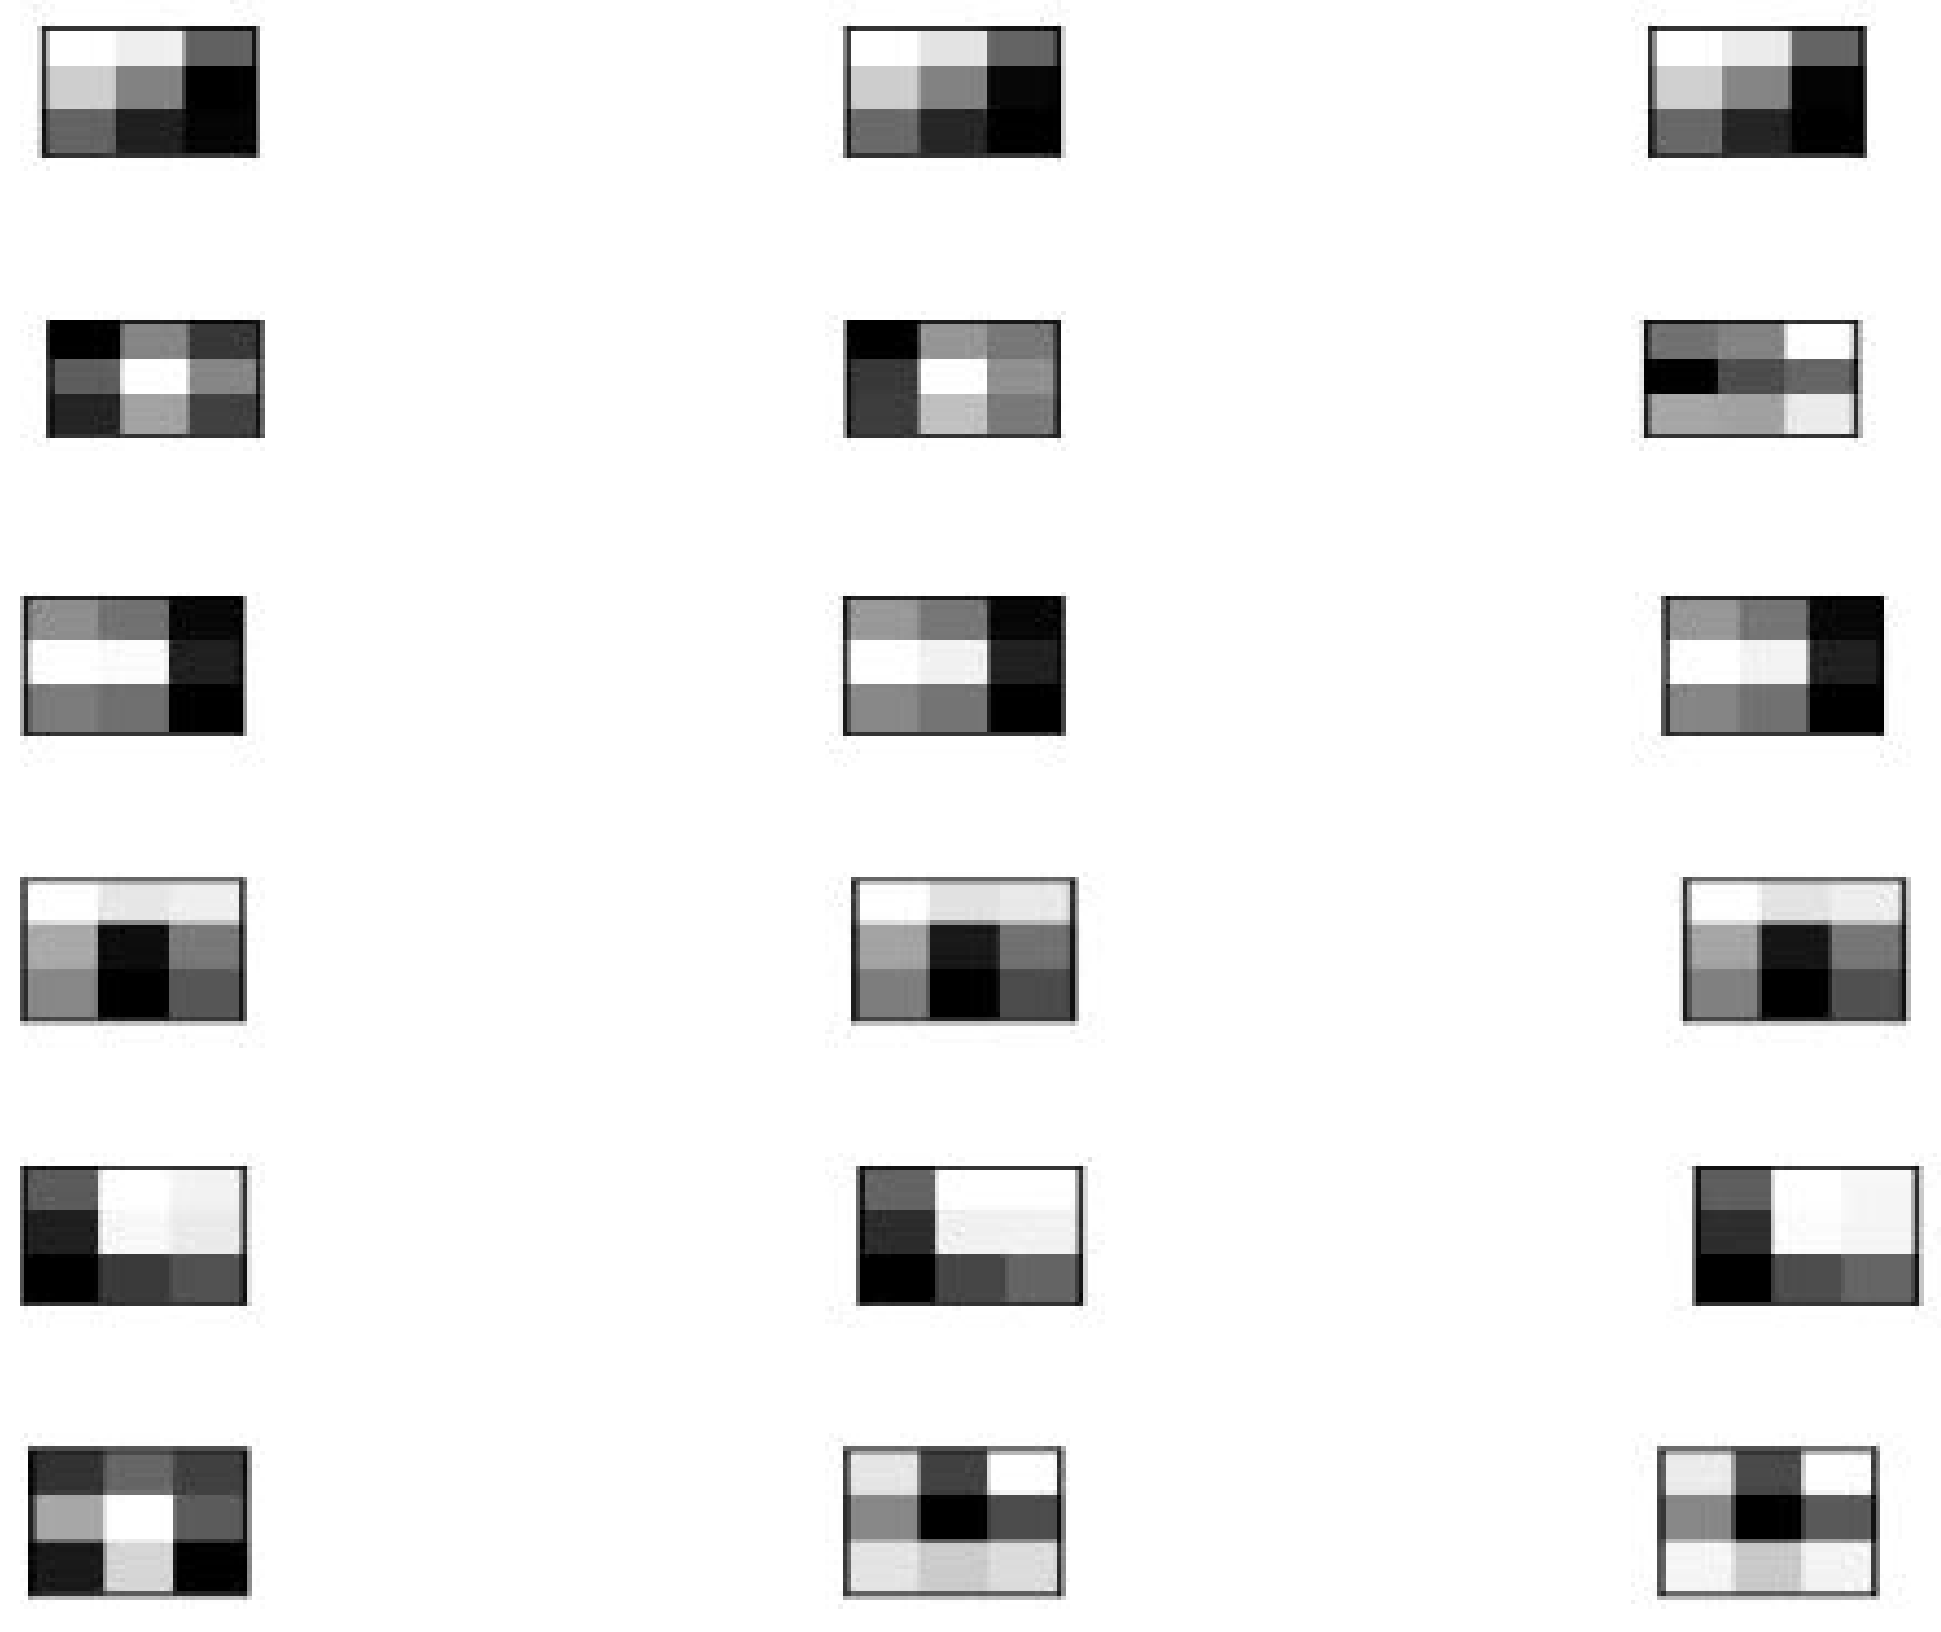
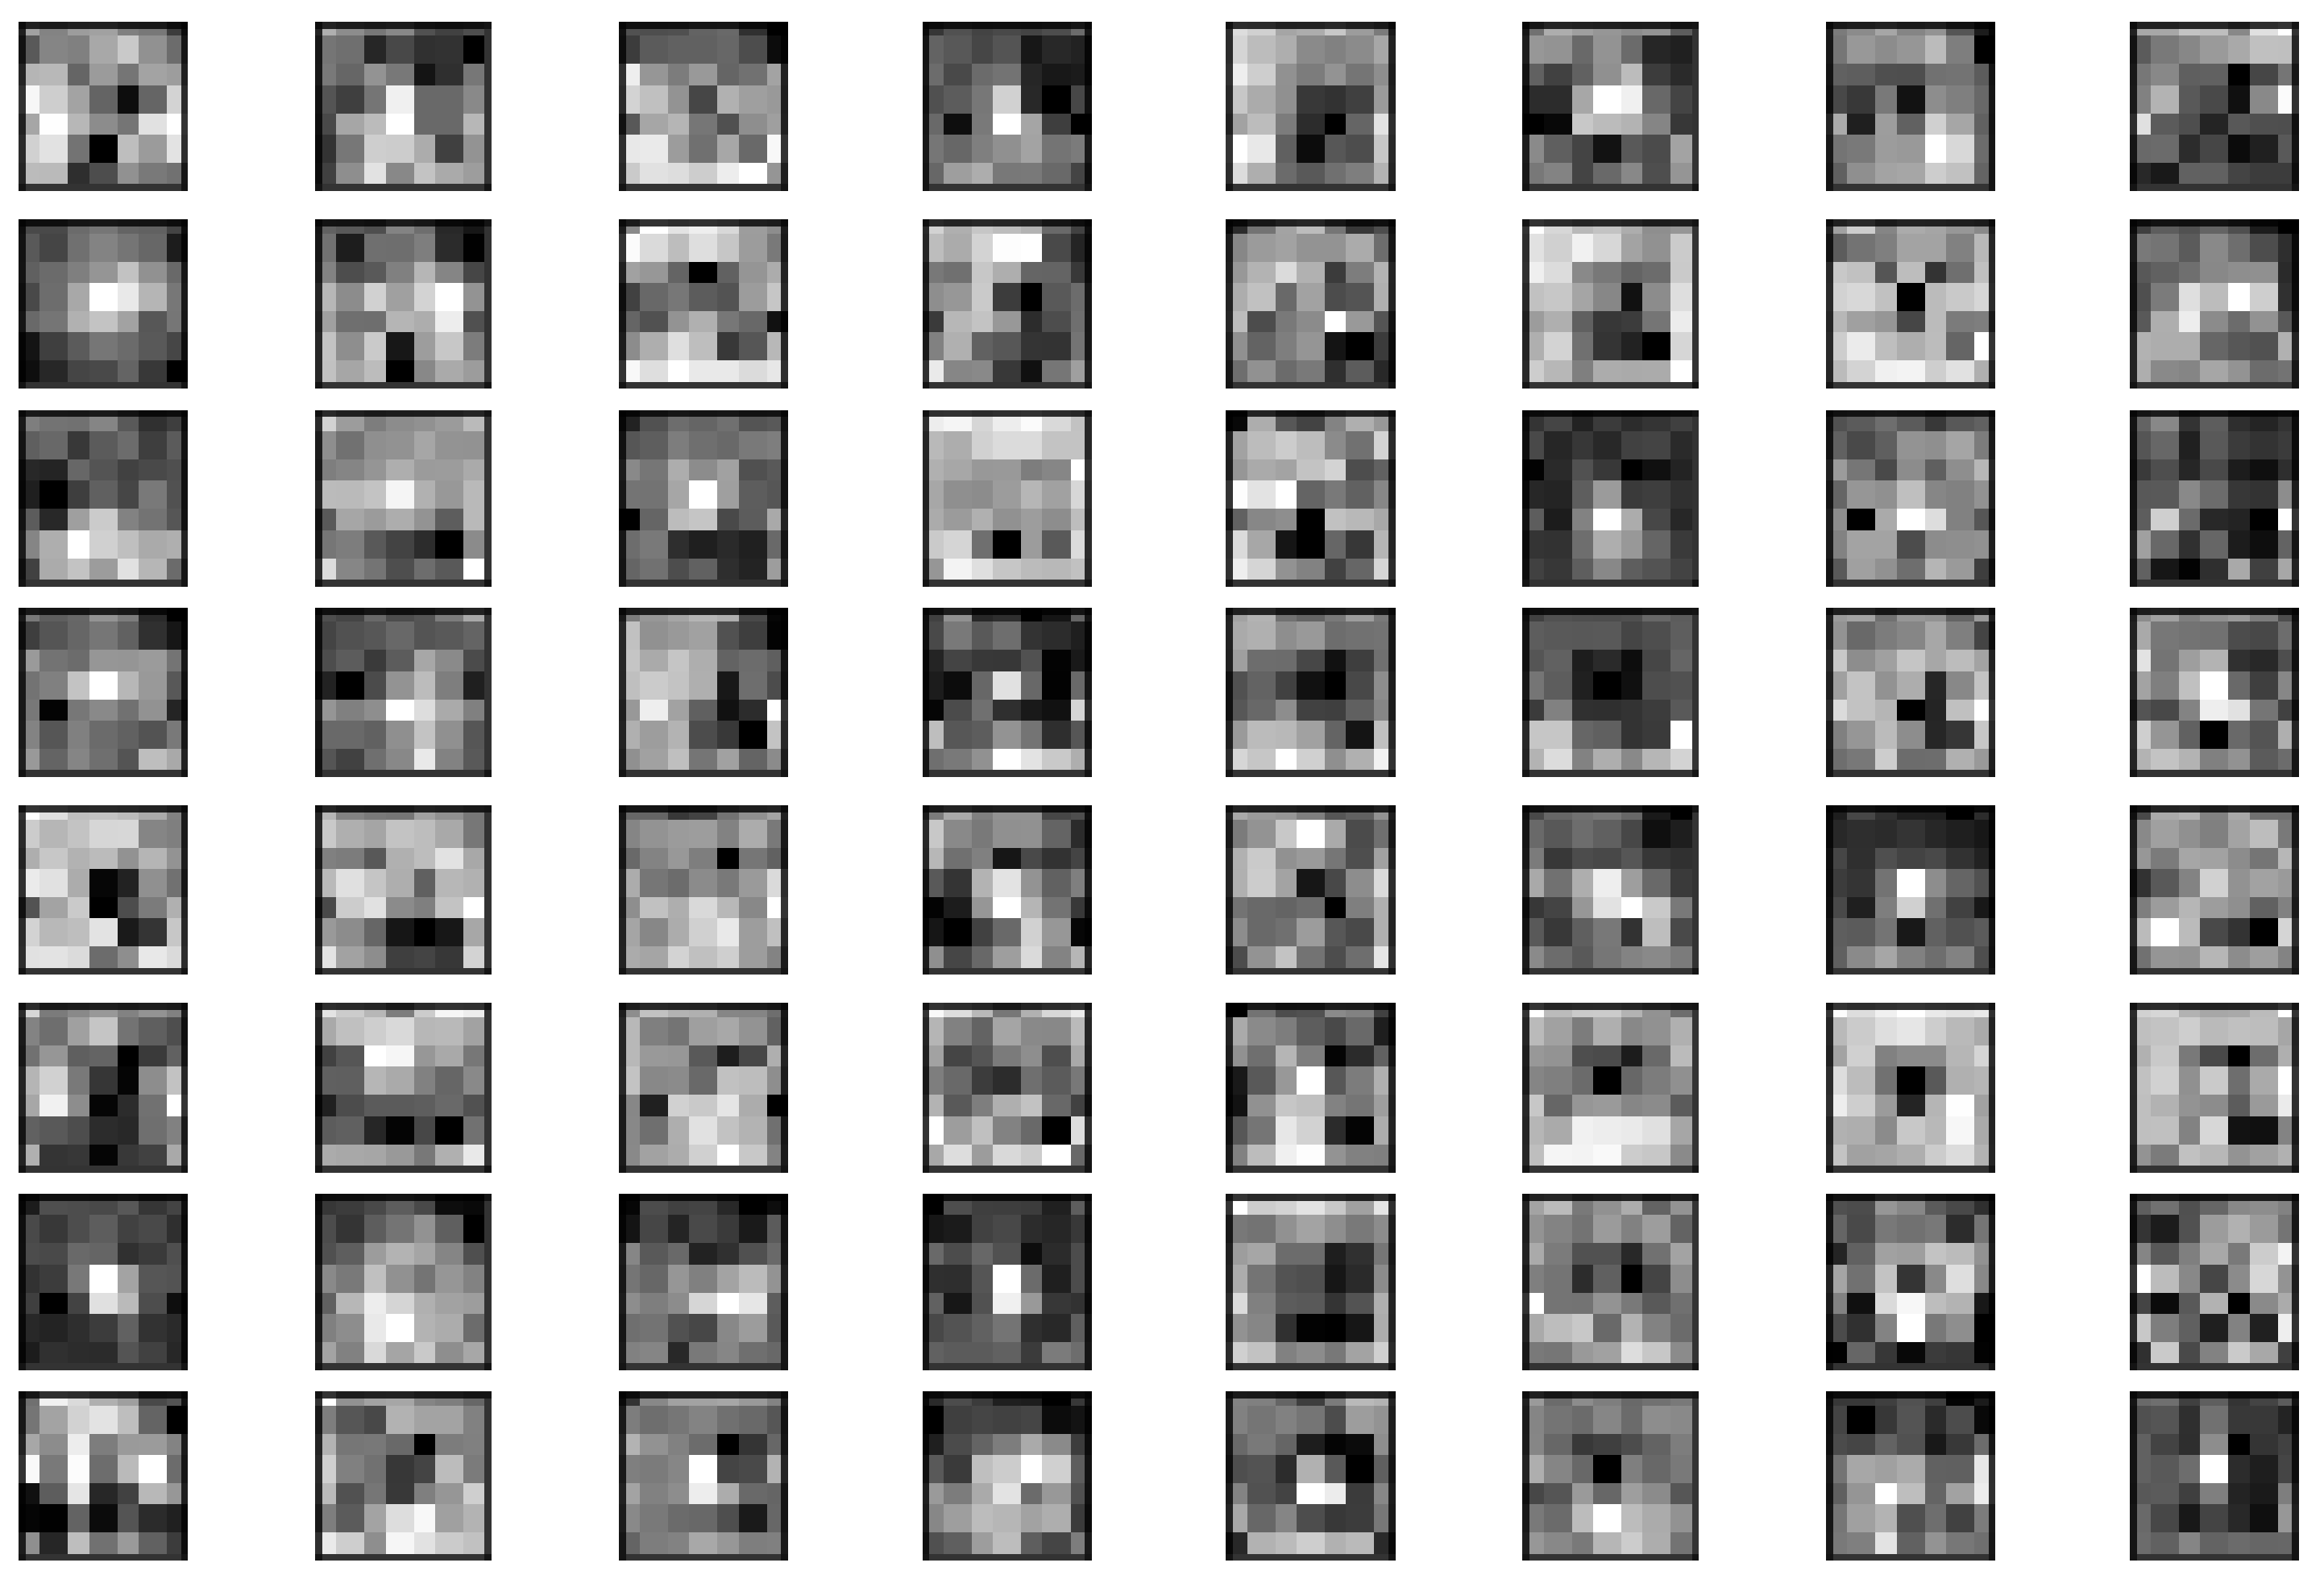
6.1. Visual Features from the First Convolutional Layer of VGG-19
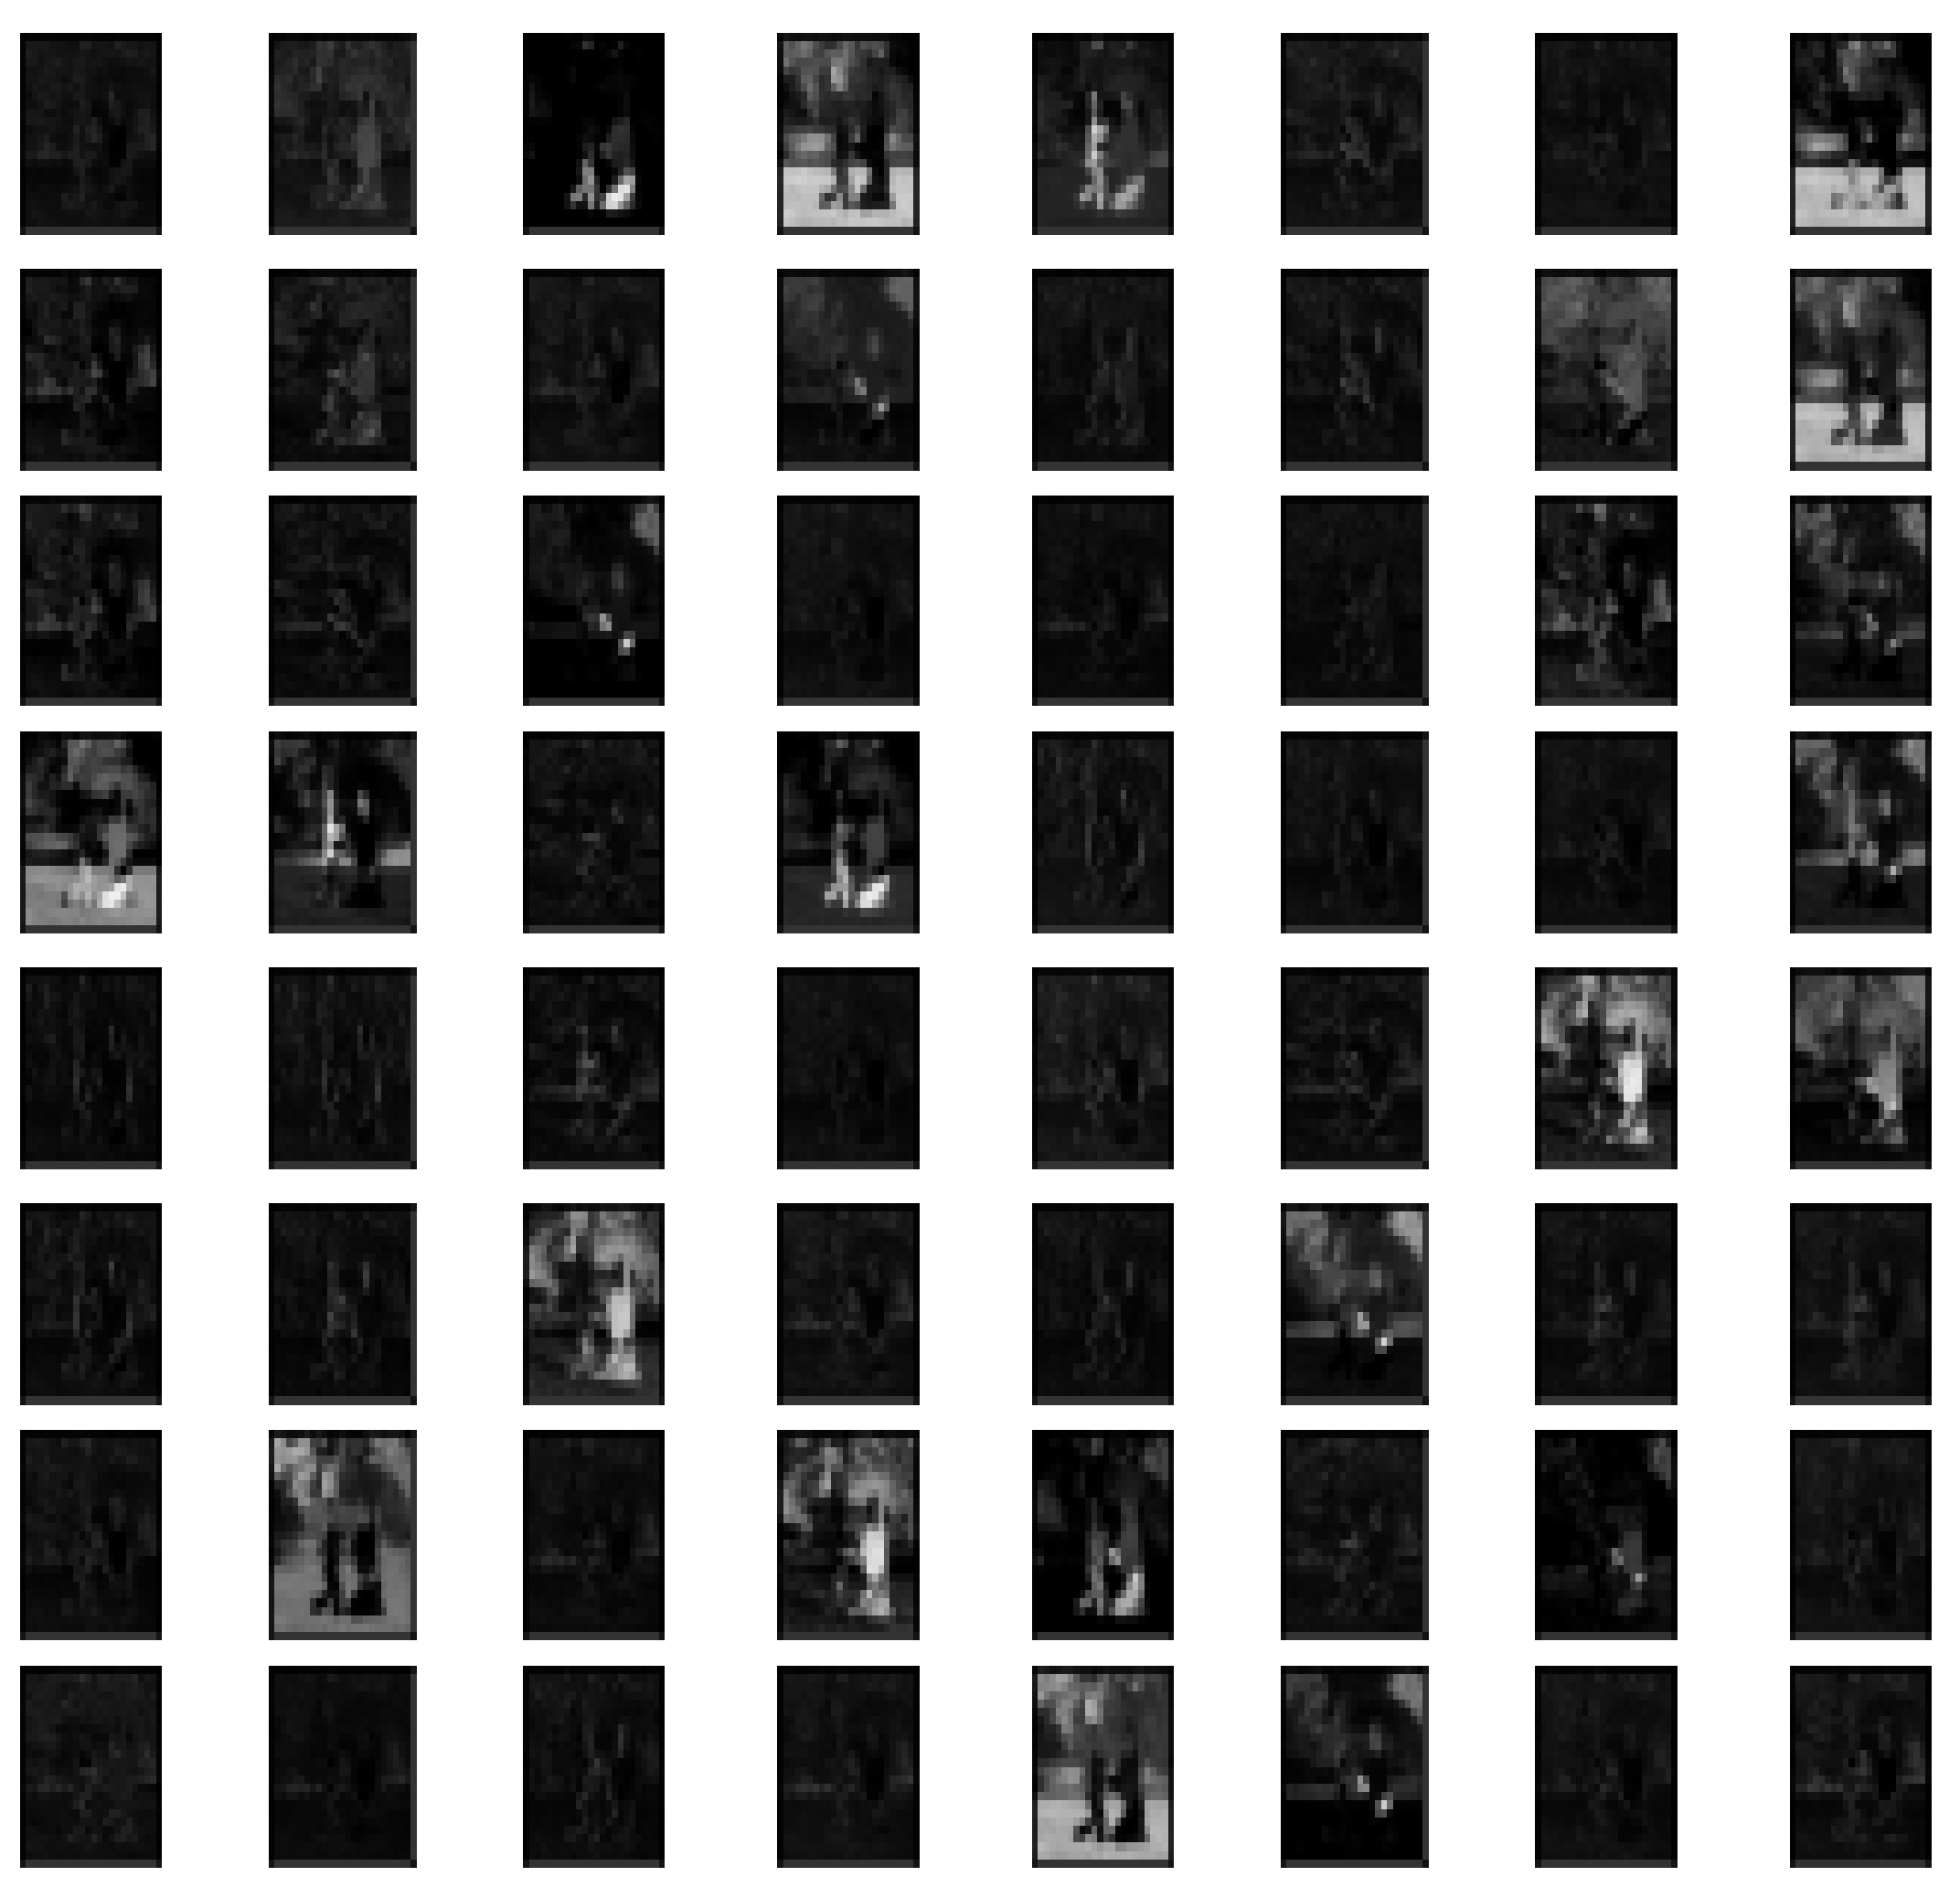
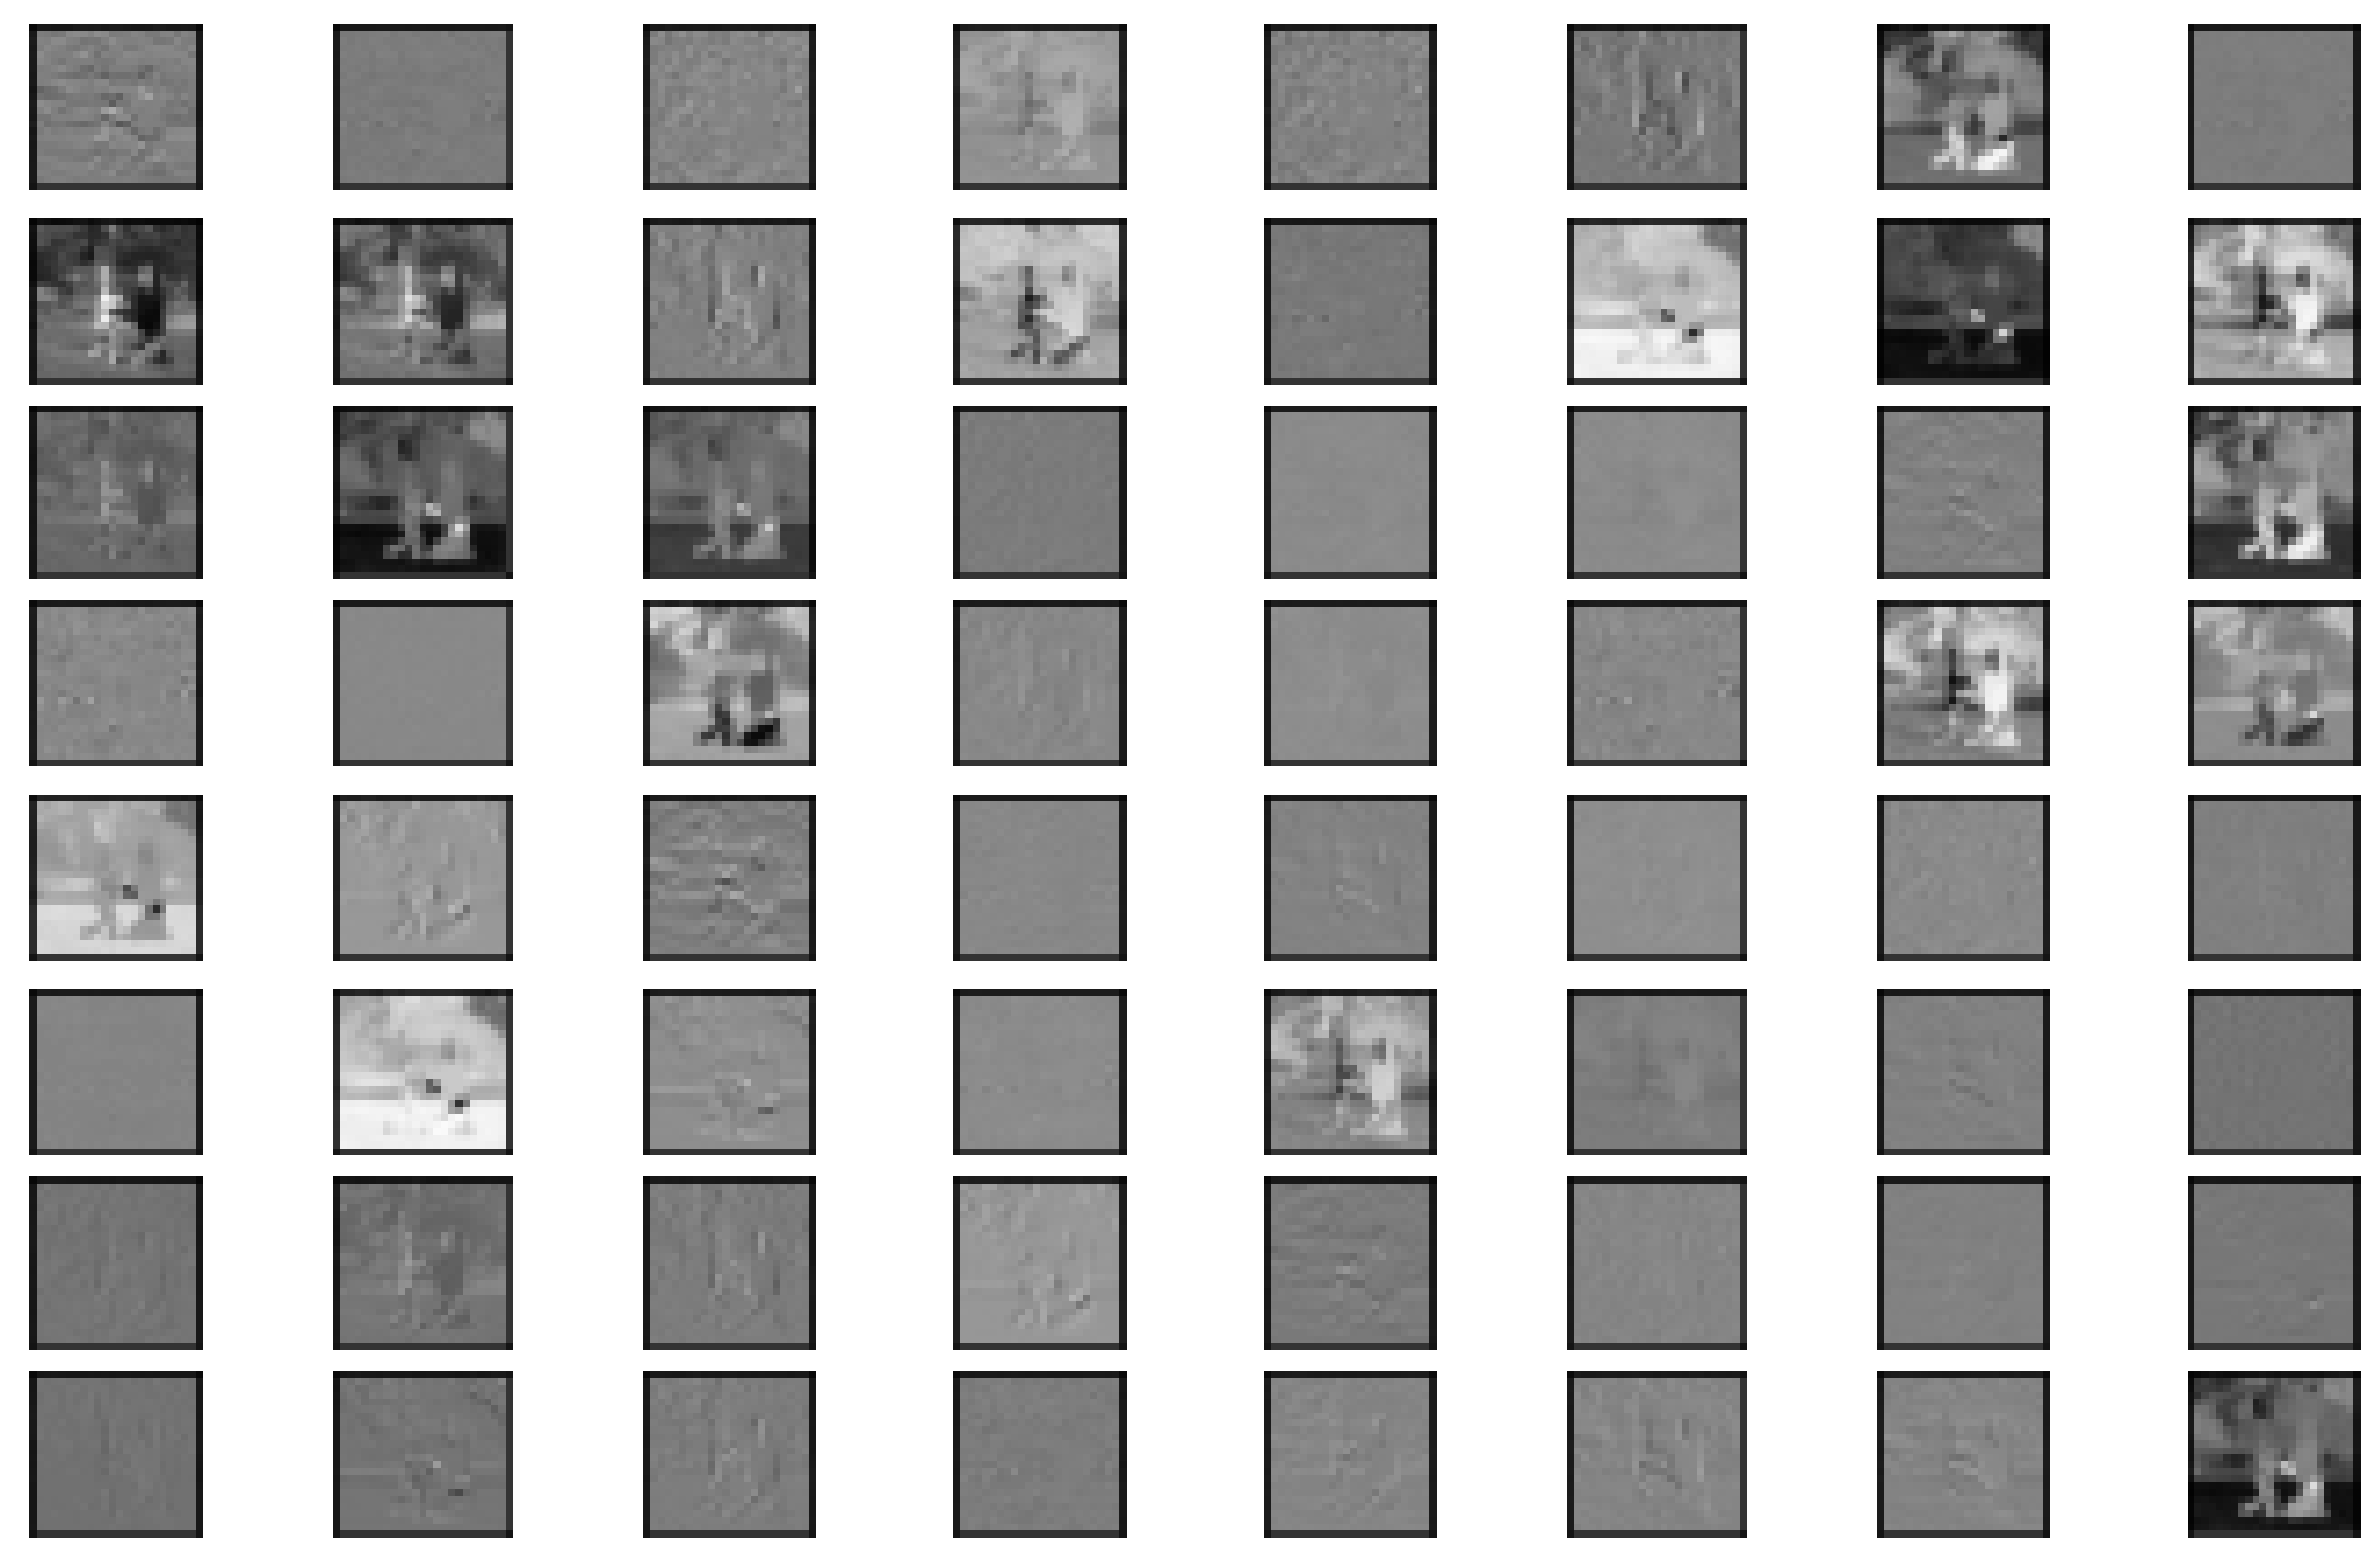
6.2. Feature Maps Extraction from VGG-19 Model
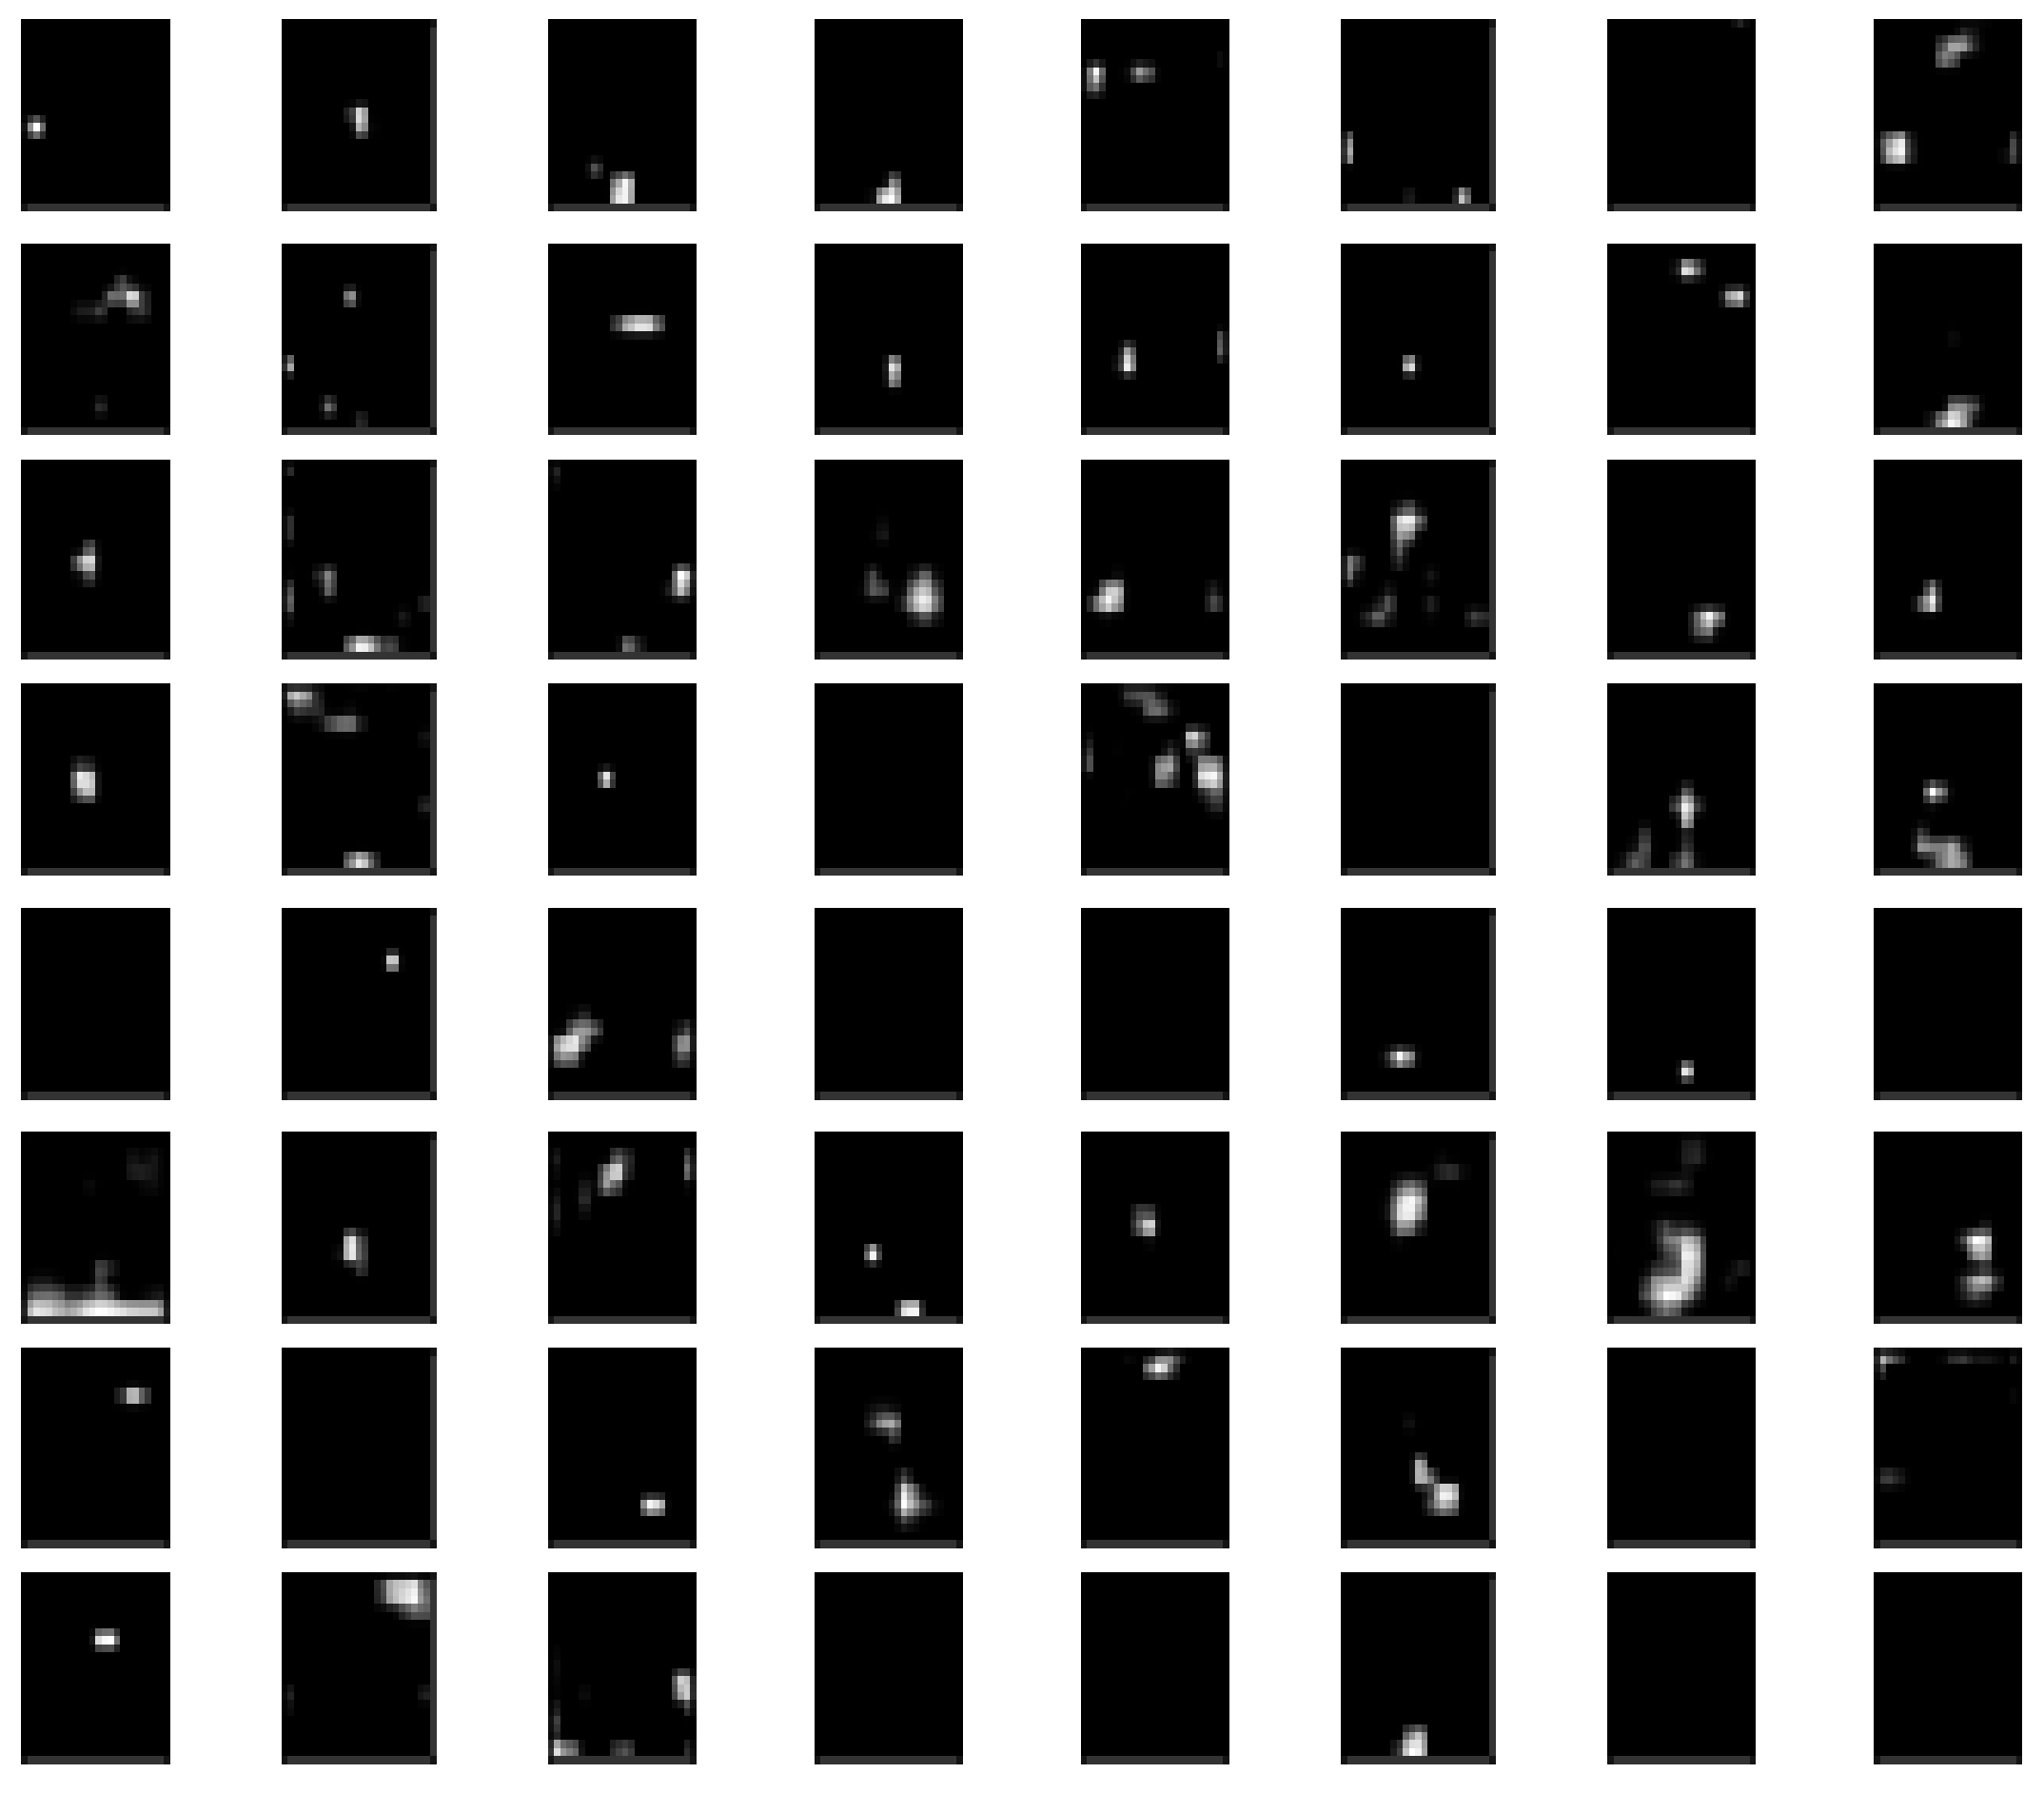
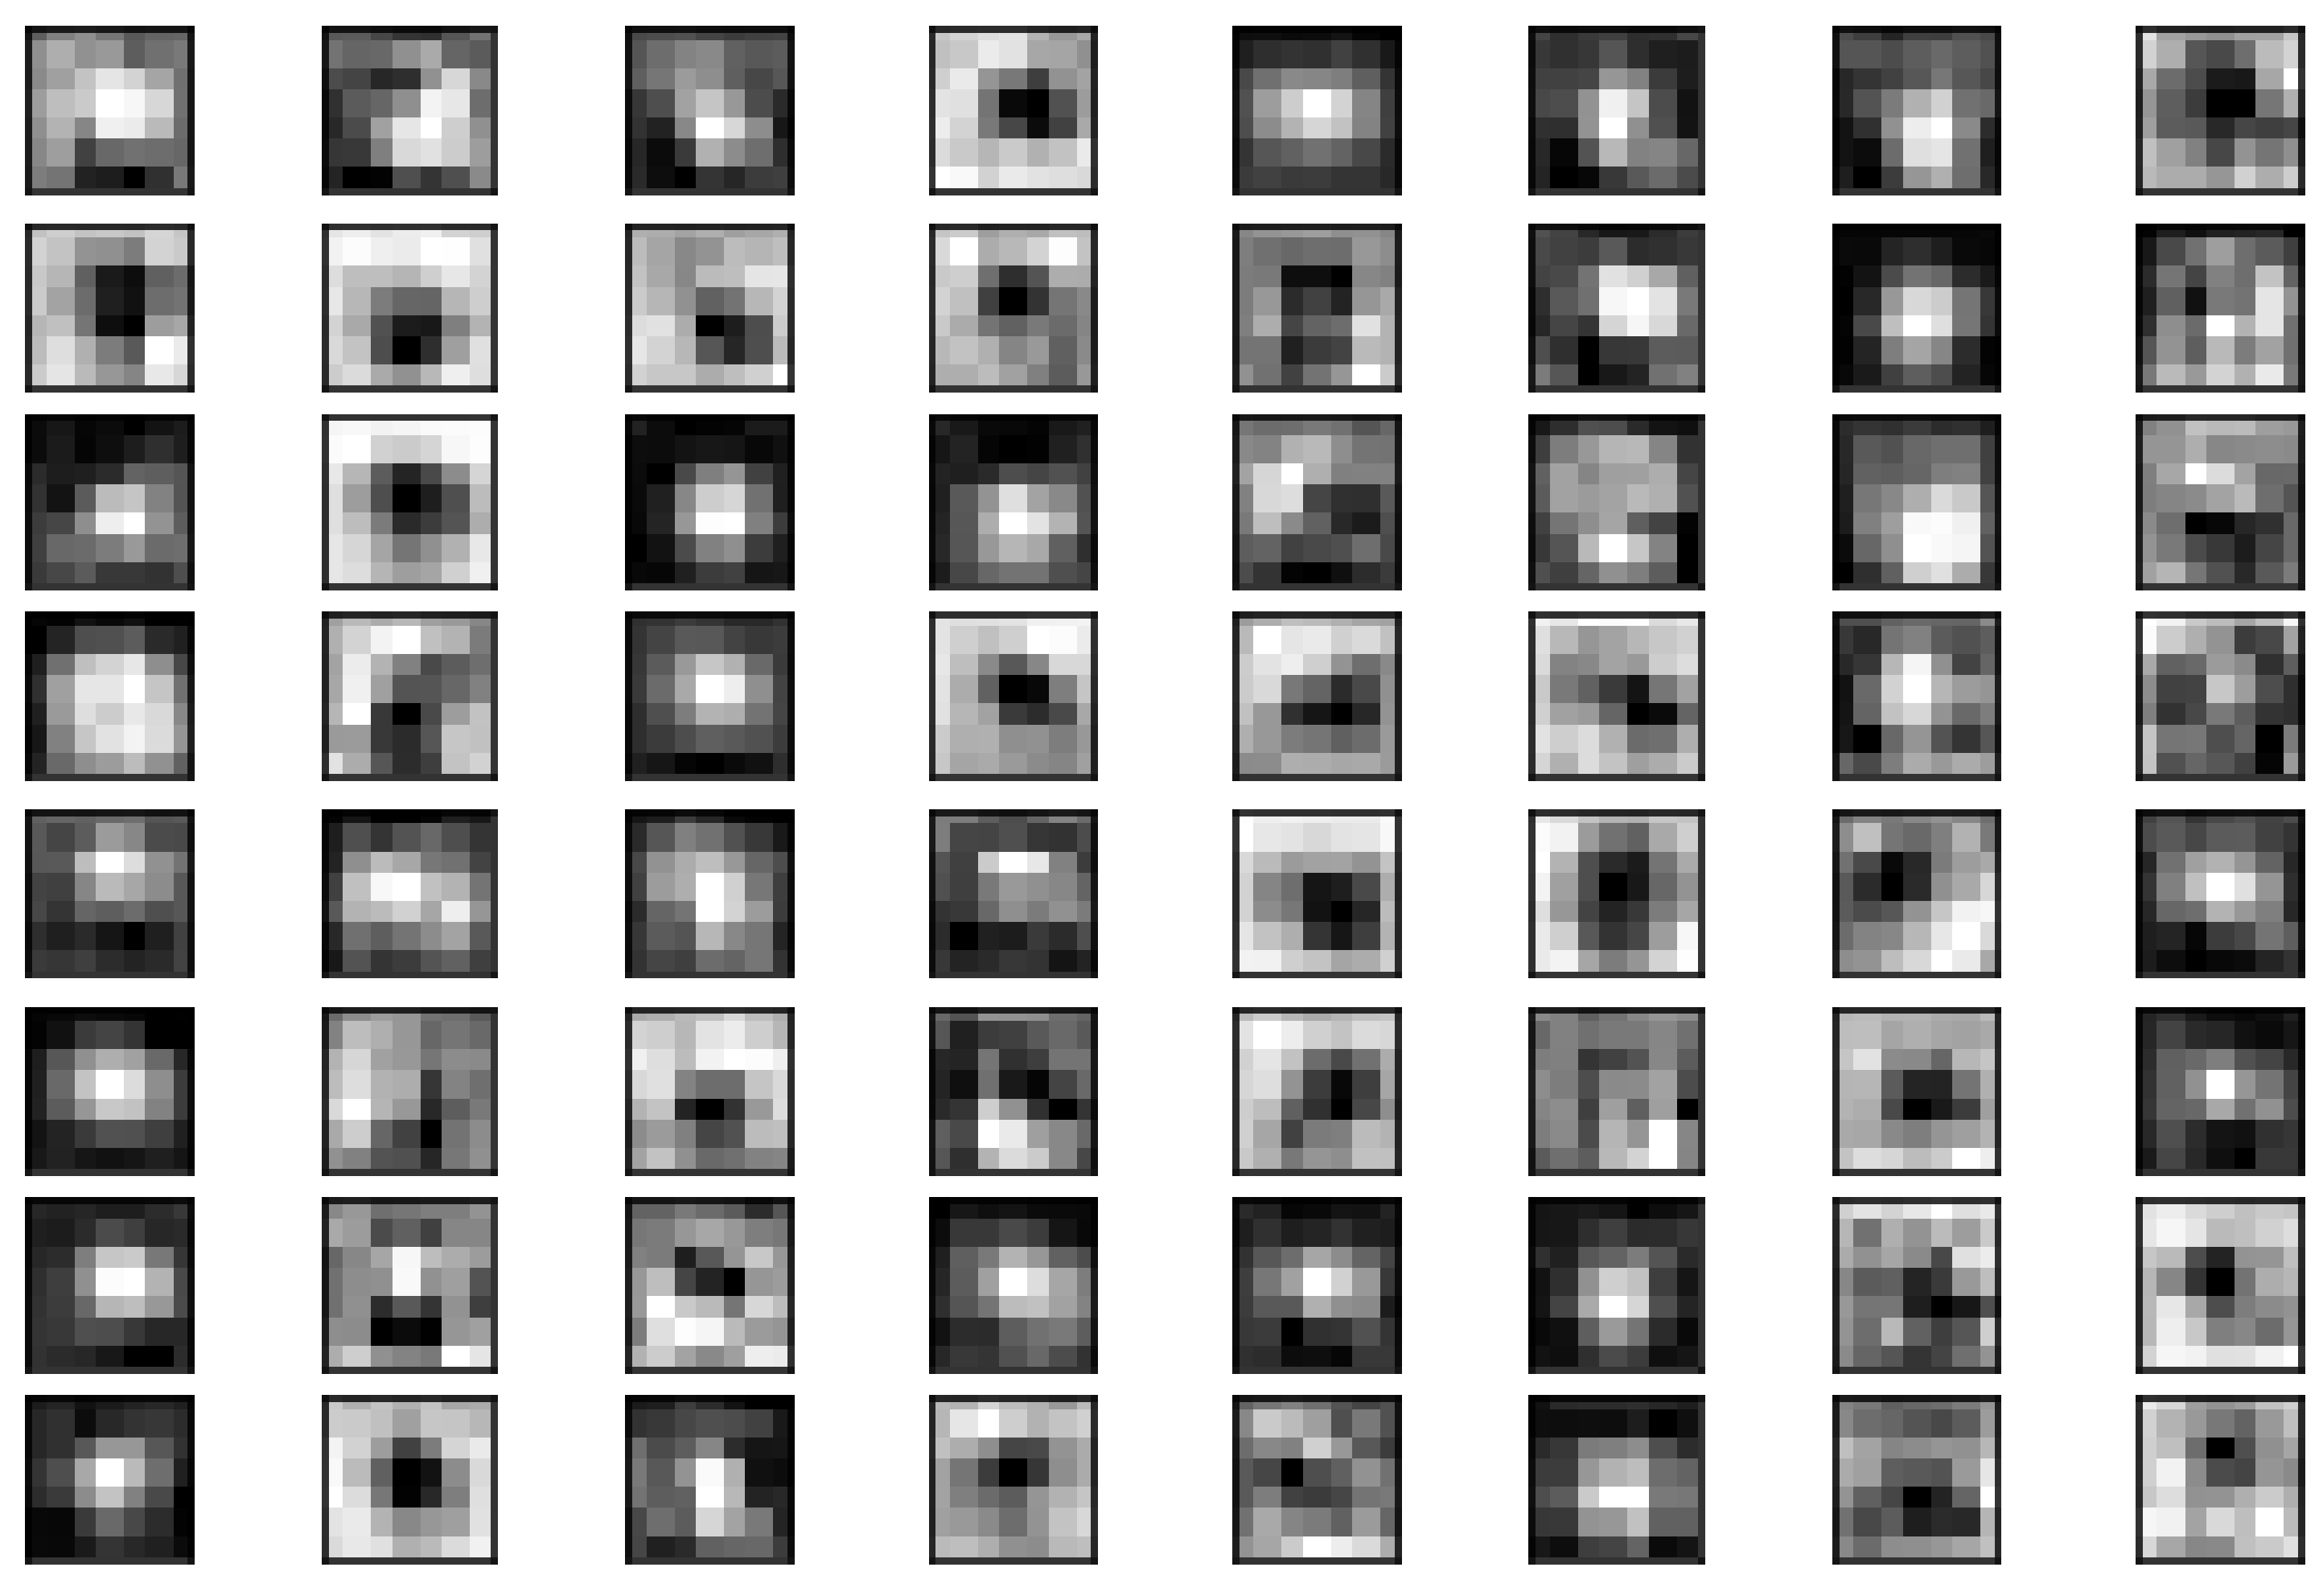
6.3. Feature Map Extraction from ResNet50V2 and DenseNet-121 Models
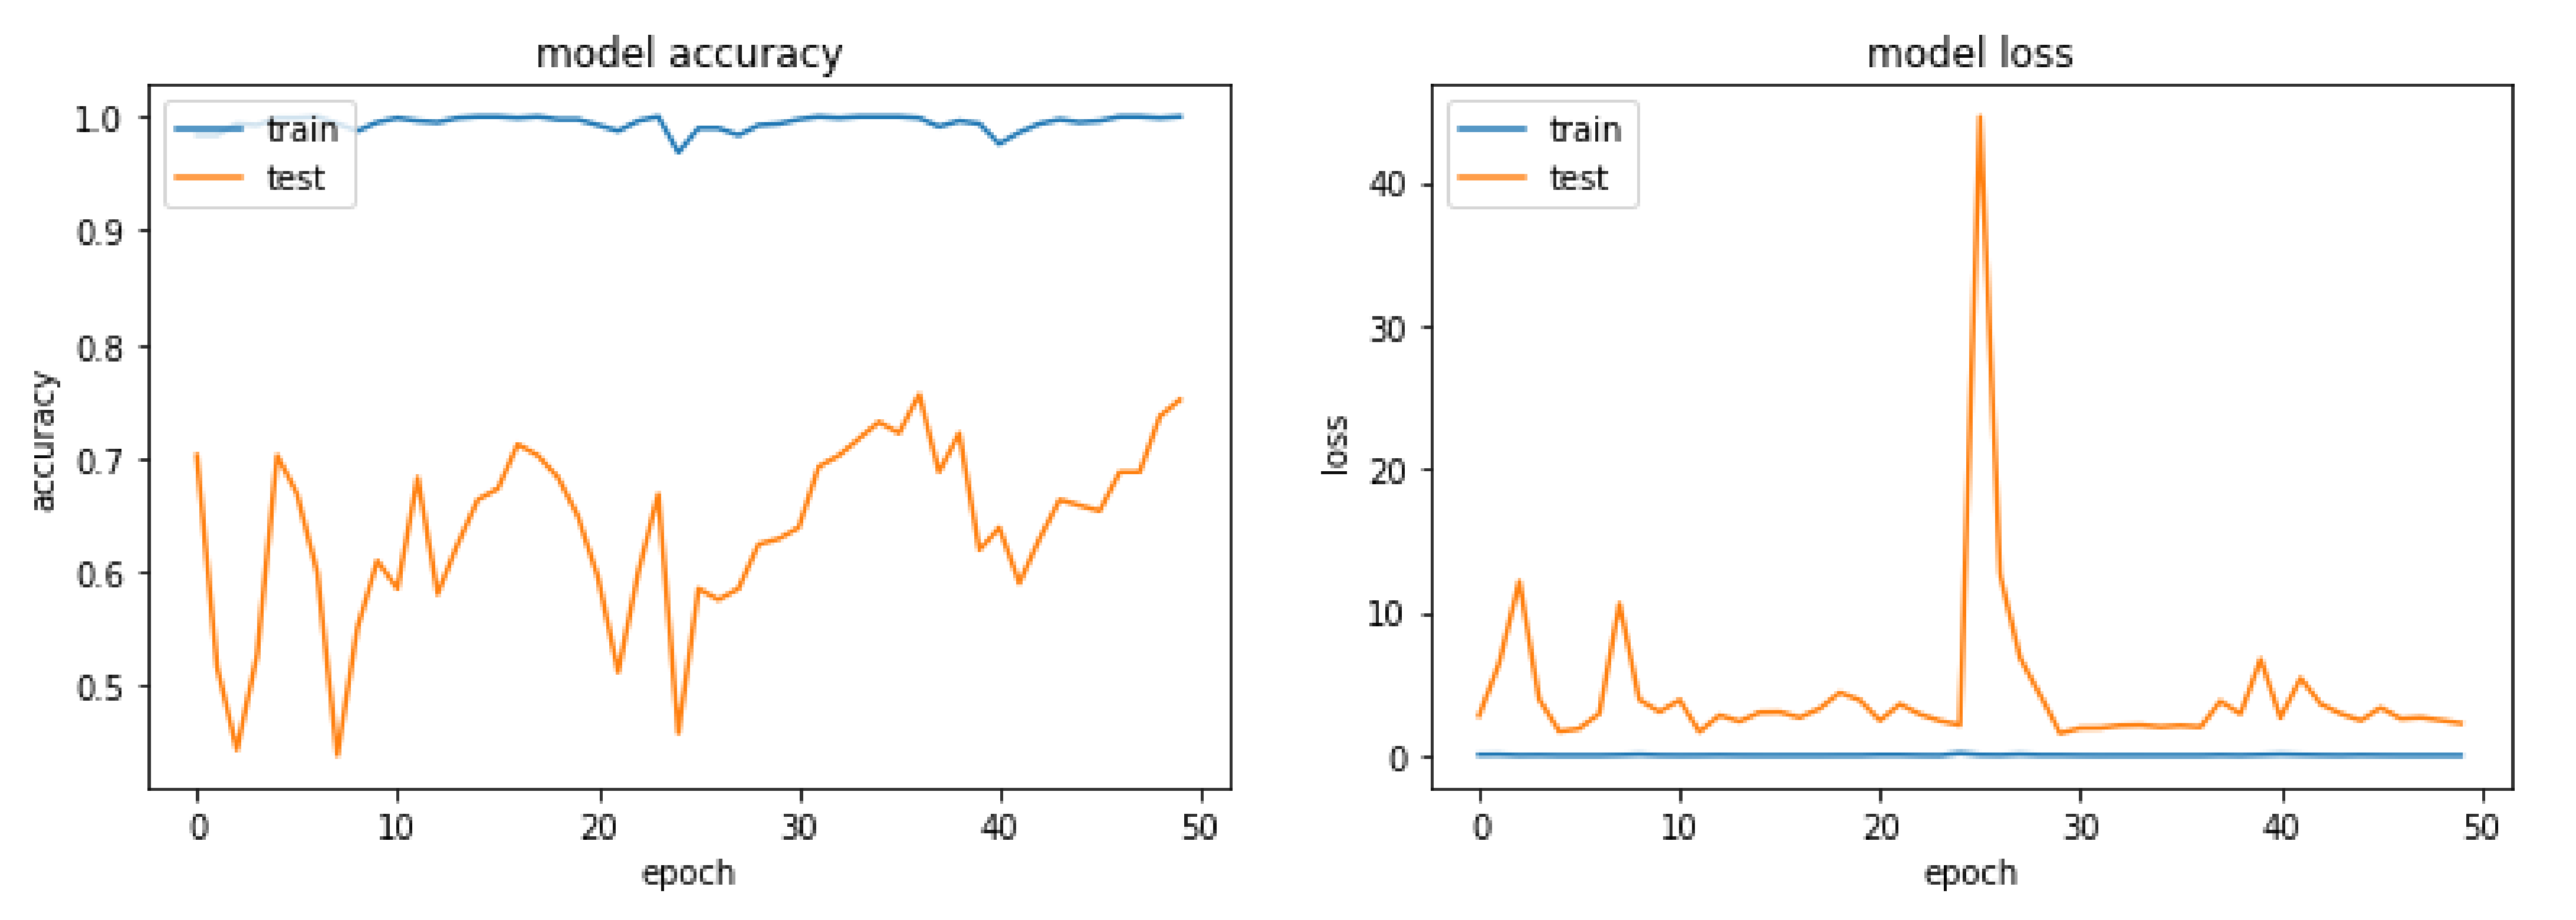
6.4. Result of Visual Sentiment Classification with the Fine-Tuned pre-Trained Models
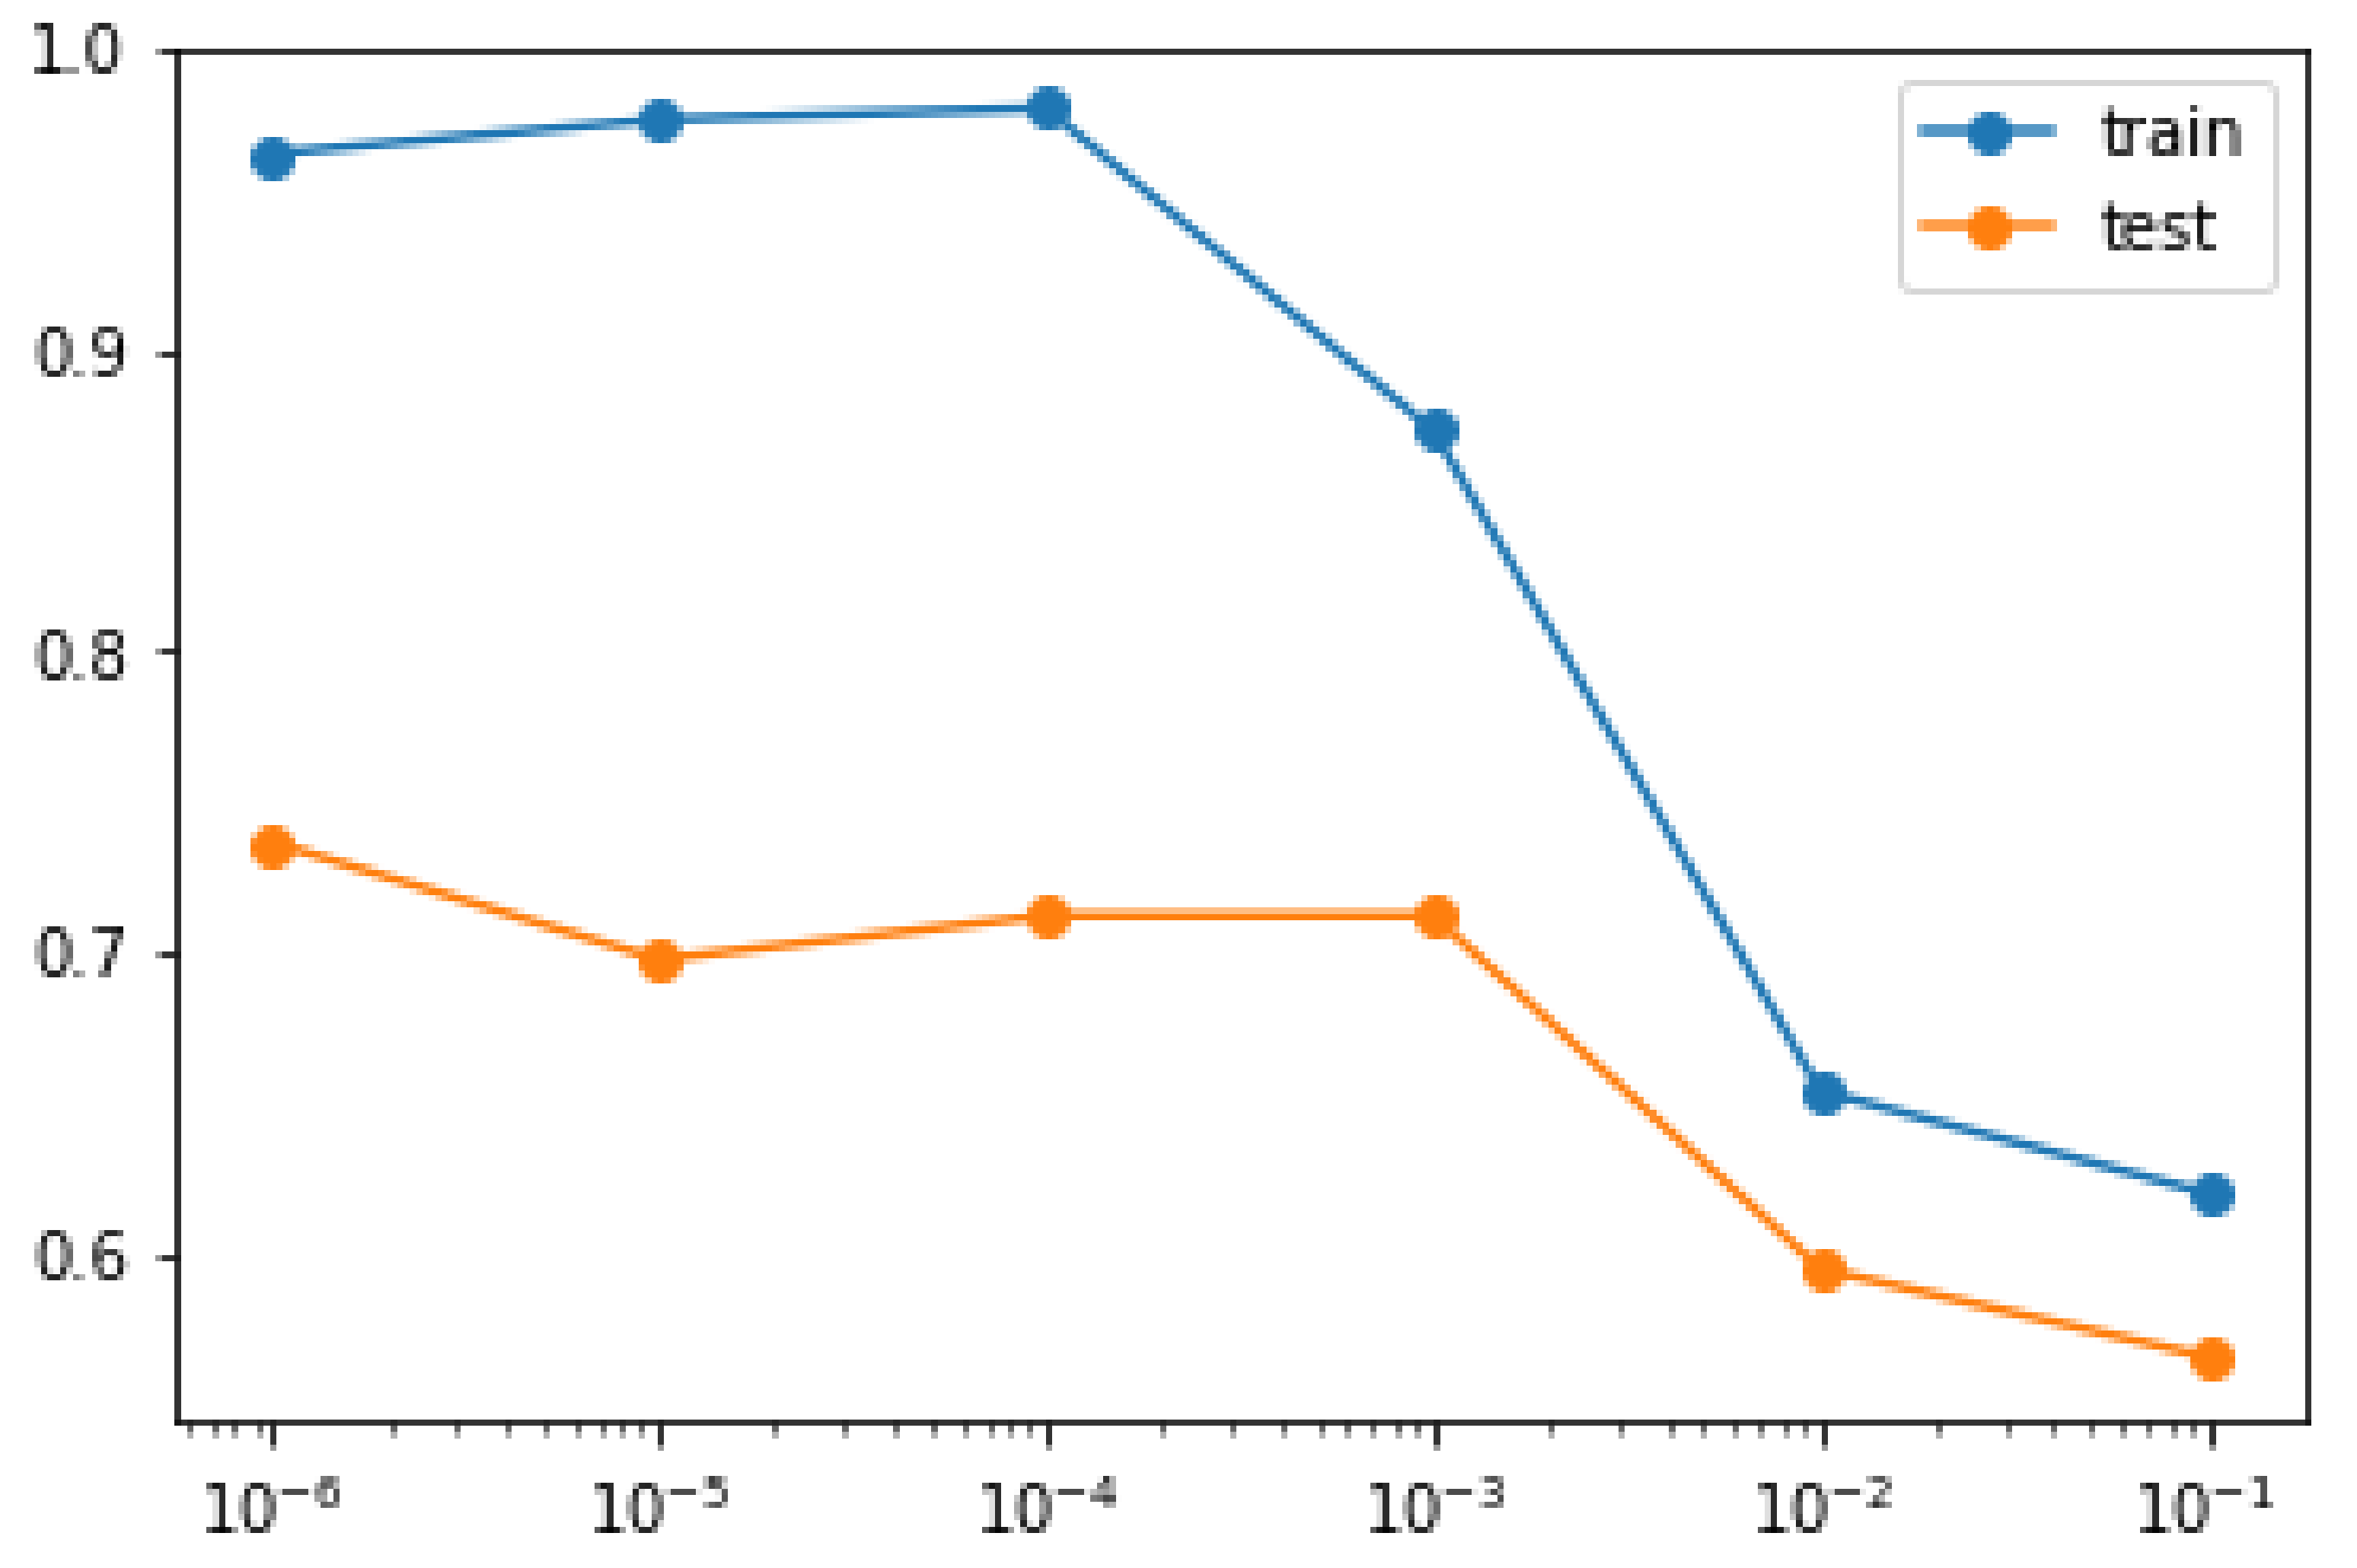
6.4.1. Weight Regularization
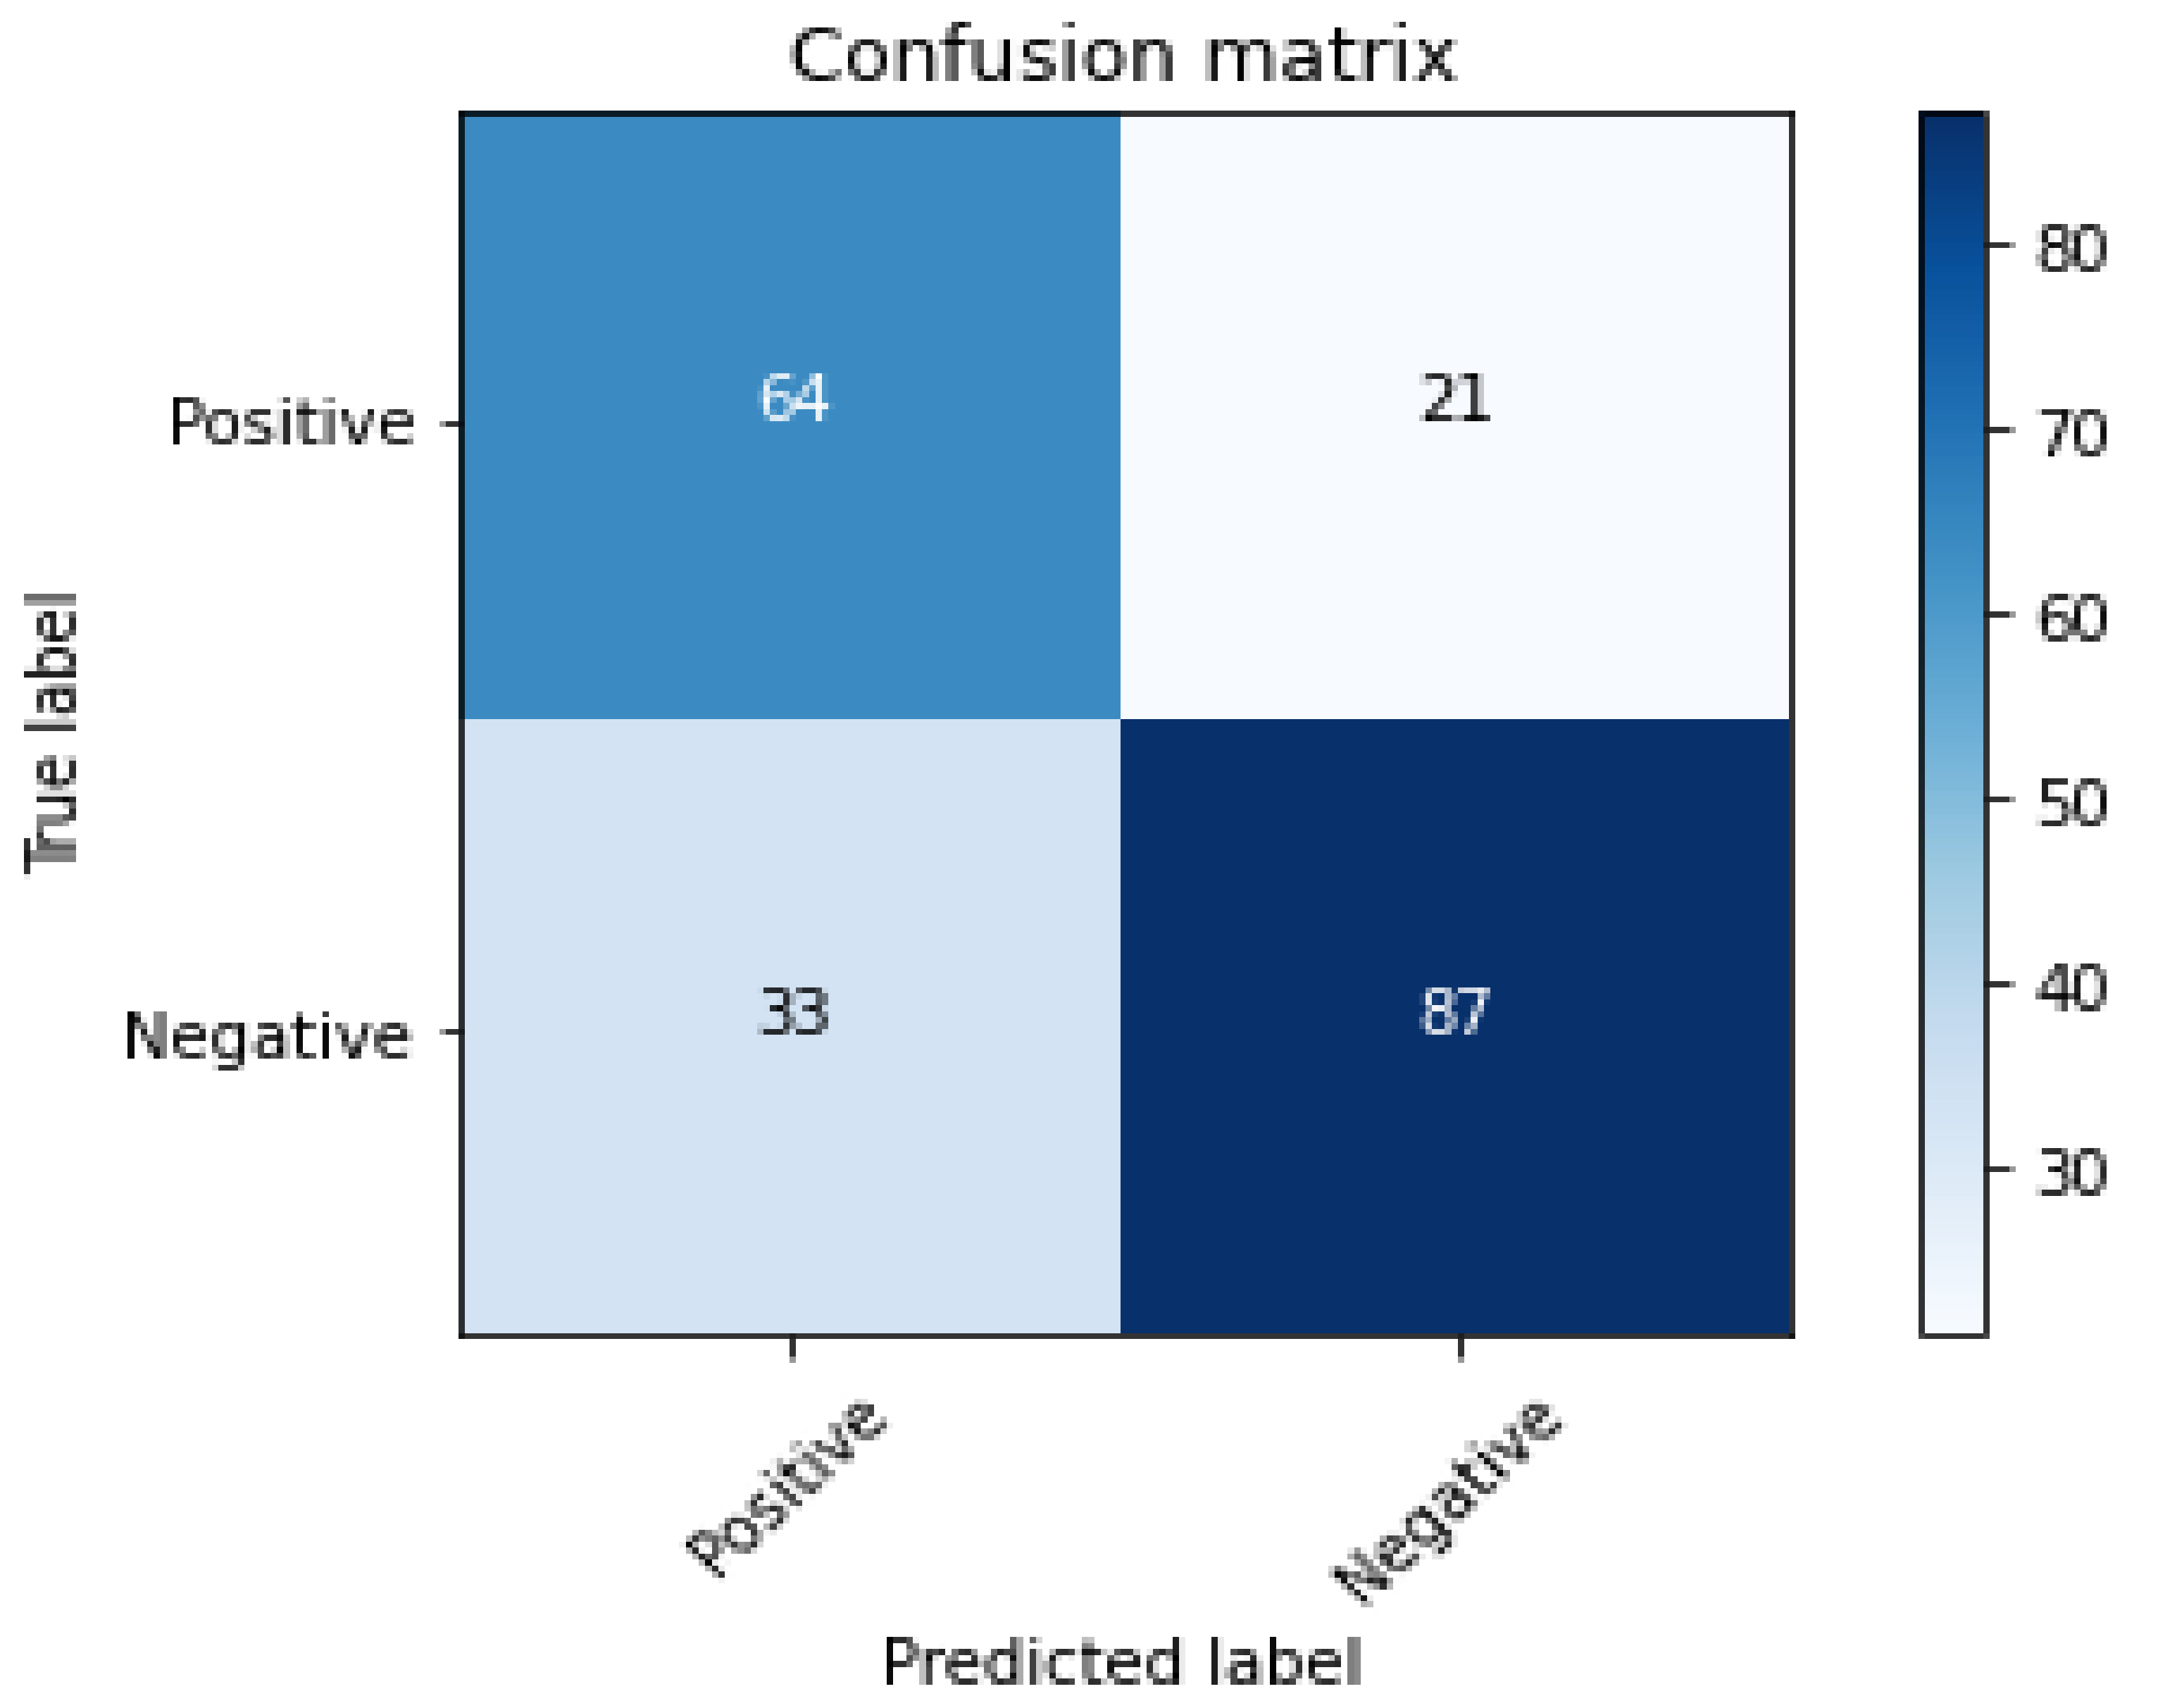
6.4.2. Generation of Confusion Matrix
6.4.3. Generation of a Classification Report
6.4.4. Performance Comparison of the Different Transfer Learning Models
7. Comparison of Our Work to Existing Image Sentiment Analysis Research
8. Conclusions and Future Work
Author Contributions
Funding
Institutional Review Board Statement
Informed Consent Statement
Data Availability Statement
Conflicts of Interest
References
- Karray, F.; Alemzadeh, M.; Abou Saleh, J.; Nours Arab, M. Human-Computer Interaction: Overview on State of the Art. Int. J. Smart Sens. Intell. Syst. 2008, 1, 137–159. [Google Scholar] [CrossRef] [Green Version]
- Auxier, B.; Anderson, M. Social media use in 2021. Pew Res. Cent. 2021. [Google Scholar]
- Sivarajah, U.; Kamal, M.M.; Irani, Z.; Weerakkody, V. Critical analysis of Big Data challenges and analytical methods. J. Bus. Res. 2017, 70, 263–286. [Google Scholar] [CrossRef] [Green Version]
- Bansal, B.; Srivastava, S. On predicting elections with hybrid topic based sentiment analysis of tweets. Procedia Comput. Sci. 2018, 135, 346–353. [Google Scholar] [CrossRef]
- El Alaoui, I.; Gahi, Y.; Messoussi, R.; Chaabi, Y.; Todoskoff, A.; Kobi, A. A novel adaptable approach for sentiment analysis on big social data. J. Big Data 2018, 5, 12. [Google Scholar] [CrossRef]
- Drus, Z.; Khalid, H. Sentiment Analysis in Social Media and Its Application: Systematic Literature Review. Procedia Comput. Sci. 2019, 161, 707–714. [Google Scholar] [CrossRef]
- Zhao, H.; Liu, Z.; Yao, X.; Yang, Q. A machine learning-based sentiment analysis of online product reviews with a novel term weighting and feature selection approach. Inf. Processing Manag. 2021, 58, 102656. [Google Scholar] [CrossRef]
- Dashtipour, K.; Gogate, M.; Adeel, A.; Larijani, H.; Hussain, A. Sentiment Analysis of Persian Movie Reviews Using Deep Learning. Entropy 2021, 23, 596. [Google Scholar] [CrossRef]
- Farisi, A.A.; Sibaroni, Y.; Faraby, S.A. Sentiment analysis on hotel reviews using Multinomial Naïve Bayes classifier. J. Phys. Conf. Ser. 2019, 1192, 012024. [Google Scholar] [CrossRef]
- Melton, C.A.; Olusanya, O.A.; Ammar, N.; Shaban-Nejad, A. Public sentiment analysis and topic modeling regarding COVID-19 vaccines on the Reddit social media platform: A call to action for strengthening vaccine confidence. J. Infect. Public Health 2021, 14, S1876034121002288. [Google Scholar] [CrossRef]
- Mishra, N.; Jha, C.K. Classification of Opinion Mining Techniques. Int. J. Comput. Appl. 2012, 56, 1–6. [Google Scholar] [CrossRef]
- Kim, M.; Lee, S.M.; Choi, S.; Kim, S.Y. Impact of visual information on online consumer review behavior: Evidence from a hotel booking website. J. Retail. Consum. Serv. 2021, 60, 102494. [Google Scholar] [CrossRef]
- Xiao, Z.; Wang, L.; Du, J.Y. Improving the Performance of Sentiment Classification on Imbalanced Datasets With Transfer Learning. IEEE Access 2019, 7, 28281–28290. [Google Scholar] [CrossRef]
- Praveen Gujjar, J.; Prasanna Kumar, H.R.; Chiplunkar, N.N. Image Classification and Prediction using Transfer Learning in Colab Notebook. Glob. Transit. Proc. 2021, 2, S2666285X21000960. [Google Scholar] [CrossRef]
- Zhang, Q.; Yang, Q.; Zhang, X.; Bao, Q.; Su, J.; Liu, X. Waste image classification based on transfer learning and convolutional neural network. Waste Manag. 2021, 135, 150–157. [Google Scholar] [CrossRef]
- Dilshad, S.; Singh, N.; Atif, M.; Hanif, A.; Yaqub, N.; Farooq, W.A.; Ahmad, H.; Chu, Y.; Masood, M.T. Automated image classification of chest X-rays of COVID-19 using deep transfer learning. Results Phys. 2021, 28, 104529. [Google Scholar] [CrossRef]
- Siersdorfer, S.; Minack, E.; Deng, F.; Hare, J. Analyzing and predicting sentiment of images on the social web. In Proceedings of the International Conference on Multimedia MM ’10, Firenze, Italy, 25–29 October 2010; pp. 715–718. [Google Scholar] [CrossRef] [Green Version]
- Rao, T.; Xu, M.; Liu, H.; Wang, J.; Burnett, I. Multi-scale blocks based image emotion classification using multiple instance learning. In Proceedings of the 2016 IEEE International Conference on Image Processing (ICIP), Phoenix, AZ, USA, 25–28 September 2016; pp. 634–638. [Google Scholar] [CrossRef]
- Datta, R.; Joshi, D.; Li, J.; Wang, J.Z. Studying Aesthetics in Photographic Images Using a Computational Approach. In Computer Vision—ECCV 2006; Leonardis, A., Bischof, H., Pinz, A., Eds.; Springer: Berlin/Heidelberg, Germany, 2006; Volume 3953, pp. 288–301. [Google Scholar] [CrossRef]
- Marchesotti, L.; Perronnin, F.; Larlus, D.; Csurka, G. Assessing the aesthetic quality of photographs using generic image descriptors. In Proceedings of the 2011 International Conference on Computer Vision, Barcelona, Spain, 6–13 November 2011; pp. 1784–1791. [Google Scholar] [CrossRef]
- Borth, D.; Chen, T.; Ji, R.; Chang, S.-F. SentiBank: Large-scale ontology and classifiers for detecting sentiment and emotions in visual content. In Proceedings of the 21st ACM International Conference on Multimedia—M ’13, Barcelona, Spain, 21–25 October 2013; pp. 459–460. [Google Scholar] [CrossRef]
- Yuan, J.; Mcdonough, S.; You, Q.; Luo, J. Sentribute: Image sentiment analysis from a mid-level perspective. In Proceedings of the Second International Workshop on Issues of Sentiment Discovery and Opinion Mining—WISDOM ’13, Chicago, IL, USA, 11 August 2013; pp. 1–8. [Google Scholar] [CrossRef]
- Zhao, Z.; Zhu, H.; Xue, Z.; Liu, Z.; Tian, J.; Chua, M.C.H.; Liu, M. An image-text consistency driven multimodal sentiment analysis approach for social media. Inf. Processing Manag. 2019, 56, 102097. [Google Scholar] [CrossRef]
- Fernandez, D.; Woodward, A.; Campos, V.; Giro-i-Nieto, X.; Jou, B.; Chang, S.-F. More cat than cute? Interpretable Prediction of Adjective-Noun Pairs. In Proceedings of the Workshop on Multimodal Understanding of Social, Affective and Subjective Attributes, Mountain View, CA, USA, 27 October 2017; pp. 61–69. [Google Scholar] [CrossRef] [Green Version]
- Yang, J.; She, D.; Sun, M.; Cheng, M.-M.; Rosin, P.L.; Wang, L. Visual Sentiment Prediction Based on Automatic Discovery of Affective Regions. IEEE Trans. Multimed. 2018, 20, 2513–2525. [Google Scholar] [CrossRef] [Green Version]
- Wang, J.; Fu, J.; Xu, Y.; Mei, T. Beyond Object Recognition: Visual Sentiment Analysis with Deep Coupled Adjective and Noun Neural Networks. In Proceedings of the Twenty-Fifth International Joint Conference on Artificial Intelligence (IJCAI-16), New York, NY, USA, 9–15 July 2016; pp. 3484–3490. [Google Scholar]
- Song, K.; Yao, T.; Ling, Q.; Mei, T. Boosting image sentiment analysis with visual attention. Neurocomputing 2018, 312, 218–228. [Google Scholar] [CrossRef]
- Ortis, A.; Farinella, G.M.; Torrisi, G.; Battiato, S. Visual Sentiment Analysis Based on on Objective Text Description of Images. In Proceedings of the 2018 International Conference on Content-Based Multimedia Indexing (CBMI), La Rochelle, France, 4–6 September 2018; pp. 1–6. [Google Scholar] [CrossRef]
- Xu, J.; Huang, F.; Zhang, X.; Wang, S.; Li, C.; Li, Z.; He, Y. Sentiment analysis of social images via hierarchical deep fusion of content and links. Appl. Soft Comput. 2019, 80, 387–399. [Google Scholar] [CrossRef]
- Huang, F.; Zhang, X.; Zhao, Z.; Xu, J.; Li, Z. Image-text sentiment analysis via deep multimodal attentive fusion. Knowl. Based Syst. 2019, 167, 26–37. [Google Scholar] [CrossRef]
- Chen, T.; Borth, D.; Darrell, T.; Chang, S.-F. DeepSentiBank: Visual Sentiment Concept Classification with Deep Convolutional Neural Networks. ArXiv 2014, arXiv:1410.8586. [Google Scholar]
- Campos, V.; Jou, B.; Giró-i-Nieto, X. From Pixels to Sentiment: Fine-tuning CNNs for Visual Sentiment Prediction. Image Vis. Comput. 2016, 65, 15–22. [Google Scholar] [CrossRef] [Green Version]
- Machajdik, J.; Hanbury, A. Affective image classification using features inspired by psychology and art theory. In Proceedings of the International Conference on Multimedia—MM ’10, Firenze, Italy, 25–29 October 2010; pp. 83–92. [Google Scholar] [CrossRef]
- Katsurai, M.; Satoh, S. Image sentiment analysis using latent correlations among visual, textual, and sentiment views. In Proceedings of the 2016 IEEE International Conference on Acoustics, Speech and Signal Processing (ICASSP), Shanghai, China, 20–25 March 2016; pp. 2837–2841. [Google Scholar] [CrossRef]
- Yilin, W.; Suhang, W.; Jiliang, T.; Huan, L.; Baoxin, L. Unsupervised Sentiment Analysis for Social Media Images. In Proceedings of the Twenty-Fourth International Joint Conference on Artificial Intelligence (IJCAI 2015), Buenos Aires, Argentina, 25–31 July 2015; pp. 2378–2379. [Google Scholar]
- Zhang, S.; Zhang, X.; Chan, J.; Rosso, P. Irony detection via sentiment-based transfer learning. Inf. Processing Manag. 2019, 56, 1633–1644. [Google Scholar] [CrossRef]
- Smetanin, S.; Komarov, M. Deep transfer learning baselines for sentiment analysis in Russian. Inf. Processing Manag. 2021, 58, 102484. [Google Scholar] [CrossRef]
- Kanclerz, K.; Miłkowski, P.; Kocoń, J. Cross-lingual deep neural transfer learning in sentiment analysis. Procedia Comput. Sci. 2020, 176, 128–137. [Google Scholar] [CrossRef]
- Xiao, M.; Wu, Y.; Zuo, G.; Fan, S.; Yu, H.; Shaikh, Z.A.; Wen, Z. Addressing Overfitting Problem in Deep Learning-Based Solutions for Next Generation Data-Driven Networks. Wirel. Commun. Mob. Comput. 2021, 2021, 1–10. [Google Scholar] [CrossRef]
- Zhao, W. Research on the deep learning of the small sample data based on transfer learning. AIP Conf. Proc. 2017, 1864, 020018. [Google Scholar] [CrossRef] [Green Version]
- Szegedy, C.; Ioffe, S.; Vanhoucke, V.; Alemi, A. Inception-v4, Inception-ResNet and the Impact of Residual Connections on Learning. ArXiv 2016, arXiv:1602.07261. [Google Scholar]
- Huang, G.; Liu, Z.; van der Maaten, L.; Weinberger, K.Q. Densely Connected Convolutional Networks. ArXiv 2018, arXiv:1608.06993. [Google Scholar]
- Deng, J.; Dong, W.; Socher, R.; Ki, L.; Li, K.; Fei-Fei, K. ImageNet: A large-scale hierarchical image database. In Proceedings of the IEEE Conference on Computer Vision and Pattern Recognition, Miami Beach, FL, USA, 20–25 June 2009. [Google Scholar]
- Zhang, J.; Chen, M.; Sun, H.; Li, D.; Wang, Z. Object semantics sentiment correlation analysis enhanced image sentiment classification. Knowl. Based Syst. 2020, 191, 105245. [Google Scholar] [CrossRef]
- You, Q.; Luo, J.; Jin, H.; Yang, J. Building a Large Scale Dataset for Image Emotion Recognition: The Fine Print and The Benchmark. ArXiv 2016, arXiv:1605.02677. [Google Scholar]
- Jindal, S.; Singh, S. Image sentiment analysis using deep convolutional neural networks with domain specific fine tuning. In Proceedings of the 2015 International Conference on Information Processing (ICIP), Pune, India, 16–19 December 2015; pp. 447–451. [Google Scholar] [CrossRef]
- Fengjiao, W.; Aono, M. Visual Sentiment Prediction by Merging Hand-Craft and CNN Features. In Proceedings of the 2018 5th International Conference on Advanced Informatics: Concept Theory and Applications (ICAICTA), Krabi, Thailand, 14–17 August 2018; pp. 66–71. [Google Scholar] [CrossRef]
- Chen, S.; Yang, J.; Feng, J.; Gu, Y. Image sentiment analysis using supervised collective matrix factorization. In Proceedings of the 2017 12th IEEE Conference on Industrial Electronics and Applications (ICIEA), Siem Reap, Cambodia, 18–20 June 2017; pp. 1033–1038. [Google Scholar] [CrossRef]
- Das, P.; Ghosh, A.; Majumdar, R. Determining Attention Mechanism for Visual Sentiment Analysis of an Image using SVM Classifier in Deep learning based Architecture. In Proceedings of the 2020 8th International Conference on Reliability, Infocom Technologies and Optimization (Trends and Future Directions) (ICRITO), Noida, India, 4–5 June 2020; pp. 339–343. [Google Scholar] [CrossRef]
- Liang, Y.; Maeda, K.; Ogawa, T.; Haseyama, M. Cross-Domain Semi-Supervised Deep Metric Learning for Image Sentiment Analysis. In Proceedings of the ICASSP 2021–2021 IEEE International Conference on Acoustics, Speech and Signal Processing (ICASSP), Toronto, ON, Canada, 6–11 June 2021; pp. 4150–4154. [Google Scholar] [CrossRef]
- Lin, C.; Zhao, S.; Meng, L.; Chua, T.-S. Multi-source Domain Adaptation for Visual Sentiment Classification. ArXiv 2020, arXiv:2001.03886. [Google Scholar]
- She, D.; Yang, J.; Cheng, M.-M.; Lai, Y.-K.; Rosin, P.L.; Wang, L. WSCNet: Weakly Supervised Coupled Networks for Visual Sentiment Classification and Detection. IEEE Trans. Multimed. 2019, 22, 1358–1371. [Google Scholar] [CrossRef] [Green Version]


| S. No. | Author Name | Technique Used and Results | Merits | Limitations |
|---|---|---|---|---|
| 1 | Tao Chen et al. [31] | Adjective–noun pairs (ANP) and convolutional neural networks (CNN) trained based on Caffe. The proposed DeepSentibank outperformed SentiBank 1.1 by 62.3%. | The suggested model enhances annotation accuracy as well as ANP retrieval performance. | To reduce overfitting, network structure must be adjusted. |
| 2 | V’ıctor Camposa et al. [32] | Fine-tuned CaffeNet CNN architecture was employed. Obtained an accuracy of 0.83 on Twitter dataset for sentiment prediction. | The model uses fewer training parameters and provides a robust model for sentiment visualization. | To accommodate the presence of noisy labels, the architecture must be rebuilt. |
| 3 | Jana Machajdik et al. [33] | Low-level visual features based on psychology were applied. Accuracy rates of more than 70% were obtained for classifying a variety of emotions. | Able to generate an emotional histogram displaying the distribution of emotions across multiple categories. | To improve the outcomes, more and better features are required. |
| 4 | Marie Katsurai et al. [34] | RGB histograms, GIST descriptors, and mid-level features were employed as visual descriptors. On the Flickr dataset, the proposed model achieved an accuracy of 74.77%. | Multi-view (text + visual) embedding space is effective in classifying visual sentiment. | Investigation is needed regarding features to improve the system performance. |
| 5 | Yilin Wang et al. [35] | Unsupervised sentiment analysis framework (USEA) was proposed. Achieved an accuracy score of 59.94% for visual sentiment prediction on Flickr dataset. | The “semanticgap” between low- and high-level visual aspects was successfully resolved. | More social media sources, such as geo-location and user history, must be examined in order to boost performance even more. |
| Name of the Layer | Size of the Output | Resnet50V2 |
|---|---|---|
| Conv 1 (Stage I) | 112 × 112 | 7 × 7 convolution with a stride of 2 |
| 112 × 112 | 3 × 3 max pooling with a stride of 2 | |
| Conv 2 (Stage II) | 56 × 56 | [1 × 1,64; 3 × 3,64 and 1 × 1,256] × 3 |
| Conv 3 (Stage III) | 28 × 28 | [1 × 1,128; 3 × 3,128 and 1 × 1,512] × 4 |
| Conv 4 (Stage IV) | 14 × 14 | [1 × 1,256; 3 × 3,256 and 1 × 1,1024] × 6 |
| Conv 5 (Stage V) | 7 × 7 | [1 × 1,512; 3 × 3,512 and 1 × 1,2048] × 3 |
| Classification | 1 × 1 | Global average pooling [7 × 7] with 1000 fully connected Softmax layers |
| Name of the Layer | Size of the Output | DenseNet-121 |
|---|---|---|
| Convolution | 112 × 112 | 7 × 7 convolution with a stride of 2 |
| Pooling | 56 × 56 | 3 × 3 max pooling with a stride of 2 |
| Dense Block 1 | 56 × 56 | [1 × 1 and 3 × 3 conv] × 6 |
| Transition Layer 1 | 28 × 28 | [1 × 1] convolution with [2 × 2] average pooling layer |
| Dense Block 2 | 28 × 28 | [1 × 1 and 3 × 3 conv] × 12 |
| Transition Layer 2 | 14 × 14 | [1 × 1 and 3 × 3 conv] × 6 |
| Dense Block 3 | 14 × 14 | [1 × 1 and 3 × 3 conv] × 24 |
| Transition Layer 3 | 7 × 7 | [1 × 1 and 3 × 3 conv] × 6 |
| Dense Block 4 | 7 × 7 | [1 × 1 and 3 × 3 conv] × 16 |
| Classification | 1 × 1 | Global average pooling [7 × 7] with 1000 fully connected Softmax layers |
| Sentiment Class | Number of Images |
|---|---|
| Positive | 642 |
| Negative | 358 |
| Total | 1000 |
| VGG-19 Model | |||
|---|---|---|---|
| Sentiment Class | Precision | Recall | F1 Score |
| Positive | 0.66 | 0.75 | 0.70 |
| Negative | 0.81 | 0.72 | 0.76 |
| Accuracy | 0.73 | ||
| DenseNet121 Model | |||
|---|---|---|---|
| Sentiment Class | Precision | Recall | F1 Score |
| Positive | 0.86 | 0.88 | 0.87 |
| Negative | 0.92 | 0.90 | 0.91 |
| Accuracy | 0.89 | ||
| ResNet50V2 Model | |||
|---|---|---|---|
| Sentiment Class | Precision | Recall | F1 Score |
| Positive | 0.74 | 0.62 | 0.68 |
| Negative | 0.76 | 0.84 | 0.80 |
| Accuracy | 0.75 | ||
| S. No. | Author Name | Technique Used and Results | Merits | Limitations |
|---|---|---|---|---|
| 1 | Jing Zhang et al. [44] | Convolutional neural networks (CNN) was employed. On social media, researchers achieved a prediction accuracy of 68.02%. | Using several fusion algorithms, good performance on image sentiment categorization was attained. | A shallow structure may not be adequate for learning high-level semantic information. |
| 2 | Quanzeng You and Jiebo Luo [45] | Convolutional neural networks (CNN) with fine-tuned parameters achieved an accuracy of 58.3% for sentiment prediction on social media images. | The introduction of deep visual characteristics improved sentiment prediction task performance. | The performance of using deep visual features is not consistent across the sentiment categories. |
| 3 | Jindal, S. and Singh, S. [46] | A CNN with domain-specific tuning was used. Sentiment prediction on social media data yielded an accuracy of 53.5%. | Domain-specific tuning helps in better sentiment prediction. | The overfitting needs to be reduced and some challenges must be overcome to obtain enhanced performance. |
| 4 | Fengjiao, W. and Aono M. [47] | CNN was used in conjunction with Bag-of-Visual-Words (BOVW) features. On the Twitter images dataset, researchers achieved an accuracy of 72.2% for sentiment prediction. | The performance of sentiment prediction is improved by combining hand-crafted features with CNN features. | To determine the model’s efficiency, a substantial training dataset must be used. |
| 5 | Siqian Chen and Jie Yang [48] | To learn the visual features, the Alexnet model was employed. Sentiment prediction from social media images achieved an accuracy score of 48.08%. | By incorporating label information into the collective matrix factorization (CMF) technique, prediction accuracy is improved. | To achieve better outcomes, more constraints must be applied to the CMF technique, and the Alexnet model must be fine-tuned. |
| 6 | Papiya Das et al. [49] | SVM classification layer was used on deep CNN architecture. On various visual datasets, the accuracies were 65.89% and 68.67%. | The application of attention models aid in mapping the local regions of an image, resulting in better sentiment prediction. | To improve sentiment prediction performance, a strong visual classifier with robust feature identification methodologies is required. |
| 7 | Yun Liang et al. [50] | The cross-domain semi-supervised deep metric earning (CDSS-DML) method was used. For social media image sentiment prediction, it obtained an overall accuracy score of 0.44. | The model is trained with unlabeled data based on the teacher–student paradigm, overcoming the limits imposed by the scarcity of well-labeled data. | It is necessary to investigate the concept of fine-tuning the model in order to improve its effectiveness. |
| 8 | Chuang Lin et al. [51] | The multisource sentiment generative adversarial network (MSGAN) method was used and, for visual sentiment prediction, an accuracy of 70.63% was obtained. | Very efficient at dealing with data from numerous source domains. | Methods for improving the inherent flaws of the GAN network must be investigated further. |
| 9 | Dongyu She et al. [52] | Weakly supervised coupled convolutional network (WSCCN) was used. On several datasets of images, the highest accuracy of 0.86% was obtained for sentiment prediction. | Reduces annotation burden by picking useful soft proposals from weak annotations automatically. | To improve the findings, pre-processing strategies must be investigated. |
| 10 | The proposed approach (fine-tuned pre-trained models) Ganesh Chandrasekaran et al. | Various fine-tuned pre-trained models, namely the VGG-19, ResNet50V2, and DenseNet-121, were used. With an accuracy of 0.89, the DenseNet-121 model fared better. | By using dropout and regularization layers with fine-tuning, it addresses the limitations of overfitting caused by the lack of training data. | To increase sentiment prediction results, more samples must be added to the training set, and an extra modality (text or audio) can be used. |
Publisher’s Note: MDPI stays neutral with regard to jurisdictional claims in published maps and institutional affiliations. |
© 2022 by the authors. Licensee MDPI, Basel, Switzerland. This article is an open access article distributed under the terms and conditions of the Creative Commons Attribution (CC BY) license (https://creativecommons.org/licenses/by/4.0/).
Share and Cite
Chandrasekaran, G.; Antoanela, N.; Andrei, G.; Monica, C.; Hemanth, J. Visual Sentiment Analysis Using Deep Learning Models with Social Media Data. Appl. Sci. 2022, 12, 1030. https://doi.org/10.3390/app12031030
Chandrasekaran G, Antoanela N, Andrei G, Monica C, Hemanth J. Visual Sentiment Analysis Using Deep Learning Models with Social Media Data. Applied Sciences. 2022; 12(3):1030. https://doi.org/10.3390/app12031030
Chicago/Turabian StyleChandrasekaran, Ganesh, Naaji Antoanela, Gabor Andrei, Ciobanu Monica, and Jude Hemanth. 2022. "Visual Sentiment Analysis Using Deep Learning Models with Social Media Data" Applied Sciences 12, no. 3: 1030. https://doi.org/10.3390/app12031030
APA StyleChandrasekaran, G., Antoanela, N., Andrei, G., Monica, C., & Hemanth, J. (2022). Visual Sentiment Analysis Using Deep Learning Models with Social Media Data. Applied Sciences, 12(3), 1030. https://doi.org/10.3390/app12031030