Abstract
Damage to underground structures induced by soil liquefaction under cyclic loads such as earthquakes has long been an important issue in underground engineering practice. In this paper, five models are developed using Flac3D software to analyze the effect of burial depth on the force, deformation characteristics, and uplift behavior of utility tunnels in the non-homogeneous site containing a liquefied layer. The cyclic shear property of saturated sand and the increase in pore water pressure during the earthquake are modeled using a cyclic load-volume strain increment model, using Shell-Type structural elements to model underground utility tunnels, and by using plastic hinges to represent the bending moment capacity of member’s joints. Numerical results show that for shallow-buried utility tunnels, increasing the burial depth increases the bending moment, shear force, and deformation of the structure while significantly reducing its uplift. Therefore, for high-strength shallow-buried utility tunnels, appropriate increase in burial depth can improve its seismic safety.
1. Introduction
In modern society, underground constructions are becoming increasingly prevalent due to rapid population growth and limited urban land resources [1]. From small underground structures such as pipelines to large underground stations, the variety of underground constructions is also increasing. Among them, underground utility tunnels are being used more often in urban construction because of their ability to make full use of underground space and improve the urban environment. However, there are many safety issues with underground structures, especially when they are in liquefiable sites in seismic zones, and there are many cases of damage to underground structures in liquefied soil in previous earthquake damage reports. In 1995, the massive soil liquefaction that occurred in the Hyogo-Ken Nanbu earthquake caused many caisson quay walls along the Kobe coast to move several meters out to sea [2]. During the 2004 Nakagoshi earthquake in Niigata Prefecture, Japan, liquefaction of under-compacted backfill caused a large number of sewer manholes in the area to be lifted more than 1 m above ground level [3,4]. Liquefaction can also cause damage to large underground structures, and some tunnels in California were damaged by uplift during the 1989 Loma Prieta earthquake [5,6]. Although underground structures are sheltered and protected by the soil, loosely saturated sandy soil gradually and substantially loses its shear strength during strong ground motion, and the soil changes from a solid to a liquefied state, so that underground structures in the liquefied soils are more vulnerable to strong earthquakes [7].
“Currently, lots of studies have been conducted on the seismic response of underground structures in liquefied soils and many valuable views have been proposed.” A large number of centrifuge tests and large-scale shaking table tests have been carried out to study the dynamic deformation characteristics of underground structures such as pipelines, tunnels, and underground stations in liquefiable soils from different perspectives during the shaking [4,8,9,10,11,12]. Chen et al. [10] carried out a series of large-scale shaking table tests to investigate the damage mechanism and uplift behavior of a three-arch subway station structure in liquefiable soil during the strong motions. Kang et al. [4] tested 22 centrifuge models to study the response of underground manholes under dynamic loads and explained the mechanism of manhole uplift caused by excess pore water pressure and proposed a solution to reduce the uplift. Numerical calculations of underground structures in liquefiable strata using various complex soil constitutive models are also widely used [6,13,14,15]. Many of these studies are based on homogeneous soil, while in practice, few underground structures are in homogeneous strata, especially linear underground structures such as utility tunnels, which are more commonly located in non-homogeneous strata containing liquefied soils on a site scale of hundreds or more than a dozen kilometers. For example, the utility tunnel of Beijing Daxing International Airport, shown in Figure 1, passes through a non-homogeneous liquefiable stratum. Therefore, it is all the more important to study underground structures partially or fully buried in layered liquefiable soils [16]. In previous research and engineering practice, increasing the burial depth is considered to be an effective method to control the uplift of underground structures in liquefied soils [7,17,18,19,20]. Chian et al. [9] studied the uplift of tunnels in liquefied soil by numerical analysis and centrifuge tests and analyzed the effect of burial depth and dimensions on the vertical displacement of tunnels with circular cross-sections. Saeedzadeh et al. [19] established numerical models to investigate the effect of parameters such as the expansion angle and relative density of the soil and the diameter and burial depth of the pipe on the uplift of the pipes in saturated sandy soil. The above studies have mainly focused on the uplift of underground structures due to soil liquefaction, with less analysis of the internal forces and deformations of structures with different burial depths in earthquakes. Increasing the burial depth will significantly change the state of the structural forces, so what will be the seismic response of the utility tunnel in non-homogeneous liquefiable soil at different burial depths?
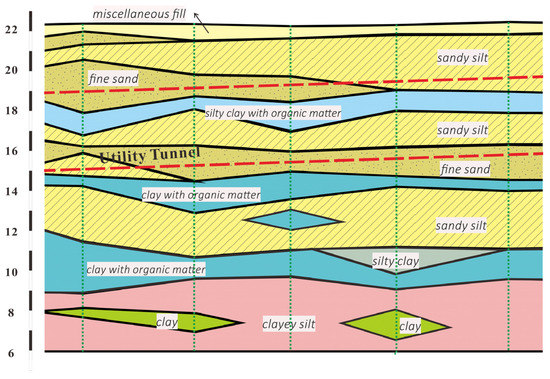
Figure 1.
Geological profile of a section of the utility tunnel at Beijing Daxing International Airport.
Flac3D numerical simulation is widely used to analyze the seismic response of underground structures in liquefiable or non-liquefiable soils [9,18,20,21,22], which provides a feasible means to study the above problems. This paper investigates the performance of utility tunnels with different burial depths in non-homogeneous liquefiable sites under seismic loading. The underground structure is simulated using Shell-Type structural elements in Flac3D, using plastic hinges at the members’ joints to simulate their possible plastic behavior during the earthquake. Based on the common non-homogeneous sites in practice, a typical “clay-liquefiable sand-clay” stratigraphic model is established. The effect of burial depth on the uplift value of the structure is analyzed while considering its effect on the internal force and deformation of the structure. The second section details the process of numerical simulations in this paper, including geometric modeling, materials properties and parameters, boundary conditions, and the input ground motions. General results on the liquefaction characteristics of the soil and the seismic response of the structure for the numerical model with a 2 m burial depth are given in section three. The fourth section analyzes the internal forces, deformation, uplift, and structure–soil interaction of the utility tunnel under different burial depths to investigate the effects caused by the burial depth.
At present, urban construction in China is increasingly using utility tunnels, while research in the field of seismic resistance of utility tunnels, especially under complex site conditions, is significantly lagging behind engineering practice. In this paper, detailed numerical analysis is carried out to reveal the force and deformation mechanism of the utility tunnels in non-homogeneous liquefiable sites under seismic action, analyze the effect of burial depth on the seismic response of the structure, and provide a basis for the structural design and construction of the utility tunnel in layered liquefiable sites.
2. Numerical Analysis Setup
2.1. Geometric Models
In this study, a hypothetical saturated layered soil of 20 m thickness is considered, comprising a 10 m-thick non-liquefiable soil in the lower layer, a 2 m-thick non-liquefiable soil in the upper layer, and an 8 m-thick liquefiable layer located at a depth of 2 m–10 m between the two non-liquefiable layers, and the water table is assumed to be at the ground surface. The underground structure is a typical one-story and three-span utility tunnel, based on the actual design of the utility tunnel project at Beijing Daxing International Airport. The structure has a height of 3.5 m, a width of 9.5 m, a longitudinal dimension of 20 m (i.e., the longitudinal dimension of the standard section of the utility tunnel), side walls and slabs with a thickness of 0.4 m, and internal partition walls with a thickness of 0.25 m. The structure is located at different depths of liquefiable soil in different models. In this study, five burial depths of 2 m, 2.5 m, 3 m, 3.5 m, and 4 m are set to analyze the effect of burial depth on the seismic response of the structure, as shown in Figure 2. Figure 3a shows the numerical model of the utility tunnel at a 2 m burial depth. In the following analysis, the mid-section S in the longitudinal direction of each model is selected as the control surface, and the grid of the control surface, the location of the control points, and the structural details of the utility tunnel are shown in Figure 3b.
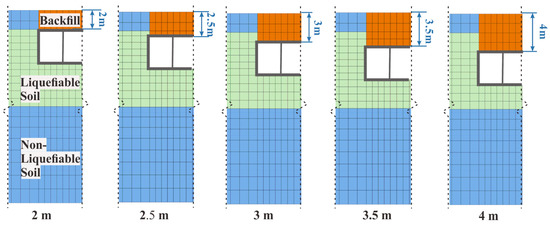
Figure 2.
Stratigraphic conditions and location of the utility tunnels in the numerical models.
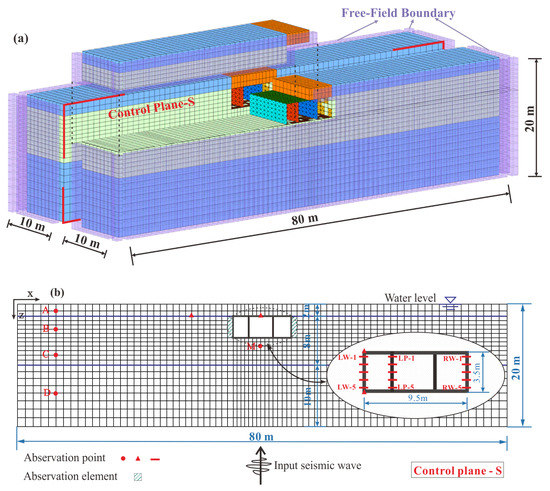
Figure 3.
Illustrations: (a) numerical model for the 2 m burial depth case, and (b) grid of the control surface S and control point locations.
2.2. Materials Properties and Parameters
In this study, the liquefiable soil is an 8 m-thick medium-saturated sand with a relative density of 45%, and the non-liquefiable soil above and below is silty clay in a plastic state. In the first stage (i.e., the static analysis), the excavation pit, underground utility tunnel application, and soil backfill are simulated [23]. The elastic–perfect-plastic Mohr–Coulomb damage criterion can represent the elastic and plastic characteristics of geotechnical materials with few and easily accessible parameters and is widely used in the numerical simulation of geotechnical materials. Therefore, the soils in the static analysis are modeled using the Mohr–Coulomb model for simplification. In the dynamic analysis, liquefiable sand is simulated using the Finn model. The Finn model establishes a relationship between cyclic shear strain and volumetric strain increments and can calculate the rise in pore pressure during shaking, thus providing a good simulation of the cyclic shear properties of sand [24]. The sand properties and liquefaction parameters are obtained from experiments on typical liquefiable sand from the study of Chen [25]; the silty clay parameters are obtained based on the results of geological exploration in Beijing, as shown in Table 1.

Table 1.
Material parameters used in the numerical model.
The members of the underground utility tunnel (top slab, bottom slab, side walls, and internal partition walls) are continuous in the longitudinal direction, so the strength indices of each member are calculated on a per-meter basis and the moment capacity and shear capacity are calculated based on the cross-sectional area, reinforcement distribution and material strength of the structural members. The bending moment capacities of the side walls and the internal partition walls are 226 kN·m/m and 90 kN·m/m, respectively, and the shear capacities are 374 kN/m and 191 kN/m, respectively. The underground structure is assumed to be elastic material with the elastic modulus and Poisson ratio of 32.5 GPa and 0.2, respectively. The top and bottom slabs and side walls of the utility tunnel are modeled with liner elements (a type of Shell-Type structural element in Flac3D) and the internal partition walls are modeled with shell elements (a type of Shell-Type structural element in Flac3D). The plastic hinges are set at the member connection. The plastic hinge allows for rotational discontinuities when the ultimate plastic moment is reached and is suitable for modeling the large strain, post-damage behavior of the structure. In this paper, the moment capacities of the members are used as the moment limit for the plastic hinges. To verify the plastic hinge, a wall of height 3.5 m with a cross-sectional area of 0.4 m × 1 m is built, as shown in Figure 4a, with the bottom connected to a fixed support with plastic hinges and horizontal displacement loads applied at the top. Figure 4b shows the relationship between the bending moment at the plastic hinge and the horizontal displacement load. The value of the moment at the plastic hinge remains constant after reaching the design capacity value and exhibits as elastic–perfectly plastic.
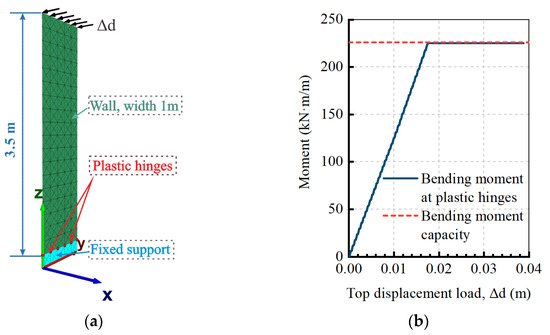
Figure 4.
(a) Wall with plastic hinges at members’ joint, and (b) bending moment at the plastic hinge under horizontal displacement load.
The liner elements control the shear and normal behavior of the structure–soil interface through the strength properties (TS, SS, δ) and stiffness properties (,) of the normal and shear springs. The strength properties include the tensile strength of the normal spring (TS), the cohesion of the shear spring (SS), and the friction angle (ϕ), set according to the physical properties of the soil in contact with the utility tunnel, as shown in Table 1. The normal and shear stiffness of the liner–soil interface is taken to be ten times the maximum equivalent stiffness of the surrounding soil as a rule of thumb [24]:
where: and are the bulk and shear modulus of the surrounding soil, respectively; and is the smallest width of an adjoining zone in the normal direction.
2.3. Damping of Materials
The stress–strain relationship of the soil during the dynamic process exhibits a strong nonlinear characteristic. In this paper, the shear modulus of liquefiable sandy soil decays with increasing shear strain and has some hysteresis properties. The hysteresis-type model is used as a supplement to one of the built-in nonlinear models in flac3d to represent the plastic yielding and hysteresis response of the material [24]. Four hysteresis-type models are available in Flac3D, of which Sig4 is a model with four parameters and more flexible control of the shear modulus and damping of sandy soils than the other models [7], the normalized secant modulus () can be calculated by fitting the formula:
is the logarithm of the shear strain, and , , , are the parameters fitted to the Sig4 model to control the shear modulus decay curve. A comparison of the shear modulus degradation curves using hysteresis damping in this paper and the experimental data [26] is shown in Figure 5. At very low cyclic strains, the use of hysteresis damping can induce noise in the calculation results, and the stability of the numerical simulation at low strains can be ensured by adding a small amount of Rayleigh damping [24]. α is the mass-proportional damping constant for Rayleigh damping, and β is the stiffness-proportional damping constant, both of which can be determined by the critical damping ratio () and the natural frequency of the oscillation (), as follows:
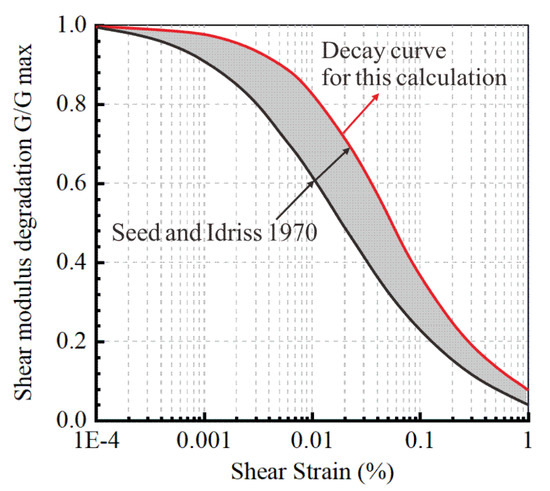
Figure 5.
Shear modulus reduction curve for sand compared with Seed and Idriss (1970) [26].
In this paper, liquefiable sand is added to Rayleigh damping with a critical damping ratio of 0.002 and a natural frequency of 2.22 Hz. Non-liquefiable soil uses local damping with a critical damping ratio of 5%.
2.4. Boundary Conditions and Input Ground Motion
The numerical simulations in this paper consist of two stages: static and dynamic analysis. It is assumed that the utility tunnel is located in a semi-infinite space, so appropriate boundary conditions need to be applied to the finite model. In the first stage (i.e., the static analysis), the four lateral boundaries are fixed in the normal direction, the bottom of the model is fixed horizontally and in the normal direction, and the ground surface is flat and unloaded. In static analysis, boundaries can be placed at some distance from the main study area. In dynamic analysis, however, fixed boundary conditions can cause the reflection of outward propagating waves back into the model [27]. Therefore, the free-field boundaries provided by Flac3D are used in the second stage to represent the lateral expansion of the far field. The free-field boundary of the model consists of four plane free-field grids at the sides and four column free-field grids at the corners, and the grid points of the free-field boundary correspond to the main grid one by one, as shown in Figure 3a. The plane free-field grid is a two-dimensional calculation and is assumed to extend infinitely in the normal direction of the plane. The column free-field grid is a one-dimensional calculation, which is assumed to extend infinitely in two horizontal directions [24]. The properties and initial conditions of the free-field boundaries are transferred from the adjacent main grid zones. The main grid zones are coupled to the free-field boundary grids by viscous dashpots, and the unbalanced forces from the free-field grids are applied to the main grids, the viscous dashpots on the boundary provide viscous traction that can absorb the waves propagating to the boundary [28], in this way, the use of free-field boundaries in the dynamic analysis minimizes wave reflection. Ground motion is applied in the form of a velocity wave in the horizontal direction at the bottom of the model.
The geological exploration data of Beijing Daxing International Airport Utility Tunnel shows that this is a Class III site with a design seismic grouping of Group One and an eight-degree site earthquake fortification intensity. The Uniform Hazard Spectrum (UHS) curve for the site is established according to the Chinese Code for Seismic Design of Buildings [29] (CCSDB). Ground motion matched to the UHS was selected from the Pacific Earthquake Engineering Research Centre (PEER) ground motion database. The earthquake data were obtained from records at the Port Hueneme monitoring station during the 1973 Point Mugu earthquake. The original seismic data was processed according to a similar study on the seismic response of underground stations in Chen [16]. The original ground motion was linearly matched to the UHS, then baseline corrected and low-pass filtered using the FISH function with a cut-off frequency of 15 Hz to remove high-frequency components that adversely affect wave propagation, resulting in the input ground motion, as shown in Figure 6, which correspond to the 10% in 50-year hazard level in the Daxing area of Beijing.
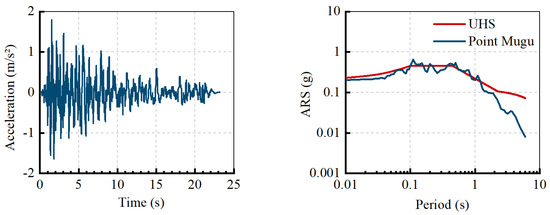
Figure 6.
Input ground motion acceleration time history and response spectrum.
3. General Characteristics of Seismic Response
3.1. Liquefaction Characteristics of Soils
To provide a comprehensive understanding of the seismic response of a non-homogeneous liquefiable soil-underground utility tunnel system, this section analyses the liquefaction characteristics of the soil, and the internal forces and uplift of the structure during the earthquake for the numerical model with a 2 m burial depth.
Control points are set in the far-field soils at different depths, where points A and D are located at the midpoints of the top and bottom non-liquefiable soils, respectively, and points B and C are located at different depths of the liquefiable layer. As can be seen from Figure 7, there is a significant attenuation of soil acceleration in the model compared to the input ground motion. The main manifestation of soil liquefaction is the accumulation of pore water pressure and the reduction in effective stress. The pore water pressure ratio, , the ratio of excess pore water pressure to initial vertical effective stress, is used in this study to represent the liquefaction of the soil [7]. Figure 8 shows the pore water pressure ratio (EPPR) of the soil at point B at −4 m depth, point C at −8 m depth in the far-field liquefaction layer, and point M under the center of the structure. Under seismic loading, the pore pressure ratios of the soils at points B and C in the far field do not reach 1.0, indicating that the soils have not yet liquefied here, but the pore pressure ratio at point B reaches 0.83 at 6.3 s and the pore pressure ratio at point C approaches 0.8 at 8.2 s, indicating a significant increase in excess pore water pressure in the soils. The pore water pressure of the soil below the structure grows rapidly: at 2.3 s, the pore pressure ratio reaches 1.0, and the soil liquefies; at 2.3 s to 6.5 s, the pore pressure ratio is relatively stable; at the later stages of ground motion, the excess pore water pressure of the soil beneath the structure dissipates rapidly, and the pore pressure ratio decreases.
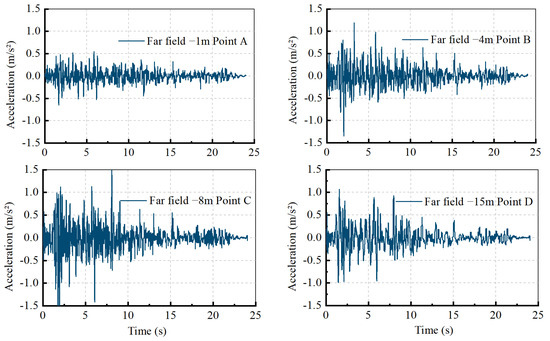
Figure 7.
Acceleration time histories of soils at different depths in the far field in the 2 m burial depth model.

Figure 8.
Time histories of pore water pressure ratios of soils at different locations in the 2 m burial depth model.
3.2. Seismic Response of the Structure
Underground structures are mainly subject to bending and shearing during ground motion. Figure 9 show the time histories of the shear force and bending moment at the bottom of the left side wall, respectively. The values of shear force and bending moment on the side wall of the utility tunnel in the 2 m burial depth model are much smaller than their design capacity. This is because the shallow burial depth of the structure is subjected to less soil pressure, and liquefaction reduces the restraint of the soil on the structure. Table 2 shows the maximum values of bending moment and shear force on the left wall and left inner partition wall of the structure, and the internal force of the side wall is much larger than the internal partition wall, which is consistent with the design of the utility tunnel. The main function of the internal partition wall is isolation and protection, and its design capacity is smaller than that of the side wall. The values of shear force and bending moment at the bottom of the left side wall are significantly larger than those at other locations of the structure and should be given more consideration in seismic design.

Figure 9.
Time histories of bending moment and shear force at the bottom of the left wall in the 2 m burial depth model.

Table 2.
Distribution of bending moments and shear forces of structural members in the 2 m burial depth model.
When the soil liquefies, it causes a certain amount of water to flow upward, the development of excess pore water pressure below the structure generates vertical unbalanced forces, and the structure is uplifted by the action of the surrounding liquefied soil, as shown in Figure 10. The soil on both sides of the structure moves toward the bottom of the structure to form a circulation loop during the earthquake. Figure 11 shows the vertical displacement of the middle point of the top slab and the soil around the structure (located at the same horizontal height as the top slab) during the earthquake, where the uplift of the structure is accompanied by the settlement of the surrounding soil. At about 2 s the pore water pressure ratio of the soil below the structure reaches 1.0, and the structure starts to float; from 2 s to 10 s, the vertical displacement of the structure increases significantly accompanied by strong ground motion; from 10 s to the end of the earthquake, the seismic acceleration amplitude decreases, the excess pore water pressure partially dissipates, the pore pressure ratio decreases, and the uplift of the structure gradually stabilizes.
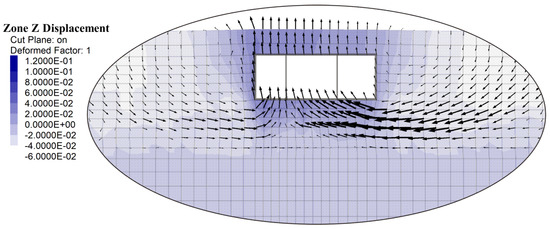
Figure 10.
Vertical displacement and displacement vector of the 2 m burial depth model at the end of the earthquake.
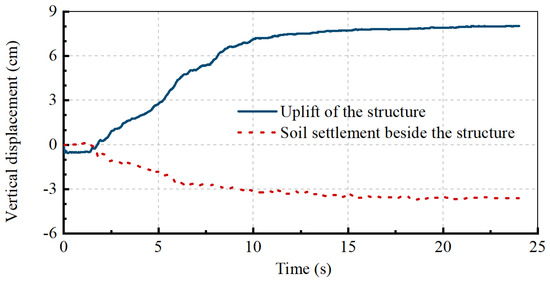
Figure 11.
Time histories of vertical displacement of the midpoint of the top slab and the surrounding soil in the 2 m burial depth model.
4. Effect of Burial Depth of Utility Tunnels
4.1. Effects of Burial Depth on the Structural Seismic Response
This section studies the effect of burial depth on the seismic performance of underground structures by analyzing the deformation, internal forces, and uplift of the utility tunnels, with drift ratio, bending moment and shear force, and vertical displacement of the structure as the measure.
The drift ratio is the inter-story displacement of underground structures normalized by height. The Chinese Code for Seismic Design of Buildings (CCSDB) [29] and Chinese Standard for Seismic Design of Underground Structures [30] are mostly consistent in taking 1/250 as the limit value for the elastic–plastic drift ratio of underground structures [31]. As it is shown in Table 3, the drift ratio of the utility tunnel in the earthquake increases with the burial depth, but in general, the effect of burial depth on the drift ratio is not significant. Because of the high stiffness of the structure, the drift ratio is much smaller than the threshold value in the code in all cases.

Table 3.
Maximum drift ratios of the structures in the five numerical models during the earthquake.
Figure 12 and Figure 13 show the envelope of the maximum and minimum moments and shear forces during the ground motion of the left wall for the five burial depth conditions, as well as the residual moments and shear forces, in addition to the design capacity values of the wall. The data in the figure show that the wall remains almost elastic in all conditions, and only in the 4 m burial depth condition, the shear force at the bottom of the wall briefly reaches the shear capacity and approaches the yield state. The residual values show that the distribution of bending moments on the wall is concave, and the bending moment values are larger at the junction of the wall and the top and bottom slabs, and these parts are susceptible to tensile damage; the shear forces at the bottom and top of the wall are larger and susceptible to shear damage. Meanwhile, the shear forces and bending moments distributed on the walls increase significantly with the increase in burial depths, the distributions are more uneven, and the growth of the internal forces at the bottom and top junctions with the slabs are significantly greater than that in the middle of the wall.

Figure 12.
Maximum and minimum envelopes, residual values, and design capacity value of the left wall moment distribution during the earthquake, the data in (a–e) are from numerical models for 2 m, 2.5 m, 3 m, 3.5 m and 4 m burial depths, respectively.

Figure 13.
Maximum and minimum envelopes, residual values, and design capacity value of the left wall shear force distribution during the earthquake, the data in (a–e) are from numerical models for 2 m, 2.5 m, 3 m, 3.5 m and 4 m burial depths, respectively.
Figure 14 shows the vertical displacement of the ground surface at the end of the earthquake when the utility tunnel is located at different depths. The structure uplifts and the soils near both sides of the structure settle; the uplift on the left side of the structure is larger than the right side due to the inhomogeneity of the input ground motion and the incomplete symmetry of the utility tunnel. With the increase in the structure covering depth, it can be seen that both the uplift and settlement values decrease significantly. When the burial depth of the structure changed from 2 m to 2.5 m, the change in the uplift value is not obvious; in contrast, when the burial depth increased from 3 m to 3.5 m, the vertical displacement decreased from 6.2 cm to 4.0 cm, and the uplift decreased to a greater extent; when the covering depth is 4 m, the uplift of the soil above the structure drops to 2.0 cm. This is partly due to the increase in overburden pressure; on the other hand, it is because the liquefaction ratio of the soil beneath the structure decreases with increasing depth, and the uplift behavior induced by excess pore water pressure is reduced.
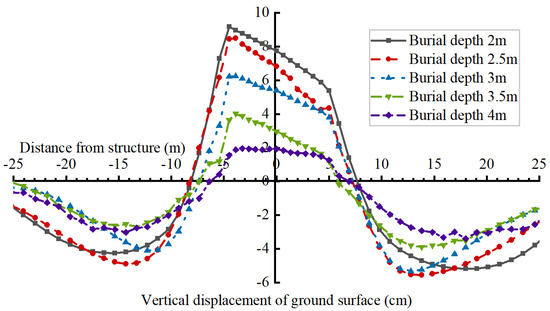
Figure 14.
Residual vertical displacement of the ground surface under five burial depth conditions.
Uplift of underground structures in liquefied soils is a serious form of damage, especially for constructions such as utility tunnels where the longitudinal dimension is much larger than the cross-sectional dimension. In practice, the stratum in the extension direction of the utility tunnel is usually not uniform, and the structure in the liquefiable and non-liquefiable areas will have large vertical displacement differences, which in turn will generate large shear forces in the direction perpendicular to the axis and induce damage to the structure. Increasing the burial depth of the underground structure increases the internal forces of the structure while significantly reducing the uplift, and usually, the underground structure has a large design strength, so appropriately increasing the burial depth will increase the seismic stability.
4.2. Structure–Soil Interactions
The structure–soil interaction and the state of the soil impact structures’ seismic response during the earthquake. This section discusses the effect of burial depth on the structural seismic response by analyzing the normal forces on the left and right walls and the liquefaction ratio of the soil beneath the structure.
Figure 15 shows the distribution of the initial normal force on the left and right walls and the residual normal force at the end of the earthquake for five burial depths. The normal force on the wall is calculated over a longitudinal range of 1 m and is obtained by integrating the lateral earth pressure of the soil along the height of the wall. It can be seen that the normal force distribution on the wall at the end is larger than the initial state, and the growth of the normal force at the bottom of the wall is larger. Both normal force and normal force increment increase with burial depth, and the normal force increment at the bottom of the right wall of the model with a 3.5 m burial depth is 1.9 times that under 2 m burial depth, which increases the shear force of the structure.

Figure 15.
Normal force distribution of the left and right walls at the initial state and the end of the earthquake, the data in (a–e) are from numerical models for 2 m, 2.5 m, 3 m, 3.5 m and 4 m burial depths, respectively.
Underground structures are kept in balance under the action of uplift forces and anti-buoyancy forces, of which excess pore water pressure is an important part of the uplift forces. The development of excess pore water pressure in liquefiable soil beneath the structure during the earthquake alters the original balance, and the structure is uplifted under the action of vertical unbalance forces. Figure 16a,b show the time histories of the pore pressure ratio of the soils beneath the structure, and the vertical displacement at the midpoint of the top slab for the five burial depth conditions, respectively. As the burial depth increases, the liquefaction ratio of the soil beneath the structure decreases, and the structure’s uplift also decreases the combined effect of excess pore water pressure and vertical effective stress.
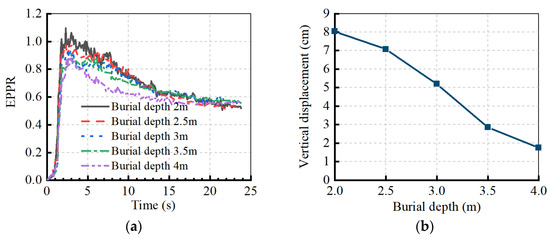
Figure 16.
Five burial depth conditions: (a) time histories of excess pore water pressure in the soils beneath the structure, and (b) vertical displacement at the midpoint of the top slab.
The rationality of the seismic behavior analysis of the utility tunnel is verified by comparing it with the research results in the existing literature. Mahmoud et al. (2020) [7] investigated the uplift response of the typical underground access structures in homogeneous liquefiable sands with different burial depths under seismic action by developing numerical models. The soils were loosely saturated sand with a relative density of 20%, and the 1988 Saguenay earthquake record (the earthquake amplitude was multiplied by a constant value to be compatible with the largest seismic zone in Québec) was used as the seismic load to study the effect of the 0–1 m burial depth range on the uplift displacement of the underground access structures. Figure 17a shows the vertical displacement of the midpoint of the top slab and the surrounding soil in Mahmoud’s calculation, and Figure 17b shows the uplift displacement of the underground access structure under different burial depth conditions. Comparing Figure 11 and Figure 17a, it can be seen that the uplift of different types of underground structures and the settlement of the surrounding soil at the liquefied site under seismic loading are in good agreement, from Figure 16b and Figure 17b, it also can be seen that the response of the uplift of the underground structure decreases with increasing burial depth is also consistent, so it can be considered that the numerical calculation results of this study for the seismic response of the underground utility tunnel are reasonable.
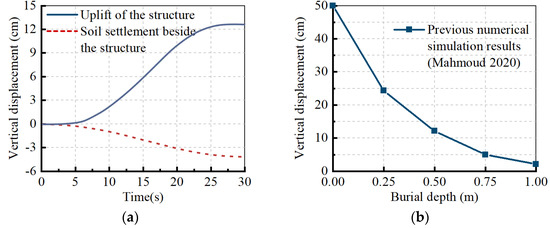
Figure 17.
Mahmoud et al. (2020) [7] numerical simulation results: (a) time histories of vertical displacement of the midpoint of the top slab and the surrounding soil, and (b) vertical displacement at the midpoint of the top slab at different burial depths.
5. Conclusions
In this paper, the seismic response of a one-story, three-span utility tunnel in a non-homogeneous liquefiable site is investigated using a finite-difference program (Flac3D). Numerical models for five burial depths of 2 m, 2.5 m, 3 m, 3.5 m, and 4 m are developed to study the effect of burial depths on seismic performance. Matching ground motion is selected as the input dynamic load in the PEER database based on the site-specific UHS. For the liquefiable layer, the Finn model is used to simulate the cyclic shear properties and the accumulation of pore water pressure. For non-liquefiable soils, the elastic–perfect-plastic Mohr–Coulomb model is used to represent the elastic and plastic characteristics of the material. Using structural elements model the utility tunnel, and plastic hinges are used at the connections of the members to simulate their plastic behavior. This paper analyzes the general force characteristics of the utility tunnel in liquefied soil and the uplift of the structure induced by excess pore water pressure, investigates the effect of burial depth on the structures’ seismic response, and draws the following conclusions from the numerical results:
- The internal forces of the side walls in the liquefied soil are greater than the internal partition walls under the earthquake; the bottom of the side wall has a large value of bending moment and shear force. The growth of excess pore water pressure in the soil beneath the structure generates vertical unbalance forces; the soil on both sides of the structure moves towards the underside of it; the utility tunnel uplifts under the action of the surrounding liquefied soil and thus fails;
- The burial depth of the underground utility tunnel has a great influence on its seismic response. The drift ratio, bending moment, and shear force of the structure under the condition of 4 m burial depth are the largest, and the shear force at the bottom of the left side wall is close to the shear capacity. The internal forces of the structure increase with the burial depth, and the normal forces acting on the side walls and their increments increase with the burial depth, among which the normal forces at the bottom of the side walls increase significantly. The increase in burial depth also significantly reduces the uplift of the utility tunnel; the overburden pressure and excess pore water pressure increase with burial depth, the pore pressure ratio decreases under the combined effect of the two, and the liquefaction of the soil below the structure decreases;
- Appropriately increasing the burial depth of the shallow-buried utility tunnel at the liquefiable site will improve its seismic stability.
The following remarks can be considered in future research:
- The characteristics of ground motion such as intensity, frequency, and duration can impact the seismic response of underground structures. Use the “Dynamic optimization with single dynamic loads” method to reduce the impact of “record-to-record variation” problems in seismic engineering on the results.
- The addition of haunch to the utility tunnel will improve the seismic performance of the members’ joints. In the numerical simulation, the structure with haunches should be modeled according to the practical situation.
- This paper investigates the seismic response of shallow-buried utility tunnels with burial depths of 2 m–4 m, and should further investigate the dynamic characteristics of deep-buried utility tunnels [32].
Author Contributions
Methodology, T.T. and A.Y.; Validation, T.T. and A.Y.; Data curation, T.T.; Writing—original draft, T.T.; Writing—review & editing, T.T., Y.L. and Y.G.; Project administration, A.Y. All authors have read and agreed to the published version of the manuscript.
Funding
This research was funded by the National Natural Science Foundation of China, grant number 52278384.
Institutional Review Board Statement
Not applicable.
Informed Consent Statement
Not applicable.
Data Availability Statement
Data is contained within the present article. Other data presented in this research are available in [7,26].
Conflicts of Interest
The authors declare no conflict of interest.
References
- Broere, W. Urban Underground Space: Solving the Problems of Today’s Cities. Tunn. Undergr. Space Technol. 2016, 55, 245–248. [Google Scholar] [CrossRef]
- Tokimatsu, K.; Asaka, Y. Effect of Liquefaction-Induced Ground Displacement on Pile Performance in The 1995 Hyogoken-Nambu Earthquake. Soils Found. 1998, 38, 163–177. [Google Scholar] [CrossRef]
- Yasuda, S.; Kiku, H. Uplift of Sewage Manholes and Pipes During the 2004 Niigataken-Chuetsu Earthquake. Soils Found. 2006, 46, 885–894. [Google Scholar] [CrossRef]
- Kang, G.; Tobita, T.; Lai, S.; Ge, L. Centrifuge Modeling and Mitigation of Manhole Uplift due to Liquefaction. J. Geotech. Geoenviron. Eng. 2013, 139, 458–469. [Google Scholar] [CrossRef]
- Schmidt, B.; Štimac, T.; Hashash, Y.M.A. Immersed Tube Retrofit. Tunn. Tunn. Int. 1998, 30, 22–24. [Google Scholar]
- Liu, H.; Song, E. Seismic Response of Large Underground Structures in Liquefiable Soils Subjected to Horizontal and Vertical Earthquake Excitations. Comput. Geotech. 2005, 32, 223–244. [Google Scholar] [CrossRef]
- Mahmoud, A.O.; Hussien, M.N.; Karray, M.; Chekired, M.; Bessette, C.; Jinga, L. Mitigation of Liquefaction-Induced Uplift of Underground Structures. Comput. Geotech. 2020, 125, 103663. [Google Scholar] [CrossRef]
- Chen, G.; Wang, Z.; Zuo, X.; Du, X.; Gao, H. Shaking Table Test on The Seismic Failure Characteristics of a Subway Station Structure on Liquefiable Ground. Earthq. Eng. Struct. Dyn. 2013, 42, 1489–1507. [Google Scholar] [CrossRef]
- Chian, S.C.; Tokimatsu, K.; Madabhushi, S.P.G. Soil Liquefaction–Induced Uplift of Underground Structures: Physical and Numerical Modeling. J. Geotech. Geoenviron. Eng. 2014, 140, 04014057. [Google Scholar] [CrossRef]
- Chen, G.; Chen, S.; Qi, C.; Du, X.; Wang, Z.; Chen, W. Shaking Table Tests on a Three-Arch Type Subway Station Structure in a Liquefiable Soil. Bull. Earthq. Eng. 2015, 13, 1675–1701. [Google Scholar] [CrossRef]
- Grigorios, T.; Emmanouil, R.; Kyriazis, P.; Jean Louis, C. Seismic Response of Box-Type Tunnels in Soft Soil: Experimental and Numerical Investigation. Tunn. Undergr. Space Technol. 2016, 59, 199–214. [Google Scholar] [CrossRef]
- Kheradi, H.; Nagano, K.; Nishi, H.; Zhang, F. 1-g Shaking Table Tests on Seismic Enhancement of Existing Box Culvert with Partial Ground-improvement Method and its 2D Dynamic Simulation. Soils Found. 2018, 58, 563–581. [Google Scholar] [CrossRef]
- Zhuang, H.; Hu, Z.; Wang, X.; Chen, G. Seismic Responses of a Large Underground Structure in Liquefied Soils by FEM Numerical Modelling. Bull. Earthq. Eng. 2015, 13, 3645–3668. [Google Scholar] [CrossRef]
- Deng, S.; Peng, W.; Lin, J. Numerical Analysis of Floatation Response of Buried Pipeline in Liquefied Soil. Appl. Mech. Mater. 2014, 580, 791–796. [Google Scholar] [CrossRef]
- Ahmed, E.; Yang, Z.; Ender, P. Computational Modeling of Cyclic Mobility and Post-Liquefaction Site Response. Soil Dyn. Earthq. Eng. 2002, 22, 259–271. [Google Scholar] [CrossRef]
- Chen, R.; Taiebat, M.; Wang, R.; Zhang, J.-M. Effects of Layered Liquefiable Deposits on The Seismic Response of an Underground Structure. Soil Dyn. Earthq. Eng. 2018, 113, 124–135. [Google Scholar] [CrossRef]
- Junichi, K.; Osamu, M.; Yasuyuki Ko, G.A. Uplift Behavior of Underground Structures Caused by Liquefaction of Surrounding Soil During Earthquake. Soils Found. 1997, 37, 97–108. [Google Scholar] [CrossRef]
- Azadi, M.; Mir Mohammad Hosseini, S.M. Analyses of the Effect of Seismic Behavior of Shallow Tunnels in Liquefiable Grounds. Tunn. Undergr. Space Technol. 2010, 25, 543–552. [Google Scholar] [CrossRef]
- Saeedzadeh, R.; Hataf, N. Uplift Response of Buried Pipelines in Saturated Sand Deposit under Earthquake Loading. Soil Dyn. Earthq. Eng. 2011, 31, 1378–1384. [Google Scholar] [CrossRef]
- Zheng, G.; Yang, P.; Zhou, H.; Zeng, C.; Yang, X.; He, X.; Yu, X. Evaluation of the Earthquake Induced Uplift Displacement of Tunnels Using Multivariate Adaptive Regression Splines. Comput. Geotech. 2019, 113, 103099. [Google Scholar] [CrossRef]
- Azadiab, M. The Seismic Behavior of Urban Tunnels in Soft Saturated Soils. Procedia Eng. 2011, 14, 3069–3075. [Google Scholar] [CrossRef]
- Azadi, M.; Mir Mohammad Hosseini, S.M. The Uplifting Behavior of Shallow Tunnels within the Liquefiable Soils under Cyclic Loadings. Tunn. Undergr. Space Technol. 2010, 25, 158–167. [Google Scholar] [CrossRef]
- Wang, R.; Fu, P.; Zhang, J.-M. Finite Element Model for Piles in Liquefiable Ground. Comput. Geotech. 2016, 72, 1–14. [Google Scholar] [CrossRef]
- Itasca, F.D. V6. 0, Fast Lagrangian Analysis of Continua in 3 Dimensions, User’s Guide; Itasca Consulting Group: Minneapolis, MN, USA, 2011; pp. 308–318. [Google Scholar]
- Chen, Y.; Xu, D. Foundation and Engineering Examples of FLAC/FLAC3D, 2nd ed.; Water and Power Press: Beijing, China, 2022. [Google Scholar]
- Seed, H.B.; Idriss, I.M. Soil Moduli and Damping Factors for Dynamics Response Analyses. EERC 1970. [Google Scholar] [CrossRef]
- Forcellini, D.; Tarantino, A.M. Countermeasures Assessment of Liquefaction-Induced Lateral Deformation in a Slope Ground System. J. Eng. 2013, 2013, 183068. [Google Scholar] [CrossRef]
- Cundall, P.A. NESSI-Soil Structure Interaction Program for Dynamic and Static Problems; Norwegian Geotechnical Institute: Oslo, Norway, 1980. [Google Scholar]
- Ministry of Housing and Urban-Rural Development of the People’s Republic of China. PRC National Standard GB 50011-2010; Code for Seismic Design of Buildings; China Architecture & Building Press: Beijing, China, 2010. [Google Scholar]
- Ministry of Housing and Urban-Rural Development of the People’s Republic of China. PRC National Standard. Standard for Seismic Design of Underground Structures; China Construction Industry Press: Beijing, China, 2018. [Google Scholar]
- Huang, M.; Bian, X.; Chen, Y.; Wang, R.; Gu, X.; Zhou, Y. Geodynamics and Geotechnical Earthquake Engineering. J. Civ. Eng. 2020, 53, 64–86. [Google Scholar] [CrossRef]
- Abdollahi, A.; Amini, A.; Hariri-Ardebili, M.A. An Uncertainty-Aware Dynamic Shape Optimization Framework: Gravity Dam Design. Reliab. Eng. Syst. Saf. 2022, 222, 108402. [Google Scholar] [CrossRef]
Publisher’s Note: MDPI stays neutral with regard to jurisdictional claims in published maps and institutional affiliations. |
© 2022 by the authors. Licensee MDPI, Basel, Switzerland. This article is an open access article distributed under the terms and conditions of the Creative Commons Attribution (CC BY) license (https://creativecommons.org/licenses/by/4.0/).