Article

Research on the Tunnel Boring Machine Selection Decision-Making Model Based on the Fuzzy Evaluation Method

1
Key Laboratory for Urban Underground Engineering of Ministry of Education, Beijing Jiaotong University, Beijing 100044, China
2
School of Civil Engineering, Beijing Jiaotong University, Beijing 100044, China
3
Xinjiang Erqis River Investment Development (Group) Co., Ltd., Urumqi 830002, China
4
State Key Laboratory of Shield Machine and Boring Technology, Zhengzhou 450001, China
*
Author to whom correspondence should be addressed.
Appl. Sci. 2022, 12(21), 10802; https://doi.org/10.3390/app122110802
Submission received: 13 October 2022 / Revised: 20 October 2022 / Accepted: 20 October 2022 / Published: 25 October 2022
(This article belongs to the Special Issue Advances in Tunnel and Underground Construction)

Abstract

:
When the tunnel boring machine (TBM) construction method is used to build tunnels, if the type of TBM is not appropriate, problems, such as low construction efficiency and increased construction cost, will easily occur. Therefore, it is necessary to build a TBM selection decision-making model to guide TBM selection. In this paper, seven evaluation indexes are selected according to engineering experience and expert suggestions, and the quantitative standards of each index are unified. The modified analytic hierarchy process (MAHP) method is used to determine the weight of each evaluation index. The technique for order preference by similarity to an ideal solution (TOPSIS) method is adopted as the decision-making method of TBM selection. Finally, a TBM selection decision-making model is proposed based on the above methods. In order to verify the reliability of the TBM selection decision-making model proposed in this paper, we selected three projects for case verification and compared them with the previous TBM selection methods. The results show that the decision-making results of the method proposed in this paper are good. Additionally, the method proposed in this paper is more comprehensive and accurate than the previous methods. The model proposed in this paper can provide better suggestions for TBM selection in the project planning stage.

1. Introduction

With the increasing demand for infrastructure construction, more and more long tunnels are being planned. The TBM construction method has been widely used in the construction of long tunnels because of its advantages of high tunnelling efficiency and good construction safety. However, these advantages can only be realized on the basis of correct TBM selection. When the TBM selection is wrong, TBM often has low tunnelling efficiency, frequent downtime and even casualties. For example, during the construction of the S tunnel in Japan, the open TBM frequently encountered the problem of jamming because of wrong TBM selection [1]. Goel (2016) summarized the problems of TBM in the construction of a Himalayan tunnel and found that wrong TBM selection was the direct reason for the low tunnelling efficiency [2]. Bilgin (2016) evaluated the performance and tunnelling efficiency of TBM when tunnelling in a fault fracture zone or soft surrounding rock, and the results showed that the New Australian Tunnelling Method (NATM) should be used instead of the TBM method in this stratum [3]. Gong et al. (2016) believed that TBM selection is an important countermeasure to solve TBM problems in complex strata, fault fracture zones, high in situ stress rock mass and limited excavation conditions. [4]. Therefore, it is very important to construct a TBM selection decision-making model so as to select the correct TBM for construction conditions in the project planning stage.
TBM construction involves construction management, geological conditions, adverse geology, rock–machine contact and electromechanical control. The most important of these are adverse geology and geological conditions. Geological conditions and adverse geology are difficult to quantify [5,6,7,8,9,10]. Many researchers have made many efforts to solve this problem. Choi (2004), based on the fuzzy concept, constructed a risk assessment methodology for an underground construction project [11]. Zhou (2011) proposed a fuzzy comprehensive evaluation method based on Bayesian networks to assess the risk of deep foundation pits [12]. Ki (2015) analyzed the construction risk of slagging, clamping and cutter damage during shield tunnel construction by combining fault tree analysis with AHP [13]. Wang (2017) constructed a decision-making model for risk analysis of subway construction projects, which combines the fuzzy comprehensive evaluation method with the Bayesian network [14]. Wei (2019) used trapezoidal fuzzy numbers to characterize the risk events and evaluate the risk during the construction of excavation [15]. Lin (2021) combined Pythagoras with triangular fuzzy numbers to construct a mixed fuzzy set for quantitative analysis of risk events in excavation [16]. Tan (2022) proposed an open TBM tunnelling adaptability evaluation method based on hydraulic engineering in Xinjiang and verified the reliability of this method through a case study [17]. It can be seen that there is a relatively mature application background to evaluate various problems of the tunnel and underground engineering by using fuzzy mathematics theory.
Many scholars have studied the TBM selection method. Shahriar (2007) constructed the TBM selection model by the decision tree method [18]. Hamidi (2010) analyzed the characteristics of open TBM, single-shield TBM and double-shield TBM. Additionally, this research group constructed a TBM selection model based on risk assessment [19]. Golestanifar (2011) used TOPSIS and fuzzy AHP methods to assess the suitability of various tunnel construction methods for the Ghomroud tunnel [20]. Abdolreza (2012) believes that TBM selection is a multi-objective decision-making problem, and he adopted the triangular fuzzy number and the TOPSIS method to select TBM [21]. In view of the geological problems of Jinping II Hydropower Station, Wu (2008) summarized the construction experience of TBM and put forward suggestions for TBM selection and construction measures [22]. Zhang (2010) analyzed the TBM selection of super-long tunnels by investigating a large number of documents [23]. Wang (2006) believed that TBM should be considered according to stratum conditions [24].
Previous studies have focused on adverse geology, essentially examining the utilization rate of TBM in adverse geology. However, the influence of geological conditions and the radius of the tunnel plane surface on TBM selection is also noteworthy. If geological conditions and the radius of the tunnel’s flat surface are not considered, misjudgment will easily occur in TBM selection. For example, in a tunnel containing only extremely hard rock, open TBM is usually preferred according to previous studies. However, in actual construction, the efficiency and economy of open TBM are much lower than that of the NATM method. If a tunnel with a small curvature radius is built in a stratum with more adverse geology, shield TBM is usually selected according to previous research methods. However, shield TBM is difficult to pass through the small curvature section according to the design route. In order to solve the above problems, this paper takes geological conditions, adverse geology and tunnel design as evaluation indexes and uses fuzzy theory to quantify the indexes. In this paper, the MAHP method is proposed by combining the modified weighting method with the AHP method. This can improve the accuracy of index weights. Finally, this paper combines the MAHP method and the TOPSIS method to build a TBM selection decision-making model. In order to verify the accuracy and advantages of the model, this paper conducts a case study and comparative study. The results show that the decision-making results are consistent with the actual situation and more comprehensive and accurate than the previous methods. The model can be further transformed into a program, which has a certain reference value for tunnels constructed by the TBM method.

2. TBM Selection Decision-Making Method

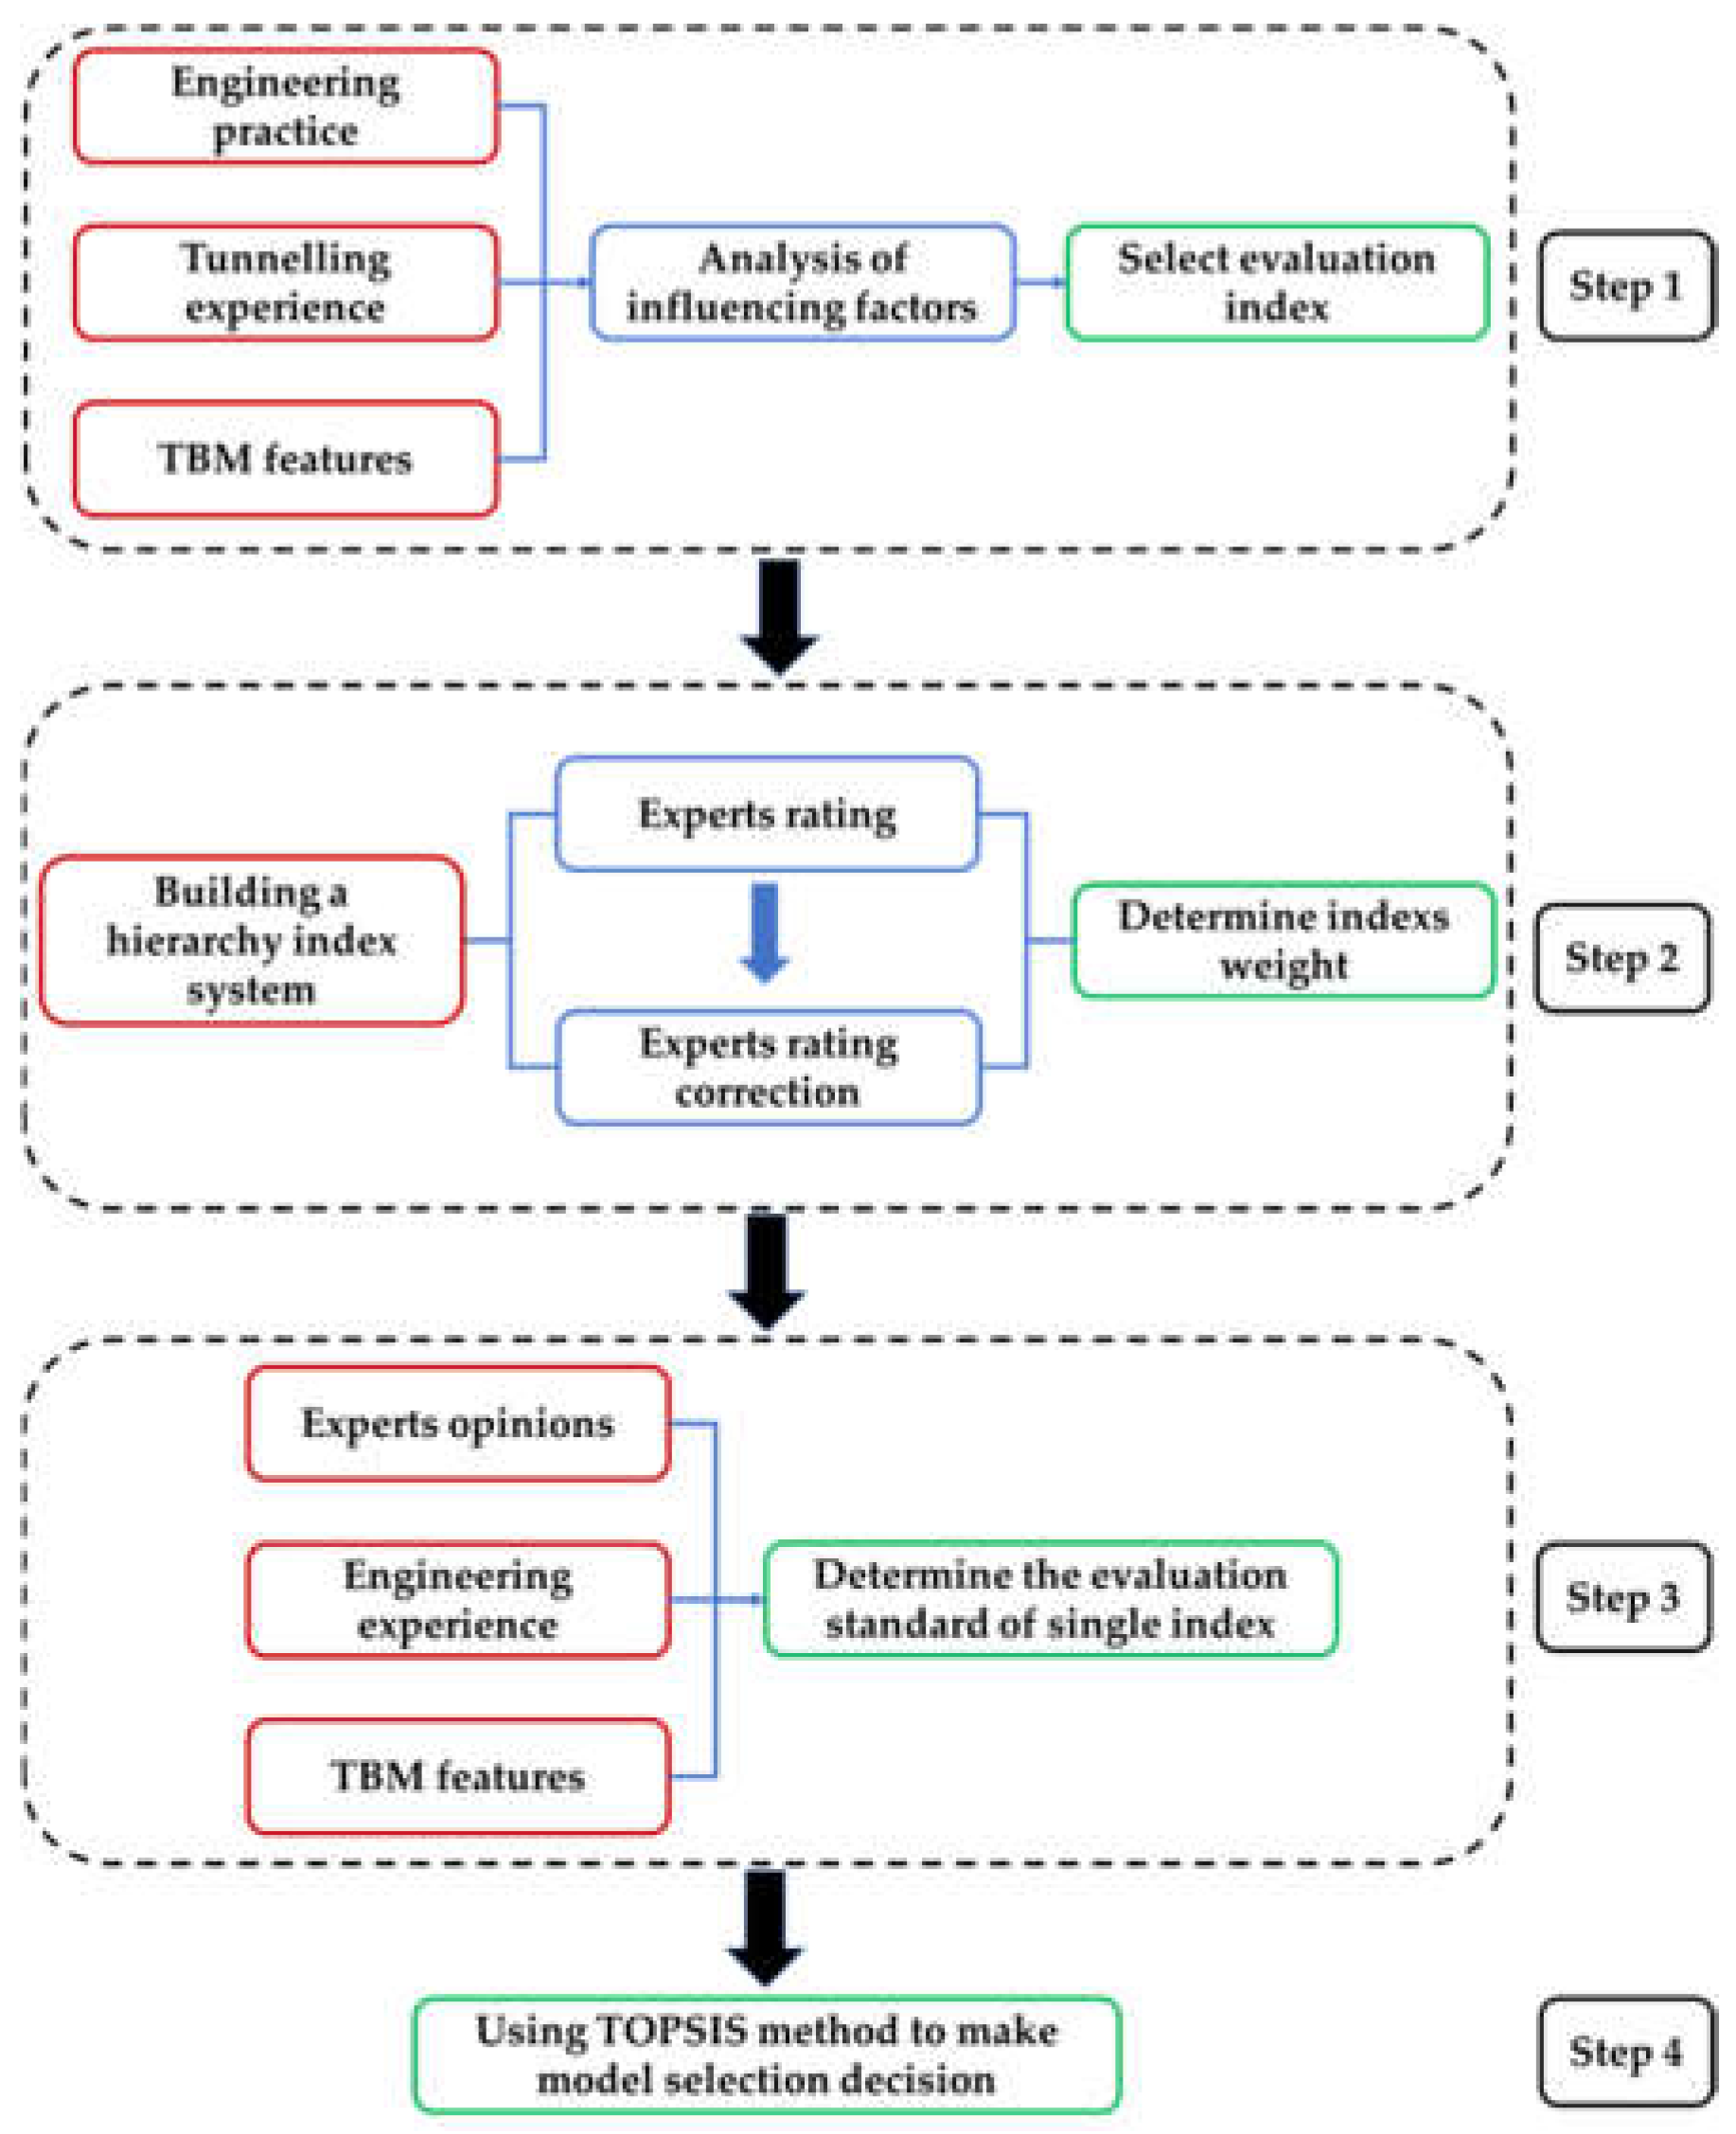
2.1. Method Overview

The TBM selection is limited by many factors. Therefore, it is very important for TBM tunnel construction to analyze and evaluate the influencing factors and select the most suitable TBM. The TBM selection decision-making model proposed in this section mainly includes four steps: 1. Analysis of influencing factors. 2. Determination of the evaluation index weight. 3. Establishing a single index evaluation standard. 4. TBM type selection decision. The first step mainly includes the collection, classification and screening of influencing factors. The second step mainly includes building a hierarchy index system, organizing experts to score, revising the experts’ scores and obtaining the weight of the evaluation index. The third step mainly includes investigating the literature and combining field experience to determine the adaptability of different types of TBM to a single index. The fourth step mainly includes TBM selection decision-making. The specific process is shown in Figure 1.

2.2. Analysis of Influencing Factors

When the TBM method is adopted for construction, appropriate TBMs shall be selected for construction according to different construction conditions. The TBMs mainly include the following three types: open TBM, single-shield TBM and double-shield TBM. In this study, the influencing factors of TBM selection are determined according to the engineering practice, TBM tunnelling experience and the comprehensive consideration of the advantages and disadvantages of the different types of TBM. This paper has summarized three main influencing factors as follows: 1. Geological conditions; 2. adverse geology; 3. tunnel design.
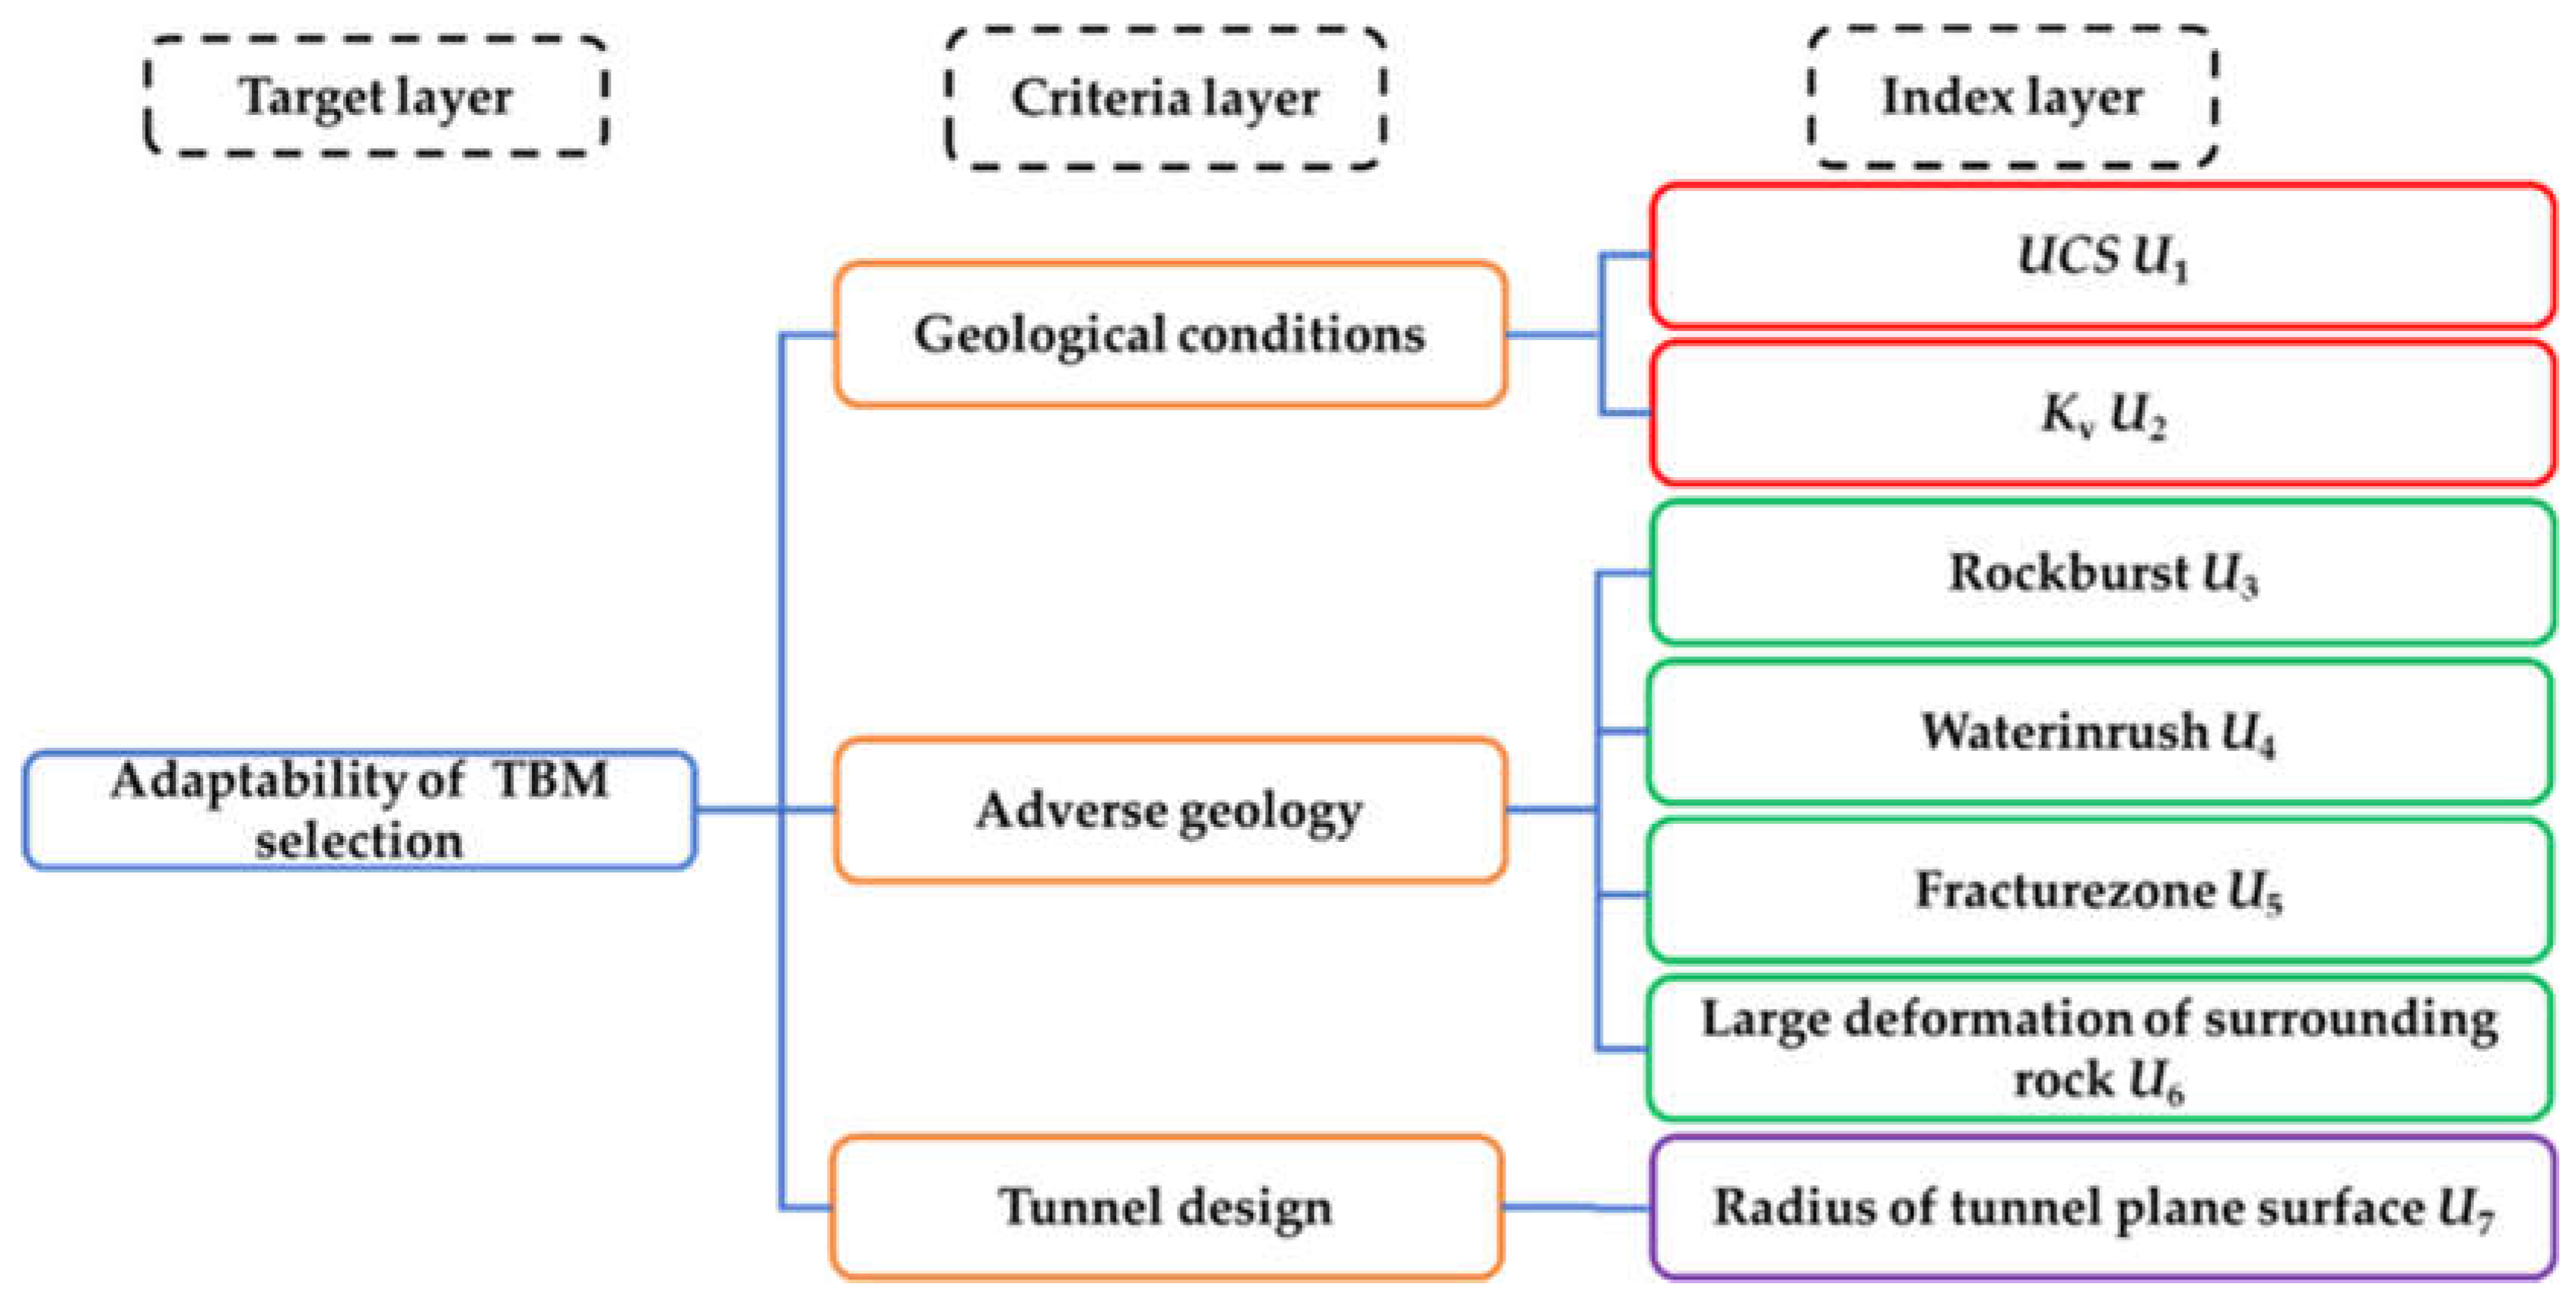
  • Geological conditions. One of the geological conditions affecting the TBM selection is the uniaxial compressive strength (UCS) of rock mass, and the other is the integrity of rock mass (Kv). Open TBM is mainly applicable to hard rock stratum with relatively complete rock mass. Single-shield TBM is mainly applicable to soft rock with a certain self-stabilizing ability. Double-shield TBM is mainly applicable to a soft rock~hard rock stratum with relatively complete rock mass and a certain self-stabilizing ability. Based on this, two factors affecting the TBM selection are determined, namely UCS and Kv.
  • Adverse geology. Adverse geology will lead to a significant reduction in TBM tunnelling efficiency, and even cause serious problems, such as TBM jamming and shutdown. Different types of TBM have different adaptability levels to adverse geology. For example, when the open TBM meets a rock burst disaster, the protection of personnel and equipment is poor. Shield TBM can resist rock bursts to a certain extent. After comprehensive consideration, four factors affecting adverse geology are determined in this paper, including rock burst, water inrush, fracture zone and large deformation of the surrounding rock.
  • Tunnel design. The design scheme of the tunnel will also limit the selection of TBM, and the turning radius of different types of TBM is different. Therefore, the size of the radius of the tunnel’s flat surface will limit the selection of TBM. In the aspect of tunnel design, one influencing factor is determined as the radius of the tunnel’s flat surface.

2.3. Determination Method of Evaluation Index Weight

2.3.1. Construction Requirements of Evaluation Index System

The evaluation index weight is determined by the MAHP method. First, according to the requirements of the AHP method, an evaluation index system consisting of the target layer, the criterion layer and the indicator layer is constructed. The target layer represents the problems to be solved by the analytic hierarchy process. The standard layer is the intermediate link of the analytic hierarchy process and represents the problems faced by the target layer. The index layer represents the detailed problems affecting the goals.
According to the nature and the target of the problem, the AHP decomposes the problem into different constituent factors. According to the interrelation between factors and their affiliation, factors are clustered and combined at different levels to form a multi-level analysis structure model. Thus, the problem can finally be summed up as the determination of the relatively important weight value of the lowest level (plans, measures, etc., for decision-making) relative to the highest level (overall goal) or the arrangement of the relative advantages and disadvantages. When using AHP, if the indexes are unreasonable, the quality of the AHP results will be reduced and may even lead to the failure of AHP decision-making. In order to ensure the rationality of the hierarchical structure, the following principles shall be adhered to:
  • Comprehend the main factors when decomposing and simplifying problems, and do not omit or select many;
  • Pay attention to the intensity relationship between the comparison elements, and the elements with too great a difference cannot be compared at the same level.

2.3.2. Expert Survey Scoring and Scoring Correction Method

The index weight of the AHP method is determined by experts. When scoring is conducted by experts, their subjectivity tends to reduce the reliability of scoring. Therefore, it is necessary to adopt some means to revise the scores of multiple experts so as to obtain more reliable scores. In order to improve the reliability of expert scoring, the modified weighting method was used to modify the scoring.
The method is as follows: First, select a number of experts to score. The scoring rule is the nine-scale method (see Table 1) [25]. The score of each expert is expressed by matrix An.
After that, the revised weighting method is adopted to reduce the subjectivity of experts’ scoring. The specific steps are as follows:
Step 1. Assign an initial weight of 1 to all expert scores of a single index;
Step 2. Calculate the initial weighted average value with Equation (1):
X ¯ ( 0 ) = i = 1 m P i ( 0 ) X i ( 0 ) i = 1 m P i ( 0 )
where X ¯ ( 0 ) is the score of the ith expert, P i ( 0 ) is the initial weight of the ith expert, and X i ( 0 ) is the initial weighted score of the ith expert. m is the number of experts;
Step 3. Take X ¯ ( 0 ) as the reference value and calculate the first correction weight with Equation (2):
μ i ( 1 ) = X max ( 0 ) X min ( 0 ) X ¯ ( 0 ) 2 | X i ( 0 ) X ¯ ( 0 ) | X ¯ ( 0 )
where μ i ( 1 ) is the correction weight of the ith expert in the first iteration, X max ( 0 ) is the maximum value of all expert scores, and X min ( 0 ) is the minimum value of all expert scores.
Step 4. Use Equation (3) to calculate the modified weight.
P i ( 1 ) = P i ( 0 ) + μ i ( 0 )
Then, iterate to X ¯ ( n + 1 ) = X ¯ ( n ) (two decimal places are reserved) according to this method, and X ¯ ( n + 1 ) is the final score. After the above method is adopted for all indexes, the matrix is constructed to obtain the revised expert scoring matrix Cn.

2.3.3. Determination Method of Index Weight

The modified expert scoring matrix Cn is used as the judgment matrix to calculate the weight, and the consistency test is carried out to prove whether the obtained weight is reliable.
First, the product of each row element of the matrix is normalized (see Equation (4)), αj is the eigenvector.
δ i = ( j = 1 n c i j ) 1 n α j = δ j i = 1 n δ i }
where n is the matrix order.
The maximum eigenvalue of the judgment matrix is calculated using Equation (5); λmax is the weight of each index.
λ max = 1 n i = 1 n j = 1 n a i j α j α i
At this time, it is necessary to perform consistency testing on the weight obtained. First, Equation (6) is used to calculate the consistency index CI.
C I = λ max n n 1
Then, the consistency index RI is obtained by Table 2 [26].
The random consistency ratio CR is used to judge whether the judgment matrix has satisfactory consistency. If the following conditions are met (see Equation (7)), it is proved that the judgment matrix meets the consistency requirements. If it does not meet the consistency test, it needs to be rescored.
C R = C I R I < 0.1
Finally, the weight vector Y is obtained.

2.4. Determination Method of Single Index Evaluation Standard

Determining the evaluation standard of each single index is the basis for realizing the comprehensive evaluation of TBM selection decision-making. This paper classifies the evaluation standard of TBM selection decision-making according to open TBM, single-shield TBM and double-shield TBM in combination with the literature research, expert opinions and engineering experience. Open TBM, single-shield TBM and double-shield TBM all have a relatively clear scope of application.
This paper summarizes the engineering experience, summarizes the characteristics of different types of TBM (see Table 3) and provides theoretical support for the single indicator adaptability evaluation standard [19,27,28,29]. In order to quantify and divide the adaptability of different indexes to different TBMs and improve the efficiency of the decision-making model, this paper uses fuzzy mathematics to divide the adaptability of TBMs into six grades: 0 indicates that any TBM construction is not suitable, 1 indicates that single-shield TBM construction is suitable, 2 indicates that single-shield TBM and double-shield TBM are suitable for construction, 3 indicates that double-shield TBM is suitable for construction, 4 indicates that double-shield TBM and open TBM are suitable for construction and 5 indicates that open TBM is suitable for construction.

2.5. TBM Selection Decision-Making Method

The basic principle of the TOPSIS method is to rank the evaluation objects by the distance between the positive ideal solution and the negative ideal solution in the multi-objective decision-making problem. Each index of the positive ideal solution is optimal, which can be understood as a virtual optimal solution, while the negative ideal solution is the complete opposite. The TOPSIS method sorts the evaluation objects according to the proximity of the evaluation objects to the idealized target and evaluates the relative advantages and disadvantages of the existing objects. If the evaluation object is closest to the positive ideal solution, it is the optimal value, otherwise, it is the worst value. TOPSIS is a commonly used and effective method in multi-objective decision analysis. The specific steps of the model developed in this paper are as follows:
Step 1. Build the initial evaluation matrix. Let the scheme set P = {P1, P2, ···, Pm} and the evaluation index set of each scheme r = {r1, r2, ···, rn}. The evaluation index rij refers to the jth evaluation index of the ith scheme, where i  [1, m] and j  [1, n], and the initial evaluation matrix can be expressed as Equation (8).
P = { r i j } n × m = ( r 11 r 12 r 1 j r 1 n r 21 r 22 r 2 j r 2 n r i 1 r i 2 r i j r i n r n 1 r n 2 r n j r m n )
Step 2. Weighted standardized decision matrix. In the TOPSIS method, the evaluation indexes can be divided into consumption indexes and profit indexes. For consumption indexes, the smaller the value, the better. For profit indexes, the larger the value, the better. Since each evaluation index has different dimensions and units of dimensions, it does not have comparability. In order to eliminate the incommensurability of the indexes, it is necessary to carry out dimensional unification of the evaluation indexes. For the standardized decision matrix, D = (dij)m × n. The calculation formula is shown as Equation (9):
{ d i j = r i j min ( r i j ) max ( r i j ) min ( r i j ) , when   d i j   is   profitability   index d i j = max ( r i j ) r i j max ( r i j ) min ( r i j ) , when   d i j   is   consumptive   index
Multiply the column vector of matrix D by the total ranking weight X of the index level determined by the AHP method to obtain the weighted standardized decision matrix R, shown as Equation (10).
R = { r i j } n × n = ( x 1 d 11 x 2 d 12 x j d 1 j x n d 1 n x 1 d 21 x 2 d 22 x j d 2 j x n d 2 n x 1 d i 1 x 2 d i 2 x j d i j x n d i n x 1 d n 1 x 2 d n 2 x j d n j x n d n n )
Step 3. Calculate the distance between positive and negative ideal solutions. The positive ideal solution of the revenue index set J1 is the maximum value of the row vector, and the negative ideal solution is the minimum value of the row vector. The value of the consumption index set J2 is opposite to that and can be expressed as Equation (11).
R + = { ( max x n d m n | m J 1 ) , ( min x n d m n | m J 2 ) } R = { ( min x n d m n | m J 1 ) , ( min x n d m n | m J 2 ) }
where R+ and R are the positive ideal solution and negative ideal solution, respectively. The distance between the evaluation object and the ideal solution is shown in Equation (12).
D i + = j = 1 n ( r i j r j + ) 2 D i = j = 1 n ( r i j r j ) 2
where Di+ and Di are the distance between the evaluation object and the positive ideal solution and the negative ideal solution, respectively; ri+ and ri are elements corresponding to Ri+ and Ri, respectively.
Step 4. TBM type selection adaptability decision. The adaptability of type selection is determined by the results of the proximity analysis of the TOPSIS method. The calculation formula of closeness analysis is shown as Equation (13).
C i + = D i D i + D i ( 0 C i + 1 )
When the evaluation object is a positive ideal solution, Ci+ = 1. When the evaluation object is a negative ideal solution, Ci+ = 0, In general, the value of the closeness degree Ci+ of the evaluation object is (0, 1); this reflects the degree to which the evaluation object is close to the rational solution. Finally, the adaptability evaluation vector [E1, E2, E3, E*] is obtained, where E1~E3 represents the critical value of adaptability of different types of TBM and E* represents the fitness of the evaluation object. When E* > E1, open TBM shall be selected; when E* (E1, E2), double-shield TBM shall be selected; and when E*  (E2, E3), single-shield TBM shall be selected.

2.6. Text Project Overview and Required Data Acquisition

In order to verify the model in this paper, three projects with different types of TBM are selected. The TBM used in these three projects has a very good tunnelling effect in actual tunnelling. The specific project overview is as follows:
Project 1. A hydraulic in Xinjiang. The project has a total length of 540 km, including Xe, KS and SS tunnels, which are mainly constructed by open TBM. According to the geological survey report, TBM passes through eight regional fault fracture zones. The basic seismic intensity of the region is level 7. The lithology of the tunnel is Variscan granite, Cretaceous mudstone and sandstone. The open TBM has a good tunnelling effect in this project. This paper selects the K2 + 310-K4 + 310 section of the KS tunnel, which is representative of this project, for verification.
Project 2. Rail transit project in the southwest. The strata exposed along the TM mountain tunnel section of a rail transit project in southwest China are mainly quaternary artificial fill, residual slope and landslide deposit, in addition to the Jurassic ZLJ, ZZC and Triassic XJH, LKP and JLJ formations. The TM mountain tunnel, a rail transit project in southwest China, is a two-tunnel, two-line, light-rail-dedicated tunnel. Tunnel mileage: YCK5 + 830~YCK11 + 460.908, tunnel length: 5630.908 m; among them, the TBM construction method is adopted for YCK 6 + 000~YCK 9 + 500 (about 3500 m). The single-shield TBM used in the project has good adaptability in this section.
Project 3. A tunnel project in the west. The tunnel is located in South Asia and belongs to the X-range. Most of the terrain is incomplete, gullies are well-developed and gully beams are alternate. The main exposed strata in the project area are Neogene Cenozoic (N1)—Quaternary Pleistocene (Qp) X Group sandy mudstone and Quaternary Holocene (Qh) loose deposits. Middle Siwalik (MSA): The lithology is mainly sandstone–mudstone interbedding with pseudoconglomerate strips, in which sandstone accounts for 60–70% and mudstone accounts for 30–40%. Thick layers are dominant. The rock mass in the sandstone-concentrated section is shallow weathering with high strength. The rock mass in the mudstone-concentrated section is weak and low strength. Local calcareous cemented sandstone is softened and loose. Due to the difference in weathering degree between sandstone and mudstone, the topography of the exposed section is incomplete and the gullies and beams are inter-related. Double-shield TBM used in the project has good adaptability in this section.
In this chapter, the above three projects are selected to verify the TBM selection decision-making method proposed by Section 2. See Table 4 for the data required by the model.

3. Result and Analysis

3.1. Determination of Evaluation Index Weight

3.1.1. Establishment of Evaluation Index System

According to Section 2.2, the geological conditions were: UCS (U1) and Kv (U2); adverse geology: rock burst (U3), water inrush (U4), fracture zone (U5) and large deformation of the surrounding rock (U6); tunnel design: the radius of tunnel flat surface (U7) is taken as the evaluation index and the evaluation index system of TBM selection decision-making is constructed according to the hierarchy structure (see Figure 2).

3.1.2. Determining Expert Scores

Through the method described in Section 2.3.2, the calculation process is shown in Table 5, Table 6, Table 7, Table 8 and Table 9. We calculated the revised expert score table in Table 10, Table 11 and Table 12.

3.1.3. Weight Determination by AHP

The weight obtained through the calculation of AHP is shown in Table 13, Table 14 and Table 15.
The weights of all evaluation indicators are shown in Table 16.

3.2. Determination of Single Index Evaluation Standard

According to the literature research and combined with the engineering experience, this paper adopts the method proposed in Section 2.4 to develop a single index evaluation standard, as shown in Table 17.

3.3. TBM Selection Decision-Making

According to the standards formulated in Table 9, the data in Table 4 are scored and the results are shown in Table 18.
According to the method proposed in Section 2.5, this section makes TBM selection decisions for the three projects proposed in the previous section. A score of 0 represents a critical value that is not suitable for any TBM construction, 2 represents a critical value that is suitable for single-shield TBM and double-shield TBM construction and 4 represents a critical value that is suitable for double-shield TBM and open TBM construction. A value of 1 between 0 and 2 indicates that it is suitable to use single-shield TBM, a value of 3 between 2 and 4 indicates that it is suitable to use double-shield TBM and a value of 5 above 4 indicates that it is suitable to use open TBM. Using 0, 2 and 4 as the critical values for establishing the matrix can clearly determine the appropriate TBM type for the project. The above three scores are selected as the critical values of adaptability evaluation criteria to construct the evaluation matrix.
Step 1. This paper constructs the initial evaluation matrix according to the method proposed in Section 2.5. First, place the critical value as the scoring standards 4, 2 and 0 from large to small in the first, second and third lines of the matrix, respectively, and then place the actual scores of various indicators of different projects in the fourth line.
Project 1.
P 1 = ( 4 4 4 4 4 4 4 2 2 2 2 2 2 2 0 0 0 0 0 0 0 3 5 5 5 5 5 5 )
Project 2.
P 2 = ( 4 4 4 4 4 4 4 2 2 2 2 2 2 2 0 0 0 0 0 0 0 2 2 1 2 2 1 1 )
Project 3.
P 3 = ( 4 4 4 4 4 4 4 2 2 2 2 2 2 2 0 0 0 0 0 0 0 3 4 3 3 3 2 3 )
Step 2. Obtain the weighted standardized decision matrix.
Project 1 standardized the decision matrixes as follows.
R 1 = ( 0.1016 0.08128 0.05776 0.26 0.13528 0.12192 0.06248 0.0508 0.04064 0.02888 0.13 0.06764 0.06096 0.03124 0 0 0 0 0 0 0 0.0762 0.1016 0.0722 0.325 0.1691 0.1524 0.0781 )
Project 2 standardized the decision matrixes as follows.
R 2 = ( 0.1016 0.1016 0.0722 0.325 0.1691 0.1524 0.0781 0.0508 0.0508 0.0361 0.1625 0.08455 0.0762 0.03905 0 0 0 0 0 0 0 0.0508 0.0508 0.01805 0.1625 0.08455 0.0381 0.019525 )
Project 3 standardized the decision matrixes as follows.
R 3 = ( 0.1016 0.1016 0.0722 0.325 0.1691 0.1524 0.0781 0.0508 0.0508 0.0361 0.1625 0.08455 0.0762 0.03905 0 0 0 0 0 0 0 0.0762 0.1016 0.05415 0.24375 0.126825 0.0762 0.058575 )
Step 3. Calculate the distance between the positive and negative ideal solutions. Through Equations (11)–(13), the distance of the positive and negative ideal solution is obtained (see Table 19).
Step 4. TBM selection decision-making. Using Equation (13), the closeness vector of project 1 is [0.8, 0.409188, 0, 1], E1 = 0.8, E2 = 0.409188, E3 = 0, E* = 1 and E* > E1. Open TBM construction is recommended for the TBM selection decision-making model. The closeness vector of project 2 is [1, 0.5, 0, 0.456063], E1 = 1, E2 = 0.5, E3 = 0, E* = 0.456063 and E*  (E2, E3). Single-shield TBM construction is recommended for the TBM selection decision-making model. The closeness vector of project 3 is [1, 0.5, 0, 0.720969], E1 = 1, E2 = 0.5, E3 = 0, E* = 0.720969 and E*  (E1, E2). Double-shield TBM construction is recommended for the TBM selection decision-making model.
The geological condition of Project 1 is good. The rock mass is a medium-hard rock with excellent integrity. The open TBM can be driven quickly in this stratum and it is difficult to collapse the face. In terms of adverse geology, there are few rock bursts, water inrush and fault fracture zones, which can ensure the normal excavation of open TBM. In some areas, there is large deformation of the surrounding rock. In this type of terrain, open TBM jamming can be avoided by simply accelerating through. The turning radius of the tunnel is small, and open TBM can normally pass through. To sum up, Project 1 is suitable for open TBM construction.
The geological condition of Project 2 is poor. The rock mass is broken soft rock. The single-shield TBM can safely tunnel in this stratum, and the shield can provide protection when the tunnel sides and vault collapse. In terms of adverse geology, there are many small rock bursts, water inrush and fault fracture zones. Single-shield TBM can ensure normal tunnelling. Large deformation of the surrounding rock is lower, the risk of shield jamming is low, the turning radius of the tunnel is moderate, and single-shield TBM can pass through normally. To sum up, Project 2 is suitable for single-shield TBM construction.
The geological condition of Project 3 is good, the rock mass is relatively complete medium hard rock, and the open TBM and double-shield TBM can safely excavate in this stratum. However, there are many rock bursts, water inrush and fault fracture zones, and the open TBM is inefficient in tunnelling in this type of stratum. The selection of double-shield TBM can ensure normal tunnelling. The surrounding rock has less large deformation and the risk of shield jamming is low. The turning radius of the tunnel is large, and the double-shield TBM can pass through normally. To sum up, Project 3 is suitable for double-shield TBM construction.
The TBM decision-making model proposed in this paper is consistent with the actual situation, which proves that the decision-making model in this paper has a good decision level.

3.4. Comparison with Previous Methods

In order to compare the advantages of the TBM selection decision-making model proposed in this paper with the previous methods, Shahriar’s TBM selection method is selected as a comparison in this section.
According to Shahriar’s method, the disaster occurrence probability rating (see Table 20) for three projects, the disaster consequence rating (see Table 21) for three different TBMs and the final TBM risk index (see Table 22, Table 23 and Table 24) are provided.
Selection results: In Project 1, the risk rating of open TBM is 56 and that of single-shield and double-shield is 50. Shield TBM should be selected. In Project 2, the open TBM risk rating is 77 and the single-shield and double-shield TBM risk ratings are 55. Shield TBM should be selected. In Project 3, the open TBM risk rating is 83 and the single-shield and double-shield TBM risk ratings are 59. Shield TBM should be selected.
Project 1: The results of the selection of previous methods show that the construction risk of open TBM is the highest. Shield TBM should be selected for construction, which is inconsistent with the actual situation. The reason is that the previous methods pay more attention to construction risk and neglect the integrity of the rock mass and the radius of the tunnel curve. Risk rating indicates that the construction risk of open TBM is slightly higher than that of shield TBM. If the integrity of the rock mass and the radius of the tunnel curve are considered, the results of TBM selection will be more accurate.
Project 2 and Project 3: The selection results of previous methods show that the shield TBM is more appropriate, which is more consistent with the actual results. However, the previous methods did not establish a clear boundary between single-shield TBM and double-shield TBM. The method proposed in this paper can directly decide whether to use single-shield TBM or double-shield TBM.
Based on the results of the comparative study and previous research results, it has been found that Shahriar’s TBM selection method focuses on geological hazards and construction risks. In a tunnel with more adverse geology, it has a good selection decision effect. In addition to adverse geology, the method proposed in this paper also selects geological conditions and tunnel design indexes. Compared with previous studies, the TBM selection decision-making model is more comprehensive and more accurate.

4. Conclusions

Based on the fuzzy theory, this paper proposes a TBM selection decision-making model by combining the modified weighting method, AHP method and TOPSIS method. The model takes full account of engineering experience and expert opinions and combines them well. The revised weighting method is used to correct the expert score, which improves the reliability of the expert score. The fuzzy mathematics method is used to quantify each evaluation index and standardize each index, which improves the decision-making efficiency of the model. Based on engineering experience and expert opinions, this paper considers three factors (seven indexes) and finds that geological disasters have a great influence on TBM selection, which should be paid attention to in the project planning stage. The advantage of the TBM selection decision-making model proposed in this paper is that not only is the influence of geological disasters on TBM selection considered, but the geological conditions and tunnel design parameters are also introduced, which can improve the accuracy of the decision-making model. In order to show the application ability and advantages of this model, a case is provided and illustrated in this paper.

Author Contributions

Conceptualization, Z.T. and H.L.; methodology, Z.Z. and H.L.; software, Z.L. and H.L.; validation, Z.T., Z.L., Z.Z. and L.W.; investigation, H.L., Y.J. and F.L.; resources, Y.J., F.L. and L.W.; data curation, H.L., Y.J., F.L. and L.W.; writing—original draft preparation, H.L.; writing—review and editing, Z.L.; visualization, H.L.; supervision, Z.Z.; project administration, Z.T. All authors have read and agreed to the published version of the manuscript.

Funding

This research received no external funding.

Institutional Review Board Statement

Not applicable.

Informed Consent Statement

Not applicable.

Data Availability Statement

The data are contained within the article. The data presented in this study are available on request from the corresponding author.

Conflicts of Interest

The authors declare no conflict of interest.

References

  1. Koizumi, Y.; Inaba, T.; Yamamoto, T. Theoretical analysis and seismic investigation for TBM jamming in squeezing fissile slate. Tunn. Undergr. Space Technol. 2016, 57, 284–286. [Google Scholar] [CrossRef]
  2. Goel, R.K. Experiences and lessons from the use of TBM in the Himalaya—A review. Tunn. Undergr. Space Technol. 2016, 57, 277–283. [Google Scholar] [CrossRef]
  3. Bilgin, N. An appraisal of TBM performances in Turkey in difficult ground conditions and some recommendations. Tunn. Undergr. Space Technol. 2016, 57, 265–276. [Google Scholar] [CrossRef]
  4. Gong, Q.; Yin, L.; Ma, H.; Zhao, J. TBM tunnelling under adverse geological conditions: An overview. Tunn. Undergr. Space Technol. 2016, 57, 4–17. [Google Scholar] [CrossRef]
  5. Zhang, J.Z.; Huang, H.W.; Zhang, D.M.; Zhou, M.L.; Tang, C.; Liu, D.J. Effect of ground surface surcharge on deformational performance of tunnel in spatially variable soil. Comput. Geotech. 2021, 136, 104229. [Google Scholar] [CrossRef]
  6. Zhang, J.Z.; Phoon, K.K.; Zhang, D.M.; Huang, H.W.; Tang, C. Novel approach to estimate vertical scale of fluctuation based on CPT data using convolutional neural networks. Eng. Geol. 2021, 294, 106342. [Google Scholar] [CrossRef]
  7. YTao, Q.; Sun, H.L.; Cai, Y.Q. Predictions of deep excavation responses considering model uncertainty: Integrating BiLSTM neural networks with Bayesian updating. Int. J. Geomech. 2021, 22, 04021250. [Google Scholar] [CrossRef]
  8. Zhang, J.Z.; Huang, H.W.; Zhang, D.M.; Phoon, K.K.; Liu, Z.Q.; Tang, C. Quantitative evaluation of geological uncertainty and its influence on tunnel structural performance using improved coupled Markov chain. Acta Geotech. 2021, 16, 3709–3724. [Google Scholar] [CrossRef]
  9. Phoon, K.K.; Kulhawy, F.H. Characterization of geotechnical variability. Can. Geotech. J. 1999, 36, 612–624. [Google Scholar] [CrossRef]
  10. Xu, C.J.; Wang, L.; Tien, Y.M.; Chen, J.M.; Juang, C.H. Robust design of rock slopes with multiple failure modes: Modeling uncertainty of estimated parameter statistics with fuzzy number. Environ. Earth Sci. 2014, 72, 2957–2969. [Google Scholar] [CrossRef]
  11. Choi, H.H.; Cho, H.N.; Seo, J.W. Risk assessment methodology for underground construction projects. J. Const. Eng. Manag. 2004, 130, 258–272. [Google Scholar] [CrossRef]
  12. Zhou, H.B.; Zhang, H. Risk assessment methodology for a deep foundation pit construction project in Shanghai, China. J. Const. Eng. Manag. 2011, 137, 1185–1194. [Google Scholar] [CrossRef]
  13. Hyun, K.C.; Min, S.; Choi, H.; Park, J.; Lee, I.M. Risk analysis using fault-tree analysis (FTA) and analytic hierarchy process (AHP) applicable to shield TBM tunnels. Tunn. Undergr. Space Technol. 2015, 49, 121–129. [Google Scholar] [CrossRef]
  14. Wang, Z.Z.; Chen, C. Fuzzy comprehensive Bayesian network-based safety risk assessment for metro construction projects. Tunn. Undergr. Space Technol. 2017, 70, 330–342. [Google Scholar] [CrossRef]
  15. Wei, D.; Xu, D.; Zhang, Y. A fuzzy evidential reasoning-based approach for risk assessment of deep foundation pit. Tunn. Undergr. Space Technol. 2020, 97, 103232.1–103232.16. [Google Scholar] [CrossRef]
  16. Lin, S.S.; Zhang, N.; Zhou, A.; Shen, S.L. Risk evaluation of excavation based on fuzzy decision-making model. Autom. Constr. 2022, 136, 104143. [Google Scholar] [CrossRef]
  17. Tan, Z.; Li, Z.; Zhou, Z.; Lai, H.; Jiao, Y.; Li, F.; Wang, L. Research on an Evaluation Method for the Adaptability of TBM Tunnelling. Appl. Sci. 2022, 12, 4590. [Google Scholar] [CrossRef]
  18. Shahriar, K.; Sharifzadeh, M.; Hamidi, J.K. Geotechnical risk assessment based approach for rock TBM selection in difficult ground conditions. Tunn. Undergr. Space Technol. 2008, 23, 318–325. [Google Scholar] [CrossRef]
  19. Khademi Hamidi, J.; Shahriar, K.; Rezai, B.; Rostami, J.; Bejari, H. Risk assessment based selection of rock TBM for adverse geological conditions using Fuzzy-AHP. Bull. Eng. Geol. Environ. 2010, 69, 523–532. [Google Scholar] [CrossRef]
  20. Golestanifar, M.; Goshtasbi, K.; Jafarian, M.; Adnani, S. A multi-dimensional approach to the assessment of tunnel excavation methods. Int. J. Rock Mech. Min. Sci. 2011, 48, 1077–1085. [Google Scholar] [CrossRef]
  21. Yazdani-Chamzini, A.; Yakhchali, S.H. Tunnel Boring Machine (TBM) selection using fuzzy multicriteria decision making methods. Tunn. Undergr. Space Technol. 2012, 30, 194–204. [Google Scholar] [CrossRef]
  22. Wu, S.; Wang, G.; Xu, J.; Wang, J. Research on tbm type-selection and key construction technology for jinping ii hydropower station. Chin. J. Rock Mech. Eng. 2008, 27, 2000–2009. (In Chinese) [Google Scholar]
  23. Zhang, J.; Mei, Z.; Gao, J.; Tang, Y.; Zhang, Y. Study on TBM Type-selection and Key Technologies in Dahuofang Water Diversion Tunnel. Mod. Tunn. Technol. 2010, 47, 1–10. (In Chinese) [Google Scholar] [CrossRef]
  24. Wang, M. Type Selection of Shield TBMs and Hard Rock TBMs for Different Geological Conditions. Tunn. Constr. 2006, 2, 1–3, 8. (In Chinese) [Google Scholar]
  25. Zhang, Z.; Liu, X.; Yang, S. A Note on the 1-9 Scale and Index Scale in AHP; Springer: Berlin/Heidelberg, Germany, 2009. [Google Scholar]
  26. Deng, X.; Li, J.; Zeng, H.; Chen, J.; Zhao, J. Research on computation methods of AHP wight vector and its application. Mathmatics Pract. Theory 2012, 42, 93–100. (In Chinese) [Google Scholar]
  27. Mao, W. An Exploration into the Choice of the Right Type of Tunnel-Boring Machines(TBM). Traffic Eng. Technol. Natl. Def. 2011, 9, 4, 15–17. (In Chinese) [Google Scholar] [CrossRef]
  28. Zhan, J. Method and Decision Support System for Evaluating TBM Selection and Tunneling Adaptability Based on Artificial Intelligence. Ph.D. Thesis, Beijing Jiaotong University, Beijing, China, 2019. (In Chinese). [Google Scholar]
  29. Zhou, Z.; Tan, Z.; Li, Z.; Ma, D.; Zhao, J.; Lei, K. A Data Mining Based Prediction Model for Penetration Rate. J. Basic Sci. Eng. 2021, 29, 1201–1219. (In Chinese) [Google Scholar] [CrossRef]
Figure 1. Flow chart of TBM selection decision-making model.
Applsci 12 10802 g001
Figure 2. Evaluation index system of TBM selection decision-making.
Applsci 12 10802 g002
Table 1. Scoring criteria of nine-scale method.
ScaleDefinition
1Factor “i” is as important as factor “j”.
3Factor “i” is slightly more important than factor “j”.
5Factor “i” is more important than factor “j”.
7Factor “i” is strongly more important than the factor “j”.
9Factor “i” is definitely more important than the factor “j”.
2, 4, 6, 8Intermediate state scale value.
ReciprocalInversely proportional.
Table 2. RI value.
Table 2. RI value.
n123456789
RI000.580.901.121.241.321.411.45
Table 3. Characteristics of various types of TBM.
Open TBMDouble-Shield TBMSingle-Shield TBM
It is difficult to construct under the conditions of soft and broken surrounding rock;
In case of geological disasters such as rock bursts, the protection ability of personnel is poor;
When encountering the surrounding rock with strong convergence, the ability to escape from difficulties is good;
Compared with shield TBM, it has a higher economy;
Compared with shield TBM, the hole formation time is longer;
Flexible means of initial support and forepoling;
Under suitable surrounding rock conditions, the penetration rate is fast; The flat surface radius adapts to a wide range;
The adaptability to adverse geology is extremely poor.
It can be constructed under the conditions of the soft and broken surrounding rock, mainly facing the medium hard rock and relatively complete soft rock stratum;
In case of geological disasters such as rock bursts, the protection ability of personnel is good;
When encountering the surrounding rock with strong convergence, the ability to escape from difficulties is poor;
Continuous construction is possible;
High construction cost;
Fast hole-forming speed;
When the surrounding rock is better, the penetration rate is faster;
The flat surface radius has a moderate adaptability range;
Good adaptability to adverse geology.
It can realize safe and rapid construction under the condition of soft and broken surrounding rock;
In case of geological disasters such as rock bursts, the protection ability of personnel is good;
When encountering the surrounding rock with strong convergence, the ability to escape from difficulties is poor;
The construction consists of two processes and cannot be constructed continuously;
High construction cost;
Fast hole-forming speed;
When the surrounding rock is better, the penetration rate is faster;
Flat surface radius adaptability is small; Poor adaptability to adverse geology.
Table 4. Data required by the model.
U1U2U3U4U5U6U7
Project 1680.686150.41300
Project 2450.460.540270.12600
Project 3700.602.120230.3400
Table 5. Correction of adverse geology score.
ExpertP1(0)μ1(0)P1(1)μ1(1)P1(2)μ1(2)P1(3)μ1(3)P1(4)
110.14061.14060.22891.22890.25741.25740.26601.2660
210.46501.46500.38111.38110.36101.36100.35541.3554
31−0.28660.7134−0.31390.6861−0.32170.6783−0.32400.6760
410.14061.14060.22891.22890.25741.25740.26601.2660
510.14061.14060.22891.22890.25741.25740.26601.2660
X ¯ (0) = 3.8000 X ¯ (1) = 3.6438 X ¯ (2) = 3.5978 X ¯ (3) = 3.5843 X ¯ (4) = 3.5804
Table 6. Correction of tunnel design score.
ExpertP1(0)μ1(0)P1(1)μ1(1)P1(2)
110.14141.14140.16711.1671
210.14141.14140.16711.1671
31−0.12800.8720−0.13880.8612
41−0.12800.8720−0.13880.8612
51−0.18190.8181−0.16640.8336
X ¯ (0) = 0.3833 X ¯ (1) = 0.3793 X ¯ (2) = 0.3778
Table 7. Correction of water inrush.
ExpertP1(0)μ1(0)P1(1)μ1(1)P1(2)μ1(2)P1(3)
11−0.16070.8393−0.12900.8710−0.11580.8842
21−0.16070.8393−0.12900.8710−0.11580.8842
31−0.29040.7096−0.31250.6875−0.32110.6789
41−0.29040.7096−0.31250.6875−0.32110.6789
51−0.16070.8393−0.12900.8710−0.11580.8842
X ¯ (0) = 2.4000 X ¯ (1) = 2.3605 X ¯ (2) = 2.3448 X ¯ (3) = 2.3386
Table 8. Correction of fracture zone.
ExpertP1(0)μ1(0)P1(1)μ1(1)P1(2)μ1(2)P1(3)
11−0.16070.8393−0.12900.8710−0.11580.8842
21−0.16070.8393−0.12900.8710−0.11580.8842
31−0.29040.7096−0.31250.6875−0.32110.6789
41−0.29040.7096−0.31250.6875−0.32110.6789
51−0.16070.8393−0.12900.8710−0.11580.8842
X ¯ (0) = 2.4000 X ¯ (1) = 2.3605 X ¯ (2) = 2.3448 X ¯ (3) = 2.3386
Table 9. Correction of large deformation of surrounding rock.
ExpertP1(0)μ1(0)P1(1)μ1(1)P1(2)μ1(2)P1(3)
110.02811.02810.12361.12360.14851.1485
210.02811.02810.12361.12360.14851.1485
310.02811.02810.12361.12360.14851.1485
41−0.39830.6017−0.43550.5645−0.44370.5563
510.02811.02810.12361.12360.14851.1485
X ¯ (0) = 2.1276 X ¯ (1) = 2.3605 X ¯ (2) = 2.1116 X ¯ (3) = 2.1080
Table 10. Modified scoring table of objectives to criteria.
Geological ConditionAdverse GeologyTunnel Design
Geological condition10.2792.632
Adverse geology3.5819.091
Tunnel design0.380.1101
Table 11. Modified scoring table of geological condition.
U1U2
U111
U211
Table 12. Modified scoring table of adverse geology.
U3U4U5U6
U310.2220.4270.474
U44.5111.9232.128
U52.340.52011.111
U62.110.4700.9001
Table 13. Index weight calculation of objectives to criteria.
Geological ConditionAdverse GeologyTunnel DesignIndex Weight
Geological condition10.2792.6320.2032
Adverse geology3.5819.0910.7187
Tunnel design0.380.11010.0781
Table 14. Index weight calculation of geological condition.
U1U2Index Weight
U1110.5
U2110.5
Table 15. Index weight calculation of adverse geology.
U3U4U5U6Index Weight
U310.2220.4270.4740.1004
U44.5111.9232.1280.4522
U52.340.52011.1110.2353
U62.110.4700.90010.2121
Table 16. Total weight of indexes.
IndexesIndex Weight
U10.1016
U20.1016
U30.0722
U40.3250
U50.1691
U60.1524
U70.0781
Table 17. Evaluation standard.
ScoreU1 (MPa)U2U3U4 (L/s)U5 (m)U6 (%)U7 (m)
5(100, 150](0.65, 0.75]>4(0, 5](0, 16](0.4, 0.45](300, 350]
4(80, 100](0.55, 0.65](2.5, 4](5, 15](16, 22.5](0.36, 0.4](350, 400]
3(60, 80](0.45, 0.50](2.0, 4](15, 20](22.5, 25](0.32, 0.36](400, 500]
2(30, 60](0.45, 0.50](1, 2.0](20, 45] (25, 30](0.28, 0.32](500, 600]
1(10, 30](0.35, 0.45](0, 1](45, 100](30, 40](0, 0.28](600, 800]
0(0, 10](0, 0.35]->100>40>0.45<300
Table 18. Scoring table of data required by the model.
U1U2U3U4U5U6U7
Project 13555555
Project 22212211
Project 33433323
Table 19. Positive and negative ideal solution distance.
Positive and Negative Ideal Solution Distance
Project 10.0883650.353460.2551750.176730.429985000.429985
Project 200.4352050.2176020.2176020.43520500.2411310.202175
Project 300.4352050.2176020.2176020.43520500.1246890.322176
Table 20. Rating of likelihood of hazard occurrence.
Geotechnical HazardsRating of Likelihood of Hazard Occurrence
Project 1Project 2Project 3
Hard and abrasive rock423
High water inrush233
Tunnel wall instability244
Tunnel face instability244
Karstic voids233
Fault zones223
Squeezing422
Table 21. Rating of consequences of hazard occurrence.
Geotechnical HazardsRating of Consequences of Hazard Occurrence
Open TBMDouble Shield TBMSingle Shield TBM
Hard and abrasive rock222
High water inrush422
Tunnel wall instability533
Tunnel face instability433
Karstic voids533
Fault zones422
Squeezing144
Table 22. TBM risk score of Project 1.
Geotechnical HazardsTBM Risk Score of Project 1
Open TBMDouble Shield TBMSingle Shield TBM
Hard and abrasive rock888
High water inrush844
Tunnel wall instability1066
Tunnel face instability866
Karstic voids1066
Fault zones844
Squeezing41616
Total565050
Table 23. TBM risk score of Project 2.
Geotechnical HazardsTBM Risk Score of Project 2
Open TBMDouble Shield TBMSingle Shield TBM
Hard and abrasive rock444
High water inrush1266
Tunnel wall instability201212
Tunnel face instability161212
Karstic voids1599
Fault zones844
Squeezing288
Total775555
Table 24. TBM risk score of Project 3.
Geotechnical HazardsTBM Risk Score of Project 3
Open TBMDouble Shield TBMSingle Shield TBM
Hard and abrasive rock666
High water inrush1266
Tunnel wall instability201212
Tunnel face instability161212
Karstic voids1599
Fault zones1266
Squeezing288
Total835959
Publisher’s Note: MDPI stays neutral with regard to jurisdictional claims in published maps and institutional affiliations.

