Abstract
This study aims to clarify the relationship between surface hardness and the peak interfacial frictional coefficient under different particle sizes. The relationship between particle size and the peak interfacial frictional coefficient with different surface hardness values has not been addressed in previous literature. A pile-soil interfacial shear test was conducted using a multifunctional interfacial shear instrument was developed in the laboratory. The influences of surface hardness and particle size on the shear characteristics of pile-soil interfaces and the peak interface friction coefficient were studied. The test results revealed that the interfacial shear stress-shear displacement curves showed typical softening behavior when the surface of the model pile was smooth. The difference in curve characteristics for different particle sizes gradually cleared as the surface hardness decreased. The initial shear stiffness of the interface increased with increasing surface hardness and decreased with increasing particle size. The peak interfacial friction coefficient decreased with increasing surface hardness for different particle sizes. Furthermore, the peak interface friction coefficient increased with increasing particle size when the surface was hard. However, when the surface was soft, the peak interfacial friction coefficient decreased with increasing particle size. The linear relationship between the peak interfacial friction coefficient and particle size for different surface hardness values was established.
1. Introduction
The shear characteristics of the pile-soil interface are influenced by many factors. Many studies have reported that the normal stress, relative density of sandy soil, particle size, structural material, and surface roughness are the main factors affecting the shear characteristics of the pile-soil interface [1,2,3,4,5,6,7,8,9,10,11,12,13,14,15,16]. Among these factors, the structural material, which has received much attention from researchers, is an important factor affecting the shear properties of the pile-soil interface. Potyondy [17] studied soil–structure interfacial shear tests of sandy soil with concrete, steel, and wood, and found that the interfacial friction angle was largest for sand with concrete, second largest for sand with wood and smallest for sand with steel. They concluded that the material difference could be attributed to the different surface roughness values. Tiwari and Al-Adhadh [18] and Gireesha and Muthukkumaran [19] also conducted soil–structure interfacial shear test studies on sand with concrete, wood, and steel, and verified the conclusions obtained by Potyondy [17]. Additionally, they claimed that, compared with concrete and wood, the surface of steel was smoother, and thus, the sand–steel interfacial friction angle was the smallest. In fact, different structural materials have significantly different surface hardness values. O’Rourke et al. [20] argued that interfacial shear failure of softer materials was dominated by sliding failure of sandy soil particles along the structural surface when the normal stress was low. With increasing normal stress, interfacial shear sliding failure gradually changed into the plowing of soil particles into the structural surface; that is, there was a significant plowing effect. Hence, the surface hardness of the structure had a significant effect on the interfacial shear characteristics. Dove and Frost [21] investigated shear mechanisms at interfaces between particles and relatively smooth materials using contact mechanics and basic friction theory, and revealed that for softer materials, as the normal stress increased, the contact area between the soil particles and structure surface increased. Soil particles quickly moved into the structure surface during the interfacial shearing process, which increased interfacial shear stress for softer materials. Thus, surface hardness has a significant effect on interfacial shear properties. Furthermore, Martinez and Frost [22] and Hebeler et al. [23] proposed that surface hardness had a significant effect on interfacial shear properties. Obviously, there is a limitation to attributing the change in the peak interfacial friction coefficient caused by the differences in structural material to only the difference in surface roughness. The difference in structural surface hardness is also an important factor affecting the peak interfacial friction coefficient, but previous studies did not clarify the relationship between structural surface hardness and the peak interfacial friction coefficient. Therefore, to clarify the relationship between the peak interfacial friction coefficient and surface hardness, it is necessary to conduct tests on the shear characteristics of the pile-soil interfaces with different surface hardness values.
There have been numerous studies on the influence of particle size on the shear characteristics of the pile-soil interface. Nardelli et al. [24] argued that the increase in particle size essentially increased the relative roughness of the soil–structure interface, which increased the interfacial shear strength. Dejong and Westgate [25] suggested that the interlocking effect between particles and the plowing effect between particles and structural surface were the main mechanisms leading to an increase of the peak interfacial friction coefficient. Uesugi and Kishida [26] and Lings and Dietz [27] reported that the interfacial friction angle or interfacial shear strength increased with increasing particle size. However, Han et al. [28] proposed that the interfacial friction angle decreased with increasing particle size. Additionally, Vangla and Gali [29] found that when the particle size matched the surface projections of the structure, there was a strong interlocking effect between soil particles and the structure surface that could significantly improve the interfacial shear strength. They proposed that under the conditions for maximum interlocking, the shear zone thickness reached its maximum value. Hence, the relationship between particle size and the peak interfacial friction coefficient remains controversial.
As discussed in the literature, there are limitations to the current knowledge about the influence of the shear properties of structural materials on the pile-soil interface, and the relationship between surface hardness and the peak interfacial friction coefficient remains unclear. Additionally, the relationship between particle size and the peak interfacial friction coefficient is still controversial. To solve the above problems, this study investigated the effects of surface hardness and particle size on the shear properties of pile-soil interfaces and their relationship with the peak interfacial friction coefficient by using a multifunctional interfacial shear instrument that was developed in this laboratory.
2. Materials and Methods
2.1. Test Sand
The test sand was Fujian Pingtan standard sand The three sands were classified as fine, medium, and coarse sands according to particle size, and the specific particle size distribution curve is shown in Figure 1. The basic physical properties are shown in Table 1. In this study, the experiment considered the effect of particle size, and a total of three particle sizes were selected: fine, medium, and coarse sands. The particle size distribution curve of the sandy soil is shown in Figure 1, and its basic physical parameters are shown in Table 1.
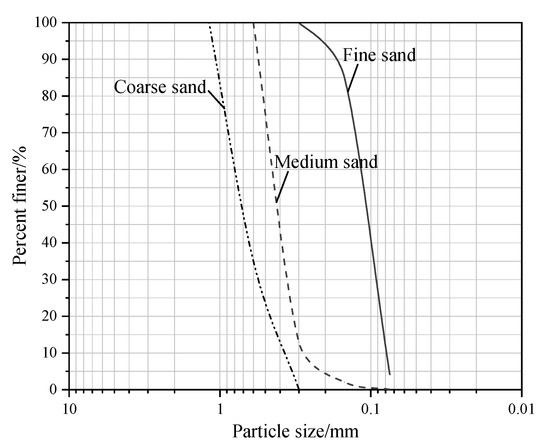
Figure 1.
Sandy soil particle size distribution curve.

Table 1.
The basic physical parameters of the sand.
2.2. Model Piles
In this study, three types of model piles were designed using different materials including #45 steel pile, aluminum alloy pile and polymethyl methacrylate (PMMA) pile. The #45 steel pile was processed by using steel shafts with good surface finish and straightness; the aluminum alloy pile was made by using 6061 type aluminum alloy pipe; and the PMMA pile was processed by using polymethyl methacrylate rods. The surface roughness of the model pile was described by referring to Frost et al. [30] and using the arithmetic mean Ra of the profile, and the surface roughness of the model pile was measured by a surface roughness tester (TR200). The surface roughness values of #45 steel pile, aluminum alloy pile and PMMA pile made in this study were all less than 0.002 mm, and thus were considered as smooth surfaces (Frost et al. [30]). In addition, the surface hardness of each model pile was measured by a Vickers hardness tester (HVTS-1000), and the physical parameters are shown in Table 2. The model piles made in this study are shown in Figure 2.
Table 2.
The physical parameters of model piles.
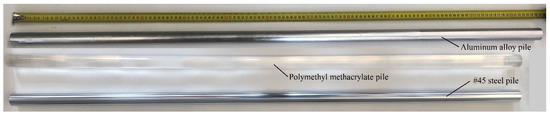
Figure 2.
Model piles.
2.3. Test Equipment
The multifunctional interfacial shear instrument (NHRI&HAUT-860) co-developed by the Nanjing Hydraulic Research Institute and Henan University of Technology was used to perform the pile-soil interfacial shear test. The device was mainly composed of a normal load control system, vertical load control system, data acquisition and storage system and air pluviation device. The device could apply a maximum normal stress of 1 MPa, a maximum vertical load of 20 kN, a maximum vertical displacement of 85 cm, a maximum drive rate of 25 mm/s, and a maximum soil sample size of 86 cm × 35 cm (height × diameter). In this study, the size of the soil sample was determined to be 66.8 cm × 25 cm, and the size of the corresponding rubber membrane was 90 cm × 25/25.4 cm (height × inner/outer diameter), which took into full consideration the role of the boundary at both ends of the soil sample in the tests. The range of the displacement meter was 10 cm with an accuracy of 0.001 cm; the range of the tension/compression force sensor was 20 kN with an accuracy of 0.01 kN. A schematic diagram of the multifunctional interfacial shear instrument is shown in Figure 3.
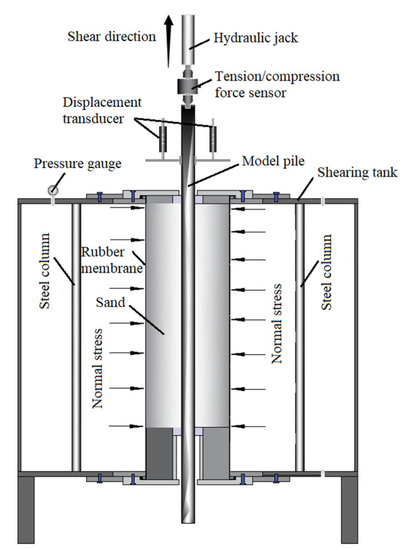
Figure 3.
Schematic of the multifunctional interfacial shear instrument.
2.4. Test Program
The preparation and test process of the interfacial shear specimen were as follows: installation and fixation of the model pile, soil sample preparation by the air pluviation method and encapsulation, data acquisition and storage of parameter settings, normal load application, and test shear parameter setting. The interfacial shear displacement was set to 90 mm, and the interfacial shear rate was 0.02 mm/s. The soil sample preparation is shown in Figure 4.
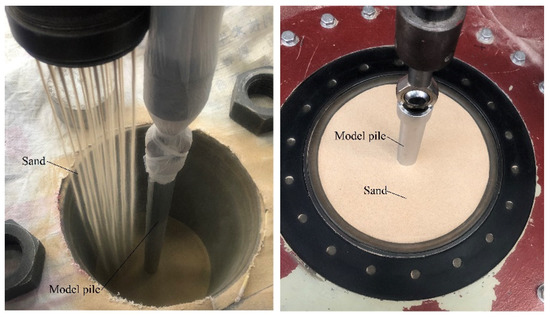
Figure 4.
Soil sample preparation.
In this study, the normal stress σn = 100 kPa and the relative density Dr = 0.7 were controlled. The effects of the surface hardness HV and particle size d on the pile-soil interface shear characteristics were studied. The test scheme is shown in Table 3.
Table 3.
Test scheme.
3. Results and Discussion
3.1. Interfacial Shear Characteristics
3.1.1. The Effect of Surface Hardness on Interfacial Shear Characteristics
The interfacial shear stress-shear displacement relationship curves for different surface hardness conditions with the same particle size are shown in Figure 5. The following results were obtained: (1) under different surface hardness conditions, the interfacial shear stress-shear displacement curve showed softening behavior where there was an obvious peak shear stress that was due to the smooth surface of the model pile in this test. The interfacial shear failure was a sliding failure along the model pile surface.
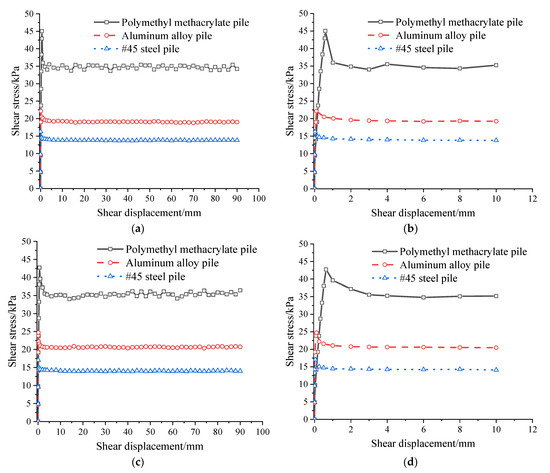
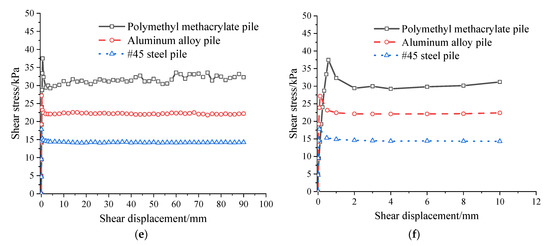
Figure 5.
Shear stress-shear displacement curves for different surface hardness. (a) Fine sand (0~90 mm). (b) Fine sand (0~10 mm). (c) Medium sand (0~90 mm). (d) Medium sand (0~10 mm). (e) Coarse sand (0~90 mm). (f) Coarse sand (0~10 mm).
(2) In the case of the PMMA pile, when the interfacial shear stress reached its peak after increasing with increasing shear displacement, there were obvious fluctuations in the interfacial shear stress, and the shear stress-shear displacement curves of the coarse sand and PMMA pile showed characteristics of softening and then hardening. Dejong and Westgate [25] and Deng et al. [31] argued that at normal stress, when the surface was softer, the contact area between the soil particles and the structure was larger. Thus, the surface of the structure was more susceptible to the plowing effect during the interfacial shear process, which was mainly manifest in the form of scratches and tears and increased surface roughness of the structure. Compared with the #45 steel pile and aluminum alloy pile, the surface of the PMMA pile was softer. The surface roughness of the PMMA pile increased with increasing shear displacement, which resulted in scratches and tears on the model pile surface, and the interfacial shear stress fluctuated. The plowing effect between coarse sand and PMMA pile is more significant during the interfacial shear process. Thus, the interfacial shear stress-shear displacement curve of coarse sand and the PMMA piles showed the characteristics of first softening and then hardening.
(3) The initial slope of the interfacial shear stress-shear displacement curve (initial interfacial shear stiffness) increased with increasing surface hardness for different particle sizes. For example, in the case of fine sand, the initial shear stiffness of the interface was 626.5 kPa/mm for #45 steel piles, 219.5 kPa/mm for aluminum alloy piles, and 76.4 kPa/mm for PMMA piles.
(4) The peak interfacial shear stress increased as the surface hardness decreased for different particle sizes. In the case of fine sand, the peak interfacial shear stress was 16.3 kPa for #45 steel, 22.2 kPa for aluminum alloy, and 45.1 kPa for the PMMA, which was due to the increase in contact area between soil particles and structure surface as the surface hardness decreased under normal stress, and the plowing effect was enhanced, which increased interfacial shear stress.
3.1.2. The Effect of Particle Size on Interfacial Shear Characteristics
At the same surface hardness, the interfacial shear stress-shear displacement relationship curves for different particle size conditions are shown in Figure 6. Figure 6 shows the following: (1) For different particle sizes, the harder the surface is, the smaller the difference in the interfacial shear stress-shear displacement curves, which was mainly related to the plowing effect generated during the interfacial shear process. The plowing effect between soil particles and pile surface was mainly related to the angularity of the soil particles and surface hardness. The softer the surface hardness is, the more obvious the plowing effect. Additionally, the larger the particle size is, the sharper the angularity of the soil particles, and the more significant the corresponding plowing effect.
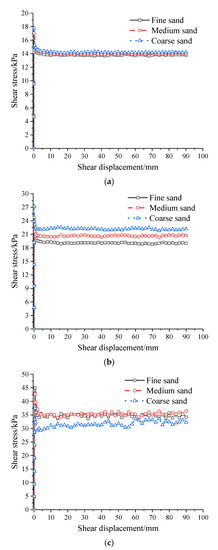
Figure 6.
Shear stress-shear displacement curves of sand for different particle sizes. (a) #45 steel pile (Surface hardness HV = 660). (b) Aluminum alloy pile (Surface hardness HV = 350). (c) PMMA pile (Surface hardness HV = 95).
(2) The initial slope of the interfacial shear stress-shear displacement curve (interfacial initial shear stiffness) decreased with increasing particle size for different surface hardness conditions. For the #45 steel pile, the initial shear stiffness of the interface was 626.5 kPa/mm for fine sand, 460.9 kPa/mm for medium sand, and 231.4 kPa/mm for coarse sand.
(3) The peak interfacial shear stress in the #45 steel pile and aluminum alloy pile decreased with increasing particle size. Taking #45 steel pile as an example, the peak interfacial shear stress was 16.3 kPa in fine sand, 17.1 kPa in medium sand, and 17.8 kPa in coarse sand. However, the peak interfacial shear stress in the PMMA pile increased with increasing particle size. For a soft surface, the larger the particle size was, the smaller the contact area between the soil particles and the model pile surface. Thus, the interfacial shear process more easily produced the plowing effect, and the peak interfacial shear stress decreased with increasing the particle size.
3.2. Peak Interfacial Friction Coefficient
Referring to the definition of the peak interfacial friction coefficient by Lee and Manjunath [32] and Wang et al. [33], the ratio of peak interfacial shear stress to normal stress in the test was taken as the peak interfacial friction coefficient in this study (Equation (1)), and the peak interfacial shear stress was selected as the maximum interfacial shear stress. The calculated peak interfacial friction coefficients are shown in Table 4.
Table 4.
List of the peak interface friction coefficient.
3.2.1. Relationship between Surface Hardness and Peak Interfacial Friction Coefficient
Figure 7 shows the relationship between surface hardness and peak interfacial friction coefficient for fine, medium, and coarse sands. Figure 7 shows that the peak interfacial friction coefficient decreased with increasing surface hardness for different particle sizes. The relationship curve between the peak interfacial friction coefficient and surface hardness changed from nonlinear to linear with increasing particle size, which was similar to the trend for peak interfacial shear stress reported in a previous paper.
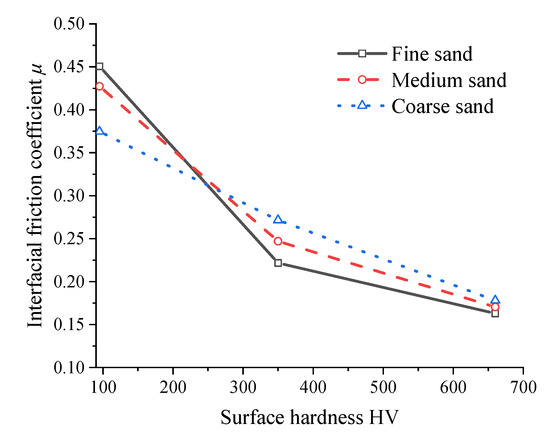
Figure 7.
Relationship between surface hardness and peak interfacial friction coefficient.
3.2.2. Relationship between Particle Size and Peak Interfacial Friction Coefficient
The relationship between particle size and peak interfacial friction coefficient for different surface hardness values is given in Figure 8. According to Figure 8, there was a linearly increasing relationship between the peak interfacial friction coefficient and particle size for harder surfaces (HV = 660, 350), while the peak interfacial friction coefficient decreased linearly with increasing particle size for softer surfaces (HV = 95). Additionally, a linear relationship between the peak interfacial friction coefficient and particle size was established for different surface hardness values, as shown in Equations (2)–(4).
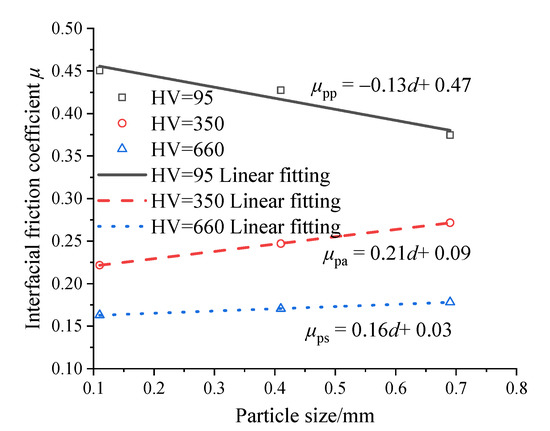
Figure 8.
Relationship between particle size and peak interface friction coefficient for different surface hardness values.
4. Conclusions
In this study, we conducted a pile-soil interfacial shear test using a multifunctional interfacial shear instrument developed in this laboratory and studied the effects of surface hardness and particle size on the pile-soil interface shear characteristics. We initially explored the relationships between the peak interfacial friction coefficient and surface hardness and particle size. The major conclusions are listed as follows:
(1) The interfacial shear stress-shear displacement curves showed typical softening behavior when the surface of the model pile was smooth. The difference in the curve characteristics for different particle sizes gradually clear, and the surface hardness decreased when the surface hardness was HV 95~660;
(2) The initial shear stiffness of the interface increased with increasing surface hardness and decreased with increasing particle size. The peak interfacial shear stress decreased with increasing surface hardness for different particle sizes. The peak interfacial shear stress increased with increasing particle size when the surface hardness was HV 350~660 and decreased with increasing particle size when the surface hardness value of HV 95. Meanwhile, the peak interfacial shear stress does not strictly increase with the enhancement of the “plowing effect” but is related to the surface hardness;
(3) The peak interfacial friction coefficient decreased with increasing surface hardness for different particle sizes. The peak interfacial friction coefficient increased with increasing particle size when the surface hardness was HV 350~660 but decreased with increasing particle size when the hardness value of HV 95. Additionally, the linear relationship between the peak interfacial friction coefficient and particle size was established for different surface hardness values; the measured peak interfacial friction coefficient was 0.37~0.45 for surface hardness HV 95, 0.22~0.27 for surface hardness HV 350 and 0.16~0.18 for surface hardness HV 660.
Author Contributions
Data curation, X.Z.; Formal analysis, X.Z. and Q.W.; Investigation, X.Z.; Methodology, X.Z.; Supervision, Z.X.; Writing—original draft, X.Z.; Writing—review & editing, Z.X. and Q.W. Funding acquisition, Q.W. All authors have read and agreed to the published version of the manuscript.
Funding
This research was funded by the National Natural Science Foundation of China grant Number [52079126] and the Tiptop Young Talent Program of Central Plains grant Number [ZYQR201912156].
Data Availability Statement
All data, models, and code generated or used during the study appear in the submitted article.
Acknowledgments
In particular, the author would like to thank the editor for the careful editing and layout of this article, as well as for the reviewer’s valuable comments and suggestions for this article. This paper has also been supported by the National Natural Science Foundation of China (grant No. 52079126) and the Tiptop Young Talent Program of Central Plains (grant No. ZYQR201912156).
Conflicts of Interest
The authors declare no conflict of interest.
Nomenclature
| τp | peak interfacial shear stress. |
| σn | normal stress. |
| μp | peak interface friction coefficient. |
| μpa | peak interfacial friction coefficient at aluminum alloy pile (HV = 350). |
| μpp | peak interfacial friction coefficient at Polymethyl methacrylate pile (HV = 95). |
| μps | peak interfacial friction coefficient at #45 steel pile (HV = 660). |
References
- Dejong, J.T.; Westgate, Z.J. Role of overconsolidation on sand–geomembrane interface response and material damage evolution. Geotext. Geomembr. 2005, 23, 486–512. [Google Scholar] [CrossRef]
- Dejong, J.T.; White, D.J.; Randolph, M.F. Microscale observation and modeling of soil–structure interface behavior using particle image velocimetry. Soils Found. 2006, 46, 15–28. [Google Scholar] [CrossRef]
- Frost, J.D.; Kim, D.; Lee, S.W. Microscale geomembrane–granular material interactions. KSCE J. Civ. Eng. 2012, 16, 79–92. [Google Scholar] [CrossRef]
- Taha, A.; Fall, M. Shear behavior of sensitive marine clay–concrete interfaces. J. Geotech. Geoenviron. Eng. 2013, 139, 644–650. [Google Scholar] [CrossRef]
- Chen, X.B.; Zhang, J.S.; Xiao, Y.J.; Li, J. Effect of roughness on shear behavior of red clay–concrete interface in large-scale direct shear tests. Can. Geotech. J. 2015, 52, 1122–1135. [Google Scholar] [CrossRef]
- Tehrani, F.S.; Han, F.; Salgado, R.; Prezzi, M.; Tovar, R.D.; Castro, A.G. Effect of surface roughness on the shaft resistance of non-displacement piles embedded in sand. Géotechnique 2016, 66, 386–400. [Google Scholar] [CrossRef]
- Yavari, N.; Tang, A.M.; Pereira, J.M.; Hassen, G. Effect of temperature on the shear strength of soils and the soil–structure interface. Can. Geotech. J. 2016, 53, 1186–1194. [Google Scholar] [CrossRef]
- Martinez, A.; Frost, J.D. Particle-scale effects on global axial and torsional interface shear behavior. Int. J. Numer. Anal. Methods Geomech. 2017, 41, 400–421. [Google Scholar] [CrossRef]
- Samanta, M.; Punetha, P.; Sharma, M. Influence of surface texture on sand–steel interface strength response. Géotech. Lett. 2018, 8, 40–48. [Google Scholar] [CrossRef]
- Tovar-Valencia, R.D.; Galvis-Castro, A.; Salgado, R.; Prezzi, M. Effect of surface roughness on the shaft resistance of displacement model piles in sand. J. Geotech. Geoenviron. Eng. 2018, 144, 04017120. [Google Scholar] [CrossRef]
- Rehman, Z.; Zhang, G. Shear coupling effect of monotonic and cyclic behavior of the interface between steel and gravel. Can. Geotech. J. 2019, 56, 876–884. [Google Scholar] [CrossRef]
- Rehman, Z.; Luo, F.; Wang, T.; Zhang, G. Large-scale test study on the three-dimensional behavior of the gravel–concrete interface of a CFR dam. Int. J. Geomech. 2020, 26, 04020046. [Google Scholar] [CrossRef]
- Zhou, W.J.; Guo, Z.; Wang, L.Z.; Rui, S.J. Sand–steel interface behaviour under large–displacement and cyclic shear. Soil Dyn. Earthq. Eng. 2020, 138, 106352. [Google Scholar] [CrossRef]
- Zhou, J.J.; Yu, J.J.; Gong, X.N.; Naggar, M.H.E.; Zhang, R. The effect of cemented soil strength on the frictional capacity of precast concrete pile-cemented soil interface. Acta Geotech. 2020, 15, 3271–3282. [Google Scholar] [CrossRef]
- Rehman, Z.; Zhang, G. Cyclic behavior of gravel–steel interface under varying rotational shear paths. Can. Geotech. J. 2021, 58, 305–316. [Google Scholar] [CrossRef]
- Rui, S.J.; Wang, L.Z.; Guo, Z.; Cheng, X.; Wu, B. Monotonic behavior of interface shear between carbonate sands and steel. Acta Geotech. 2021, 16, 167–187. [Google Scholar] [CrossRef]
- Potyondy, J.G. Skin friction between various soils and construction material. Géotechnique 1961, 11, 339–353. [Google Scholar] [CrossRef]
- Tiwari, B.; Al-Adhadh, A.R. Influence of relative density on static soil–structure frictional resistance of dry and saturated sand. Geotech. Geol. Eng. 2014, 32, 411–427. [Google Scholar] [CrossRef]
- Gireesha, T.; Muthukkumaran, K. Study on soil structure interface strength properties. Int. J. Earth Sci. Eng. 2011, 4, 89–93. [Google Scholar]
- O’Rourke, T.S.; Druschel, S.J.; Netravali, A.N. Shear-strength characteristics of sand-polymer interfaces. J. Geotech. Geoenviron. Eng. 1990, 116, 451–469. [Google Scholar] [CrossRef]
- Dove, J.E.; Frost, J.D. Peak friction behavior of smooth geomembrane-particle interfaces. J. Geotech. Geoenviron. Eng. 1999, 125, 544–555. [Google Scholar] [CrossRef]
- Martinez, A.; Frost, J.D. The influence of surface roughness form on the strength of sand–structure interfaces. Géotech. Lett. 2017, 7, 104–111. [Google Scholar] [CrossRef]
- Hebeler, G.L.; Martinez, A.; Frost, J.D. Shear zone evolution of granular soils in contact with conventional and textured CPT friction sleeves. KSCE J. Civ. Eng. 2016, 20, 1267–1282. [Google Scholar] [CrossRef]
- Nardelli, A.; Cacciari, P.P.; Futai, M.M. Sand–concrete interface response: The role of surface texture and confinement conditions. Soils Found. 2019, 59, 1675–1694. [Google Scholar] [CrossRef]
- Dejong, J.T.; Westgate, Z.J. Role of initial state, material properties, and confinement condition on local and global soil–structure interface behavior. J. Geotech. Geoenviron. Eng. 2009, 135, 1646–1660. [Google Scholar] [CrossRef]
- Uesugi, M.; Kishida, H. Frictional resistance at yield between dry sand and mild steel. Soils Found. 1986, 26, 139–149. [Google Scholar] [CrossRef]
- Lings, M.L.; Dietz, M.S. The peak strength of sand–steel interfaces and the role of dilation. Soils Found. 2005, 45, 1–14. [Google Scholar] [CrossRef]
- Han, F.; Eshan, G.J.; Salgado, R.; Prezzi, M. Effects of interface roughness, particle geometry, and gradation on the sand–steel interface friction angle. J. Geotech. Geoenviron. Eng. 2018, 144, 04018096. [Google Scholar] [CrossRef]
- Vangla, P.; Gali, M.L. Effect of particle size of sand and surface asperities of reinforcement on their interface shear behaviour. Geotext. Geomembr. 2016, 44, 254–268. [Google Scholar] [CrossRef]
- Frost, J.D.; Dejong, J.T.; Recalde, M. Shear failure behavior of granular–continuum interfaces. Eng. Fract. Mech. 2002, 69, 2029–2048. [Google Scholar] [CrossRef]
- Deng, N.D.; Xue, S.Z.; Duan, D.; Ma, J.Q.; Tang, H. Shear model of interface between medium-fine sand and polymethyl methacrylate. J. Yangtze River Sci. Res. Inst. 2020, 37, 73–78. (In Chinese) [Google Scholar]
- Lee, K.M.; Manjunath, V.R. Soil–geotextile interface friction by direct shear tests. Can. Geotech. J. 2000, 37, 238–252. [Google Scholar] [CrossRef]
- Wang, J.Q.; Zhou, J.; Huang, L.Y.; Huang, S.B. Macroscopic and mesoscopic studies of interface interaction on geosynthetics by use of large direct shear tests. Chin. J. Geotech. Eng. 2013, 35, 908–915. (In Chinese) [Google Scholar]
Publisher’s Note: MDPI stays neutral with regard to jurisdictional claims in published maps and institutional affiliations. |
© 2022 by the authors. Licensee MDPI, Basel, Switzerland. This article is an open access article distributed under the terms and conditions of the Creative Commons Attribution (CC BY) license (https://creativecommons.org/licenses/by/4.0/).