Abstract
India is endowed with a lot of solar radiation as a result of its location. The Indian government therefore intends to maximize the usage of its solar energy resources through the development of solar power plants across the country. The concentrated solar power plant (CSP) is one of the technologies that rely on solar energy for its electricity generation. The type of condenser model in the CSP technology has the potential to affect its techno-economic viability. In this paper, a 100 MW solar tower power plant (STPP) with two different condenser models, i.e., the dry-cooled STPP and wet-cooled STPP models, are studied using the System Advisor Model (SAM) at six different geographical areas in India. The study employed the optimization of the thermal energy storage and the solar field size to identify the minimum levelized cost of electricity (LCOE) for all six locations. Results from the simulation show that the LCOE will range between 13 and 17 cents/kWh under the optimization conditions for the STPP dry-cooled condenser model, while that of the wet-cooled condenser model will range between 12.40 and 12.96 USD cents/kWh for the study locations. It was also observed that the optimized solar multiple (SM) for the dry-cooled STPP model ranges between 1.4 and 1.8, whereas that of the wet-cooled model ranges between 1 and 1.8. The study identified Bhopal as the best location for installing the STPP plant for both condenser models. In addition, this paper also discusses major potential barriers and government policies that are needed to develop CSP technologies in India. The outcome of the study is expected to help both government and other stakeholders in decision making and policy formulation for the sector.
1. Introduction
The need to produce enough energy to meet the world’s increasing energy demand has become more necessary in recent years due to factors such as growing population, industrialization, and changing living conditions as a result of economic development. The world currently generates its energy mainly from non-renewables, which has negative implications for the environment as a result of the release of greenhouse gases (GHG) [1,2,3,4]. Hence, introducing an alternative source of energy generation becomes more pertinent. Renewable energy is identified as an alternative source of energy generation because of its abundant nature on earth [4]. Studies have noted the immense potential of solar energy as an option for generating electricity around the world since it is more economically viable, especially for developing countries [5,6,7,8,9]. India is among the leading developing countries where the energy demand rate has grown fast within the last few decades. With a population of around 1.5 billion, nearly 43% of India’s population has access to grid-based electricity, while 57% use either non-grid sources for electricity and lighting or do not use any electricity at all [4,5,6]. India intends to address its issues concerning environment and energy through the promotion of renewable energy use and increased efficiency across the country. However, to date, only 38% of India’s installed electricity generation capacities are from different renewable sources (i.e., solar energy and wind power). The government of India drafted new renewable energy policies in the 2000s to significantly increase the share of renewable energy sources in the country’s energy mix through the following measures: Electricity Act, 2003; Tariff Policies, 2006; Natural Rural Electrification Policies, 2006; Planning Commission [10,11].
Concentrated solar power (CSP) is beneficial as a renewable energy source technology due to its ability to readily incorporate energy storage [12]. A number of studies have been carried out globally concerning techno-economic assessments of potential CSP systems. For instance, Tahir et al. [13] evaluated the potential, viability, policy framework, and potential barriers of CSP generation in Pakistan. The study concluded that regions such as Pishin and Quetta are favorable for the CSP generation. In a techno-economic assessment of novel solar receivers in CSP plants and a heat collection model in the parabolic trough collector system, [14] identified an increase in the annual net electrical energy production of their studied plant and a decrease in the levelized cost of energy (LCOE). In another climatic context, Agyekum et al. [15] showed the effectiveness of solar tower technology in Ghana using a System Advisor Model (SAM). Andika et al. [16] conducted a techno-economic analysis of an integrated CSP system and reported that the LCOE can be reduced significantly, depending on the type of salt used in the storage. Another study [17] in the United Arab Emirates (UAE) evaluated the effect of substituting a natural gas-based heater with a thermal energy storage system (TES) in a parabolic trough CSP plant. The study revealed that the installation of TES increases the plant capacity and decreases the consumption of fuel in the plant. Another study that conducted an analysis of CSP in the Republic of India concluded that the country has the potential to construct about 1000 GW of CSP capacity [18]. In a techno-assessment analysis of photovoltaic hybrid power systems/wind energy on the small island of Lakshadweep in India, Ref. [19] revealed that the photovoltaic (PV)–wind hybrid system is more cost-effective than the PV or wind system alone. Aseri et al. [20] also evaluated the techno economics, possibilities, and capital investment cost for the parabolic trough collector (PTC) and STPP models in India. Their study revealed that solar tower power plants (STPP) are able to deliver higher annual electricity and reduce LCOE. Furthermore, Sharma et al. [21] and Gakkhar et al. [22] focused on identifying the design parameters for CSP plants in India. Their outcome, however, differs from the techno-assessment of Ref. [23], which established a price-driven strategy for five different types of thermal energy storage in CSP plants within a spot electricity marketing campaign for Daggett (California). Meanwhile, Lashari et al. [24] developed a mathematical model for the parabolic solar/dish Stirling method for the region of Jamshoro in Pakistan, which shows CSP’s suitability for the region. Islam et al. [25] performed a techno-economic analysis of three different technologies, i.e., PTC, STPP, and solar parabolic dish (SPD), under different economic criteria in Malaysia. Their study indicated the practical suitability of PTC and STPP for East and Peninsular Malaysia. Rashid et al. [26] also studied the techno-economics of a hybridized CSP plant using both TES and Natural gas. The results of their study suggest that the inclusion of a storage system regulates the production of power by natural gas and solar energy in the daytime. The solar fraction of the hybrid power plant also increases with little reduction in thermodynamic efficiency. In Tanzania, Aly et al. [27] suggested that the feasibility of CSP in Tanzania is dependent on the financial condition, policy mechanisms, and lower debt interest rates. The study of Wenjin et al. [28] revealed that advanced TES technology based on a mixture of molten salts and which has higher thermal ability as well as lower and nitrate salt mixtures bring out the most promising results. Furthermore, Fernandez et al. [29] conducted a techno-assessment of 16.616 MWht by using magnetic ore as a heat storage media and a Delcoterm solar E15 as a heat transfer fluid. The results of their work show that the proposed system is able to supply 16 MWht to the overall power block, which requires high-cost investment from the government or investors. Parent et al. [30] analyzed a CSP for Spain and suggested that CSP technology is feasible in Spain under the current electricity rate and post-subsidy conditions.
Finally, ref. [31] also studied the performance of a 50 MW PTC plant wet-cooled condenser in Tataouine and a dry-cooled condenser in Tunisia. The results show that the LCOE of the dry and wet-cooled PTC plants in the two locations are 18.28 EUR cents/kWh and 15.97 EUR cents/kWh. The authors simultaneously compared the wet-cooled condenser model results with the Andasol-1 CSP plant in Spain. The results from their findings show that the LCOE can be reduced by 1.45%. Hirbodi et al. [32] analyzed the techno-economics of a PTC and an STPP along with two cooling models of 20, 50, 100, and 200 MWe capacities for a plant Shiraz in Iran. Preliminary results from their study show that the dry-cooled STPP plant, with a capacity of 100 MWe, demonstrated an efficient configuration for the Shiraz location. Similarly, ref. [33] investigated the effect of deploying wet and dry-cooled condensers on the performance of STPP plants. The outcome of their study reveals that using dry-cooled condenser in the STPP plant could result in a reduction of the energy and exergy by about 4.6%. Yilmazoglu [34] analyzed the effect of the heat transfer fluid on four condenser models of an STPP plant. The results of that study suggest that the wet-cooled condenser shows better performance compared to the air-cooled condenser. Arnaoutakis et al. [35] combined the Wind-Pumped Hydro Storage Plant and the CSP power plants to assess their effectiveness on the Island of Rhodes. The results from their study suggest that renewable energy source penetration of about 80% can be achieved annually using the combination of both plants. An LCOE of 0.20 EUR/kWh was obtained as the best investment selling price for the electricity produced. Similarly, Arnaoutakis et al. [36] combined the PTC and the tower plants for an increased day to day performance. They found a steadier day-to-day performance for the system of the 29 MWe and 25 MWe towers of the north–south oriented PTC compared to the single-system power plants. Sharma et al. [37] evaluated India’s solar thermal potential. They developed a comprehensive framework which took into consideration factors such as the direct normal irradiance, the availability of wastelands, suitability of wasteland for the generation of wind power, wastelands that are the habitat of endangered species or prone to earthquakes, and/or tribal population. Krishnamurthy et al. [38] assessed the cost effectiveness of the PTC technology in India. Their study indicated that a plant with a TES hour of around 7 h could reduce the cost of electricity from 0.15 USD/kWh to 0.14 USD/kWh. Using the System Advisor Model, ref. [39] evaluated the performance of two different solar thermal power plants, i.e., the linear Fresnel reflector and the PTC, under Indian weather conditions. They found that the levelized unit cost of electricity is minimal for the solar multiple (SM), ranging between 1.4 and 1.6 for a DNI of 950 W/m2 for the PTC power plant, while the SM for that of the LFR is 1.8–2.0.
The literature provides a considerable number of studies that have been conducted globally on CSP technologies. However, from the literature survey, studies based on CSP technologies in the Indian context under different weather conditions across the country are limited. This is important since India is vast with different weather conditions, and hence a study at a particular location cannot be used to predict the performance of such systems across the country. Therefore, in this present study, we examined the techno-economic feasibility of a CSP based on STPP for six different locations in India in order to fill this current research gap, which is useful for research directions and policy interventions [13,15]. According to Aly et al. [27], a dry-cooled CSP plant is modelled at sites far away from a water source, while a water-cooled CSP plant is modelled at sites near water resources. Since the type of condenser used has an effect on the performance of the power plant, as shown in the literature reviewed supra, this study, as part of its objectives, assessed both dry-cooled and water-cooled models at all of the six selected locations across the country to help in future planning for the sector.
With the government of India’s intention to cut down on the GHG emission intensity of the country’s gross domestic product by 45% by 2030, and its long-term goal of reaching net zero by 2070 [40,41], we also evaluated the impact of the implementation of the CSP technology on the country’s GHG reduction targets. This was accomplished by assessing the avoidable emissions that would have been generated if other conventional power plants relying on fossil fuels had been used to generate the same amount of electricity as that generated by the modelled CSP systems across all study sites. In addition, major potential barriers that hinder the development of such power plants in India are discussed in this paper using information reviewed from several research works. Thus, this study is expected to serve as a reference material in relation to techno-economic assessments and factors affecting the development of the CSP technology in the study country. This, according to the best of the authors’ knowledge, is the first of such a study for the country, especially with regard to the comparison of the dry and wet-cooled technologies and the identification of barriers for the sector.
2. Materials and Methods
The modelling of the CSP was performed using SAM version 2020.2.29, provided by the National Renewable Energy Laboratory (NREL), funded by the Department of Energy. SAM is commonly used by researchers for techno-assessment analysis worldwide. The SAM model also includes the simulation of the parabolic trough, power tower, and linear Fresnel for electric power generation [42]. In this present investigation, a solar tower power plant is modeled in India. The flow diagram of the simulation in the SAM software is presented in Figure 1.
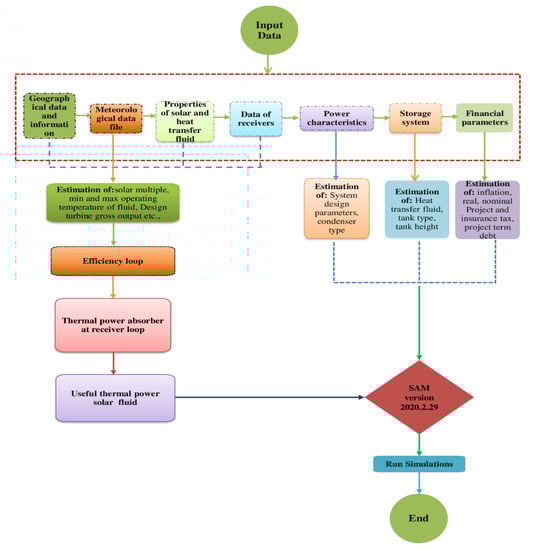
Figure 1.
Flow diagram of the simulation process in the SAM software (modified from [31] with permission from Elsevier).
Site selection is one of the important factors considered during planning to develop large-scale solar power projects [43]. In this current study, site selection for the CSP project was based on the availability of land, solar resource, and infrastructural accessibility [18,44,45]. The potential sites selected for this study are the following:
- (1)
- Bhopal City: located in the central state of Madhya Pradesh (23.25° N, 77.40° E);
- (2)
- Jhansi City: found in the extreme south of Uttar Pradesh state (25.53° N, 78.65° E);
- (3)
- Jalandhar City: in the north Indian state of Punjab (31.29° N 75.56° E);
- (4)
- Srikakulam City: located in the coastal area of Andhra Pradesh state (18.32° N, 83.91° E);
- (5)
- West Medinipur City: part of West Bengal state (22.42° N, 87.32° E);
- (6)
- Erode City: located in the state of Tamil Nadu (10.90° N, 78.37° E).
2.1. Selection of Parameters for the Analysis
In this investigation, a 100 MW STPP CSP plant is studied at the six potential sites using the SAM model with TES to forecast the performance of STPP at the various sites. The capacity of the power plant is selected based on recently published works, such as [15,27]; it must, however, be stated that based on the strengths of the various locations, the government or the investing body may vary the capacity to suit the study area. The model in this study operates using a Rankine. The STPP generates its electricity from solar energy through by focusing concentrated solar irradiation on a mounted tower heat exchanger. The collector field is made up of an array of mirrors (heliostat) [46], as shown in Figure 2. Table 1 presents the financial parameters used for SAM simulation, and the technical parameters are presented in Appendix A (Table A1).
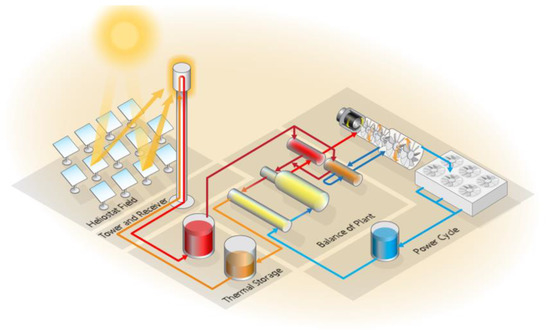
Figure 2.
The configuration of the studied STPP technology (obtained from SAM [42]).

Table 1.
Financial parameters used in the SAM simulation.
2.2. Principle of Operation for the STPP
The STPP type of power generation operates by transmitting solar irradiation on to a central receiver mounted on a tower, which attains a high temperature heat transfer medium via several heliostats [53]. The sunlight is tracked and reflected onto the receiver by the heliostats, which are computer controlled. The solar radiation that is collected is converted into heat in the receiver by HTF. The HTF energy is transferred to water/steam via exchangers, and it is then used for the generation of electricity in a turbine generator [54,55].
The receiver comprises of wall pipes that play the role of heat exchangers. The heat transfer fluid that is generally used is molten nitrate salt, it is also used as a storage fluid. The molten salts are mostly used by solar tower systems as a result of its energy storage and superior heat transfer capabilities. The molten salts are stored using storage tanks so that it can be used when sunlight is not available [15,54].
2.3. DNI Performance of an STPP in Different Locations in India
The solar radiation resource, i.e., direct normal irradiance (DNI), for India is presented in Figure 3. Figure 4 shows the monthly average data of DNI for the six selected potential sites. The study area’s hourly solar radiation and weather data used for the simulation were obtained from the EnergyPlus weather database [56]. The data reveal that for most of the sites, dry season occurs from October to May; hence, the beam of irradiance is very high during those periods. It was also observed that for the other months, there is relatively low irradiance because of the rainy season. In addition, Erode and Jalandhar also experience a relatively low irradiance from November to February; this is because the Jalandhar site experiences cold weather conditions, whereas the Erode site experiences heavy rainfall during the period from November to February.
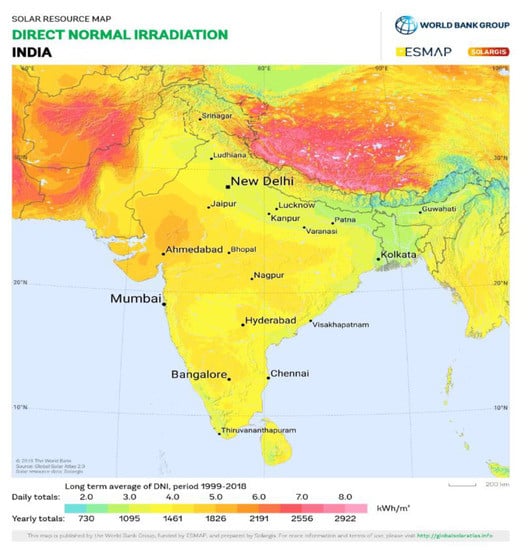
Figure 3.
DNI map of India [57].
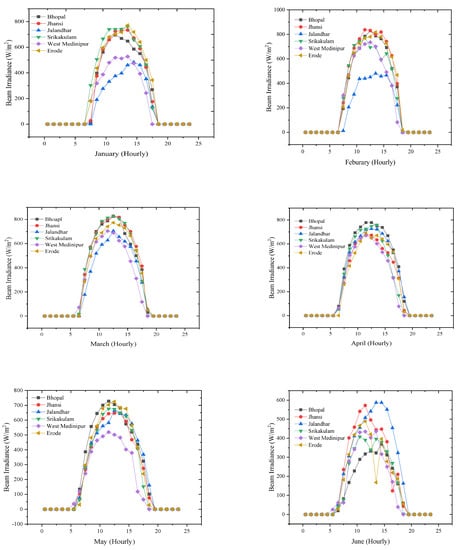
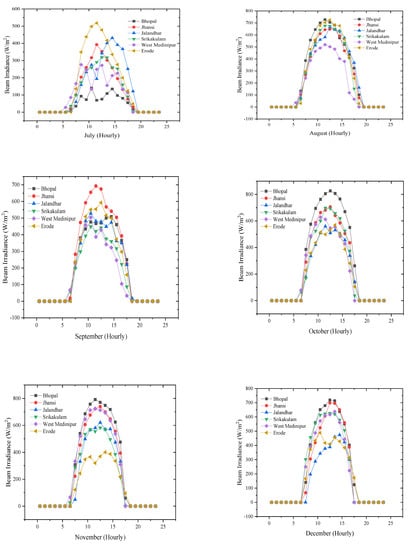
Figure 4.
Monthly DNI for the six different locations of the study.
2.4. Mathematical Relations Used for Modelling STPP
The heliostat efficiency is contingent on its location in relation to the receiver. In the central receiver system, the cosine effect depends on both the position and location of the sun. This is different from that of the parabolic trough collector, which depends only on the hour of the day. The cosine angle is computed using Equation (1) [58,59].
The total yearly energy (Wh/m2) for each mirror area can be estimated using Equation (2).
where the hour is denoted by , and the location of the point is represented by .
The heliostats are practically arranged with gaps in between them; this is to allow for maintenance and to prevent shadowing. The packing density can be expressed as the ratio of the minor area to the area of the land; this varies for different locations in the heliostat field. Therefore, in the case of an STPP, the impact of the packing density has to be taken into consideration to calculate the actual energy that is reflected. The actual yearly reflected energy for each land area for a point at the base field, taking into consideration the impact of the packing density, can be computed using Equation (3).
The thermal power of the HTF under design conditions, wherein the plant produces the design electric power, can be computed using Equation (4).
The thermal power that can be collected from the heliostat field is mathematically expressed as follows:
Equation (6) would be obtained if Equation (4) is substituted into Equation (5).
Equation (7) can be used to compute the concentrating ratio (CR) [15].
The capacity factor (CF) of a power plant is a key parameter that is used to evaluate the performance of the system. The CF can be estimated using Equation (8) [49,58].
The receivers nominal thermal power is determined by the solar multiple (SM). It is defined as the ratio of the receiver thermal power to the cycle thermal power. Systems without storage should have an SM close or equal to 1 [42].
3. Results and Discussion
This section presents the obtained results from SAM for a 100 MW STPP. The section is divided into different sub-sections to cover the different cooled models used for the six selected potential sites. Furthermore, this section provides sensitivity analyses for both models. The potential barriers that could hinder the development of the renewable energy sector in the country are also discussed.
3.1. Electricity Generation of STPP (Dry-Cooled Model) at Six Potential Sites in India
Figure 5 shows the hourly electrical power output for the STPP dry-cooled model for the six potential sites. Results indicate that the maximum electrical power output is achieved during the first quarter and last quarter of the year, which comprise the dry season period. Meanwhile, from the month of May to August, there is a slight decrease in electrical power for all the selected sites. This observation could be attributed to the effect of the monsoon season, which produces less solar radiation within that period. From the month of September to February, the power output starts increasing slowly at all sites, except at the Erode site. This is because of frequent high rainfalls at Erode during this period. The electricity export to the grid from the STPP at the six potential sites achieved about 100 MWe during the dry season. Total electric power output to the grid in the second and third quarters of the year, which are also the rainy months, decrease due to less solar radiation within that period.
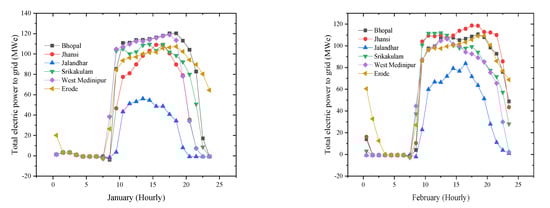
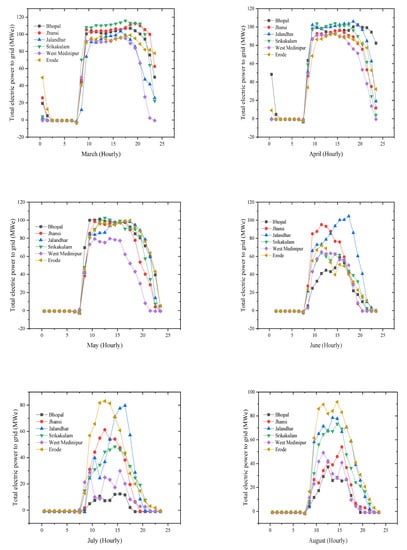
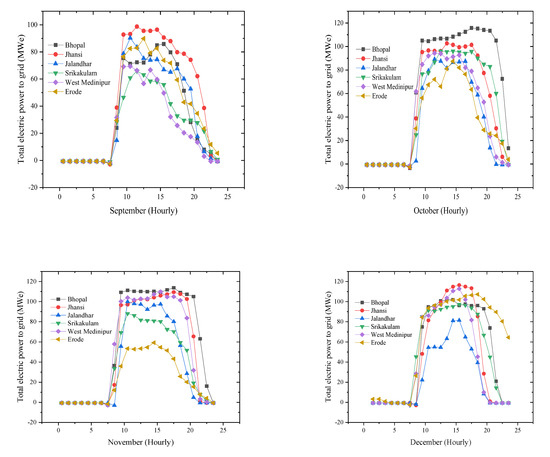
Figure 5.
Total electric power output to grid (dry-cooled) for the six potential sites.
A total of 376.26 GWh, 364.84 GWh, 300.67 GWh, 353.15 GWh, 301.156 GWh, and 349.09 GWh with capacity factors of 41.5%, 40.2%, 33.2%, 39%, 33.2%, and 38.5%, respectively, were recorded in the first year of the project for Bhopal, Jhansi, Jalandhar, Srikakulam, West Medinipur, and Erode, respectively, for the dry-cooled condenser model. It can be seen in Table 2 that the Jalandhar and West Medinipur sites recorded the same capacity factor of 33.2% and a very small difference in electricity generation. On the other hand, sites such as Bhopal and Jhansi as well as Srikakulam and Erode recorded a minimal difference in the capacity factor of 1.5%.
Table 2.
Economic results from the simulation in SAM for the STPP (dry-cooled) plant.
3.2. Economic Performance of the Dry-Cooled System at the Six Studied Sites in India
The economic results from the simulation are summarized in Table 2. The results suggest that the modelled power plants at all sites are economically feasible since all sites recorded a positive NPV. Bhopal, however, recorded the highest NPV among all the six sites, which indicates that a project at that site will break even at a faster rate than the other sites. The financial optimization of the 100 MW STPP solar thermal power plants are also represented in Figure 6. From the data of each potential site, LCOE is optimized by varying the SM from 1 to 5, with an increment 0.2. The results indicate that the value of LCOE decreases as the SM increases for the given TES capacity. The decreasing trend is followed until a minimum LCOE value is achieved, after which the trend starts to increase again. The SM at which the minimum LCOE is obtained can be said to be the optimal SM for that TES.
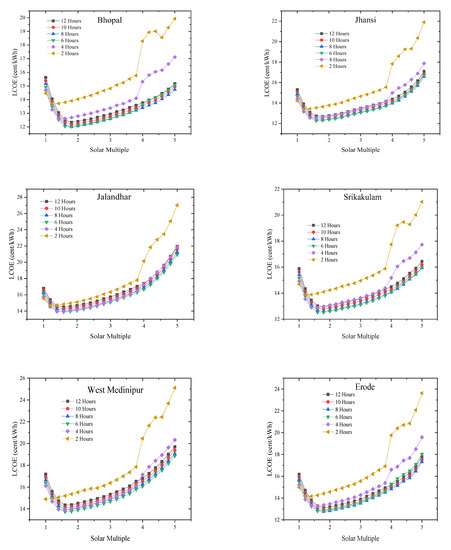
Figure 6.
Effect of SM and TES on the LCOE (dry-cooled model) in different cities of India.
Figure 6 shows the economic comparison of the six sites in this study. The LCOE under the optimization configuration in the Bhopal, Jhansi, Jalandhar, Srikakulam, West Medinipur, and Erode sites can be minimized to 12.01 cents/kWh, 12.25 cents/kWh, 13.87 cents/kWh, and 12.51, 13.74, 13.11 cents/kWh for SM within the region of 1.4–1.8. Comparing the outcomes at the various sites with the literature, the obtained LCOE are seen to be relatively higher in terms of residual fuel oil (RFO), which is around 10 USD cents/kWh for India. Therefore, in the current analysis, we have included an additional fee of 25–30 USD/tCO2 emission, which is the average cost of CO2 emission for 37 countries [60]. After adding the CO2 emissions cost for RFO-based power generation, the resulting LCOE becomes comparable to the LCOE obtained under the optimized configuration of the proposed CSP plant. Therefore, the government of India needs to adopt several policies based on CSP generation technologies.
3.3. Electric Generation Analysis of STPP (Wet-Cooled) Plant at Six Potential Sites in India
Figure 7 shows the total electric generation power output for the STPP wet-cooled model at the selected sites. The output performance of the wet-cooled model is not significantly different from the dry-cooled model presented supra. The major drawback of utilizing the wet-cooled STPP model is that it consumes more water compared to the dry-cooled STPP model. However, the annual maximum electric energy power output is higher for the wet-cooled STPP as compared to that of the dry-cooled STPP.
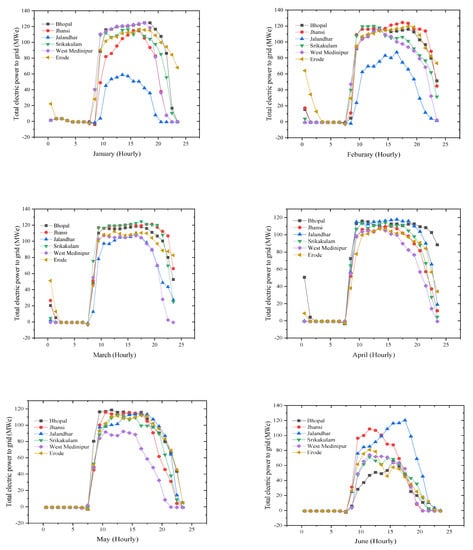
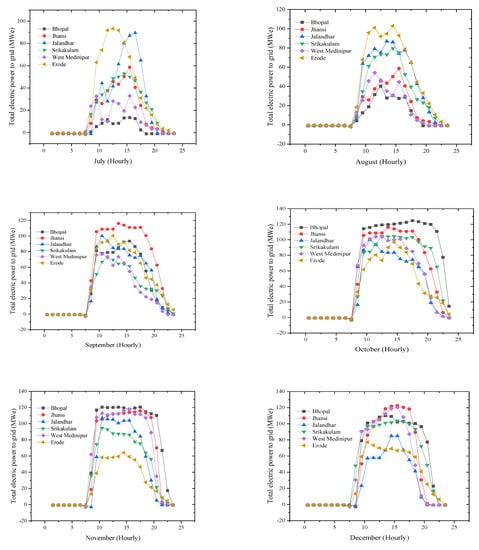
Figure 7.
Total electric power output to grid (wet-cooled) for six potential sites.
3.4. Economic Analysis for the STPP (Wet-Cooled Model) for the Six Potential Sites in India
The economic results for the wet-cooled STPP are presented in Table 3 The results for all sites show a positive NPV, which is an indication that such a project at any of the sites will be a viable investment. Results from the analysis presented in Figure 8 show that the optimized SM falls in between 1 and 1.8. The construction of such a power plant at the six studied areas can be developed within this range of SM values to help cut down on cost. This is because an increase in the SM increases the total capital cost for the entire plant. The outcome also shows that the LCOE for the wet-cooled STPP is relatively higher than that for the dry-cooled due to the cost associated with the water used. Based on the results, the optimum SM for a system located at the Bhopal, Srikakulam, and Erode sites at 8 h TES is 1.8, whereas the Jalandhar and West Medinipur sites optimized at 6 h TES have an optimal SM of 1.6. The Jhansi site had an optimized TES of 6 h, with an SM of 1 at an LCOE of 11.53 USD cents/kWh.
Table 3.
Economic results from the simulation in SAM for the STPP (wet-cooled) plant.
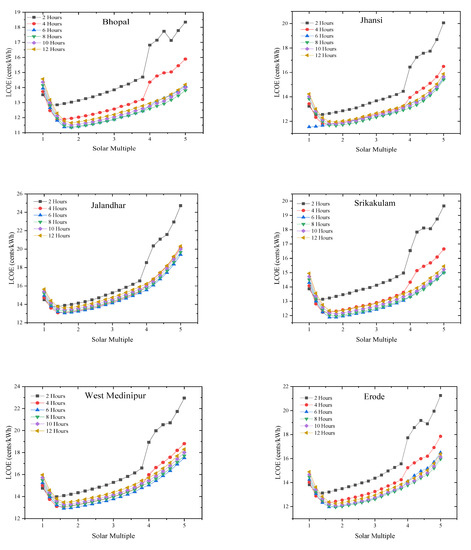
Figure 8.
Effect of SM and TES on the LCOE (wet-cooled model) for potential sites in India.
3.5. Sensitivity Analysis
A sensitivity analysis is key in studies such as this since it provides the opportunity to check the effect of various parameters or factors on the technical and economic performance of the power plant. In this study, three factors were considered for the sensitivity analysis; these are the sales tax, up-front fee, and solar multiple, used to access their impact on the viability of the project. The first sensitivity analysis determined the sales tax rate for the economic feasibility, with a sales tax rate ranging from 1% to 18%. The second sensitivity analysis looked at the up-front fee in the range of 1–5%. The last sensitivity analysis looked at the effect of SM on the net capital cost (NCC), within a range of 1–5.
Figure 9 shows that varying sales tax rates create a significant impact on the LCOE for both the dry and wet-cooled models for the six potential sites. The results indicate that the LCOE of the power plants increases with increasing sales tax. The effect of sales tax on the LCOE of the Jalandhar site is more than that of any of the other selected sites for both models as a result of the relatively less DNI in that enclave. However, Bhopal recorded the lowest LCOE, even with an increase in the sales tax rate for the dry and wet-cooled models. In the case of the Srikakulam and Erode sites, the effect of increasing sales tax on the LCOE of the wet-cooled model was almost insignificant as it followed the same trend with a minimal difference. The impact of sales tax on LCOE was observed to be more impactful on the dry-cooled plant than that of the wet-cooled module.
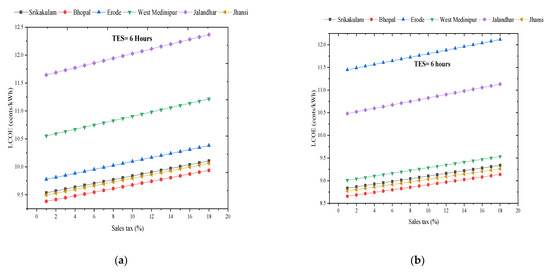
Figure 9.
Effect of sales tax rate on the LCOE of both models, (a) dry-cooled and (b) wet-cooled, at 6 h TES for SM of 2.
Figure 10 presents the effect of the up-front fee on the cost of energy from the power plants for all sites. It shows an increase in LCOE for all sites. However, its effect on the LCOE is very minimal at all the six sites for the wet-cooled model as compared to that for the dry-cooled model. Similarly, the highest cost of electricity is expected to occur at the Jalandhar site, which shows an increase in the up-front fee for both models. Bhopal, however, recorded a lower LCOE for both models and an increase in the up-front fee.
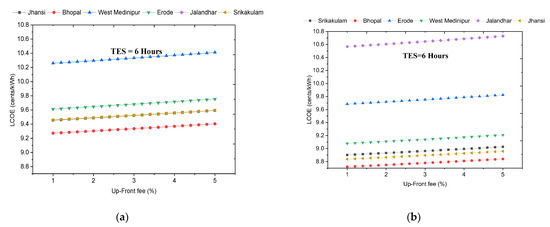
Figure 10.
Effect of up-front fee on LCOE of both models, (a) dry-cooled and (b) wet-cooled, at 6 h TES for SM of 2.
Figure 11 shows the effect of SM on the NCC of the various power plants; it can be seen from the figure that the SM has a major effect on the NCC of the STPP for all selected sites. The NCC for the dry-cooled model increases sharply from an SM of 1 to 2; however, it decreases after reaching an optimum SM. The maximum NCC achieved for the dry-cooled model at the Bhopal, Jhansi, Jalandhar, Srikakulam, West Medinipur, and Erode sites are 6.83789 USD/W, 6.83777 USD/W, 6.83772 USD/W, 6.8377 USD/W, 6.83754 USD/W, and 6.83636 USD/W at the SM range of 2. On the other hand, the maximum NCC for the wet-cooled model are 7.32521 USD/W, 7.32519 USD/W, 7.32399 USD/W, 7.3247 USD/W, 7.95507 USD/W, and 7.3243 USD/W for the various STPP sites, respectively.
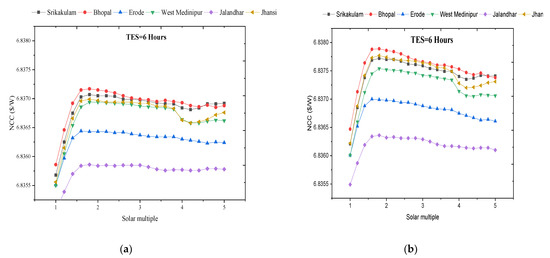
Figure 11.
Effect of solar multiple on NCC on both models, (a) dry-cooled and (b) wet-cooled, at 6 h TES.
3.6. Environmental Impact Assessment
The environmental aspect of the studied power plants at the various locations are estimated in this section. The avoided CO2 emissions from electricity generation due to the use of the STPP for electricity generation can be computed using Equation (10) [61].
where the mitigating CO2 emissions is represented by , denotes the annual produced electricity from the RES, and is the emission factor, taken as 0.8274 kgCO2/kWh [62] for India in the current study.
The outcome of the estimations are presented in Table 4. Based on the calculations, it appears that the integration of the STPP into the Indian energy mix could lead to a significant cut in the country’s GHG emissions. Bhopal would record the highest reduction in emissions for both the dry and wet-cooled systems. Avoided emissions of 31,132.50 metric tons and 33,984.63 metric tons of CO2e are expected to be recorded per year at the Bhopal region. In total, if a system with a dry-cooled condenser were to be implemented at all six locations with similar capacities, as presented in this study, then India could reduce the country’s emissions by some 169,219.62 metric tons of CO2e per year. Similarly, if the wet-cold power plants were to be deployed across all six areas, then the avoided emissions for all six locations could be as much as 185,469.90 metric tons of CO2e per year. Considering the government’s recent commitment to reduce the emission intensity of the country’s gross domestic product by 45% by 2030, and its long-term goal of reaching net zero by 2070 [63], the deployment of STPP in the country would significantly help the country to achieve its targets.
Table 4.
Avoided emissions due to the use of the CSP technology.
Finally, in Table 5, the results of the proposed STPP modelled system are compared with those of previous studies according to different CSP technologies/parameters/configurations/economic criterion, i.e., Simulation software, TES, and LCOE. The results as presented in the current work fall within the range of values obtained in other studies, as demonstrated in Table 5. The slight variations in economic output in the results obtained in this study could be attributed to the differences in weather characteristics, type of CSP technology, and the economic parameters used as inputs for the simulations. A higher DNI value for a study area could affect the technical and economic output of the power plant in a more positive way.
Table 5.
CSP technology in other published works, for comparison.
3.7. Major Barriers and Policy Implications in India
The main aim of this section is to discuss the various barriers and challenges that are facing the development of CSP technology in India. There are several barriers that affect the installation of CSP technologies all around the energy markets. However, the ultimate goal of these markets is to match CSP technologies to the cost, services, demand, and energy supply. Therefore, the CSP system needs to demonstrate all the three necessary aspects, namely, TES costs, dependability as an auxiliary solution, and power dispatch ability, for the system to stay competitive as compared to other possible power production technologies. Therefore, the government of India needs to legislate polices even though five different CSP plants are under full operation throughout the country, and even with five CSP plants under construction, which are presented in Table 6 [77]. The major reasons for the lack of CSP plants in India include high cost of investment; uncertainty in energy, power, and renewable energy policies; lack of awareness among the citizens; lack of infrastructure in potential areas; lack of local manufacturing units [78,79]. Therefore, to promote CSP plant technologies for power generation in India, the government needs to adopt new policies in order to achieve long-term goals. These have been summarized into a list of recommendations in Table 7.
Table 6.
Details of developed and under-developed CSP projects in India [77].
Table 7.
Summarized barriers in the development of CSP technologies in India and list of recommendations.
3.7.1. Economic Barriers or Financial Barriers in India
Economic and financial barriers are one of the major drawbacks in developing CSP technology in India. This is due to the lack of investors and financial institutions. In addition to this, the government of India needs to encourage the local manufacturing industry to meet the demand for and supply of CSP technology in order to lower imports from international manufacturing units. This is in line with recent major national programs called “Make in India” and “Atmanirbhar Bharat” [80,81]. The main aim of these programs is to support the local manufacturing units. Such government initiatives cannot be isolated from broader national issues such as security issues, debt, and state and central political issues, which can drive away potential entrepreneurs or investors. The central government of India thus needs to provide an additional incentive to state governments, such as “special status”, which will be discussed in further Section 3.7.6, so that state governments can benefit from it and more investors can be attracted, which will consequently help to boost the country’s economy. The government also needs to provide further financial benefits to investors, such as exemption from the good and service tax (GST), loans from the banks, and guarantees. Such benefits will encourage investors and entrepreneurs to invest in renewable energy-related technologies.
3.7.2. Technological Barriers in India
There are numerous technological barriers against the deployment of CSP technology in India, such as lack of knowledge in operation and maintenance of the plant, lack of research and development, and complexities such as storage of energy, power, etc.; there is also a lack of knowledge among the local manufacturers with regard to the latest technology [82,83]. Such impediments force entrepreneurs or investors to import from the international market. Therefore, the Ministry of Energy in India needs to create policies for research and development and local manufacturers in order to improve energy storage in CSP plants. The government or project proponents initiate programs related to the CSP and TES technologies through experts from the field to educate the manufacturers and also local workers [84,85,86]. India is endowed with good researchers and scientists coming from reputable universities and institutes; however, the country imports most of its technical components from countries and regions such as the United States, Europe, China, Russia, and Israel.
3.7.3. Infrastructural Barriers in India
In India, there is the lack of infrastructural development; investors are therefore required to spend a lot of research and time to locate the potential sites for the construction of CSP plants [1]. Another challenge is that after identifying the potential sites, investors require approval from various authorities in order to develop CSP technologies [11,13,80,86]. To address this matter, the government needs to support the entire project implementation, including the allocation of potential sites, funds, transportation facilities, water resources, and other development measures required for the infrastructure. This will be beneficial in the development of the economy and also the infrastructure of the state [87].
3.7.4. Social Barriers in India
In India, local communities tend to be unwilling to adopt renewable energy-related technologies. The acquisition of lands from these communities for the development of CSP technology plants are a little difficult, and the results can generate funds for compensation as well as more job offers from investors or from the government of India. Therefore, it is important to foster an awareness of renewable energy among the Indian communities, with a critical focus on their social culture practice.
3.7.5. Policy Barriers in India
India is a vast country, with 28 states and 8 union territories [88]. These states are ruled by local ministers, and the eight union territories are under the control of the President of India. According to the constitution of India, states can frame their own energy policies [80]. Because of the lack of renewable energy technology policies, investors need to wait for a long period of time [80,85]. Meanwhile, this is connected to several procedures; for instance, generating a proper agreement from the Ministry of Energy Resources, exemption from taxes from the state Ministry of Finance, and locating the potential sites from state Ministry of Industries and also providing security to the agreed selected sites are the major time delay factors that will prevent investors from implementing CSP technologies in the various states [89]. Therefore, the local ministers should alter their present energy policies and give full support to investors through initiatives such as the invitation of tenders through E-bidding. The idea of E-bidding, however, has only been introduced in recent times and is not yet fully functioning in India [78]. In recent studies and sources, the Tamil Nadu government promoted a new energy policy wherein local communities could set up their own renewable energy system for use in domestic, commercial, and small-scale industries; the state government will then compensate half of the amount of the total investments [90]. This initiative in the energy policy will encourage manufacturing units, local communities, and other developing industries to set up renewable energy technologies.
3.7.6. Present Scenario on “Special Status” in India
The government of India is facing problems in various sectors such as the primary, secondary, and tertiary sectors, which could negatively affect the country’s economy. As of 2014, few states in India are eligible to opt for the “special status”. The benefit of the status is that the state will be exempted from taxes in order to attract companies, firms, and investors all around the globe, and also to create additional employment for the local communities within the state. From the recommendations of the 14th Planning and Finance Commission, the National Development Council of India along with the Ministry of Home Affairs of the central government of India decided to dissolve the “special status” for all the states [91,92]. A “special status” will be given only to the states that have poor infrastructure and low economic background, those sharing land with neighboring countries (e.g., China, Bhutan, Nepal, Pakistan, Bangladesh, Myanmar, and Afghanistan), hilly states and those with a sizable share of tribal population, or newly formed states [91,92]. Therefore, to overcome the economic problems, and after several appeals from the local communities, local ministers, along with recommendations from the Finance and Planning Commission and other union ministers, the central government agreed to provide special assistance to some state governments in India [91,92,93]. However, this assistance is applicable only to the centrally funded schemes, with a central to state share ratio of 90:10 [93]. Meanwhile, all the eligible state governments that fall under this scheme agreed to the special assistance, and these incentives can be provided only in the form of debt repayment and interest for the externally aided project, which is valid for 10 years from the actual start date [88,91,92,93]. This special assistance share ratio from the central government will not provide any additional benefits to the state governments nor to the investors. The local ministers of each state need to be continuously engaged with the Planning Commission of India, the Central Ministry of Finance, and the National Development Council of India to ultimately achieve “special status” for the state, which can then increase its deployment of renewable power sources [93].
4. Conclusions
This work provided a techno-assessment analysis of six potential sites for an STPP with two different condenser models in India, i.e., the dry-cooled model and the wet-cooled model, in order to guide policy-making and future research prospects. A 100 MW STPP was simulated for two condenser models at sites located in Bhopal, Jhansi, Jalandhar, Srikakulam, West Medinipur, and Erode. The simulation results for the six potential sites revealed that the STPP dry-cooled model at Bhopal generated the maximum energy of 376 GWh and a capacity factor of 41.5%, followed by Jhansi, Jalandhar, Srikakulam, West Medinipur, and Erode, which generated a maximum energy of 364 GWh, 300 GWh, 353 GWh, 301 GWh, and 349 GWh and capacity factors of 40.2%, 33.2%, 39%, 33.2%, and 38.5%, respectively. In contrast, for the STPP wet-cooled model, the maximum energy for the selected sites was 410 GWh, 401 GWh, 330 GWh, 382 GWh, 329 GWh, and 387 GWh, with a capacity factor of 45.3%, 44.2%, 36.4%, 42.2%, 36.4%, and 42.7%, respectively. It was also observed that the optimum SM for the STPP dry-cooled model ranged between 1.4 and 1.8 for all the selected sites. However, in the case of the STPP wet-cooled model, the SM was optimized in the range between 1 and 1.8; this is because the lowest LCOEs for the different TES converge within those SM values before increasing again.
From the simulated results, the STPP wet-cooled model is the best technology to be constructed at the six potentials sites as it recorded the highest annual energy generation with the least LCOE. Furthermore, the Bhopal site was identified to be the best site for the construction of both technologies.
To develop such systems, developing countries such as India need to alter their energy policies. The Ministry of Energy in India needs to draft new policies that would encourage local manufacturing, initial financial assistance for investors, training programs from the experts in the field, and social awareness among the local communities. Therefore, we recommend the review and regulation of ongoing policies on renewable energy sources and the implementation of proper guidelines for investors as well as for research and development in CSP generation in India, which are to be performed by the respective authorities.
Finally, this study recommends performing a techno-assessment analysis of the six given sites for other CSP configurations (i.e., parabolic trough collector, linear Fresnel reflector, and parabolic or parabolic dish Stirling). This study will help to locate the possible CSP configurations at those sites. As future study recommendations, we also suggest the use of a combination of various multi-criteria decision-making approaches and geographical information systems to identify optimum sites for the development CSP technologies across the country in order to help with the siting of such facilities.
The current study has a limitation that needs to be highlighted: the current research did not consider the cost of land in the economic analysis. However, as this may affect the economic output, future studies could consider the effect of cost of land on the viability of the studied power systems at the various sites.
Author Contributions
Conceptualization, S.P., E.B.A. and A.K.; methodology, S.P. and E.B.A.; software S.P. and E.B.A.; validation, S.P., E.B.A. and J.D.A.; formal analysis, E.B.A. and A.K.; investigation, S.P.; resources, S.P., E.B.A. and S.A.; data curation, S.P., E.B.A. and F.A.; writing—S.P. and E.B.A., visualization, E.B.A.; supervision, E.B.A. and V.I.V.; project administration, E.B.A.; funding acquisition, S.P., E.B.A. and A.K. All authors have read and agreed to the published version of the manuscript.
Funding
The research funding from the Ministry of Science and Higher Education of the Russian Federation (Ural Federal University Program of Development within the Priority-2030 Program) is gratefully acknowledged. The youth laboratory with Grant number: FEUZ-2022-0031.
Institutional Review Board Statement
Not applicable.
Informed Consent Statement
Not applicable.
Data Availability Statement
Not applicable.
Conflicts of Interest
The authors declare no conflict of interest.
Abbreviations
| CF | Capacity factor |
| CSP | Concentrated solar tower power plant |
| CR | Concentrating ratio |
| DNI | Direct normal irradiance |
| GHG | Greenhouse gases |
| GWh | Gigawatt hour |
| HTF | Heat transfer fluid |
| IRR | Internal rate of return |
| KWh | Kilowatt hour |
| LCOE | Levelized cost of energy |
| NCC | Net capital cost |
| NPV | Net present value |
| NREL | National Renewable Energy Laboratory |
| PPA | Power purchase agreement |
| PTC | Parabolic trough collector |
| PV | Photovoltaic |
| RES | Renewabble |
| SAM | System advisor model |
| SM | Solar multiple |
| SPD | Solar parabolic dish |
| STPP | Solar tower power plant |
| TES | Thermal energy storage |
| Total yearly energy | |
| $ | Dollars |
| ¢ | Cents |
| Hour | |
| Location of the point | |
| Mitigating CO2 | |
| Annual produced electricity | |
| Emission factor |
Appendix A
The technical input parameter for STPP is categorized in to six parameters and presented in Table A1, while the financial parameters used for the SAM simulation presented in Table 1 are fixed by the SAM or taken from other research works. Therefore, the total tower cost and the total receiver cost are calculated by using Equations (A1) and (A2) [27,94,95,96].
Table A1.
Technical parameters used in calculation.
Table A1.
Technical parameters used in calculation.
| Location and Resources | Bhopal, Jhansi, Jalandhar, Srikakulam, West Medinpur, and Erode |
|---|---|
| System Design | Plant Capacity: 100 MW; Heat transfer Hot and Cold temperature: 574 °C and 290 °C; TES: 2 to 12 h |
| Heliostat field | Number of Heliostats: 8790; Heliostat Height and Width: 12.2 m; Minimum and Max Heliostat distance to tower heigh ratio: 9.5 m and 0.75 m; Water usage per wash 0.70 L/m2 |
| Tower and Receiver | Solar type: 2.40; Receiver thermal power: 670 MWt; Material type: Stainless steel AISI316; Heat transfer fluid: Salt (60% NaNO3, 40% KNO3) |
| Power Cycle | Boiler operating pressure: 100 Bar; Type of Condenser: Dry-cooled and wet-cooled |
| Thermal Storage | Type of storage: Two tank; Height of tank: 12 m; Tank fluid minimum height: 1 m; storage tank volume: 17,000 m3 |
The LCOE plays a crucial role in determining the viability of a power plant. Therefore, in the case of the SAM software, it calculates both LCOEs (nominal and real). The major difference between both LCOEs is that the nominal LCOE is calculated when the project is for a short-term period analysis, which also uses a present dollar rate; on the other hand, the real LCOE is used for a long-term period analysis and uses a constant dollar rate. In the present study, the authors opted for the real LCOE because the analysis was considered for a long-term period, i.e., 25 years. Therefore, the equation for the real LCOE is presented in Equation (A3) [15,47,59,60,61,62,63,64,65,66,67,68,69,70,71,72,73,74,75,76,77,78,79,80,81,82,83,84,85,86,87,88].
where denotes the project’s equity investment; is the total annual cost of the project in number of years; N is the period of analysis; is the total electricity produced by the plant in N number of years; is the nominal discount rate ($); is the real discount rate ($).
Other important financial parameters are NPV and NCC in relation to the economics of a CSP plant project. NPV indicates the absolute value of profitability of CSP Projects [27,47]. The NPV [47] and NCC [27,79] are calculated according to Equations (A4) and (A5), respectively.
References
- Charles Rajesh Kumar, J.; Majid, M.A. Renewable Energy for Sustainable Development in India: Current Status, Future Prospects, Challenges, Employment, and Investment Opportunities. Energy Sustain. Soc. 2020, 10, 2. [Google Scholar] [CrossRef]
- Bhuiyan, M.A.; Zhang, Q.; Khare, V.; Mikhaylov, A.; Pinter, G.; Huang, X. Renewable Energy Consumption and Economic Growth Nexus—A Systematic Literature Review. Front. Environ. Sci. 2022, 412, 878394. [Google Scholar] [CrossRef]
- Adebayo, T.S.; Agyekum, E.B.; Kamel, S.; Zawbaa, H.M.; Altuntaş, M. Drivers of Environmental Degradation in Turkey: Designing an SDG Framework through Advanced Quantile Approaches. Energy Rep. 2022, 8, 2008–2021. [Google Scholar] [CrossRef]
- Agyekum, E.B.; PraveenKumar, S.; Alwan, N.T.; Velkin, V.I.; Shcheklein, S.E. Effect of Dual Surface Cooling of Solar Photovoltaic Panel on the Efficiency of the Module: Experimental Investigation. Heliyon 2021, 7, e07920. [Google Scholar] [CrossRef] [PubMed]
- Shoeibi, S.; Kargarsharifabad, H.; Rahbar, N.; Khosravi, G.; Sharifpur, M. An Integrated Solar Desalination with Evacuated Tube Heat Pipe Solar Collector and New Wind Ventilator External Condenser. Sustain. Energy Technol. Assess. 2022, 50, 101857. [Google Scholar] [CrossRef]
- Dhivagar, R.; Shoeibi, S.; Kargarsharifabad, H.; Ahmadi, M.H.; Sharifpur, M. Performance Enhancement of a Solar Still Using Magnetic Powder as an Energy Storage Medium-Exergy and Environmental Analysis. Energy Sci. Eng. 2022, 10, 3154–3166. [Google Scholar] [CrossRef]
- Katsaprakakis, D.A. Computational Simulation and Dimensioning of Solar-Combi Systems for Large-Size Sports Facilities: A Case Study for the Pancretan Stadium, Crete, Greece. Energies 2020, 13, 2285. [Google Scholar] [CrossRef]
- Katsaprakakis, D.A.; Zidianakis, G. Optimized Dimensioning and Operation Automation for a Solar-Combi System for Indoor Space Heating. A Case Study for a School Building in Crete. Energies 2019, 12, 177. [Google Scholar] [CrossRef]
- Khare, V.; Nema, S.; Baredar, P. Status of Solar Wind Renewable Energy in India. Renew. Sustain. Energy Rev. 2013, 27, 1–10. [Google Scholar] [CrossRef]
- Electricity Access in Sub-Saharan Africa: Uptake, Reliability, and Complementary Factors for Economic Impact. Available online: https://openknowledge.worldbank.org/handle/10986/31333 (accessed on 28 May 2022).
- Kumar, A.; Kumar, K.; Kaushik, N.; Sharma, S.; Mishra, S. Renewable Energy in India: Current Status and Future Potentials. Renew. Sustain. Energy Rev. 2010, 14, 2434–2442. [Google Scholar] [CrossRef]
- Powell, K.M.; Rashid, K.; Ellingwood, K.; Tuttle, J.; Iverson, B.D. Hybrid Concentrated Solar Thermal Power Systems: A Review. Renew. Sustain. Energy Rev. 2017, 80, 215–237. [Google Scholar] [CrossRef]
- Tahir, S.; Ahmad, M.; Abd-ur-Rehman, H.M.; Shakir, S. Techno-Economic Assessment of Concentrated Solar Thermal Power Generation and Potential Barriers in Its Deployment in Pakistan. J. Clean. Prod. 2021, 293, 126125. [Google Scholar] [CrossRef]
- Wang, Q.; Pei, G.; Yang, H. Techno-Economic Assessment of Performance-Enhanced Parabolic trough Receiver in Concentrated Solar Power Plants. Renew. Energy 2021, 167, 629–643. [Google Scholar] [CrossRef]
- Agyekum, E.B.; Velkin, V.I. Optimization and Techno-Economic Assessment of Concentrated Solar Power (CSP) in South-Western Africa: A Case Study on Ghana. Sustain. Energy Technol. Assess. 2020, 40, 100763. [Google Scholar] [CrossRef]
- Andika, R.; Kim, Y.; Yoon, S.H.; Kim, D.H.; Choi, J.S.; Lee, M. Techno-Economic Assessment of Technological Improvements in Thermal Energy Storage of Concentrated Solar Power. Sol. Energy 2017, 157, 552–558. [Google Scholar] [CrossRef]
- Poghosyan, V.; Hassan, M.I. Techno-Economic Assessment of Substituting Natural Gas Based Heater with Thermal Energy Storage System in Parabolic through Concentrated Solar Power Plant. Renew. Energy 2015, 75, 152–164. [Google Scholar] [CrossRef]
- Purohit, I.; Purohit, P. Techno-Economic Evaluation of Concentrating Solar Power Generation in India. Energy Policy 2010, 38, 3015–3029. [Google Scholar] [CrossRef]
- Bhakta, S.; Mukherjee, V.; Shaw, B. Techno-Economic Analysis and Performance Assessment of Standalone Photovoltaic/Wind/Hybrid Power System in Lakshadweep Islands of India. J. Renew. Sustain. Energy 2015, 7, 063117. [Google Scholar] [CrossRef]
- Aseri, T.K.; Sharma, C.; Kandpal, T.C. Estimation of Capital Costs and Techno-Economic Appraisal of Parabolic through Solar Collector and Solar Power Tower Based CSP Plants in India for Different Condenser Cooling Options. Renew. Energy 2021, 178, 344–362. [Google Scholar] [CrossRef]
- Sharma, C.; Sharma, A.K.; Mullick, S.C.; Kandpal, T.C. A Study of the Effect of Design Parameters on the Performance of Linear Solar Concentrator Based Thermal Power Plants in India. Renew. Energy 2016, 87, 666–675. [Google Scholar] [CrossRef]
- Gakkhar, N.; Soni, M.S. Techno-Economic Parametric Assessment of CSP Power Generations Technologies in India. Energy Procedia 2014, 54, 152–160. [Google Scholar] [CrossRef]
- Khamlich, I.; Zeng, K.; Flamant, G.; Baeyens, J.; Zou, C.; Li, J.; Yang, X.; He, X.; Liu, Q.; Yang, H.; et al. Technical and Economic Assessment of Thermal Energy Storage in Concentrated Solar Power Plants within a Spot Electricity Market. Renew. Sustain. Energy Rev. 2021, 139, 110583. [Google Scholar] [CrossRef]
- Lashari, A.A.; Shaikh, P.H.; Leghari, Z.H.; Soomro, M.I.; Memon, Z.A.; Uqaili, M.A. The Performance Prediction and Techno-Economic Analyses of a Stand-Alone Parabolic Solar Dish/Stirling System, for Jamshoro, Pakistan. Clean. Eng. Technol. 2021, 2, 100064. [Google Scholar] [CrossRef]
- Islam, M.T.; Huda, N.; Saidur, R. Current Energy Mix and Techno-Economic Analysis of Concentrating Solar Power (CSP) Technologies in Malaysia. Renew. Energy 2019, 140, 789–806. [Google Scholar] [CrossRef]
- Rashid, K.; Mohammadi, K.; Powell, K. Dynamic Simulation and Techno-Economic Analysis of a Concentrated Solar Power (CSP) Plant Hybridized with Both Thermal Energy Storage and Natural Gas. J. Clean. Prod. 2020, 248, 119193. [Google Scholar] [CrossRef]
- Aly, A.; Bernardos, A.; Fernandez-Peruchena, C.M.; Jensen, S.S.; Pedersen, A.B. Is Concentrated Solar Power (CSP) a Feasible Option for Sub-Saharan Africa? Investigating the Techno-Economic Feasibility of CSP in Tanzania. Renew. Energy 2019, 135, 1224–1240. [Google Scholar] [CrossRef]
- Ding, W.; Bauer, T. Progress in Research and Development of Molten Chloride Salt Technology for Next Generation Concentrated Solar Power Plants. Engineering 2021, 7, 334–347. [Google Scholar] [CrossRef]
- Ortega-Fernández, I.; Hernández, A.B.; Wang, Y.; Bielsa, D. Performance Assessment of an Oil-Based Packed Bed Thermal Energy Storage Unit in a Demonstration Concentrated Solar Power Plant. Energy 2021, 217, 119378. [Google Scholar] [CrossRef]
- Parent, P.A.; Mirzania, P.; Balta-Ozkan, N.; King, P. Post Subsidy Conditions: Evaluating the Techno-Economic Performance of Concentrating Solar Power in Spain. Sol. Energy 2021, 218, 571–586. [Google Scholar] [CrossRef]
- Trabelsi, S.E.; Chargui, R.; Qoaider, L.; Liqreina, A.; Guizani, A. Techno-Economic Performance of Concentrating Solar Power Plants under the Climatic Conditions of the Southern Region of Tunisia. Energy Convers. Manag. 2016, 119, 203–214. [Google Scholar] [CrossRef]
- Hirbodi, K.; Enjavi-Arsanjani, M.; Yaghoubi, M. Techno-Economic Assessment and Environmental Impact of Concentrating Solar Power Plants in Iran. Renew. Sustain. Energy Rev. 2020, 120, 109642. [Google Scholar] [CrossRef]
- Boukelia, T.E.; Bouraoui, A.; Laouafi, A.; Djimli, S.; Kabar, Y. 3E (Energy-Exergy-Economic) Comparative Study of Integrating Wet and Dry Cooling Systems in Solar Tower Power Plants. Energy 2020, 200, 117567. [Google Scholar] [CrossRef]
- Yilmazoglu, M.Z. Effects of the Selection of Heat Transfer Fluid and Condenser Type on the Performance of a Solar Thermal Power Plant with Technoeconomic Approach. Energy Convers. Manag. 2016, 111, 271–278. [Google Scholar] [CrossRef]
- Arnaoutakis, G.E.; Kefala, G.; Dakanali, E.; Katsaprakakis, D.A. Combined Operation of Wind-Pumped Hydro Storage Plant with a Concentrating Solar Power Plant for Insular Systems: A Case Study for the Island of Rhodes. Energies 2022, 15, 6822. [Google Scholar] [CrossRef]
- Arnaoutakis, G.E.; Katsaprakakis, D.A.; Christakis, D.G. Dynamic Modeling of Combined Concentrating Solar Tower and Parabolic trough for Increased Day-to-Day Performance. Appl. Energy 2022, 323, 119450. [Google Scholar] [CrossRef]
- Sharma, C.; Sharma, A.K.; Mullick, S.C.; Kandpal, T.C. Assessment of Solar Thermal Power Generation Potential in India. Renew. Sustain. Energy Rev. 2015, 42, 902–912. [Google Scholar] [CrossRef]
- Krishnamurthy, P.; Mishra, S.; Banerjee, R. An Analysis of Costs of Parabolic Trough Technology in India. Energy Policy 2012, 48, 407–419. [Google Scholar] [CrossRef]
- Chennaif, M.; Maaouane, M.; Zahboune, H.; Elhafyani, M.; Zouggar, S. Tri-objective techno-economic sizing optimization of Off-grid and On-grid renewable energy systems using Electric system Cascade Extended analysis and system Advisor Model. Appl. Energy 2022, 305, 117844. [Google Scholar] [CrossRef]
- India’s Path to Net Zero—Deutsche Bank. Available online: https://flow.db.com/more/esg/india-s-path-to-net-zero?language_id=1 (accessed on 11 October 2022).
- Climate Action Tracker India. Available online: https://climateactiontracker.org/countries/india/ (accessed on 11 October 2022).
- NREL Sam-Help-2020-11-29r1.Pdf. Available online: https://sam.nrel.gov/images/web_page_files/sam-help-2020-11-29r1.pdf (accessed on 13 May 2021).
- Amjad, F.; Agyekum, E.B.; Shah, L.A.; Abbas, A. Site Location and Allocation Decision for Onshore Wind Farms, Using Spatial Multi-Criteria Analysis and Density-Based Clustering. A Techno-Economic-Environmental Assessment, Ghana. Sustain. Energy Technol. Assess. 2021, 47, 101503. [Google Scholar] [CrossRef]
- Kumar, D. Mapping Solar Energy Potential of Southern India through Geospatial Technology. Geocarto Int. 2019, 34, 1477–1495. [Google Scholar] [CrossRef]
- Ahmadi, M.; Lotfy, M.E.; Shigenobu, R.; Yona, A.; Senjyu, T. Optimal Sizing and Placement of Rooftop Solar Photovoltaic at Kabul City Real Distribution Network. IET Gener. Transm. Distrib. 2018, 12, 303–309. [Google Scholar] [CrossRef]
- Poullikkas, A.; Hadjipaschalis, I.; Kourtis, G. A Comparative Overview of Wet and Dry Cooling Systems for Rankine Cycle Based CSP Plants. Trends Heat Mass Transf. 2013, 13, 27–50. [Google Scholar]
- Kamel, S.; Agyekum, E.B.; Adebayo, T.S.; Taha, I.B.M.; Gyamfi, B.A.; Yaqoob, S.J. Comparative Analysis of Rankine Cycle Linear Fresnel Reflector and Solar Tower Plant Technologies: Techno-Economic Analysis for Ethiopia. Sustainability 2022, 14, 1677. [Google Scholar] [CrossRef]
- Agyekum, E.B. Techno-Economic Comparative Analysis of Solar Photovoltaic Power Systems with and without Storage Systems in Three Different Climatic Regions, Ghana. Sustain. Energy Technol. Assess. 2021, 43, 100906. [Google Scholar] [CrossRef]
- Agyekum, E.B.; Adebayo, T.S.; Bekun, F.V.; Kumar, N.M.; Panjwani, M.K. Effect of Two Different Heat Transfer Fluids on the Performance of Solar Tower Csp by Comparing Recompression Supercritical CO2 and Rankine Power Cycles, China. Energies 2021, 14, 3426. [Google Scholar] [CrossRef]
- India Sales Tax Rate—GST—2021 Data—2022 Forecast—2006–2020 Historical—Chart. Available online: https://tradingeconomics.com/india/sales-tax-rate (accessed on 28 May 2022).
- Income Tax Slab for FY 2022–2023, FY 2021–2022|ICICI Prulife. Available online: https://www.iciciprulife.com/insurance-library/income-tax/income-tax-slabs-rate-deductions.html (accessed on 28 May 2022).
- 4 Best Tax Saving FDs Offering over 6.5% Interest Rate—The Economic Times. Available online: https://economictimes.indiatimes.com/wealth/invest/4-best-tax-saving-fds-offering-over-6-5-under-section-80c/articleshow/94026050.cms (accessed on 10 September 2022).
- Wang, Z. Chapter 3—General Design of a Solar Thermal Power Plant. In Design of Solar Thermal Power Plants; Wang, Z., Ed.; Academic Press: Cambridge, MA, USA, 2019; pp. 117–224. ISBN 978-0-12-815613-1. [Google Scholar]
- Benammar, S.; Tee, K.F. Criticality Analysis and Maintenance of Solar Tower Power Plants by Integrating the Artificial Intelligence Approach. Energies 2021, 14, 5861. [Google Scholar] [CrossRef]
- Arnaoutakis, G.E.; Katsaprakakis, D.A. Concentrating Solar Power Advances in Geometric Optics, Materials and System Integration. Energies 2021, 14, 6229. [Google Scholar] [CrossRef]
- EnergyPlus Weather Search | EnergyPlus. Available online: https://energyplus.net/weather-search/tibet (accessed on 30 April 2021).
- Solargis Solar Resource Maps of India. Available online: https://solargis.com/maps-and-gis-data/download/india (accessed on 7 June 2022).
- Praveen, R.P. Performance Analysis and Optimization of Central Receiver Solar Thermal Power Plants for Utility Scale Power Generation. Sustainability 2020, 12, 127. [Google Scholar] [CrossRef]
- Awan, A.B.; Zubair, M.; Chandra Mouli, K.V.V. Design, Optimization and Performance Comparison of Solar Tower and Photovoltaic Power Plants. Energy 2020, 199, 117450. [Google Scholar] [CrossRef]
- Global OECD Welcomes Colombia as Its 37th Member—OECD. Available online: https://www.oecd.org/newsroom/global-oecd-welcomes-colombia-as-its-37th-member.htm (accessed on 20 February 2022).
- Ayodele, T.R.; Mosetlhe, T.C.; Yusuff, A.A.; Ntombela, M. Optimal Design of Wind-Powered Hydrogen Refuelling Station for Some Selected Cities of South Africa. Int. J. Hydrogen Energy 2021, 46, 24919–24930. [Google Scholar] [CrossRef]
- Praveenkumar, S.; Agyekum, E.B.; Ampah, J.D.; Afrane, S.; Velkin, V.I.; Mehmood, U.; Awosusi, A.A. Techno-economic optimization of PV system for hydrogen production and electric vehicle charging stations under five different climatic conditions in India. Int. J. Hydrogen Energy 2022, in press. [Google Scholar] [CrossRef]
- India Cabinet Approves India’s Updated Nationally Determined Contribution to Be Communicated to the United Nations Framework Convention on Climate Change. Available online: https://pib.gov.in/pib.gov.in/Pressreleaseshare.aspx?PRID=1847812 (accessed on 3 September 2022).
- Abbas, M.; Boumeddane, B.; Said, N.; Chikouche, A. Dish Stirling Technology: A 100 MW Solar Power Plant Using Hydrogen for Algeria. Int. J. Hydrogen Energy 2011, 36, 4305–4314. [Google Scholar] [CrossRef]
- Das, N.R.; Rai, S.C.; Nayak, A.K. Performance Analysis of Heuristic Optimization Algorithms for Demand Side Energy Scheduling with TOU Pricing. Int. J. Eng. Technol. 2018, 7, 3835–3842. [Google Scholar] [CrossRef]
- Bataineh, K.; Taamneh, Y. Performance Analysis of Stand-Alone Solar Dish Stirling System for Electricity Generation. Int. J. Heat Technol. 2017, 35, 498–508. [Google Scholar] [CrossRef]
- Zayed, M.E.; Zhao, J.; Li, W.; Elsheikh, A.H.; Zhao, Z.; Khalil, A.; Li, H. Performance Prediction and Techno-Economic Analysis of Solar Dish/Stirling System for Electricity Generation. Appl. Therm. Eng. 2020, 164, 114427. [Google Scholar] [CrossRef]
- El Boujdaini, L.; Ait Lahoussine Ouali, H.; Mezrhab, A.; Moussaoui, M.A. Techno-Economic Investigation of Parabolic Trough Solar Power Plant with Indirect Molten Salt Storage. In Proceedings of the 2019 International Conference of Computer Science and Renewable Energies, ICCSRE, Agadir, Morocco, 22–24 July 2019; pp. 18–24. [Google Scholar] [CrossRef]
- Salisu, L.; Enaburekhan, J.S.; Adamu, A.A. Techno-Economic and Life Cycle Analysis of Energy Generation Using Concentrated Solar Power (CSP) Technology in Sokoto State. Nigeria. J. Appl. Sci. Environ. Manag. 2019, 23, 775. [Google Scholar] [CrossRef]
- Sundaray, S.; Kandpal, T.C. Preliminary Feasibility Evaluation of Solar Thermal Power Generation in India. Int. J. Sustain. Energy 2014, 33, 461–469. [Google Scholar] [CrossRef]
- Xu, Y.; Pei, J.; Yuan, J.; Zhao, G. Concentrated Solar Power: Technology, Economy Analysis, and Policy Implications in China. Environ. Sci. Pollut. Res. 2022, 29, 1324–1337. [Google Scholar] [CrossRef] [PubMed]
- Lipu, M.S.H.; Jamal, T. Techno-Economic Analysis of Solar Concentrating Power (CSP) in Bangladesh. Int. J. Adv. Renew. Energy Res. 2013, 2, 750–762. [Google Scholar]
- Bhuiyan, N.; Ullah, W.; Islam, R.; Ahmed, T.; Mohammad, N. Performance Optimisation of Parabolic Trough Solar Thermal Power Plants—A Case Study in Bangladesh. Int. J. Sustain. Energy 2020, 39, 113–131. [Google Scholar] [CrossRef]
- Kalogirou, S.A. Solar Thermoelectric Power Generation in Cyprus: Selection of the Best System. Renew. Energy 2013, 49, 278–281. [Google Scholar] [CrossRef]
- Luo, Y.; Du, X.; Yang, L.; Xu, C.; Amjad, M. Impacts of Solar Multiple on the Performance of Direct Steam Generation Solar Power Tower Plant with Integrated Thermal Storage. Front. Energy 2017, 11, 461–471. [Google Scholar] [CrossRef]
- Boretti, A.; Castelletto, S. Concentrated Solar Power Solar Tower with Oversized Solar Field and Molten Salt Thermal Energy Storage Working at an Annual Average Capacity Factor of 95% in NEOM City. Energy Technol. 2021, 9, 2001097. [Google Scholar] [CrossRef]
- CAG. Concentrated Solar Power (CSP): A Potential Solution for India. Available online: https://www.cag.org.in/newsletters/public-newsense/concentrated-solar-power-csp-potential-solution-india (accessed on 20 February 2022).
- Andal, A.G.; Praveen, K.S.; Andal, E.G.; Qasim, M.A.; Velkin, V.I. Perspectives on the Barriers to Nuclear Power Generation in the Philippines: Prospects for Directions in Energy Research in the Global South. Inventions 2022, 7, 53. [Google Scholar] [CrossRef]
- Chaurasiya, P.K.; Warudkar, V.; Ahmed, S. Wind Energy Development and Policy in India: A Review. Energy Strategy Rev. 2019, 24, 342–357. [Google Scholar] [CrossRef]
- Kulkarni, S.H.; Anil, T.R. Renewable Energy in India—Barriers to Wind Energy. Strateg. Plan. Energy Environ. 2018, 38, 40–69. [Google Scholar] [CrossRef]
- Make in India: Objectives, Target, Funding, Stakeholders & Progress Card—The Indian Wire. Available online: https://www.theindianwire.com/politics/make-in-india-215144/ (accessed on 20 February 2022).
- Bishoyi, D.; Sudhakar, K. Modeling and Performance Simulation of 100 MW LFR Based Solar Thermal Power Plant in Udaipur India. Resour.-Effic. Technol. 2017, 3, 365–377. [Google Scholar] [CrossRef]
- Zhao, Z.Y.; Chang, R.D.; Chen, Y.L. What Hinder the Further Development of Wind Power in China? A Socio-Technical Barrier Study. Energy Policy 2016, 88, 465–476. [Google Scholar] [CrossRef]
- Addressing Barriers to Scaling Up Renewable Energy through Industry Involvement—Shakti Sustainable Energy Foundation. Available online: https://shaktifoundation.in/report/addressing-barriers-to-scaling-up-renewable-energy-through-industry-involvement/ (accessed on 20 February 2022).
- Sarangi, G.K. Green Energy Finance in India: Challenges and Solutions; Working Paper 863; Asian Development Bank Institute: Tokyo, Japan, 2018. [Google Scholar]
- Seetharaman, M.K.; Patwa, N.; Saravanan, G.Y. Breaking Barriers in Deployment of Renewable Energy. Heliyon 2019, 5, e01166. [Google Scholar] [CrossRef]
- Andhra Pradesh Readies for 3 Capitals While Uttarakhand Doesn’t Have Even 1 after 19 Yrs—News Analysis News. Available online: https://www.indiatoday.in/news-analysis/story/andhra-pradesh-readies-for-3-capitals-while-uttarakhand-doesn-t-have-even-1-after-19-yrs-1639463-2020-01-23 (accessed on 20 February 2022).
- Indian States and Capitals 2022, 28 States and 8 UTs List. Available online: https://www.careerpower.in/states-and-capitals-of-india.html (accessed on 20 February 2022).
- Kaldate, A.; Kanase-Patil, A.; Bewoor, A.; Kumar, R.; Lokhande, S.; Sharifpur, M.; Praveenkumar, S. Comparative feasibility analysis of an integrated renewable energy system (IRES) for an urban area. Sustain. Energy Technol. Assess. 2022, 54, 102795. [Google Scholar] [CrossRef]
- TEDA. Tamilnadu Energy Development Agency. Available online: https://teda.in/ (accessed on 20 February 2022).
- What Is Special Category Status to States and How Is It Different from Special Status—Education Today News. Available online: https://www.indiatoday.in/education-today/gk-current-affairs/story/difference-between-special-category-status-and-special-status-india-1577912-2019-08-06 (accessed on 20 February 2022).
- Special Category Status and Centre-State Finances. Available online: https://prsindia.org/theprsblog/special-category-status-and-centre-state-finances (accessed on 20 February 2022).
- Prime Minister of India. Cabinet Approves Special Assistance Measure for Andhra Pradesh. Available online: https://www.pmindia.gov.in/en/news_updates/cabinet-approves-special-assistance-measure-for-andhra-pradesh/ (accessed on 20 February 2022).
- Blair, N.; Diorio, N.; Freeman, J.; Gilman, P.; Janzou, S.; Neises, T.W.; Wagner, M.J. System Advisor Model (SAM) General Description (Version 2017.9.5); Technical Report; National Renewable Energy Lab.: Golden, CO, USA, 2018. [Google Scholar]
- Kolb, G.J.; Ho, C.K.; Mancini, T.R.; Gary, J.A. Power Tower Technology Roadmap and Cost Reduction Plan; Sandia National Laboratories (SNL): Albuquerque, NM, USA. 2011. Available online: https://www.osti.gov/servlets/purl/1011644 (accessed on 20 February 2022).
- Turchi, C.S.; Heath, G.A. Power Tower Plant Cost and Material Input to Life Cycle Assessment (LCA). Contract Des. 2012, 1–53. [Google Scholar]
Publisher’s Note: MDPI stays neutral with regard to jurisdictional claims in published maps and institutional affiliations. |
© 2022 by the authors. Licensee MDPI, Basel, Switzerland. This article is an open access article distributed under the terms and conditions of the Creative Commons Attribution (CC BY) license (https://creativecommons.org/licenses/by/4.0/).