Article

Fundamental Investigations on the High-Temperature Corrosion of Spinel-Forming Alumina Castables by Steel Slags

by
Jakub Ramult
1,*,
Klaudia Wiśniewska-Tobiasz
2,
Ryszard Prorok
1 and
Dominika Madej
1
1
Department of Ceramics and Refractories, Faculty of Materials Science and Ceramics, AGH University of Science and Technology, al. A. Mickiewicza 30, 30-059 Krakow, Poland
2
Zakłady Magnezytowe ROPCZYCE S.A., ul. Postępu, 15C, 02-676 Warszawa, Poland
*
Author to whom correspondence should be addressed.
Appl. Sci. 2022, 12(2), 704; https://doi.org/10.3390/app12020704
Submission received: 30 November 2021 / Revised: 3 January 2022 / Accepted: 3 January 2022 / Published: 11 January 2022

Abstract

:
This study investigated the effect of the CaO/SiO2 mass ratio of steel slag on the corrosion behavior of spinel-forming alumina-based castables with a content of MgO (3–7 wt.%). Equiweight mixtures of castables and slags were calculated by FactSage, observed by HMTA, fired at 1350 °C, and investigated by XRD. From these results, we conclude that the presence of SiO2-rich phases accelerates the growth of the liquid phase in a narrow temperature range for the tested samples, which accelerates the degradation of castables. The static corrosion test was conducted by means of the coating method at 1450 °C. The corrosion index (IC) in the regions of castables affected by slags was calculated. Phases and phase distributions were evaluated by SEM-EDS. From these results, we conclude that for the slag with the lowest mass ratio of CaO/SiO2 (1.1), the reaction zone occurs only below the slag-refractory interface, which indicates the aggressive character of this slag.

1. Introduction

Castables are widely used as a lining for the metal line and the bottom of steelmaking ladles; although contact with the liquid slag is not continuous, contact does occur in certain steps of the process [1]. Progressive technological development has made cement castables, i.e., low-cement castable (LCC) and ultra-low-cement castable (ULCC), less often used in today’s industry. The above-mentioned castables differ in their CaO content: LCC (1–2.5 wt.%), ULCC (0.2–1 wt.%), and NCC (<0.2 wt.%) [2]. Currently, no-cement castables (NCC) are increasingly used. In comparison, the reactive powders Al2O3, MgO, microsilica, and sols are widely used as binders [3]. Reducing the overall CaO content of the castable to a minimum allows the reduction of porosity, the increase of strength, and an improvment to both refractory and corrosion properties [4]. LCC castables are often supplemented with microsilica. This common phenomenon is due to several factors. One of the main features is the ability to react and form strong bonds, both at low and high temperatures. The use of small amounts of microsilica in castables promotes hydration resistance, e.g., MgO. The porosity of such a castable is also reduced, and the mechanical properties are improved [4,5,6]. However, if the CaO content in the castables is too high, low-melting phases (e.g., anorthite: 1553 °C and gehlenite: 1593 °C) [7] may form in reaction with SiO2, which negatively affect the properties of the concretes. Therefore, the use of microsilica is only beneficial in castables with a low CaO content or in castables not containing CaO [8]. Therefore, good technological properties can be proposed as castables composed of corundum as aggregates and a cement-free binder containing fine powders of MgO, Al2O3, and SiO2. This enables the ability to obtain a resistant material. Therefore, in this study, spinel-forming alumina castables with different amounts of MgO were tested. The new generation of cement-free castables eliminates the need to use a large amount of mixing water, which increases the material’s resistance to high temperatures and reduces the tendency to crack and corrode [9,10]. Many authors have tested castables by modifying their composition. Analysis of the literature [11,12,13,14,15] showed that the use of spinel in castables, both spinel-forming and spinel-containing, as well as the content of microsilica in castables, has an impact on the technological solutions of castables.
The use of spinel (MgAl2O4) in castables increases both the slag corrosion resistance and the erosion resistance, and increases the operating temperatures [16]. The slag corrosion resistance of castables containing spinel, as well as the mechanism of the castables’ reaction in contact with slag, have been investigated by many authors [17,18,19,20,21,22,23,24,25].
Spinel can be added to castables in two ways: as prefabricated spinel or by the in situ matrix reaction of Al2O3 with MgO. The optimal prefabricated spinel content is in arange from 15 to 30 wt.%. However, a spinel content of between 20 and 25 wt.% is most preferred [16]. Spinel content that is too low increases the rate of corrosion reactions. On the other hand, too much spinel in the material results in deeper penetration of the material by the slag [26,27]. Yamamura et al. [28], assessed the corrosion resistance and penetration of alumina spinel castables with different cement content using slag. Based on these studies, it was found that the corrosion of the material increases with the increase of CaO content in the material. By using a prefabricated spinel, the risk of cracking as a result of hydration of free MgO is reduced [29]. Spinel formation, as seen in the in situ reaction, results in the spinel being better dispersed in the matrix than the prefabricated spinel. In situ spinel formation involves the expansion of the material’s volume as a result of its formation and creates stresses. Additionally, microcracks may occur due to differences in the density of MgO, Al2O3, and MgAl2O4, which could favor slag penetration into the material [26]. Therefore, in the present tests, corrosion was carried out on previously fired castables where the spinel forming process was completed. The advantage of in situ spinel over prefabricated spinel is the lower costs of its use [30]. Another important aspect is the grain size of the spinel. Spinel must be added predominantly to the fine fraction of the castable formulation to attain the best penetration resistance [16]. The stoichiometry of spinel also has a significant influence on the chemical and physical properties. Compared with stoichiometric spinels, alumina-rich spinels are superior. The stoichiometric amount of Al2O3 in spinel is 71.67 wt.%. The commercially available spinels MR66, AR78, and AR90 are distinguished by their chemical composition, containing 66%, 78%, and 90% alumina, respectively [31]. Diaz et al. concluded that the corrosion thickness increases with an increase in magnesia content in the castable [32]. However, there are not many publications that investigate this problem with calcium aluminate cement-free (CAC-free) refractories.
Steel slag, a by-product of steelmaking processes, is a group of materials diverse in terms of composition that cause the corrosion of castables. Depending on the feedstock used in the smelting process, the slag may contain ores, impurities, fluxes, metal oxides, and residues from the coal or coke combustion process. Steel slag is formed by smelting steel in converters, and slag from the oxygen converter (LD), slag from steel refining in the ladle (VAD, VOD, LF) [33,34,35], slag from the electric arc furnace, and slag from the tundish from the continuous casting of steel can be distinguished. Two methods of obtaining steel in converters with bottom blowing are the most widely used. The main oxides in the converter slag are CaO and Fe2O3, but there may also be oxides of MgO, Al2O3, SiO2, MnO, P2O5, and TiO2 [36]. Due to their chemical nature, we can distinguish acidic slags (the main component is SiO2) and basic slags (the main component is CaO). The CaO/SiO2 (C/S) ratio in the slag determines its chemical nature and has a significant impact on the corrosion resistance of the refractory lining. The basic quaternary system of slag (VOD) is CaO-SiO2-MgO-Al2O3. In this system, the slag phases that can coexist with each other include CA2-CA-C2AS, CM2A8-C2AS-CAS2, CAS2-CMS2-S, C2MS2-CS-C2AS, and CM2A8-CAS2-A [37,38,39,40].
It is difficult to relate corrosion test results of castables on a laboratory scale to industrial conditions, but such attempts are made. Various methods are used to determine the corrosion resistance of refractory material. Dynamic methods are characterized by the displacement of slag in relation to the refractory working surface and static methods. Static methods include immersion, contact, pyrometric cone, and crucible methods. The rotary kiln method, induction furnace method, and finger test method are dynamic methods [41,42]. In this study, the contact method was used.
The aim of the work is to investigate the corrosive properties of spinel-forming alumina castables with different contents of MgO (3,5 i 7 wt.%) in contact with slags with different mass ratios of C/S from 1.1, 3.5, and 5.5 and to predict possibly occurring corrosion mechanisms between the tested castables and slags. Analyses were carried out on mixtures composed of 50 wt.% castables and 50 wt.% slag. In order to predict the probable sequence of development of the resultant reactions of MgO, Al2O3, and SiO2 from castables and simple oxides from slags at increasing temperatures, FactSage thermochemical software was used for the thermodynamic analysis of the phase transformation. To determine changes in phase properties of mixtures containing castables and synthetic slags at increasing temperatures, heating microscopy thermal analysis (HMTA) was performed. The high-temperature analysis study was conducted in the temperature range of 25–1450 °C. Moreover, the X-ray diffraction (XRD) of castable samples and equiweight mixtures of castables with slag after heat treatment was carried out. A static corrosion test using the coating method was also performed for three rectangular samples of castables with different wt.% of MgO and three slags with different C/S mass ratios. The corrosion test was carried out at a temperature of 1450 °C. After the corrosion test, the corrosion index (IC) was determined for the tested samples using the MATLAB calculation program. Additionally, this paper presents the results of the SEM-EDS analysis for castables with 7 wt.% of MgO and three types of slags. The probable reaction mechanisms occurring during corrosion were determined on the basis of the results of this analysis. The division into zones formed during the processes has been determined.

2. Materials and Methods

2.1. Preparation of Spinel-Forming Alumina Castablesand Characterization Methods

Alumina-spinel castables were prepared using white tabular alumina from Almatis and electrocorundum as aggregates, alumina fines (reactive aluminas from Almatis), 1 wt.% of silica fume from Elkem, magnesia, chemical admixture Lithopix–P5 (Zschimmer&Schwarz, Germany), and 5.5 wt.% of water. Three types of castables were prepared, differing in the content of MgO: 3 wt.% (A), 5 wt.% (B), and 7 wt.% (C). After the dry and wet mixing procedures, the prismatic samples were cast, cured at room temperature for 24 h under a relative humidity of ~90%, dried at 110 °C for another 24 h, and finally, heat-treated for 10 h at 1500 °C. As a result of this process, an in situ spinel was formed.
For corrosion tests using the contact method, three samples were cut from each type of castable: A, B, and C, with dimensions of approximately 60 × 50 × 20 mm. For X-ray diffraction (XRD) uncorroded castable analysis, as well as for further corrosion tests, the castable pieces were ground using a ball mill to obtain fine powders with grains below 63 µm.
The values of apparent density and open porosity of the castables were determined using Archimedes’ principle (hydrostatic weighing method).

2.2. Preparation of Synthetic Steel Slags

The three synthetic slag compositions studied in the present investigation were formulated according to alkalinity (C/S mass ratio): 5.5 (S3), 3.5 (S2), and 1.1 (S1). The materials used for synthesis were CaCO3 (99%, CHEMPUR), SiO2 (96.5%, POCH), MgO (98%, Acros Organics), Al2O3 (99%, Acros Organics), MnO (99%, Sigma-Aldrich), Fe2O3 (97%, Sigma-Aldrich), and TiO2 (98%, POCH) as reagents. Dry powders were weighed according to each planned C/S mass ratio and homogenized for 2 h in a vibratory ball mill. The homogenized mixtures were then pressed into cylinders and calcined at 1000 °C for 10 h. The cylindrical samples were ground in a ball mill to obtain the powder for further corrosion investigation. The three mixes containing the calcined slags and CaF2 as a VOD flux (0.5 wt.%) were homogenized for 30 min and were left for further research in a desiccator. The intended composition of the slag S1 contained 41.71 wt.% CaO, 37.37 wt.% SiO2, 11.96 wt.% MgO, 6.68 wt.% Al2O3, 0.60 wt.% MnO, 1.40 wt.% Fe2O3, 0.30 wt.% TiO2. Slag S2 contained 36.23 wt.% CaO, 10.16 wt.% SiO2, 16.44 wt.% MgO, 35.37 wt.% Al2O3, 0.20 wt.% MnO, 1.30 wt.% Fe2O3, 0.30 wt.% TiO2. Slag S3 contained 55.16 wt.% CaO, 9.96 wt.% SiO2, 4.58 wt.% MgO, 29.69 wt.% Al2O3, 0.20 wt.% MnO, 0.10 wt.% Fe2O3, 0.30 wt.% TiO2.

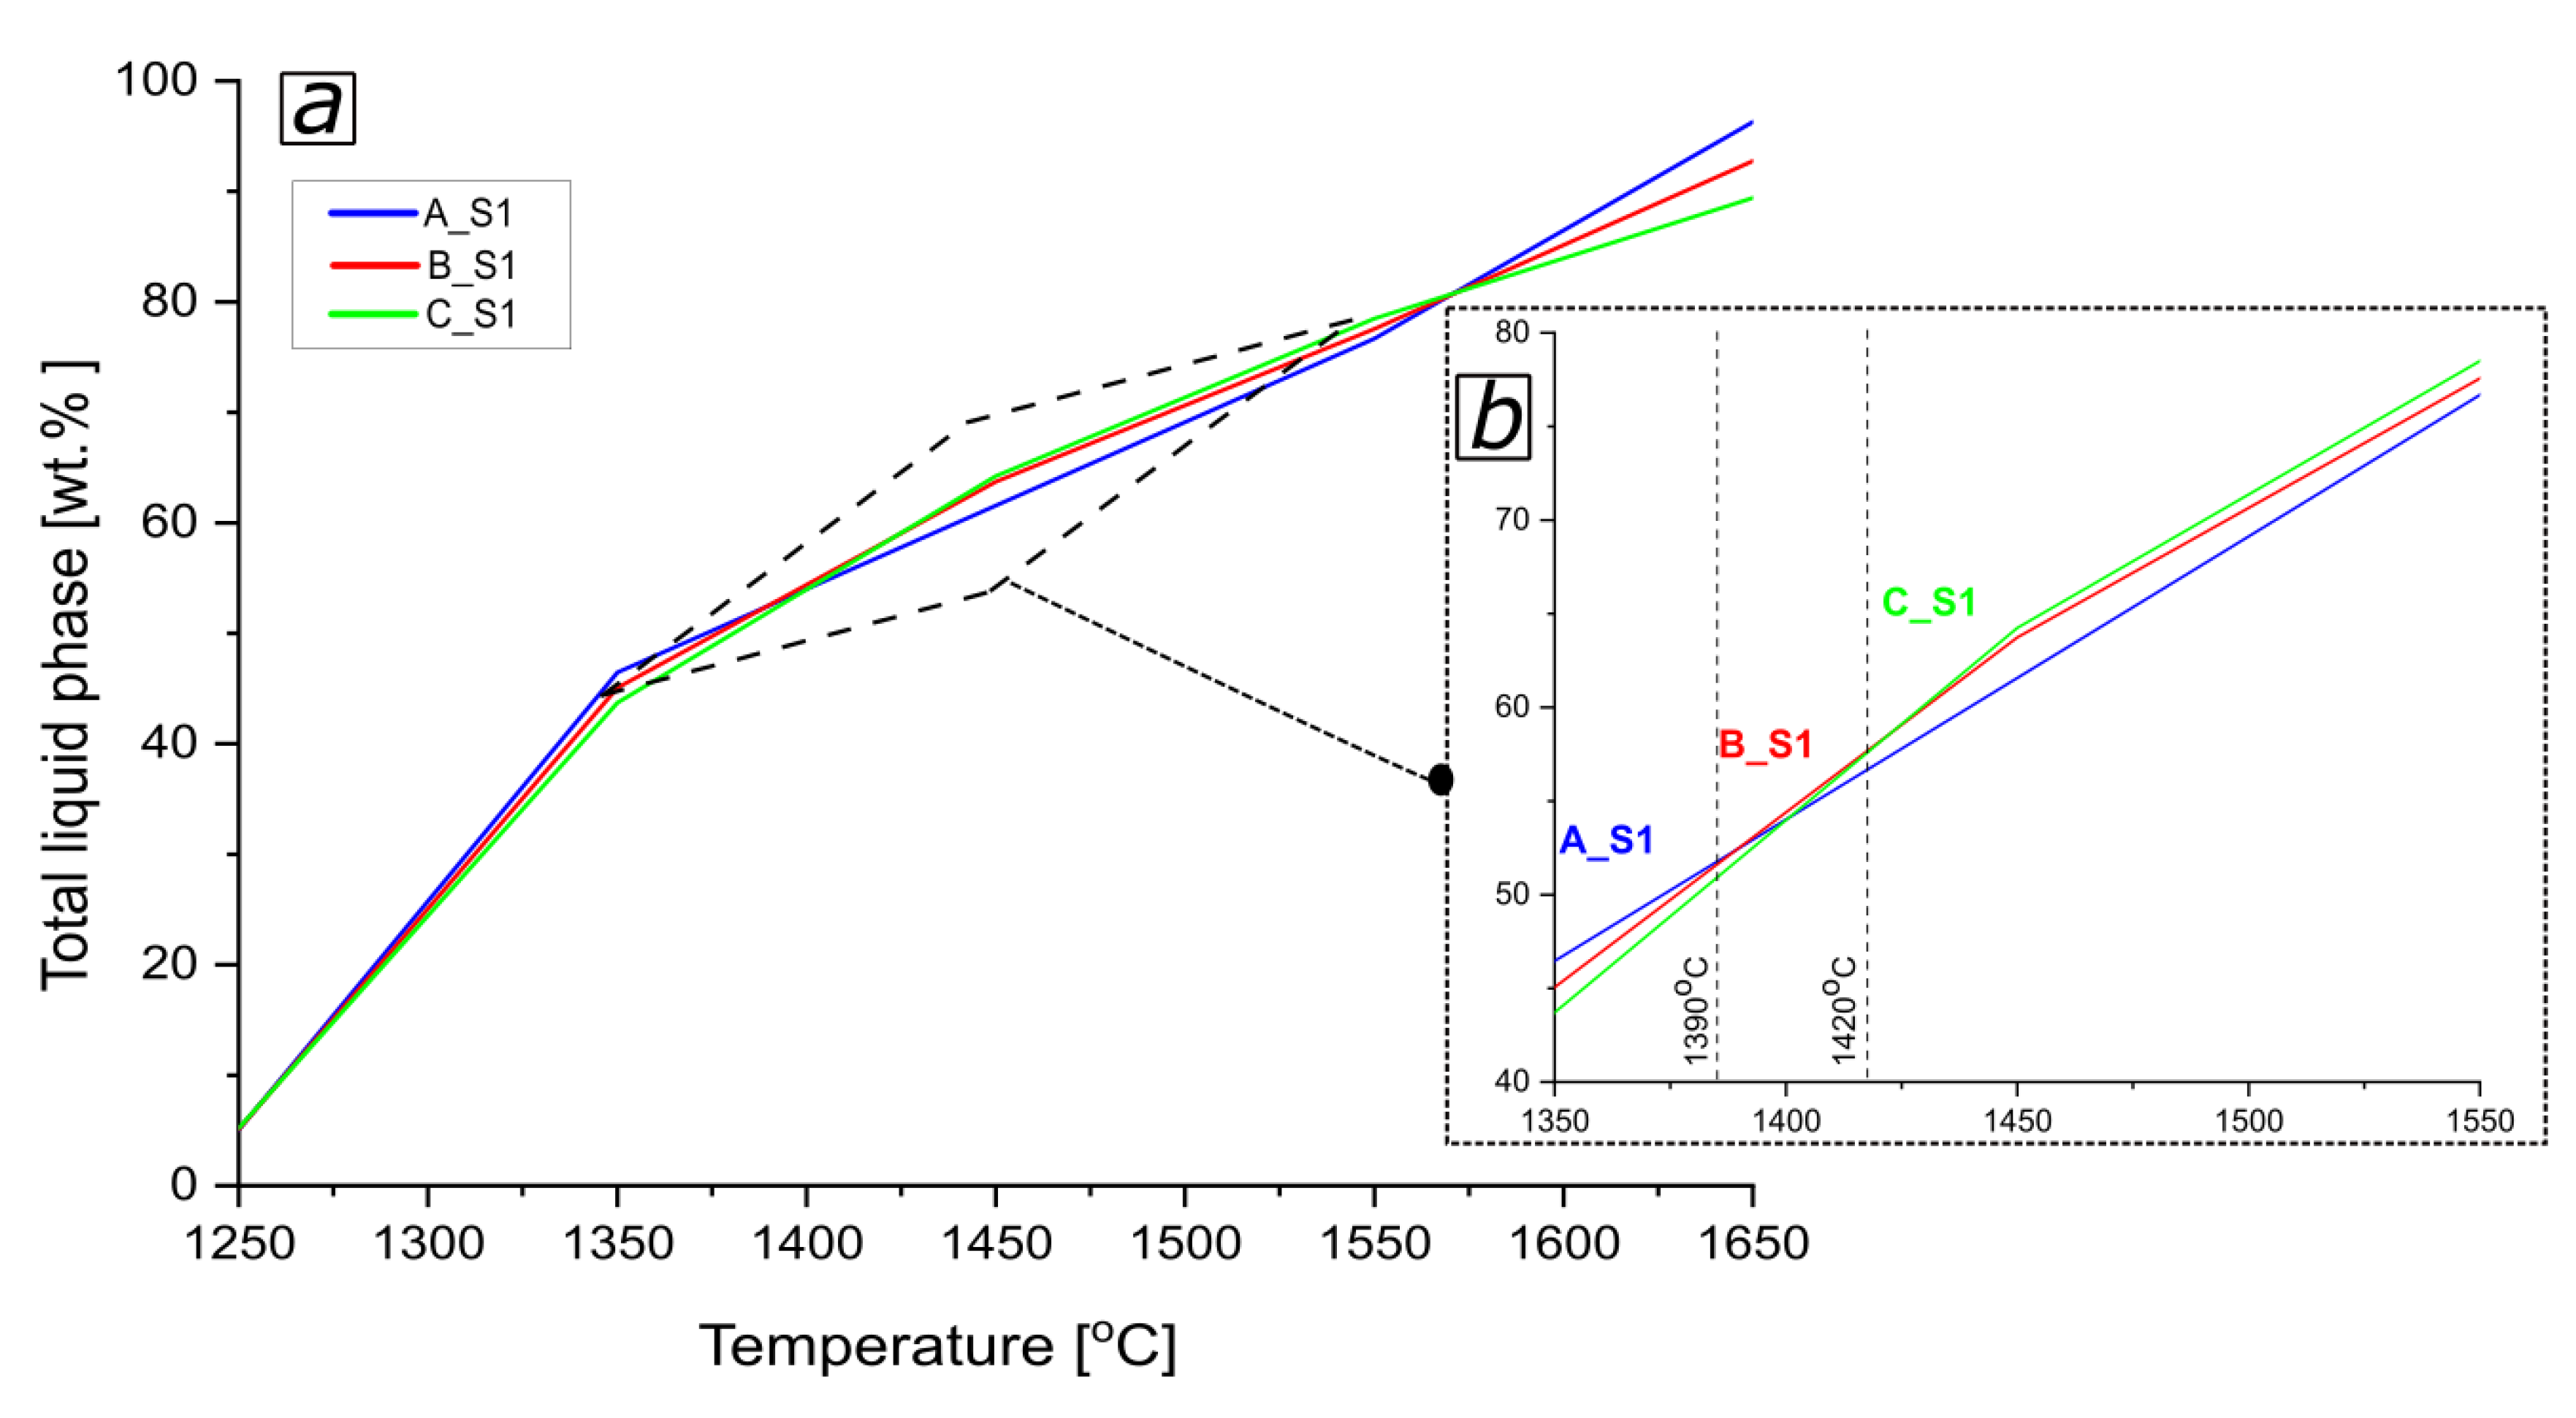
2.3. Thermodynamic Simulation of the Effect of Slag Chemistry on the Corrosion Behavior Ofspinel-Forming Alumina Castables

Using FactSage thermochemical software (FS 6.4) and databases (FTmisc 6.4, FToxid 6.4, FactPS 6.4), thermodynamic simulations of three slags with different C/S mass ratios in the temperature range of 1000–2000 °C were performed. These resulted in thermodynamic predictions of solid and liquid phases of slags (S1, S2, and S3). In addition, nine reactive mixtures composed of 50 wt.%slag and 50 wt.% castable were tested to predict the phase compositions of each reactive mixture as a function of temperature (1250–1650 °C) fired in the air. The calculations simulating the corrosive reactions in these mixtures consist of finding the minimum Gibbs free energy and determining the composition of the tested mixtures depending on the temperature. The data from Table 1 were used for the calculations.
This provided thermodynamic predictions of the solid phases and liquid phase of the slags and reactive mixtures containing components of the cement-free corundum-spinel refractory castable and steel slags when exposed to an oxidizing atmosphere vs. increasing temperature; thermodynamic predictions of the CM2A8 solid phase of the reactive mixtures A_S1, B_S1, C_S1, A_S2, and B_S2 versus increasing temperature. Moreover, both temperatures at the onset (i.e., the temperature at which the first portion of the liquid phase is formed) and liquid content and chemical composition vs. temperature were determined.

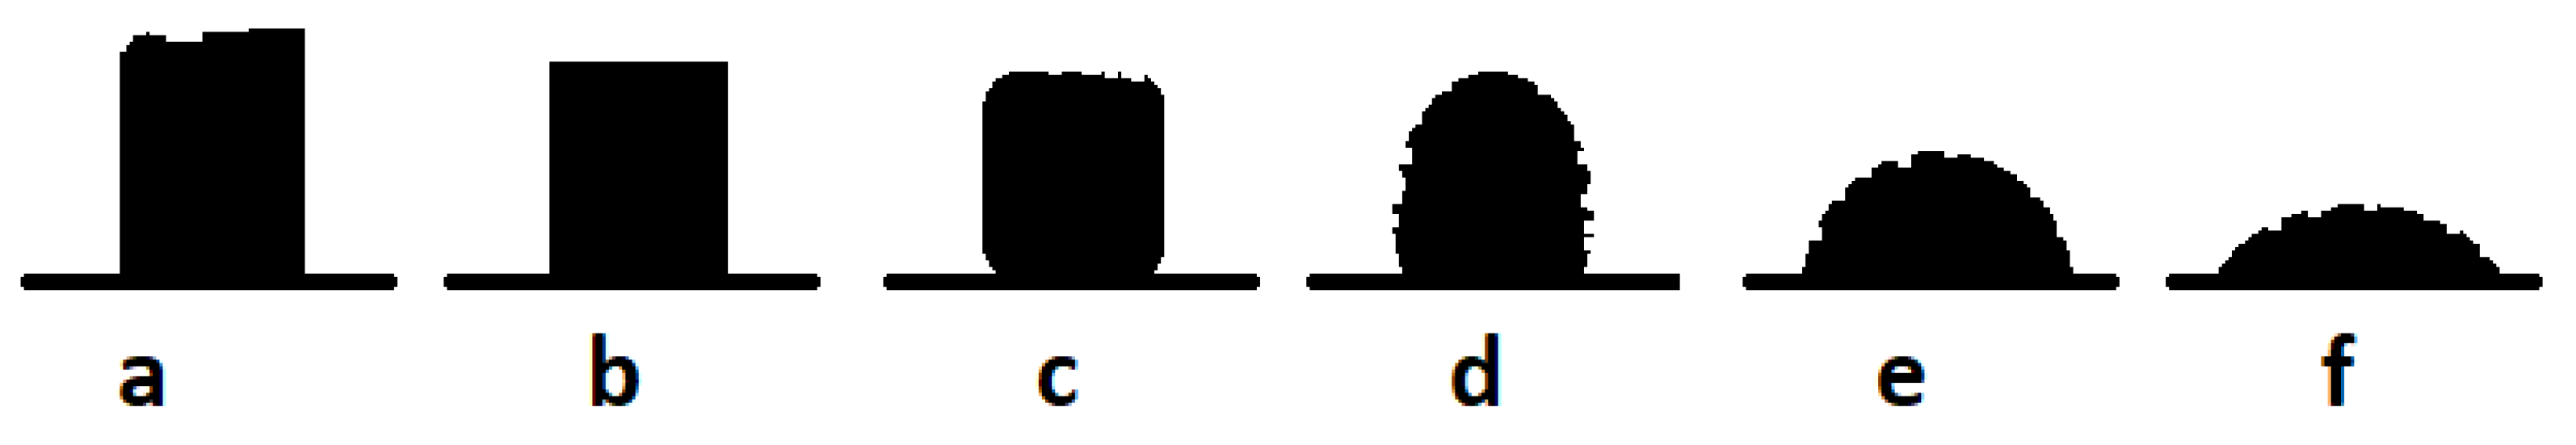
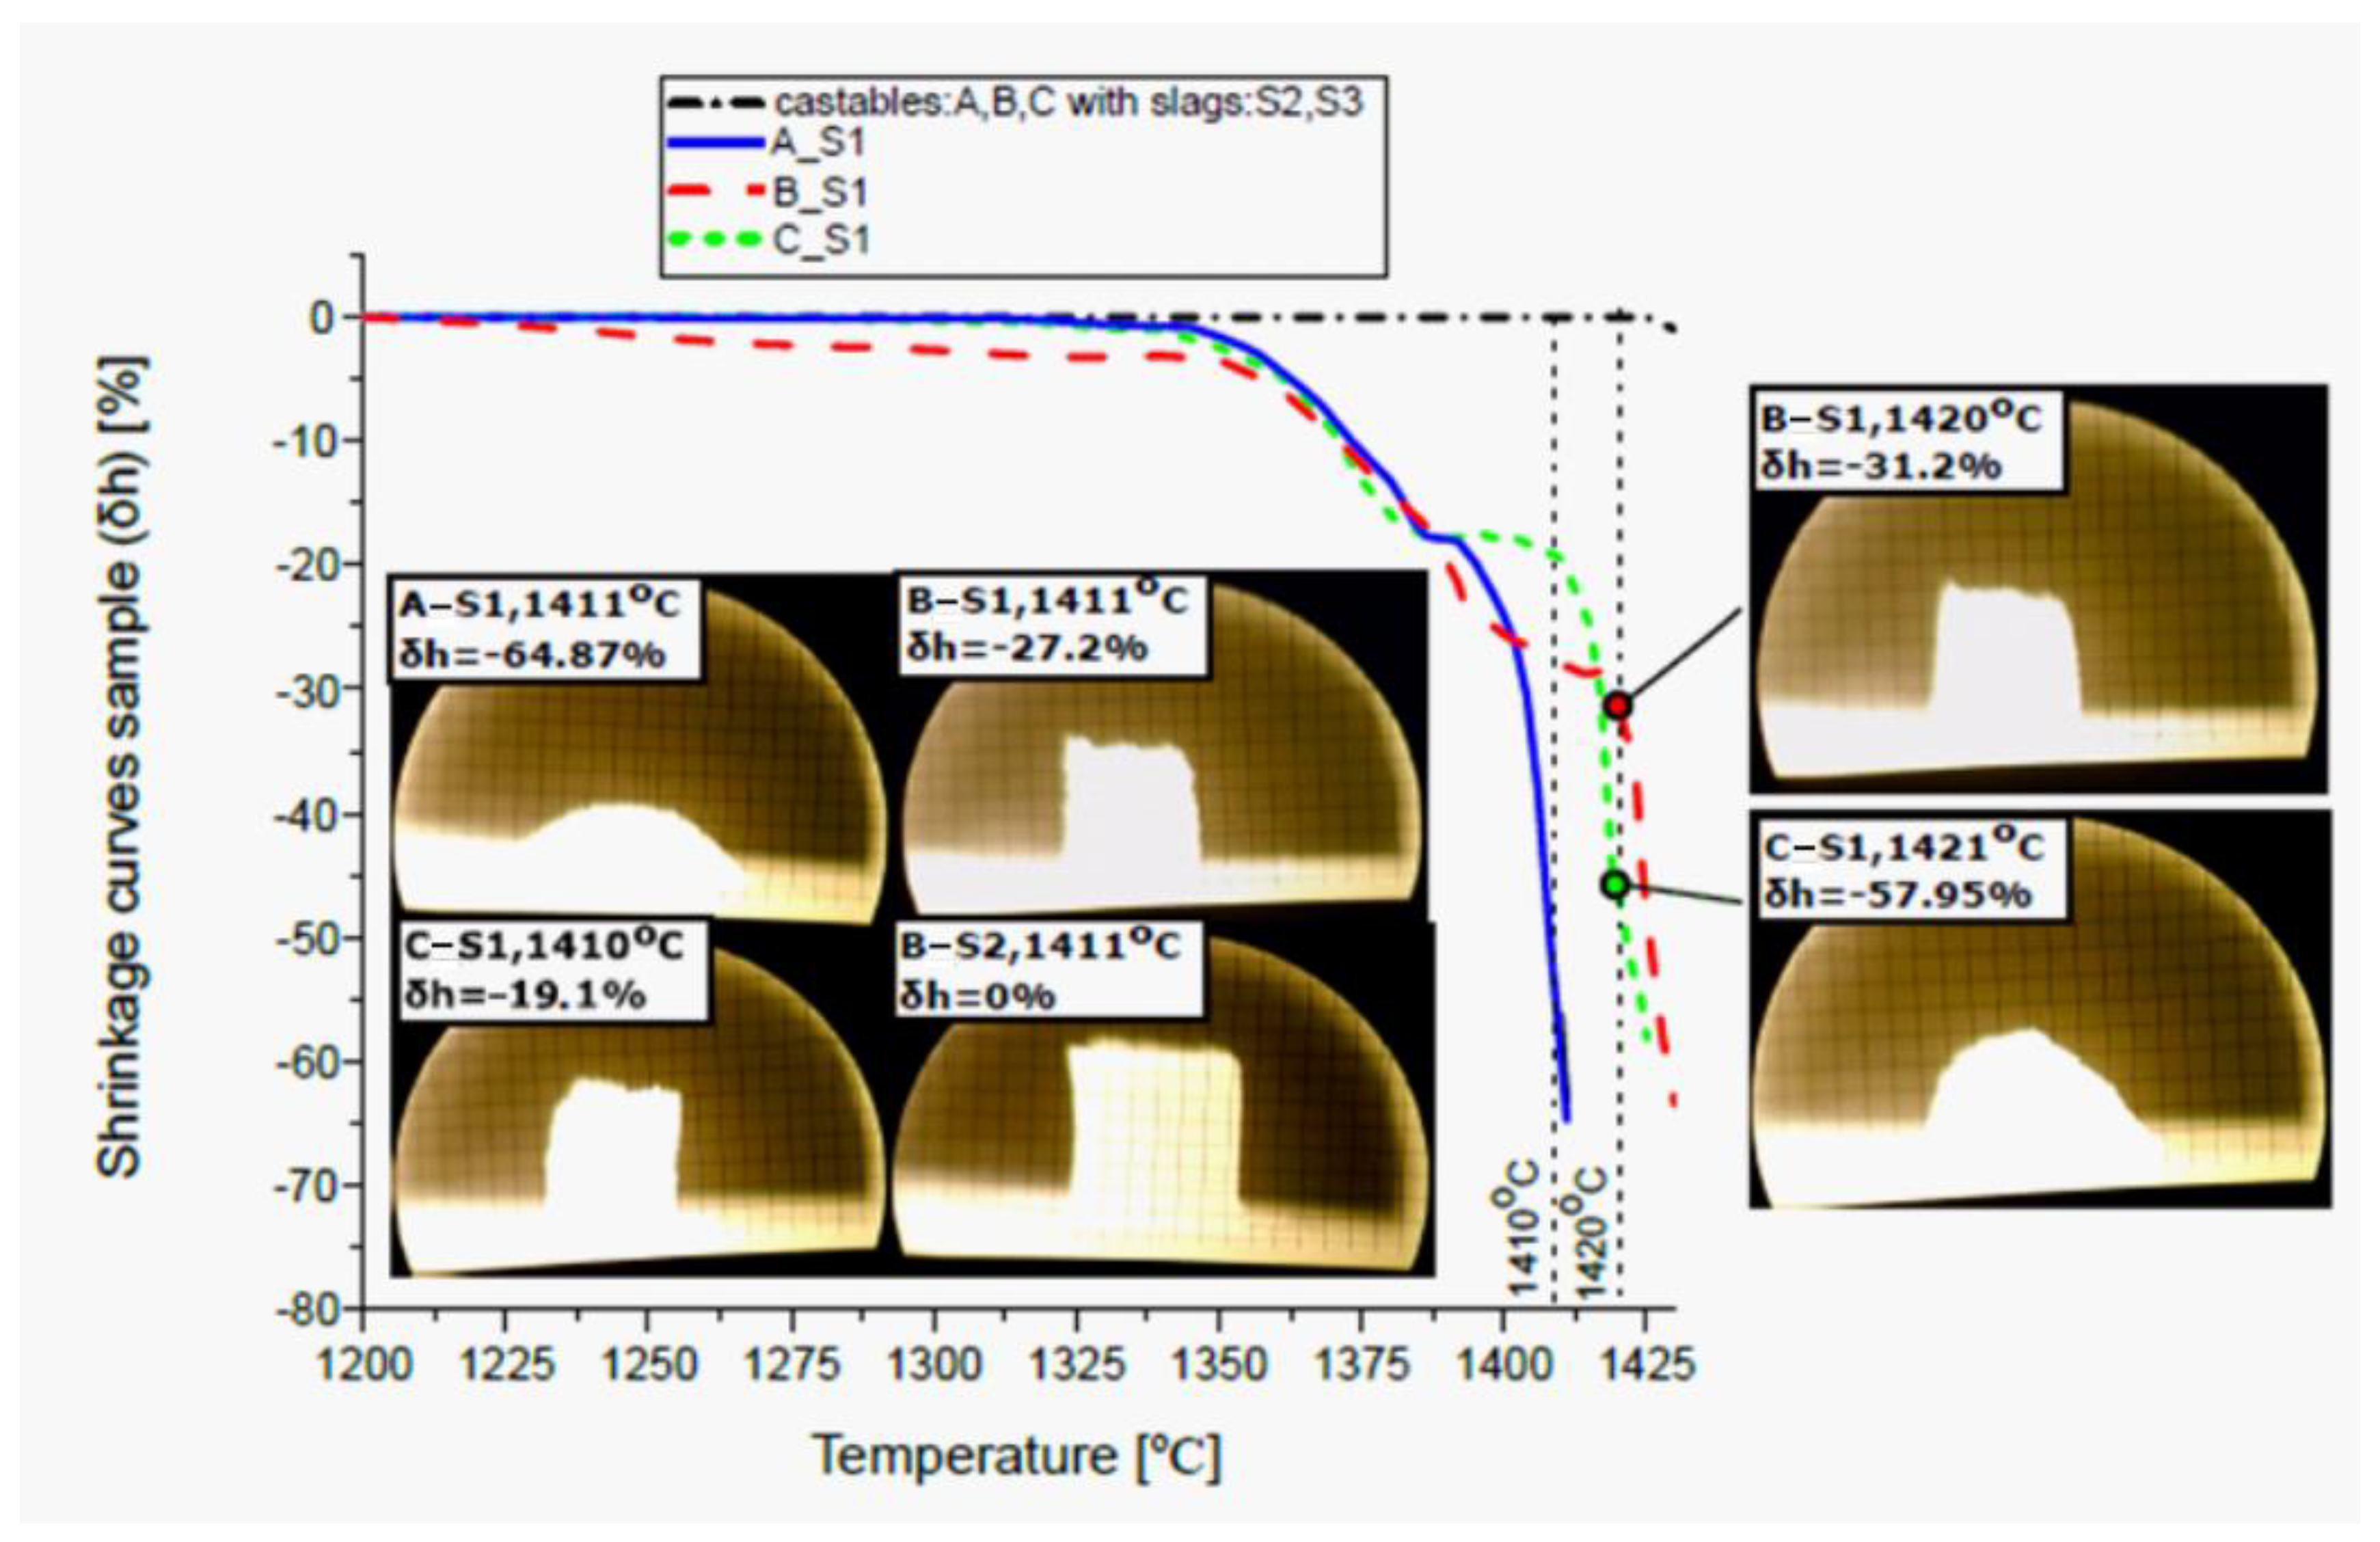
2.4. Laboratory-Scale Investigations of the Mixtures Containing Alumina-Spinel Castablesand Synthetic Slags Using the Heating Microscopy Thermal Analysis (HMTA) and X-Ray Diffraction (XRD)

Heating microscopy thermal analysis (HMTA) and X-ray diffraction (XRD) were used to analyze the changes in the phase properties of the mixtures containing alumina-spinel castables and synthetic slags vs. an increasing temperature. For this purpose, reactive mixtures of castables and slags in a ratio of 50:50 wt.% were prepared.
In order to prepare the mixtures, 50 wt.% castables and 50 wt.%, slag (previously prepared powders) (Section 2.1 and Section 2.2) castables (with MgO: 3 wt.%, 5 wt.%, and 7 wt.%) with three types of slag calcinates differing in C/S mass ratio (from 1.1–5.5) were used. Each of the castables was weighed to 10 g and mixed with each of the slag types, also 10 g, which resulted in nine castable-slag mixtures. Then, the obtained mixtures were each homogenized for approximately1 h. The compositions of the mixtures obtained (A_S1, A_S2, A_S3, B_S1, B_S2, B_S3, C_S1, C_S2, C_S3) are shown in Table 1. Then, cylindrical samples of these mixtures with a diameter of 2.54 cm were pressed using a hydraulic hand press.
The cylindrical samples were fired at 1350 °C for 2 h. Then, the samples were crushed to a powder with a grain size of less than 63µm.XRD analysis was performed on the powder after corrosion. The ex situ XRD measurement was carried out at room temperature using an X’Pert Pro PANalytical X-ray diffractometer, with Cu Kα radiation, 0.02° per step, and 3 s time per step (2θ-range of 10°–90°). High Score Plus software (PANalytical) with the PDF-2 database supported by ICDD was used for data analysis.
For the HMTA, cubic samples were formed from the obtained reactive mixtures of 50 wt.% castable and 50 wt.% slag. The homogenized mixtures were wetted using ethanol and compacted into cubes of approximately 3 mm3 using a hand press. The high-temperature analysis study was conducted in the temperature range of 25–1450 °C. The samples were placed on a corundum plate and placed on a high-temperature microscope. The test was carried out in an oxidizing atmosphere, and the heating rate was 10 °C/min. The device’s camera captured a live image of the sample’s changes as the temperature rises.
The geometrical changes of the samples during heating were estimated by observing changes in the height and shape of the sample at different temperatures throughout the experiment. The images were recorded with a digital camera. Figure 1 show the shapes of the samples at characteristic temperatures. Figure 1a show the initial shape of the sample at room temperature. The initial deformation temperature (Figure 1b) is the first temperature at which the shape factor changed by 1.5% with respect to the first image. The softening point (Figure 1c) is the temperature at which the sample becomes more rounded during heating and the surface of the sample changes. The sphere temperature (Figure 1d) is the temperature at which the upper corners of the sample are completely rounded, and the height of the sample equals its width. The hemisphere temperature (Figure 1e) is the temperature at which the height of the sample is half of its base width. The flow temperature (Figure 1f) is the first temperature at which the sample is melted to a third of its original height.
Formula (1) was used to determine changes in the shape of the tested samples. Based on Formula (1) and the image from a digital camera, the calculation formula was estimated, and with the help of the MATLAB program, the changes in the shape of the samples at specific temperatures were determined. Each analysis was repeated three times, and the standard deviation was within the range of the marker size used in the figures.
δ T = h ( T ) h 0 h 0 × 100   [ % ]
where:
  • δ T —change of sample linear dimensions,
  • h 0 —sample height at room temperature,
  • h(T)—sample height at temperature T.

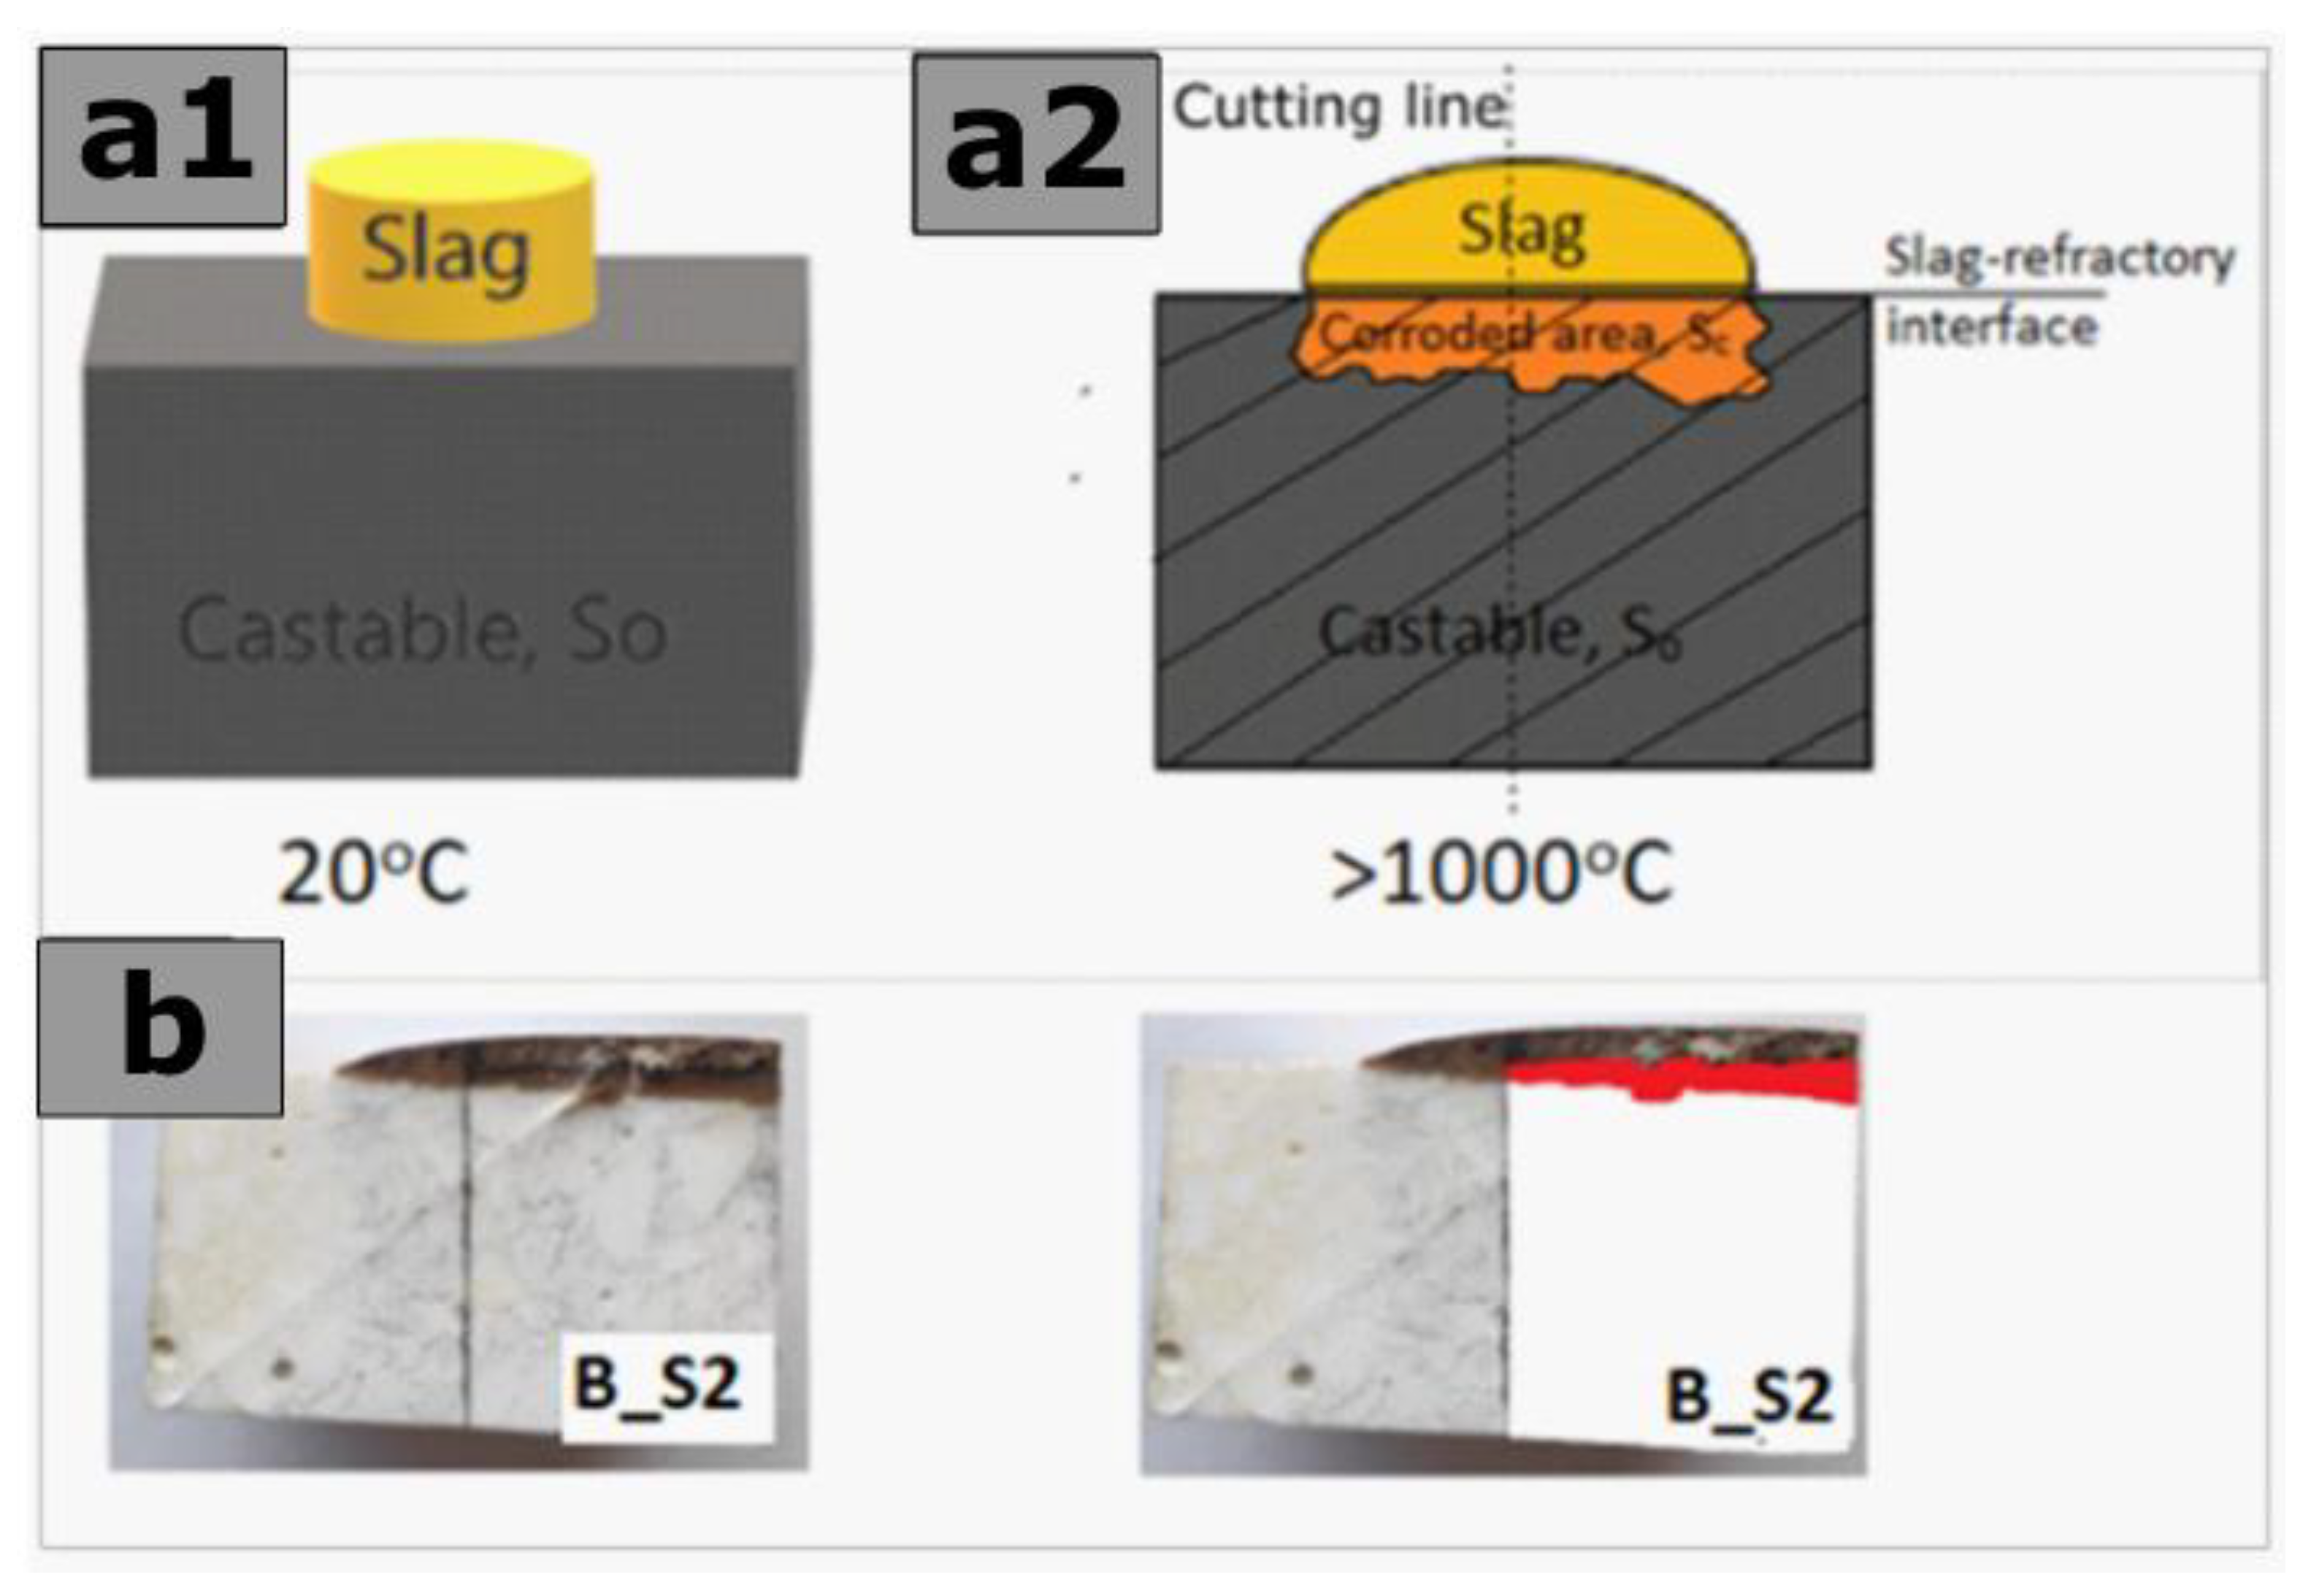
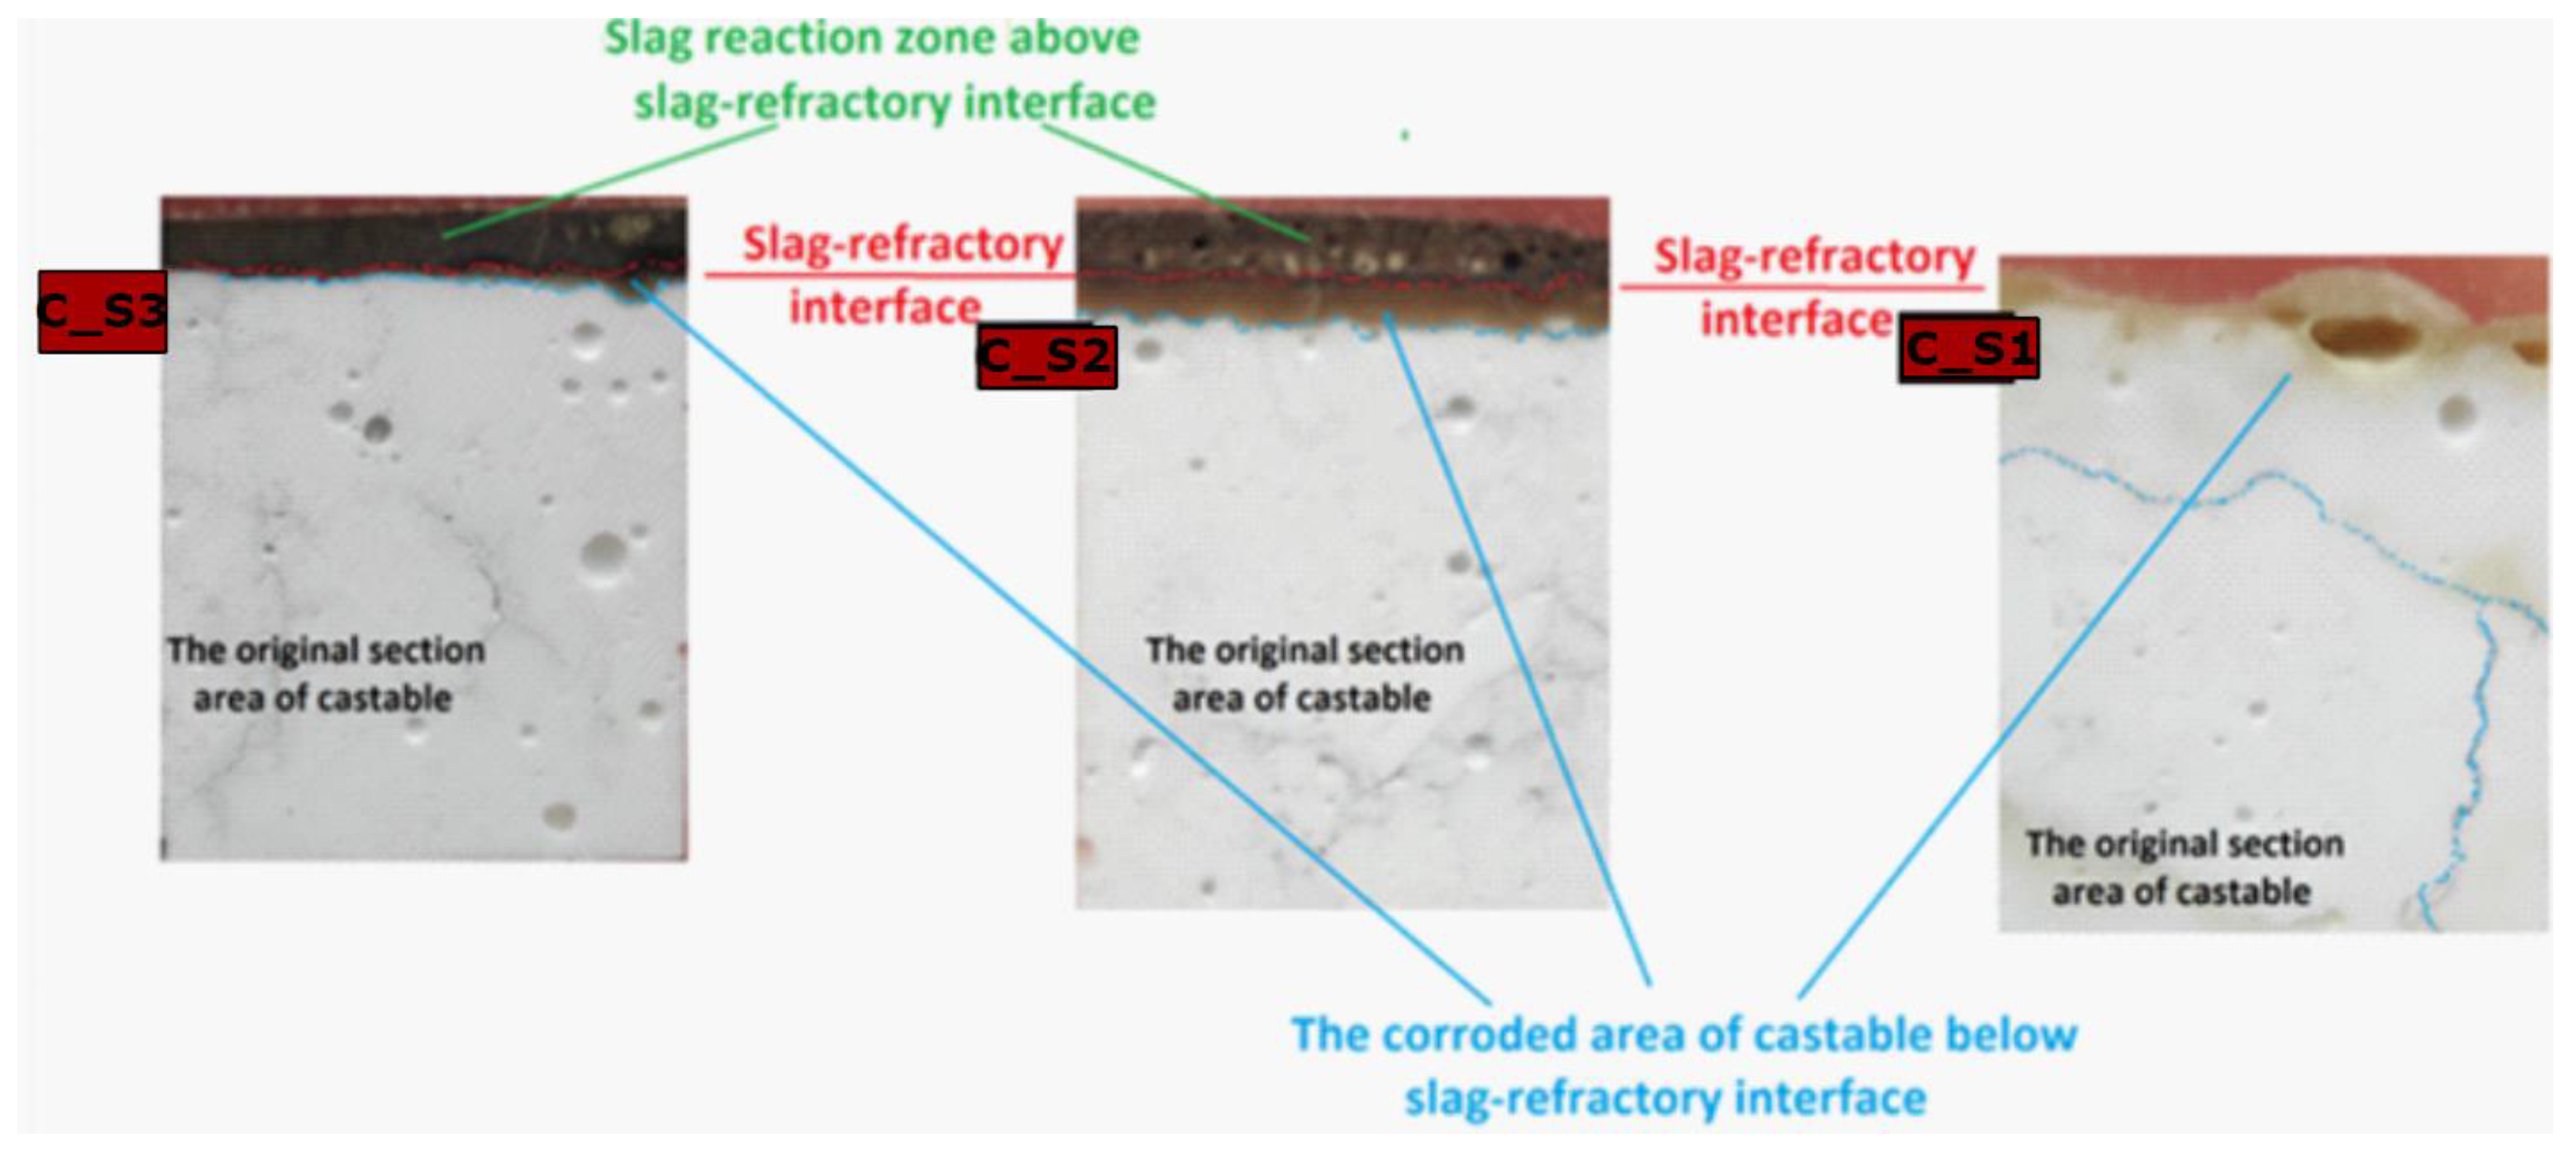
2.5. Laboratory-Scale Static Corrosion Test by the Coating Method

The rectangular specimens cut from prefabricated castables A, B, and C were subjected to the laboratory-scale static corrosion test by the coating method. For this purpose, the slags containing CaF2 were pressed into cylinders of 2.54 cm in diameter and then applied to the castable specimens according to the scheme presented in Figure 2a1. The corrosion test was performed under the following conditions: a maximum temperature of 1450 °C, 5 h to reach a maximum temperature, and a holding time of 2 h at the maximum temperature. As a result of the high temperature, the slag zone above the slag–refractory interface and the corroded area below the slag–refractory interface was formed (Figure 2a2).
At the last stage, the cross-section (cutting direction perpendicular to the slag-castable contact line) of the samples necessary for IC determination was obtained using a precision saw. Equation (2) and photos of the sample cross-sections were used to calculate the corrosion index (IC). To conduct the SEM-EDS test, the cross-sectioned corroded samples were immersed in resin and polished. Next, all samples were coated with carbon and observed under SEM. For this purpose, the Phenom XL SEM was used. Measurements were performed in the mode of 20 kV.
As shown in Figure 2, the graphic program marks the corroded area of the castable below the slag–refractory interface (SC) and the original section area of castable (SO) of the corroded samples. Using Formula 2, a script was written in the MATLAB calculation program. This procedure made it possible to determine the corrosion index (IC) of castables A, B, and C in contact with slags S1, S2, and S3, and finally, to compare the corrosion resistance of the castables. Photographs of corroded castable cross-sections were used to perform the calculations, as shown, for example, in Figure 2b. The results of the corrosion index (IC) were repeated three times, which allowed for the determination of the standard deviation.
IC = SC/SO × 100 (%)
where:
  • IC—the corrosion index,
  • SC—the corroded area of castable below the slag-refractory interface,
  • SO—the original section area of castable.

3. Results

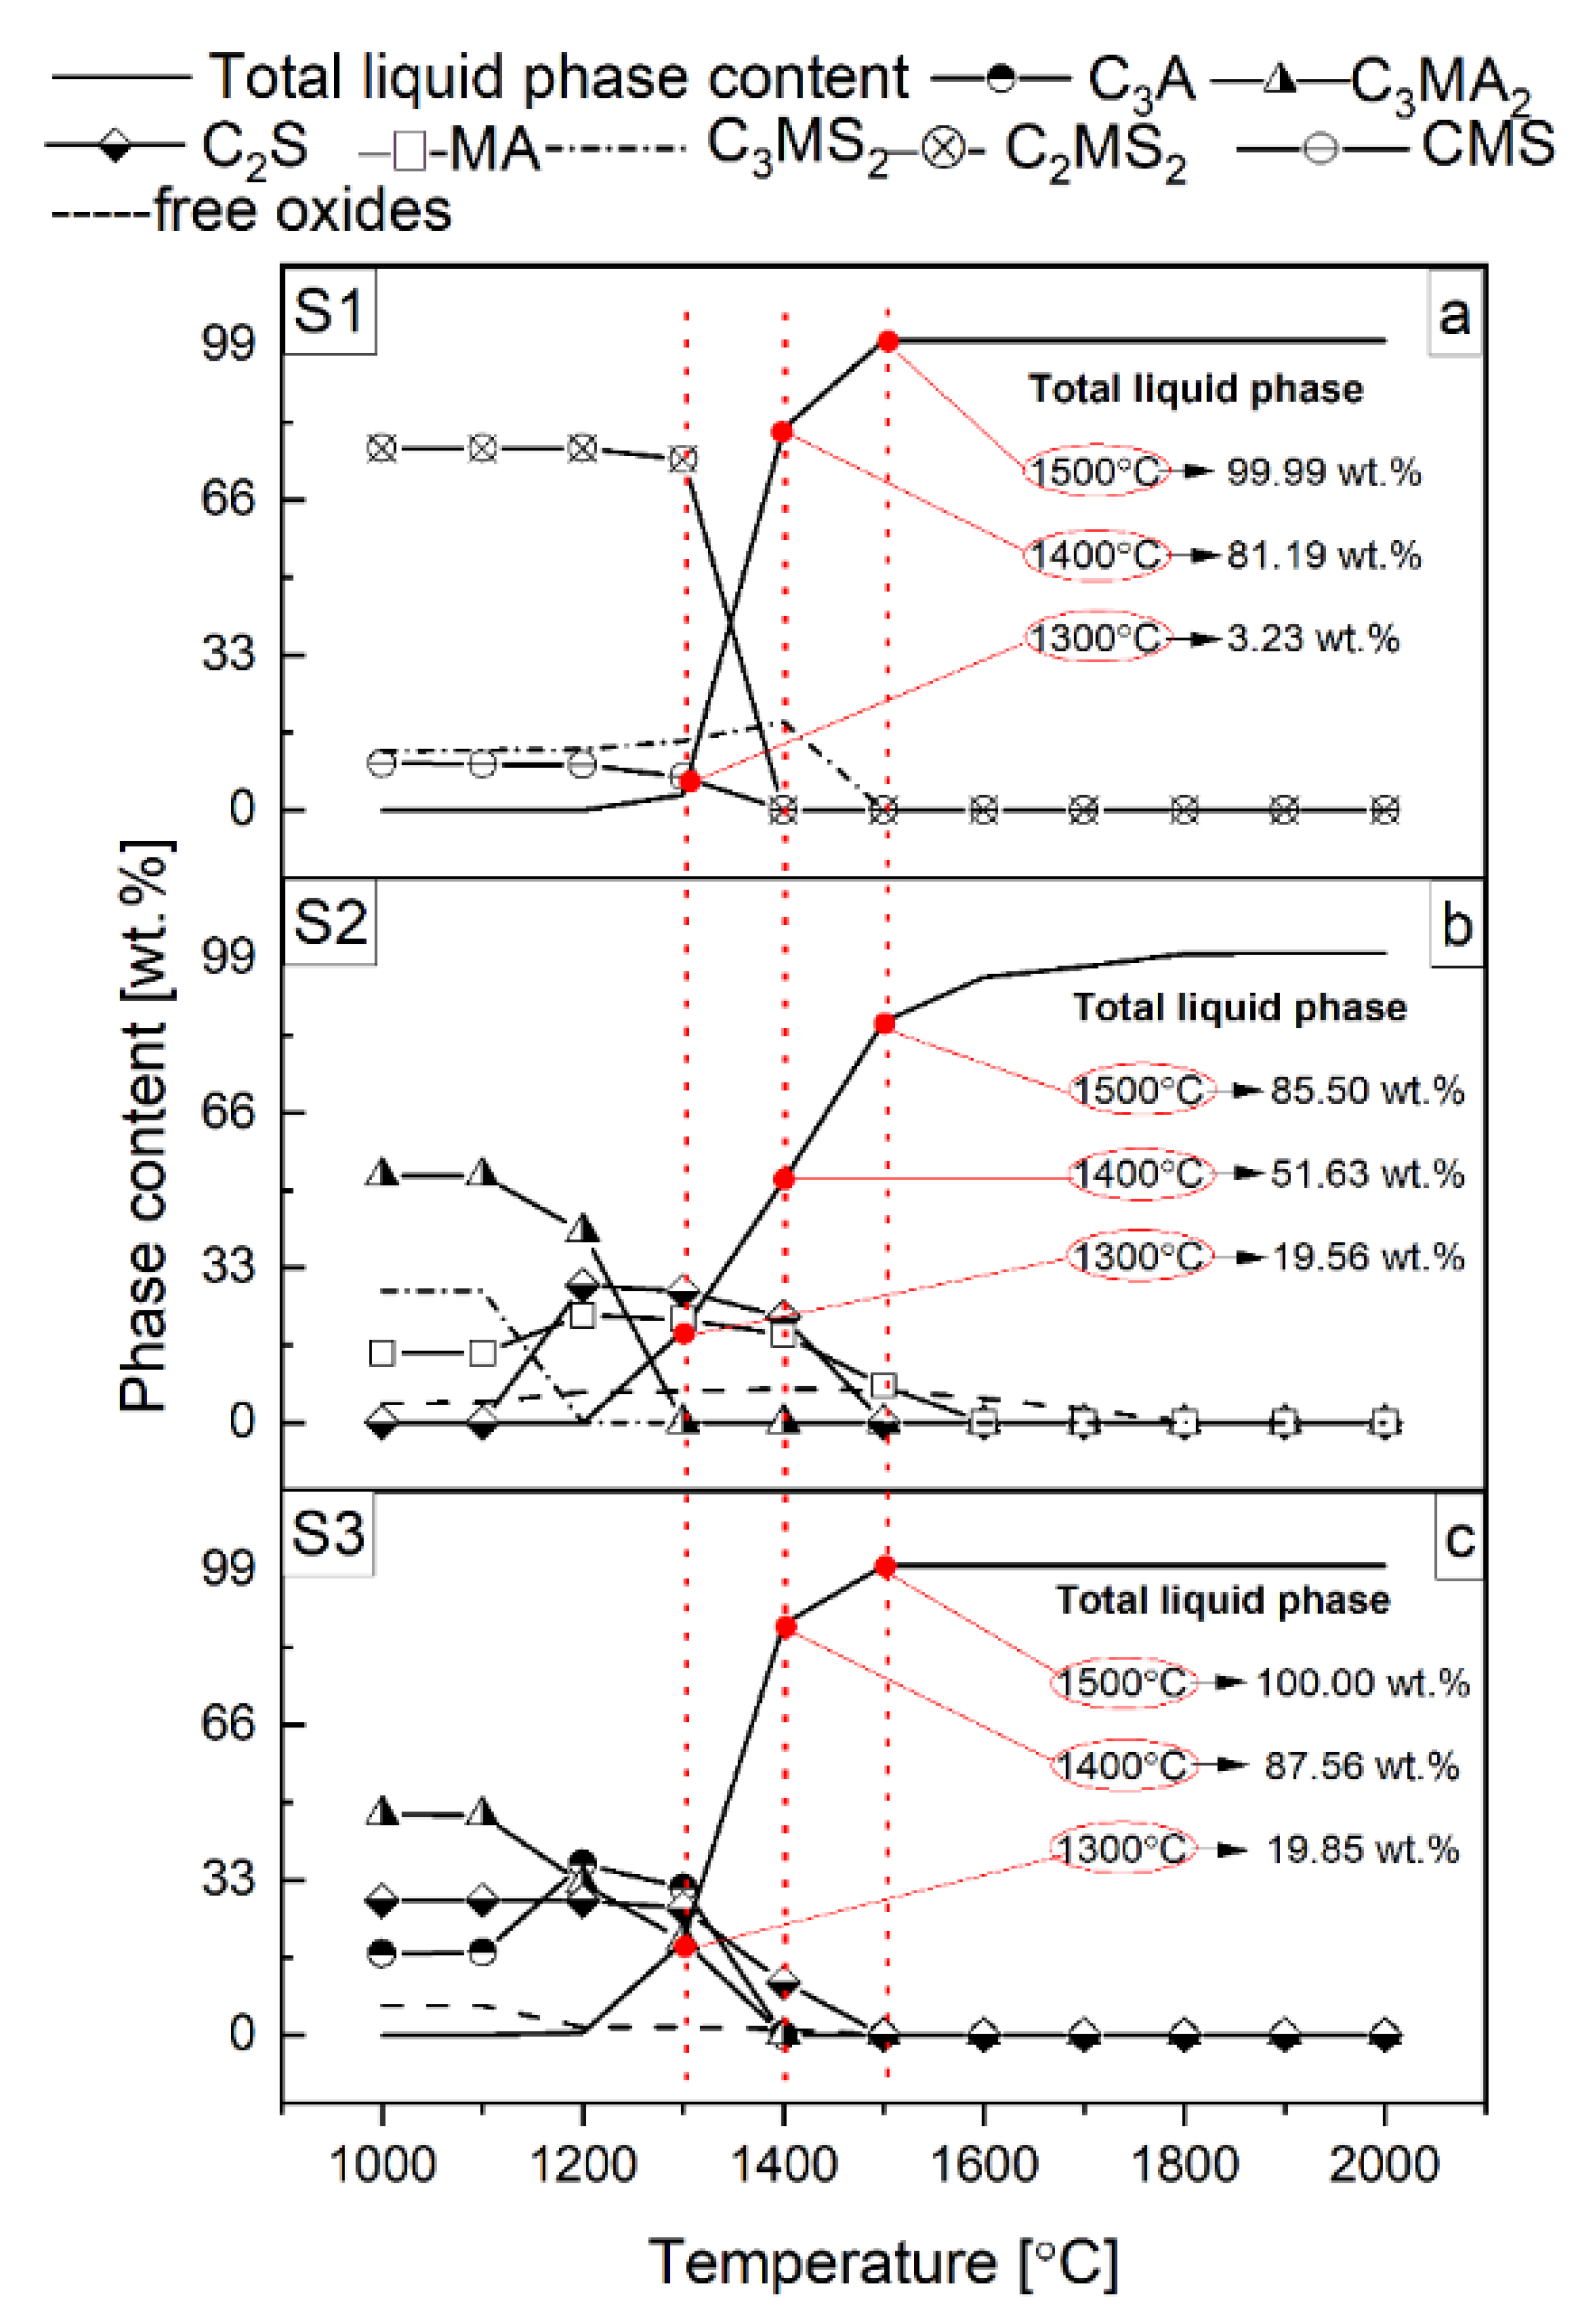
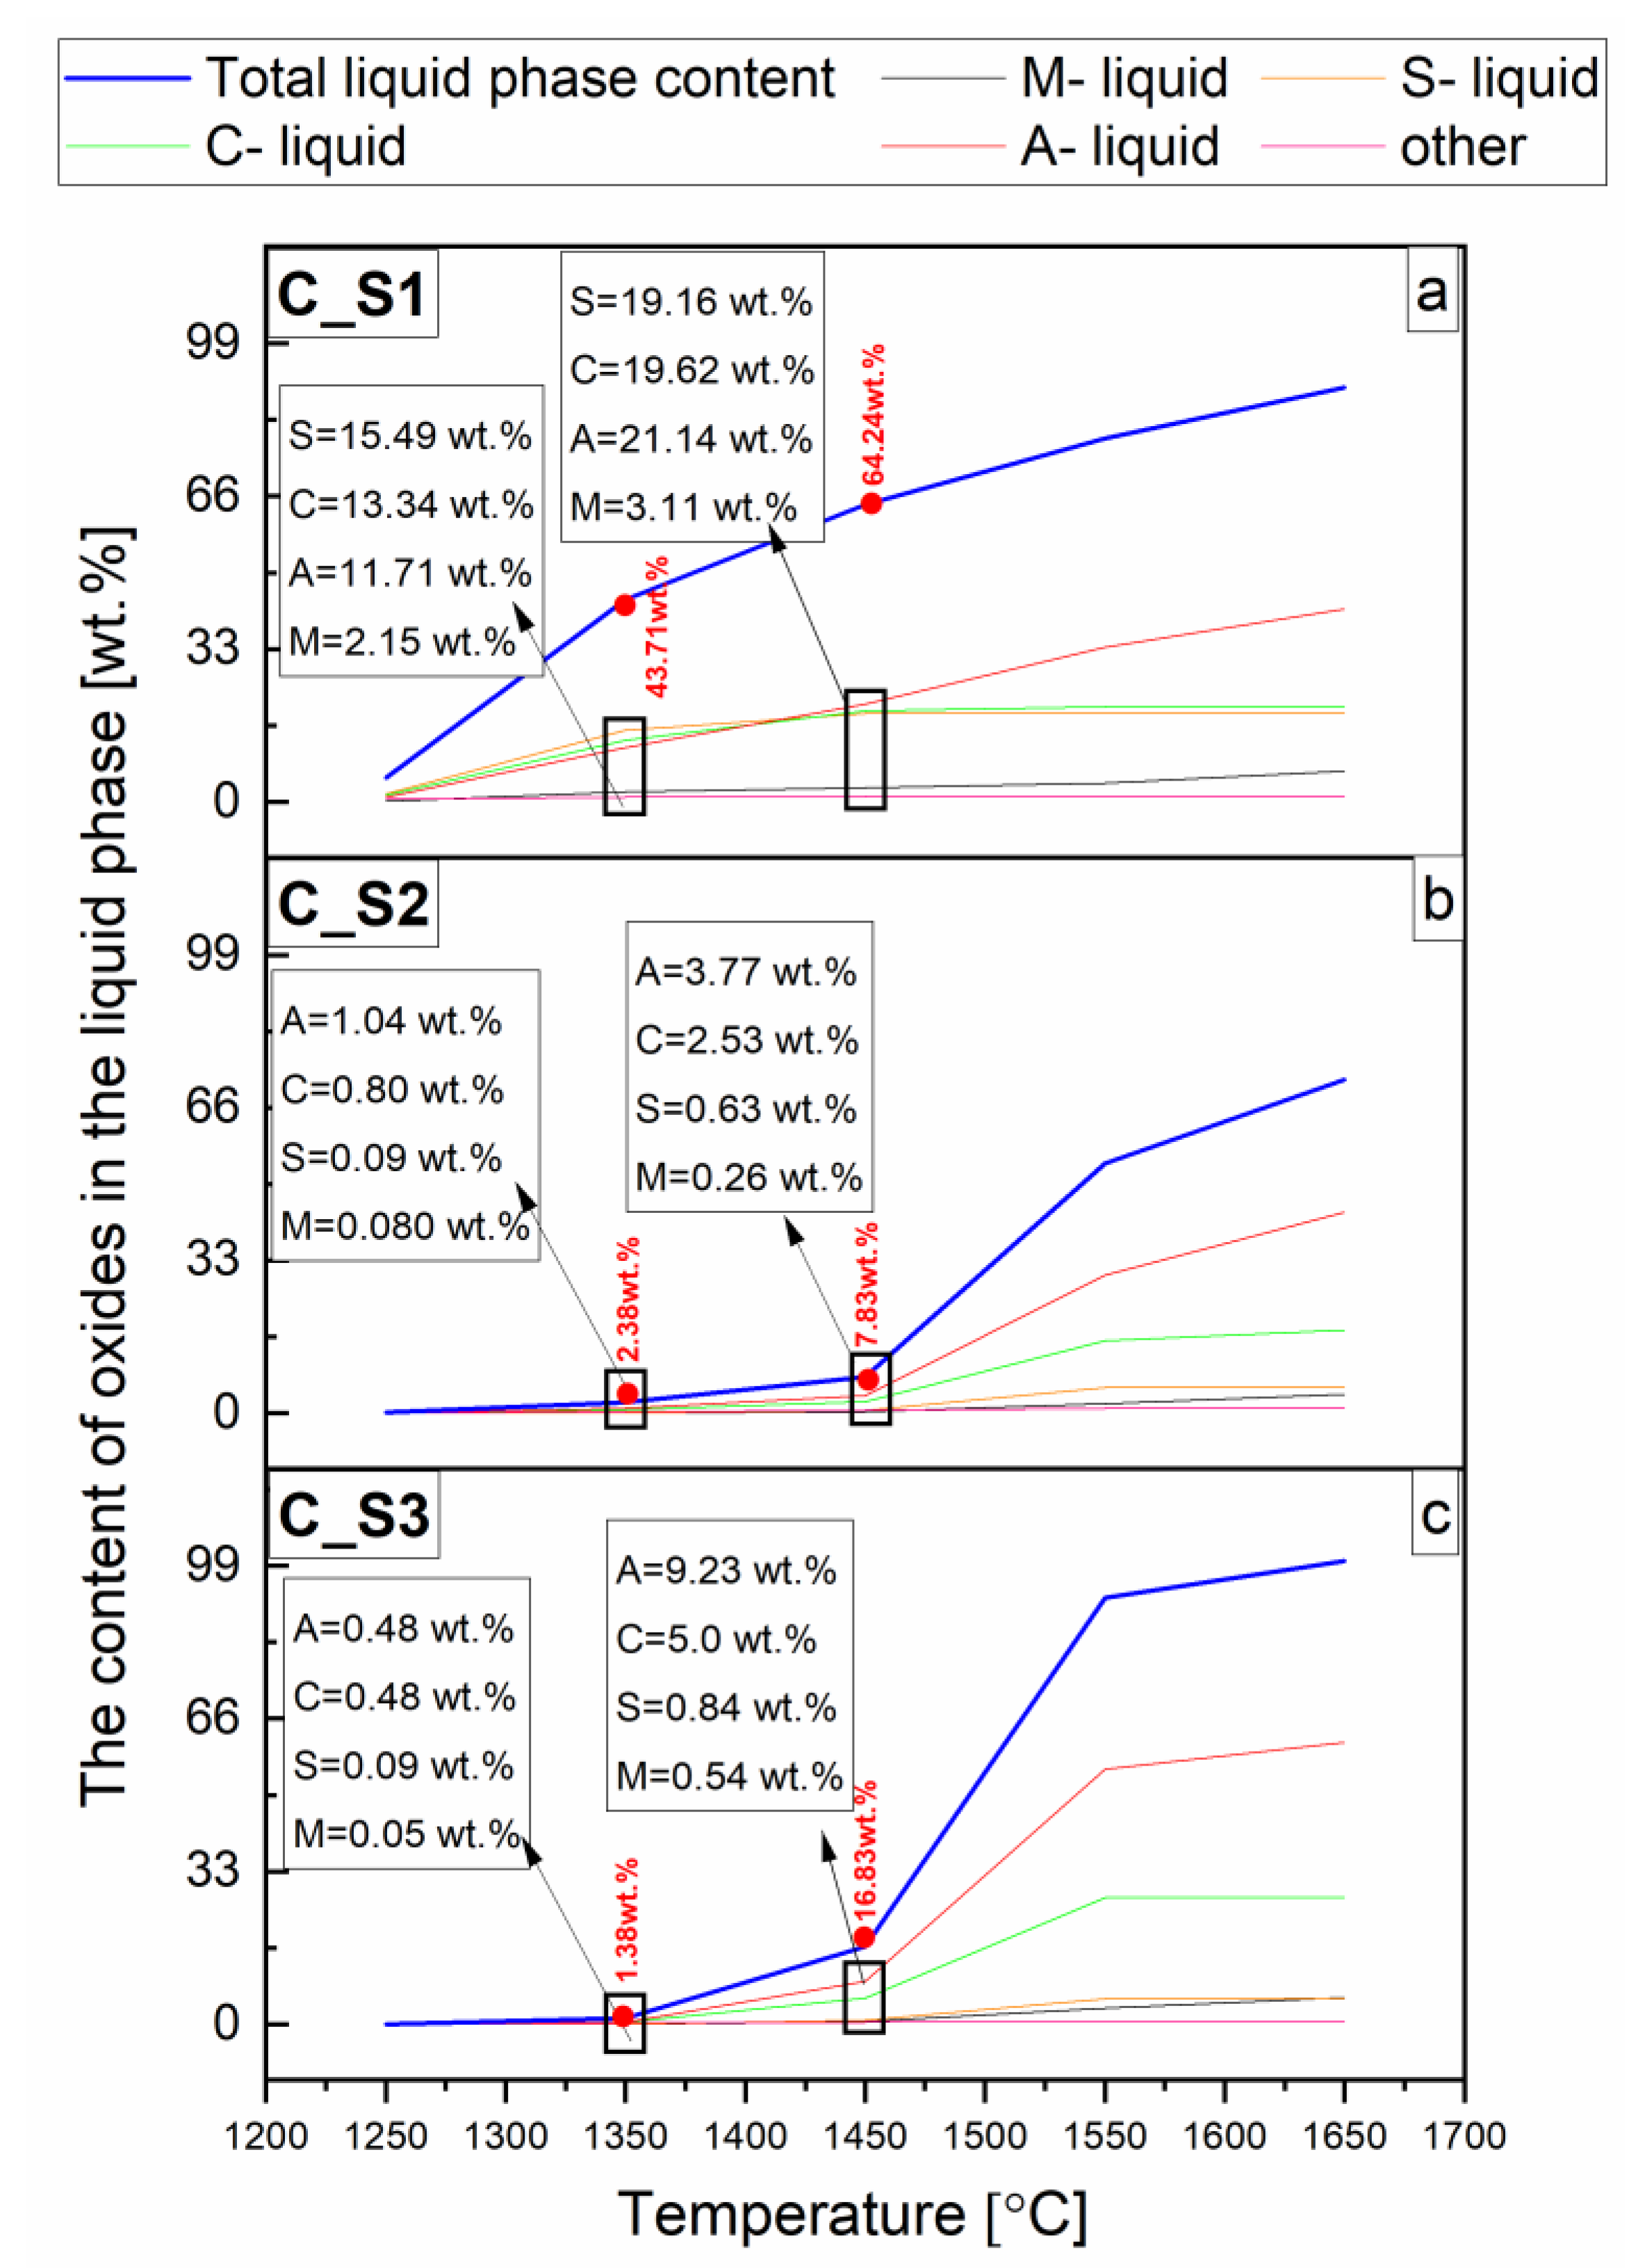
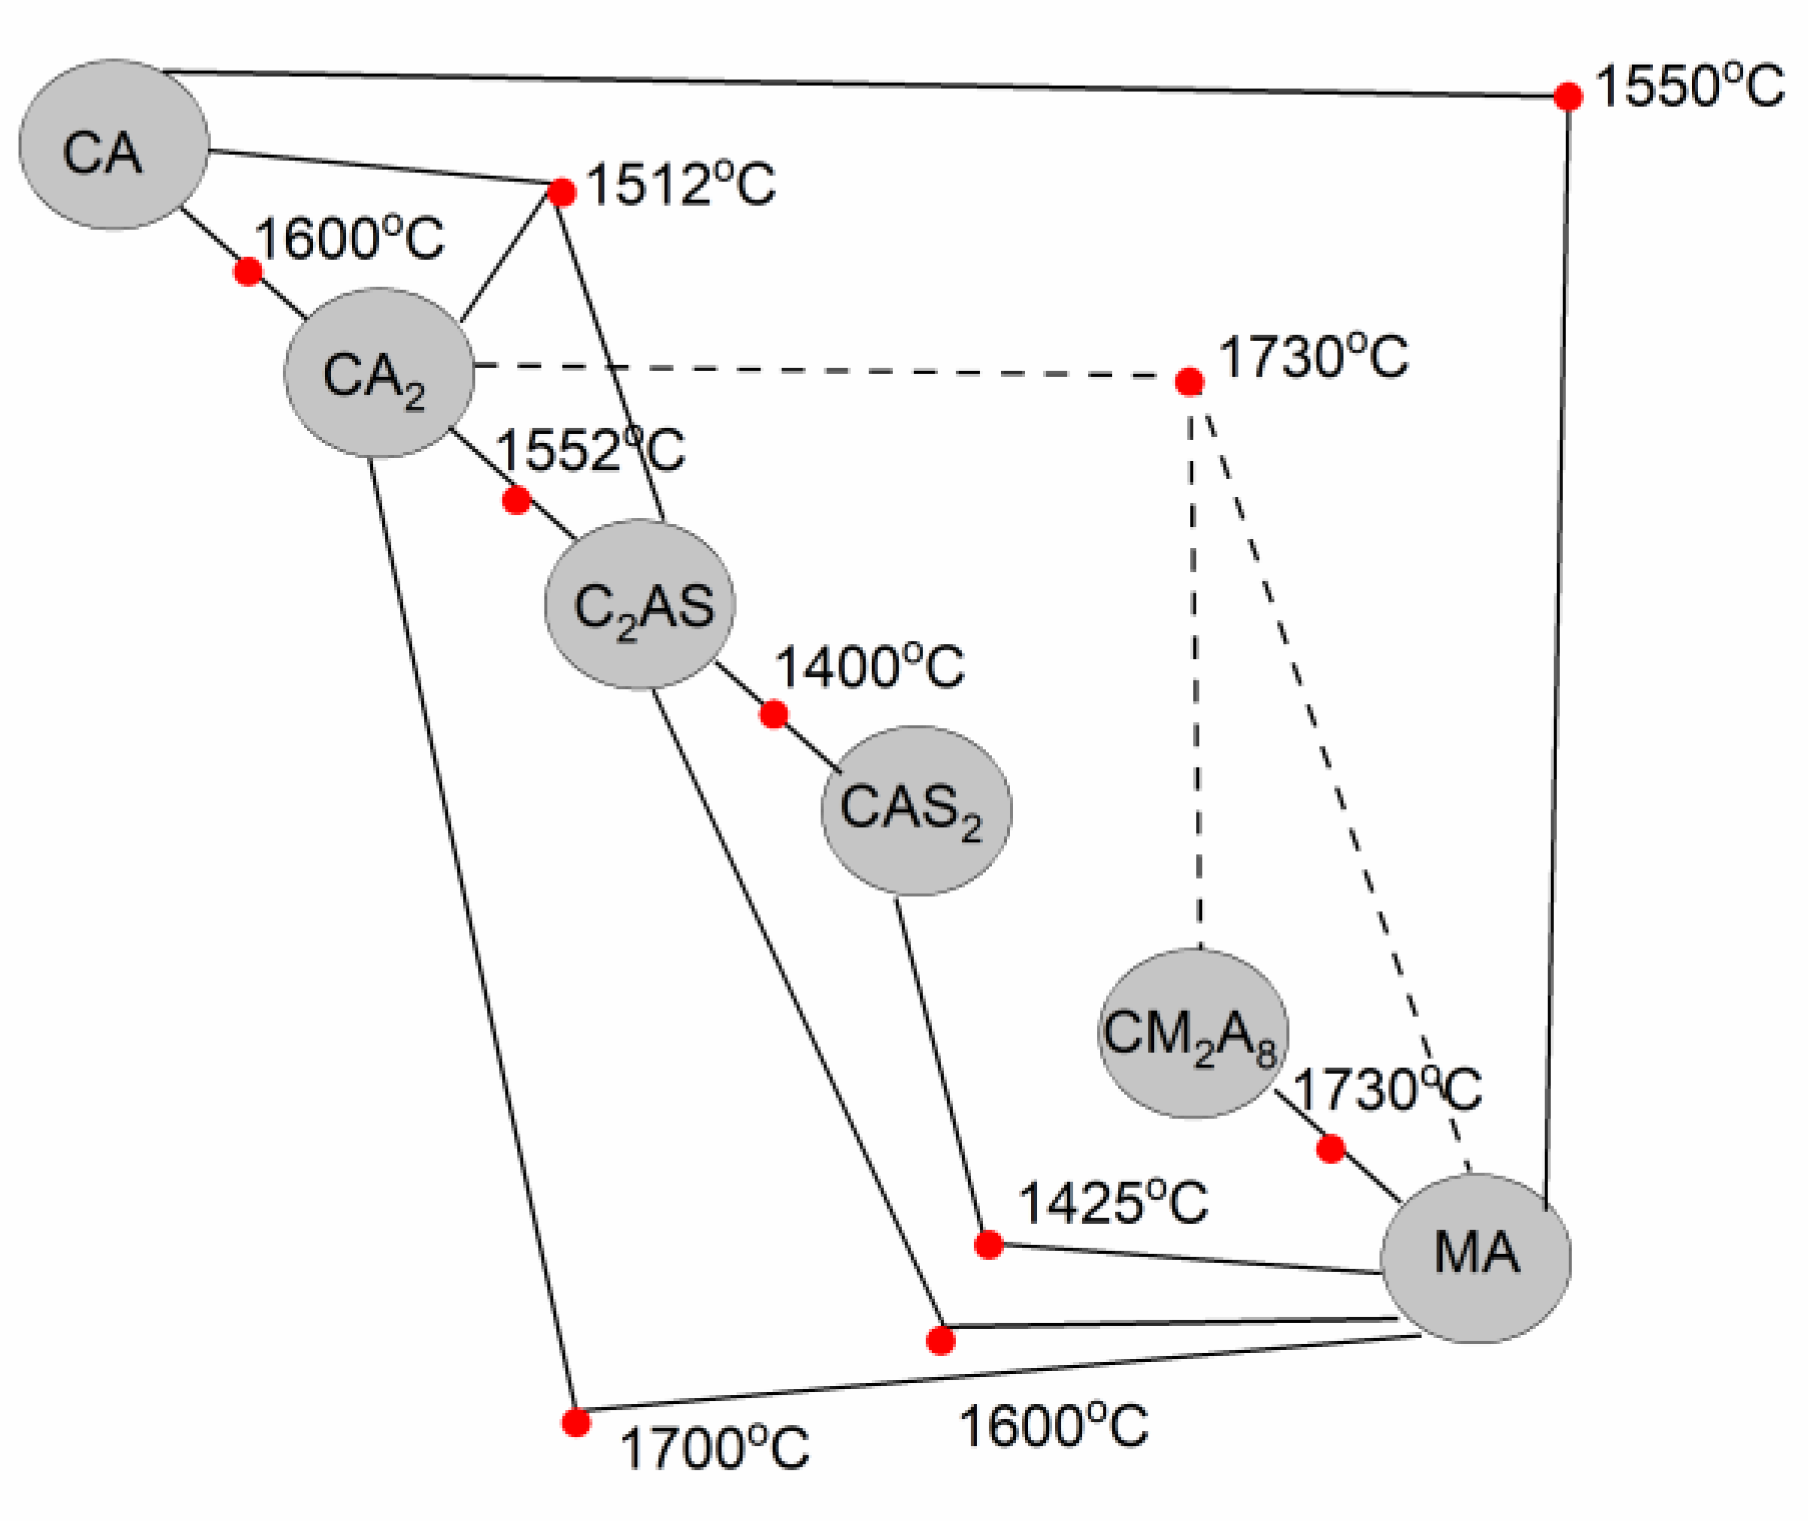
3.1. Thermodynamic Analysis of Reactive Mixtures Containing Components of Spinel-Forming Alumina Castables and Steel Slags and Thermal Analysis with Microscopic Heating (HMTA)

FactSage thermochemical software was used to perform the thermodynamic analysis of the phase transformation of the spinel-forming alumina castables during heat treatment in the air in the presence of steel slag with the C/S mass ratio of 1.1 (S1), 3.5 (S2), 5.5 (S3). Although the phase composition of castables with 3, 5, and 7 wt.% of MgO was established as containing corundum and spinel phases, the phase changes of the reactive mixtures considered in the thermodynamic calculations were evaluated in the interest of proving the evolvement sequence of the resultants of reaction of MgO, Al2O3, and SiO2 from castables, and simple oxides from slags. Thermodynamic analysis of the phase transformation of the slag components S1, S2, and S3 was also performed. Hence, a thermodynamic calculation was performed to predict the possible phases formed during corrosion.
All results are presented in Figure 3, Figure 4, Figure 5 and Figure 6 and Table 2. The phase transformations with slags vs. temperature S1, S2, and S3 are summarized in Figure 3a–c, respectively. In Figure 4, thermodynamic predictions of the solid phases and liquid phase of the reactive mixtures containing components of the spinel-forming alumina castable with 7 wt.% of MgO (castable C) and steel slags with the C/S mass ratio of 1.1_S1 (a), 3.5_S2 (b), 5.5_S3 (c), when exposed to an oxidizing atmosphere versus increasing temperature are presented. Castable C (7 wt.% of MgO) shown in Figure 4a–c was selected due to literature reports on the improvement of corrosion properties with the increase of spinel content. Castable C showed the highest corrosion resistance, which will also be presented later in this paper. Figure 5 show the thermodynamic predictions of the CM2A8 solid phase of the reactive mixtures A_S1, B_S1, C_S1, A_S2, and B_S2 versus increasing temperature, because only in these samples the CM2A8 phase was calculated. Additionally, Figure 6 present content and chemical compositions of the liquid phase from the FactSage calculation in wt.% vs. temperature of the reactive mixtures containing components of the spinel-forming alumina castable with 7 wt.% of MgO (castable C) and steel slags with the C/S mass ratio of S1 (a), S2 (b), and S3 (c). Table 2 show the onset temperature for the formation of the liquid phase. The castable composition with slag used in the calculations was previously presented in Table 1. A schematic diagram of the eutectic temperatures for binary and ternary compounds based on the literature data [37,38,40,44,45,46,47] is presented in Figure 7, which will allow for the interpretation of the results.
A thermodynamic analysis of the slag components in the temperature range of 1000–2000 °C was carried out. Based on this analysis, the phases C3MS2, C2MS2, CMS, the liquid phase for the slag S1 (Figure 3a), C3MA2, C2S, C3MS2, MA phase, liquid phase, small amounts of free oxides for the slag S2 (Figure 3b), C3A, C3MA2, C2S, liquid phase, small amounts of free oxides for the slag S3 (Figure 3c) were calculated. The tested slags showed differences in both quantitative and qualitative composition. In the temperature range of 1300–1500 °C, an accelerated increase in the number of liquid phases was observed, along with an increase in the mass content of microsilica-rich phases in slags. The change in mass content of the liquid phase in the analyzed temperature range was 96.76 wt.%, 80.15 wt.%, and 65.94 wt.% for slags S1, S3, and S2, respectively. Thus, the most accelerated increase in the share of the liquid phase was observed for slag S1, for which, at 1000 °C, the highest mass content (about 70 wt.%) of microsilica-rich phases was calculated. On the other hand, the smallest increase in the mass content of the liquid phase was calculated for S2 slag, for which, at 1000 °C, the lowest mass content (about 20 wt.%) of the microsilica-rich phases was observed.
As shown in Figure 4, for the castable C with all the slags used in the experiment, few changes in phase composition were identified. For castables A and B, the obtained qualitative results exhibited similar trends in relation to the slag with the same C/S mass ratio. However, significant qualitative and quantitative changes in the curve corresponding to the phases, both solid and liquid, were established between the same castable under the influence of three different slags (S1, S2, and S3). As a result of the thermodynamic analysis of reactive mixtures composed of castable Cand slags S1, S2, and S3 (Figure 4a–c, respectively) via FactSage software, within the temperature range between 1250 °C and 1650 °C, the spinel (MA), CM2A8, CA, CA2, gehlenite (C2AS), anorthite (CAS2), and liquid phases were calculated.
From the data presented in Figure 4a and Figure 5, two possible MgO-containing phases, i.e., MA and CM2A8, in the reactive mixtures containing simple oxides with the chemical composition derived from the mixture of 50 wt.% slag and 50 wt.% castables can coexist in equilibrium in the samples A_S1, B_S1, C_S1, A_S2, and B_S2. Based on the data presented in Table 1, an obvious relationship between the four variables, i.e., MgO/Al2O3, CaO/Al2O3, CaO/SiO2, and CaO/MgO mass ratios, can be noticed. CM2A8 can exist with the MA phase within the temperature range 1250–1550 °C when the M/A, C/A, C/S, and C/M mass ratios are within the range of 0.15–0.19, 0.27–0.42, 1.08–3.21, and 1.67–2.76, respectively, (Table 1) for castable compositions A_S1, B_S1, C_S1, A_S2, and B_S2 (Figure 5) can be drawn. However, for the reactive mixtures A and B with slag S2, this dependency exists in the temperature range 1250–1450 °C. Furthermore, as shown in Figure 5 and Table 2, it can be observed that the possibility of the CM2A8 formation decreases with increasing MgO content in the reactive mixtures. In addition, it has been recognized that the formation of the CM2A8 phase is favored as the C/S mass ratio decreases in the reactive mixtures. Such dependency was observed in A_S1 and A_S2.
Based on the results presented by Vazquez et al. [47,48], the CM2A8 phase can be generated by the high temperature (1200 °C) reaction between MA and C2AS. The possible mechanism involves the interaction between MA and C2AS-rich at ca. 1200 °C by the Mg2+ ions incorporation into the liquid phase. While analyzing Figure 4a and Figure 5 simultaneously, it can be noticed that the amount of CM2A8 phase for the C_S1 mixture increases to the temperature of 1350 °C, with a decrease in C2AS and MA phases. Moreover, a similar situation should be expected for the reactive mixtures A_S1 and B_S1. For the C_S1 reactive mixture, a violent decrease in CM2A8 content is observed from 1350 °C (Figure 5) because of the total liquid phase formation (Figure 4a). Additionally, a decrease in the MA and C2AS phases was also observed. A similar tendency should be accepted for the reactive mixtures A_S1 and B_S1.
The occurrence of the total liquid phase shown in Figure 4a–c is mainly associated with calcium-aluminates and calcium-aluminate-silicates phases. As the temperature rises from 1250 °C to 1650 °C, the initially formed calcium (i.e., at a temperature below 1250 °C) aluminates CA and CA2 in the reactive mixtures C_S2 and C_S3 (Figure 4b,c); calcium aluminum silicate C2AS gehlenite in the reactive mixtures C_S1, C_S2, and C_S3 (Figure 4a–c); calcium aluminum silicate CAS2 anorthite in the reactive mixture C_S1 (Figure 4a) gradually decreased.
This violent increase in the content of the liquid phase vs. temperature is shown in Figure 6. At 1250 °C, this increase is mainly due to the presence of C2AS and CAS2 in the C_S1 sample (Figure 4a and Figure 6a). For samples C_S2 and C_S3, a shift in the appearance of the liquid phase towards higher temperatures was observed. Above the temperature of 1450 °C in sample C_S2 (Figure 4b and Figure 6b), this increase is mainly caused by CA2, C2AS, and CA; in sample C_S3 (Figure 4c and Figure 6c), it is mainly associated with the CA, C2AS, and CA2 phases. It is also worth mentioning that the liquid phase content reached 43.71, 2.38, and 1.38 wt.% at 1350 °C and 64.24, 7.83, and 16.83 wt.% at 1450 °C in the reactive mixtures C_S1, C_S2, and C_S3 (Figure 6), respectively. In the FactSage calculation program, it was possible to distinguish the first appearance of a liquid phase at particular temperatures. This summary is presented in Figure 6. To distinguish the onset temperature for the formation of the liquid phase, the individual reactive mixtures in the temperature range 1086–1230 °C are shown in Table 2.
We can therefore determine a relationship between the type of slag and the first amounts of the liquid phase formed. As shown in Table 1 and Table 2, the temperature at which the appearance of the first amount of liquid phase is determined by the C/S mass ratio. Specifically, it was observed that the onset temperature for the formation of the liquid phase decreased with a decreasing C/S mass ratio in all investigated reactive mixtures. The average temperature values reached ca. 1231 °C, ca. 1217 °C, and ca. 1086 °C for castables A, B, and C with slags S3, S2, and S1, respectively (Table 2). This can be directly related to the presence of the CAS2 in the C_S1 only, while in the reactive mixtures C_S2 and C_S3, this phase was not calculated. Discussing the schematic diagram showing eutectic temperature (Figure 7), it can be easily concluded that CAS2 causes the formation of a liquid phase at 1400 °C in the presence of C2AS and 1425 °C in the presence of MA [38]. The combination of these phases was calculated in the C_S1 mixture (Figure 4a). Therefore, for the reactive C_S1 mixture, it was the reason for a clear shift in the formation of the liquid phase towards lower temperatures, compared to the C_S2 and C_S3mixtures, where the eutectic temperatures (Figure 7) between components CA, CA2, C2AS, MA were higher and exceeded 1500 °C [38,46,47].
Based on the thermochemical calculation using FactSage software, the chemical composition of the total liquid phase, besides its content, vs. temperature, was also established and presented in Figure 6. The changes in the oxide content of the total liquid phase in the individual reactive mixtures were mainly related to C2AS and CAS2 in C_S1 (Figure 4a and Figure 6a); CA2, C2AS, CA in sample C_S2 (Figure 4b and Figure 6b) and CA, C2AS, CA2 in sample C_S3 (Figure 4c and Figure 6c).
For C_S1, C_S2, and C_S3 mixtures, the content of SiO2-containing phases C2AS and CAS2 (Figure 4a–c) decreases when the C/S mass ratio is increased (Table 1). At a temperature of 1450 °C, the highest content of SiO2 was found for sample C_S1 (above 19 wt.%), while for samples C_S2 and C_S3, the content of SiO2 was less than 1 wt.% (Figure 6). Based on this data, it was found that increasing SiO2 content in the mixture decreased the temperature at which the liquid phase commenced. It can be assumed that MgO for sample C_S1 comes from both MA and CM2A8, while for samples C_S2 and C_S3, it only comes from the MA phase. The lower the Al2O3 content in the mixtures (Table 1), 63.66, 60.83, 49.33 wt.% for the temperature of 1450 °C, the higher the observed content of the liquid phase (Figure 6) 7.83, 16.83, 64.24 wt.% by weight in reactive mixtures, C_S2, C_S3, C_S1, respectively.
The melting process of the reactive mixtures containing components of the spinel-forming alumina castables and steel slag was evaluated by heating microscopy thermal analysis (HMTA). From the micro-processed images, the relative height changes of the samples (δh) versus temperature were presented in the form of shrinking curves, as shown in Figure 8. This figure contains, as examples, the heating microscope images registered at 1410 °C and 1420 °C. According to the data presented in the experimental section, the characteristic transformation points of samples were determined at the HMTA curves and summarized in Table 3.
It can be seen that the values of the temperatures for the characteristic points of the castables A, B, and C vary significantly when they are in the mixtures containing slags S1 or S2 and S3. A distinguishing property of the A_S1, B_S1, and C_S1 HMTA curves is the possibility of the determination of characteristic transformation points of reactive mixtures. Based on the comparative study of the 3,5 and 7 wt.% MgO-containing castablesbehavior in contact with slag S1, it should be indicated that the thermal stability and corrosion resistance at high temperatures of castables can be arranged in increasing order of the MgO content up to ca. 1410 °C (Figure 8). As was evidenced by photographic images made with a camera, compared to the respective initial height of each sample, there was a mean shrinkage of ca. −64.87% (A_S1), ca. −27.2% (B_S1), and −19.1% (C_S1) at ca. 1410 °C, which was promoted by the liquid phase formation during corrosion processes. While at the temperature of around 1420 °C, a reversal of the tendency was observed and a smaller shrinkage of the B_S1 sample (−31.2%) than the C_S1 sample (−57.95%). However, in the case of reactive mixtures containing S2 and S3 slags, changes in the height of the sample occurred at a temperature that exceeds 1425 °C.
According to the calculation of the liquid phase content (Figure 9b), referring to a temperature of ca. 1390 °C, the highest total liquid phase content was observed for the reactive mixture A_S1. Among the tested mixtures, in the temperature range from 1390 °C to 1420 °C, the highest total content of the liquid phase was observed for the B_S1 reactive mixture. Above the temperature of 1420 °C, a change was observed that showed that the highest content of the total liquid phase was observed for sample C_S1, and the lowest content of the total liquid phase was observed for sample A_S1.
Comparing the above-described changes in the HMTA analysis curves with the quantification of the content of the total liquid phase (FactSage, Figure 9a,b), it was noticed that the shrinkage value of the samples rises with the increase of the amount of the liquid phase.
As shown in Figure 8, at the temperature of 1410 °C, an accelerated shrinkage process of the C_S1 sample begins, but in comparison to samples B_S1 and A_S1, the shrinkage is still the smallest. However, at the temperature of 1420 °C, there is a change of tendency, and sample C_S1 shrinks faster than sample B_S1; at this temperature, sample A_S1 was melted.

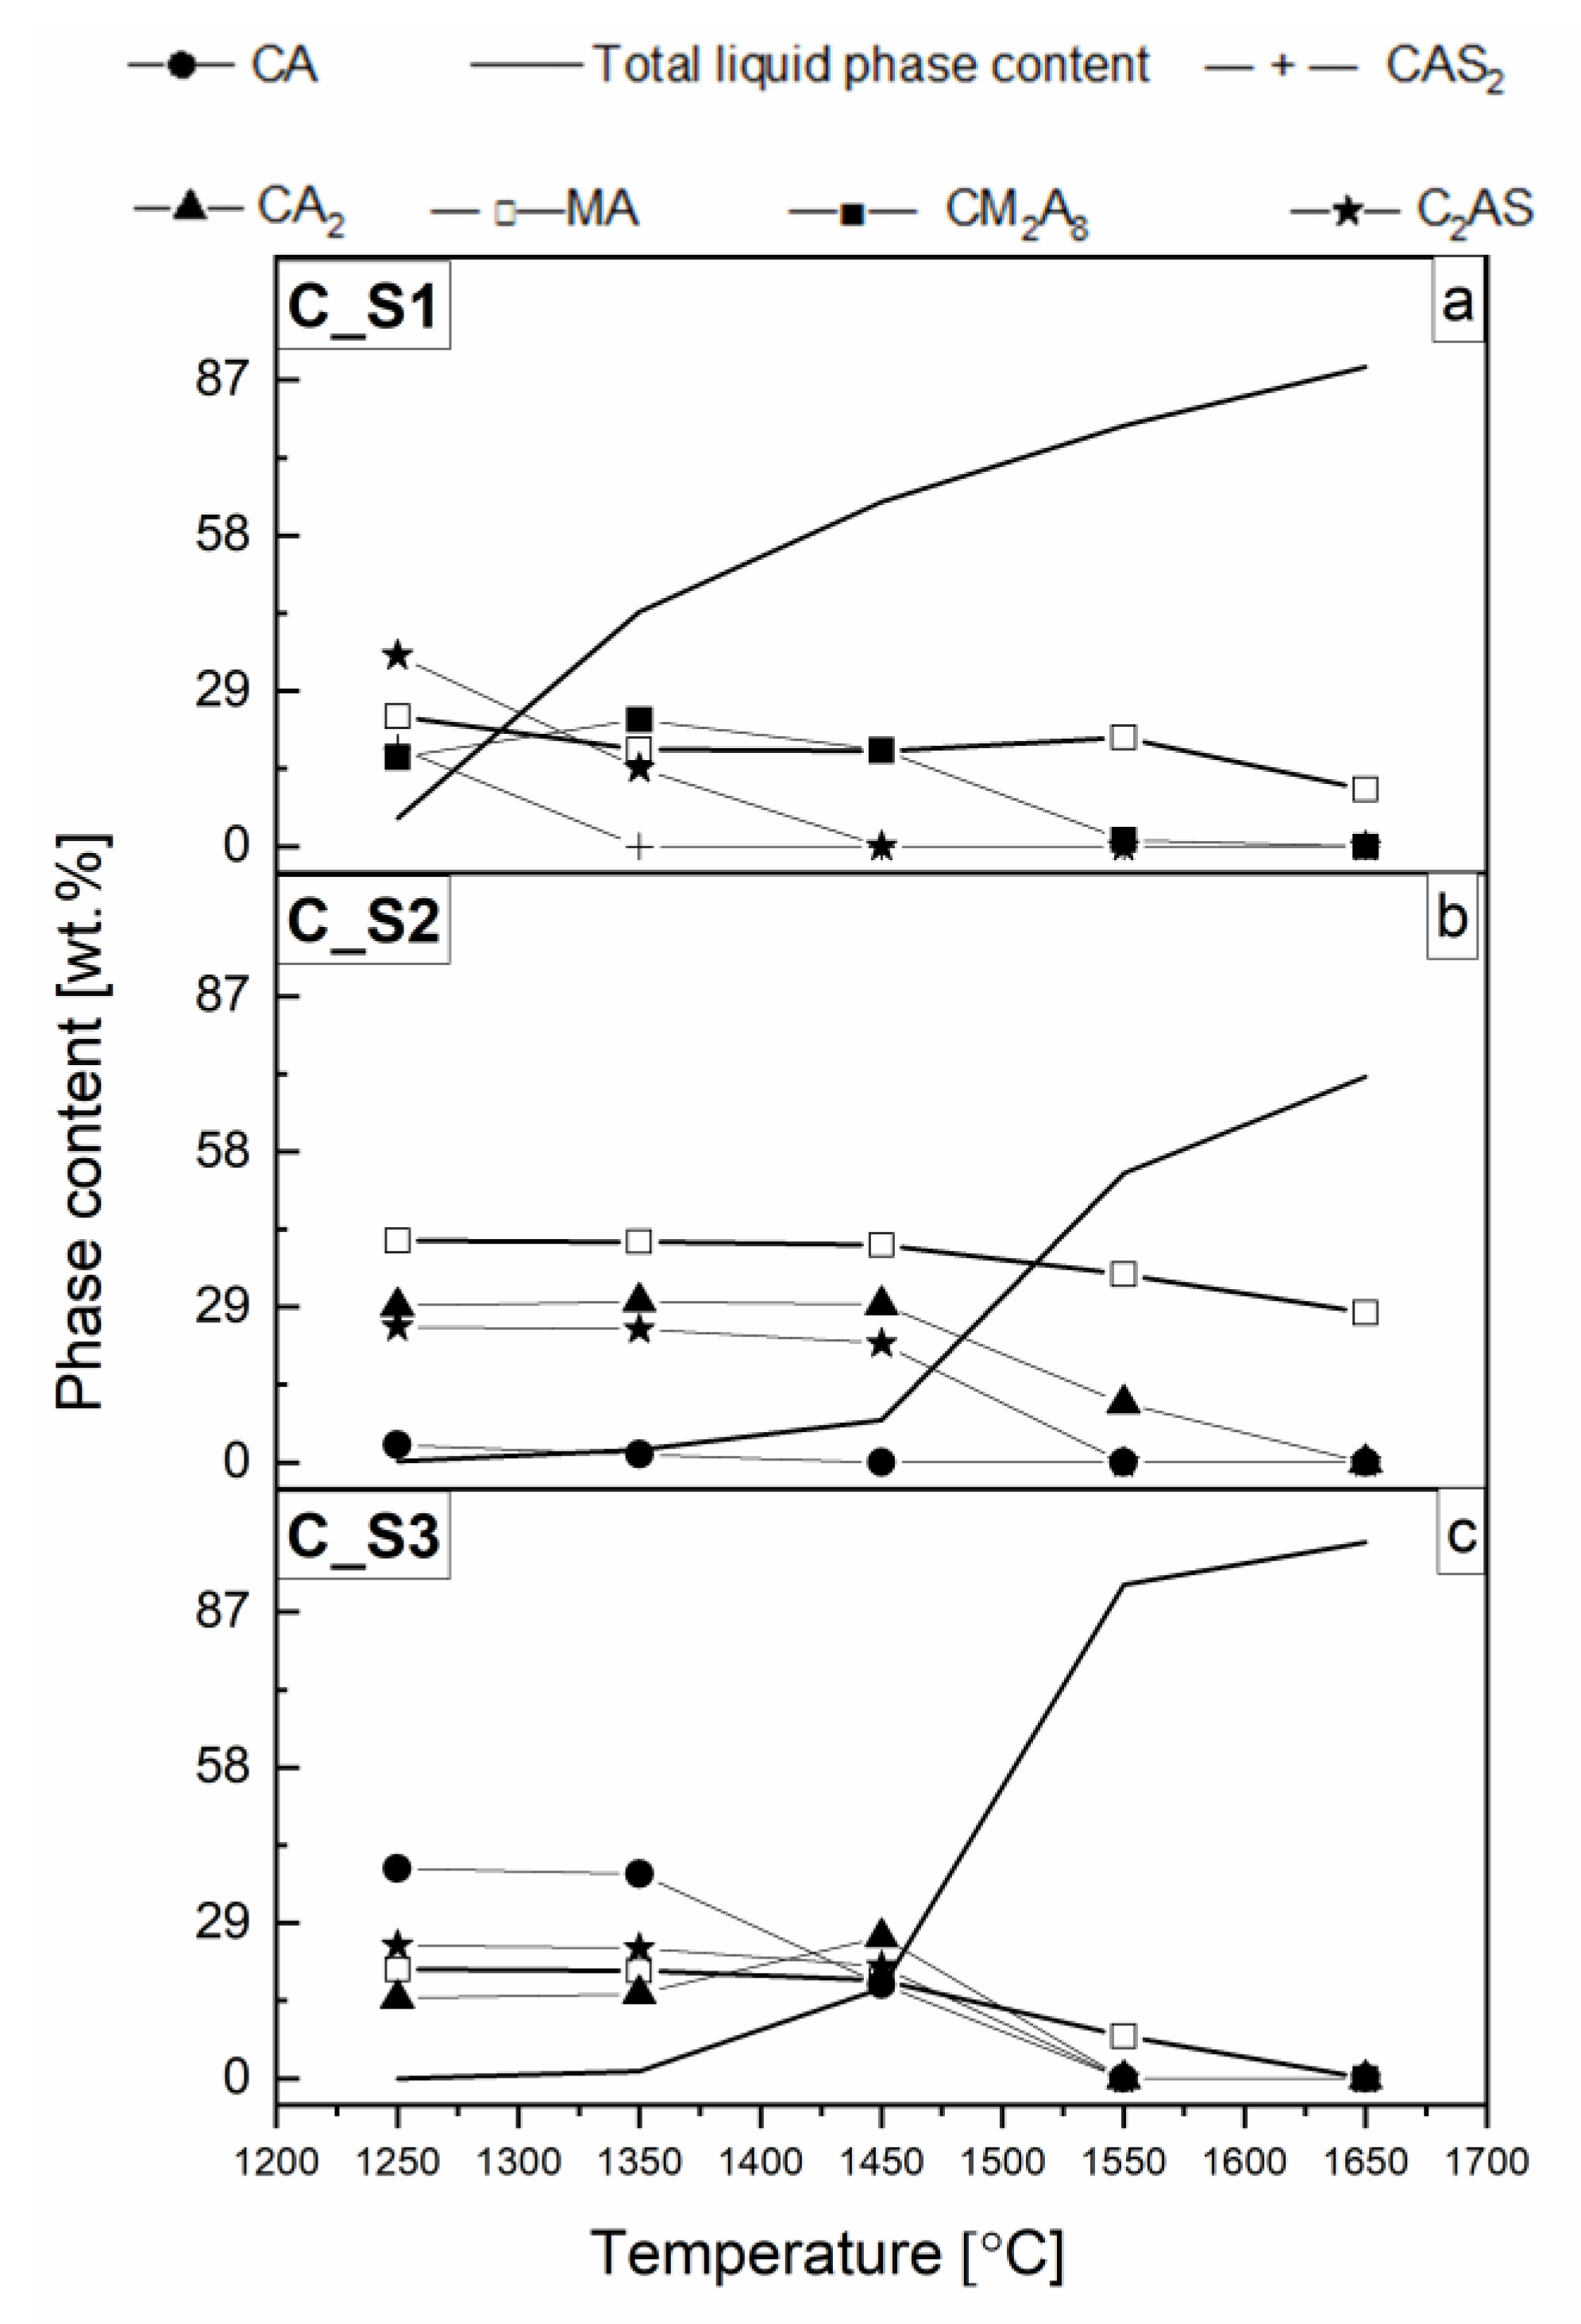
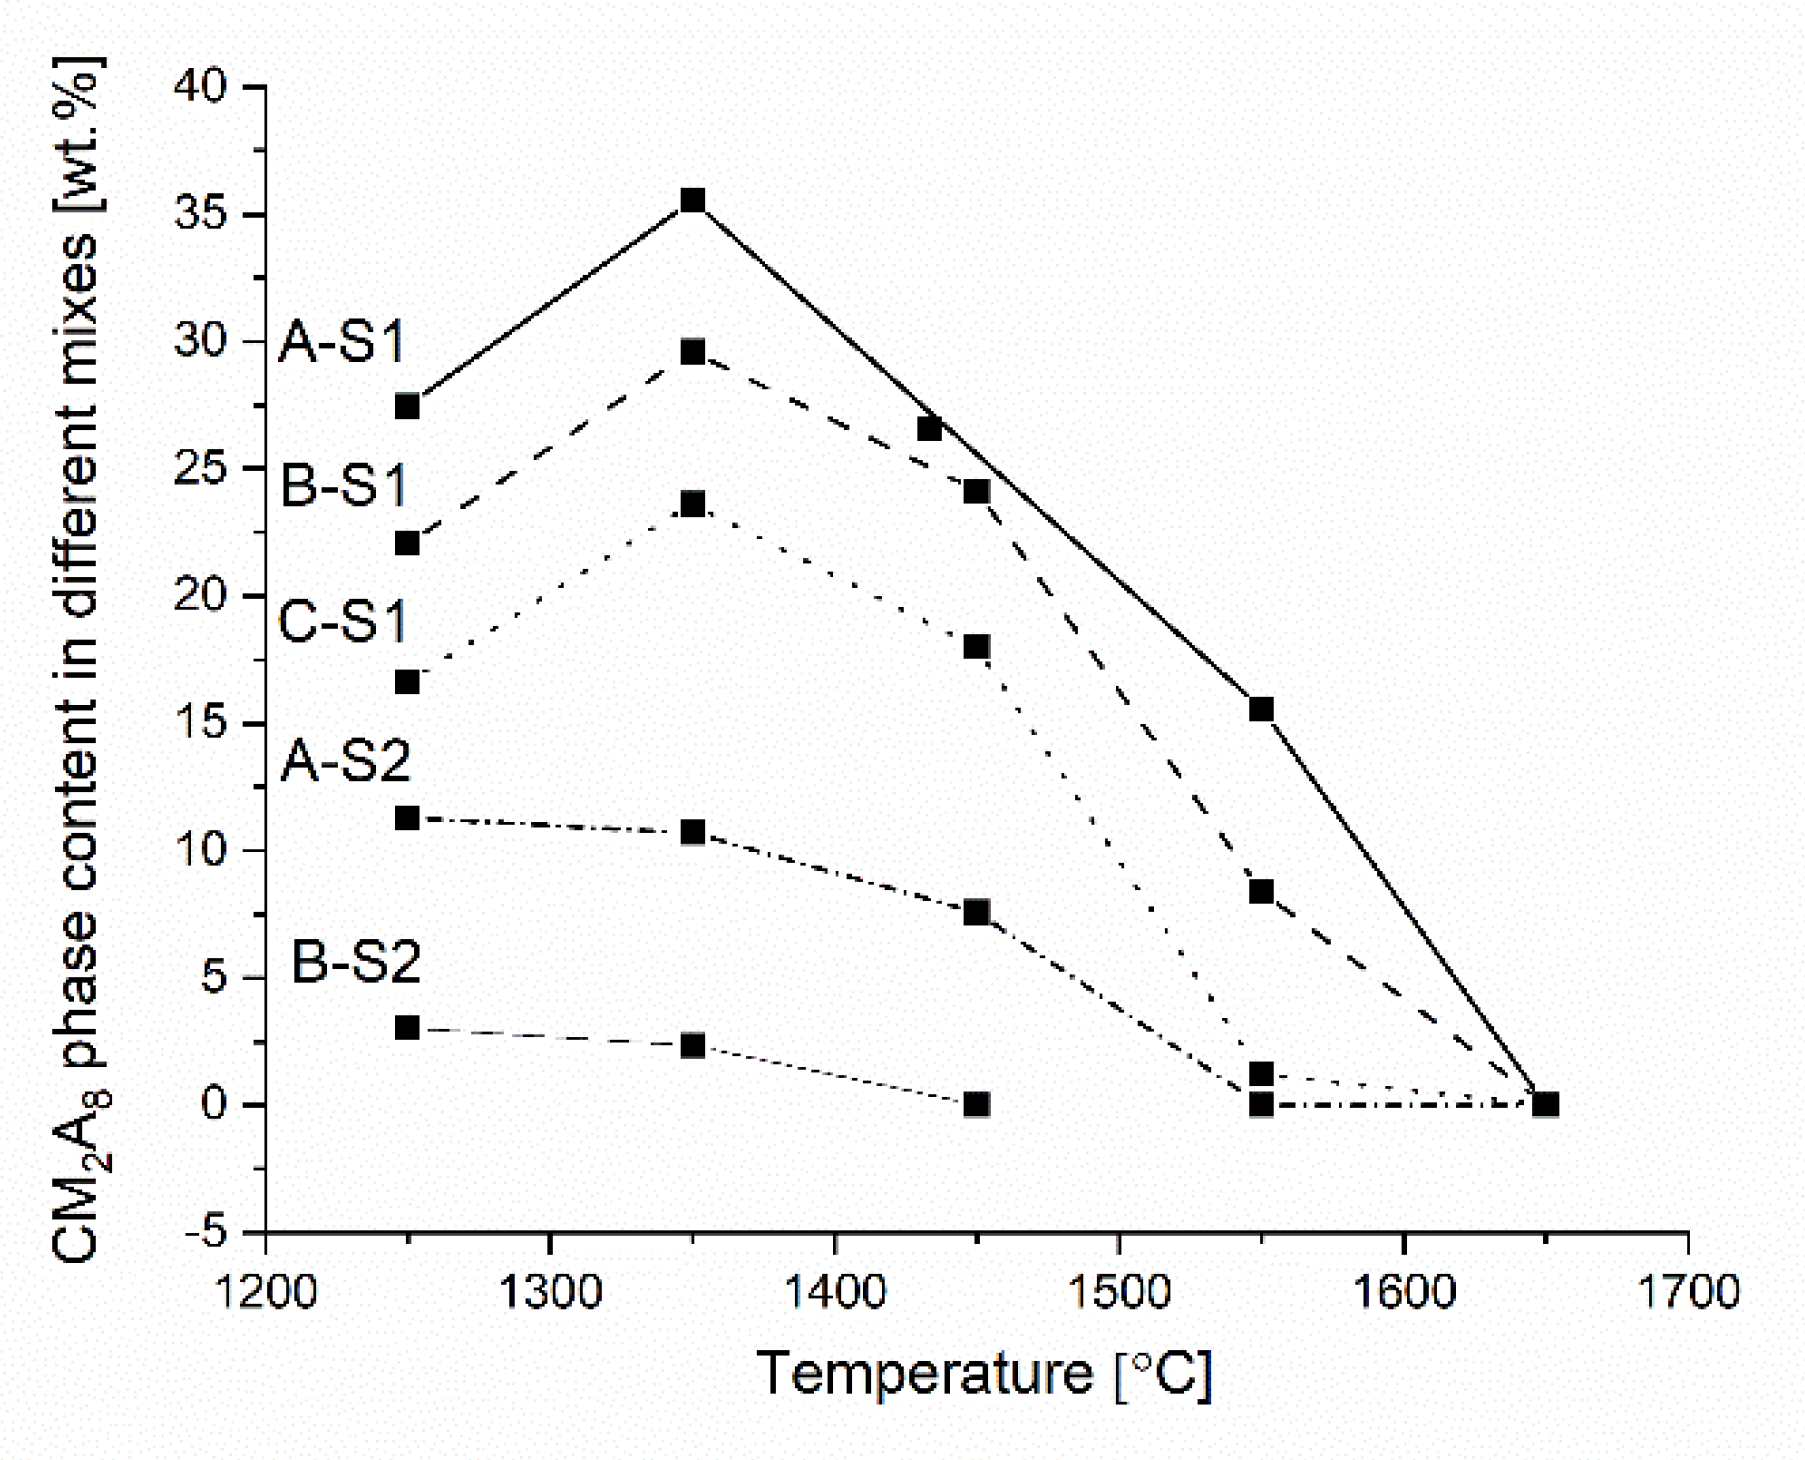
3.2. An Overview of Reaction Characteristics of Cement-Free Corundum-Spinel Castables

In this study, corrosion tests were carried out on cement-free alumina spinel castables with a formed in situ spinel. The density in the tested castables was 3.12 g/cm3; 3.07 g/cm3, and 3.05 g/cm3, while the open porosity was 13.72%, 15.34%, and 15.37% for castables A, B, and C, respectively. XRD analysis of the tested castables allowed the determination of the amount of spinel in individual castables, and it was found for castable A = 19.1 wt.%, B = 25.2 wt.%, and C = 37.9 wt.%.
Depending on the C/S mass ratio (from 1.1–5.5) in the slag, the division into reaction zones was determined for the tested materials. In molten slags S2 and S3, there are reaction zones in the material (the corroded area of castable below slag-refractory interface) and a slag reaction zone (above the slag-refractory interface), the reaction zone on the slag-refractory interface is the zone separating these two zones. In the case of molten S1, for which the mass ratio of C/S is the smallest, there is a reaction zone only in the material (the corroded area of castable below slag–refractory interface). The division of zones of the tested materials is shown in Figure 10. It can be observed that, along with the decrease in the mass ratio of C/S in the slag, the corroded area of castable below the slag-refractory interface increases.

3.3. X-Ray Investigations of High-Temperature Relations within the Mixtures Containing Spinel-Forming Alumina Castables and Synthetic Slags

The course of the reactions was examined in 50 wt.% castables and 50 wt.% slag of mixtures heat-treated at 1350 °C. Based on XRD and Rietveld’s analysis, an assessment was made of what reactions could have occurred. Changes in the phase composition between uncorroded castables and castables corroded by slags (S1, S2, and S3) were analyzed based on Figure 11a–d. The results of the Rietveld analysis for all mixes are presented in Table 4.
Both qualitative and quantitative (Rietveld) analyses were performed. Castable C was selected for further tests due to the predicted highest corrosion resistance to slags S1, S2, and S3 in the analyzed temperature range.
The X-ray diffraction (XRD) method was applied to analyze the non-corroded castable. The analysis of the influence of slags with different mass ratios C/S on this castable was also carried out.
The castable before corrosion, with an equilibrium composition, was characterized by the coexistence of MA and A crystalline phases. The diffraction peaks after the reaction with slag S1, S2, and S3 show a clear increase in diffraction peak width and a significant decrease in the intensities of each diffraction peak due to the formation of phases with a slight degree of crystallization.
High-temperature reactions made it possible to perform the reactive sintering of mixtures of 50 wt.% castables and 50 wt.% slags and to obtain no-equilibrium phase composition of mixtures. As a result, it was possible to determine changes in the phase composition. No changes were observed in the qualitative analysis for the mixes of one type of slag with different castables. Therefore, Figure 11 show one type of castable (C) with different types of slag because changes in the qualitative composition are visible.
Spinel phase (MA—JCPDS Card No.96-900-3482) at 36.84° 2θ and A (JCPDS Card No. 96-900-8082) at 35.14° 2θ were detected for the starting castable sample (C). In the mixtures, 50 wt.% castables and 50 wt.%, slag, which included slags S2 and S3, the same phase composition was observed, differing in the intensity of individual peaks.
For mixture C_S3 (Figure 11b), the most intense peaks were detected in phases CA (JCPDS Card No. 96-430-8076) at 30.06° 2θ; A, MA, C2AS (JCPDS Card No. 96-100-0049) for 31.42° 2θ; and CA2 (JCPDS Card No. 96-350-0015) for 25.34° 2θ. For the mixture C_S2, peaks related to A, MA, CA, C2AS and CA2 were detected. For mixtures C_S1, the most intense peak is observed for the C2AS phase for 31.42° 2θ. CAS2 phase was also observed (JCPDS Card No. 96-100-0035) with the most intense peak for 28.03° 2θ. At 1350 °C, the anorthite identified by XRD was calculated by FactSage in a lower temperature range but was not detected at 1350 °C. It can be assumed that this difference results from the slower reaction processes between castables and slag (as in XRD analysis) rather than the reaction processes simulated on oxides participating in the reaction (as in FactSage thermochemical analysis).
However, differences in the quantitative composition are visible. There is a noticeable difference between Rietveld’s quantitative analysis and the simulation results from FactSage. The results obtained in FactSage showed the presence of a CM2A8 phase for samples with slag S1 and S2, and for samples with S3 slag, this phase did not occur. The differences between the FactSage and XRD results are related to the use of castables and slags for XRD analysis, while the quantitative chemical composition of the sum of castable oxides and slag was introduced in the FactSage program.
Based on the Rietveld analysis (Table 4), it is assumed that a secondary spinel is formed in the mixture of C_S1 and C_S2 during corrosion reactions. This can be assumed because, for these mixes, an increase in wt.% spinel content is visible compared to the wt.% spinel content in the no-corroded castable (C). Observing the appearance of new diffraction lines for the samples after corrosion in relation to the no-corroded castable, it was found that new phases were formed. Moreover, it was observed that with the increase of the C/S mass ratio in the mixtures of slags with castable C, the amorphous character of the analyzed samples decreased.

3.4. Corrosion Index

The corrosion index was only tested for the reaction zone below the slag–refractory material interface (Figure 2). The results of tests on the corrosion index of three types of castables with three different types of slag are shown in Figure 12. Sample C with three slags of different mass ratios C/S shows the highest corrosion resistance (IC = 1.58%). However, the highest conversion rate was observed for sample A with slag S1 and amounted to 48.32%. The high corrosion resistance of sample C results from the highest content of spinel (7 wt.% MgO) in its composition, while the low corrosion resistance of sample A is caused by the low content of spinel (3 wt.% MgO) in its composition. The chart also shows that the most aggressive slag is S1, whose ratio of C/S is the lowest, 1.1. However, the least aggressive slag is S3 because the C/S ratio is the highest, amounting to 5.5.

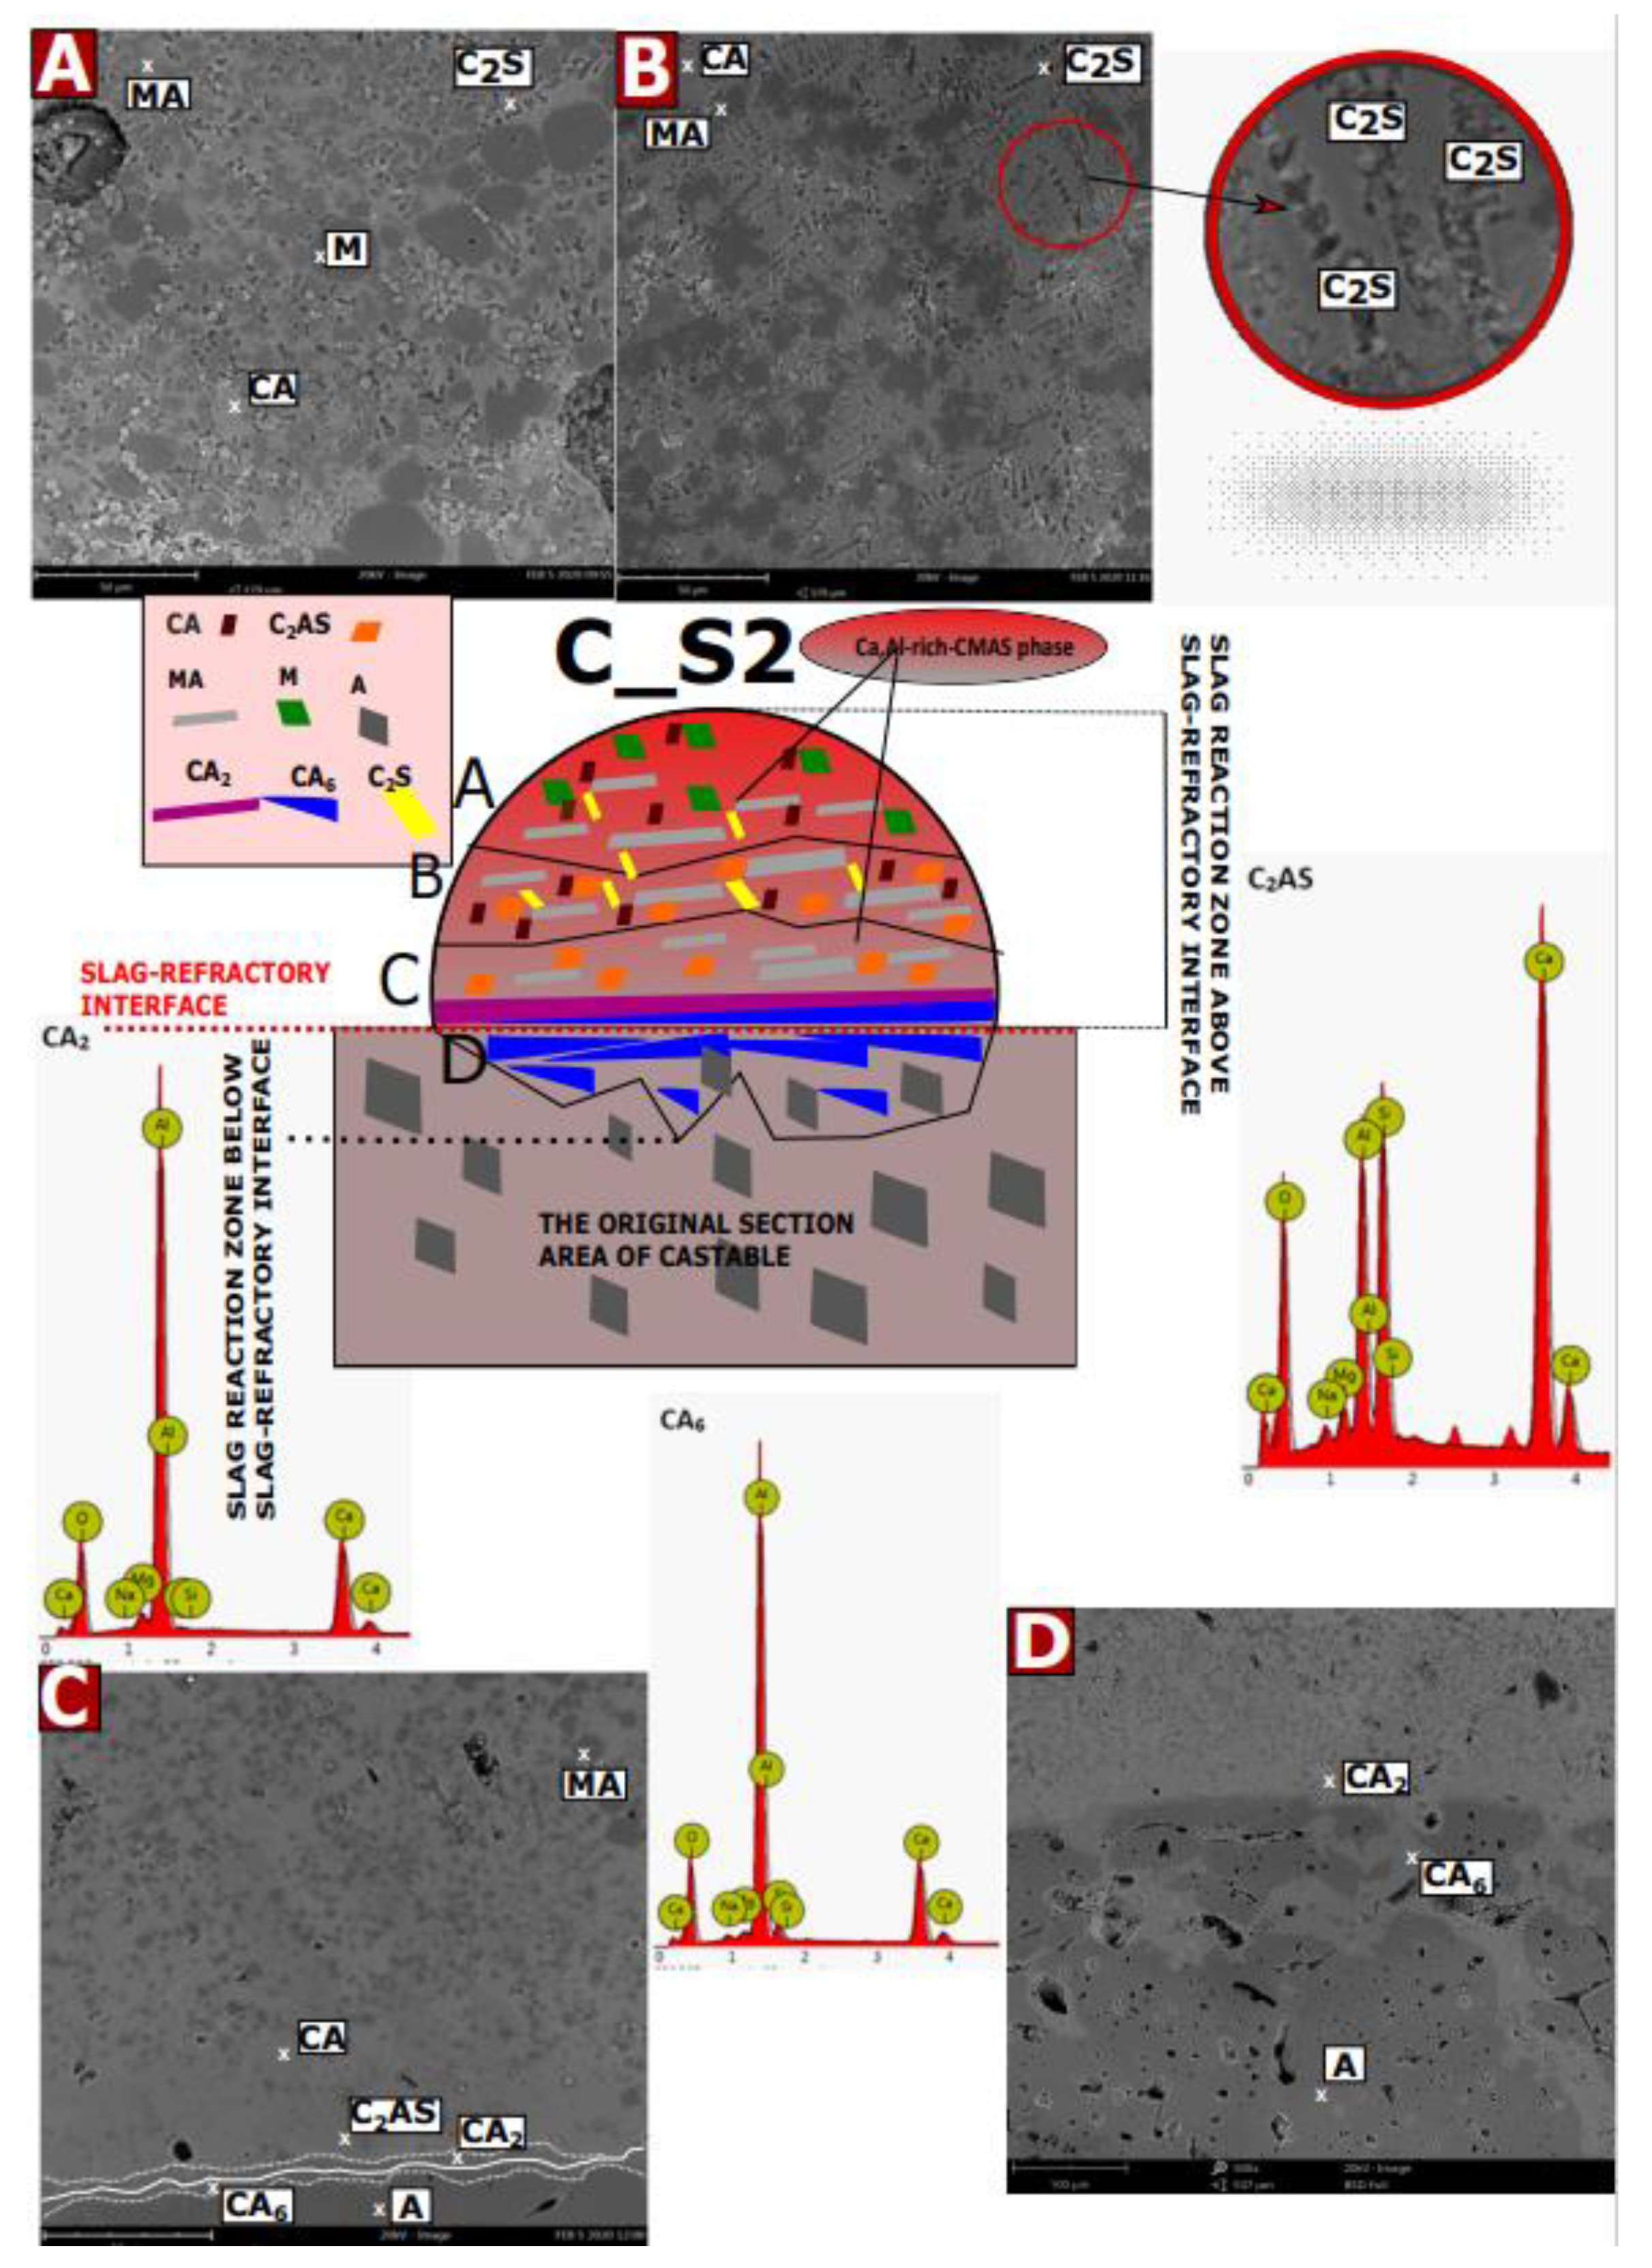
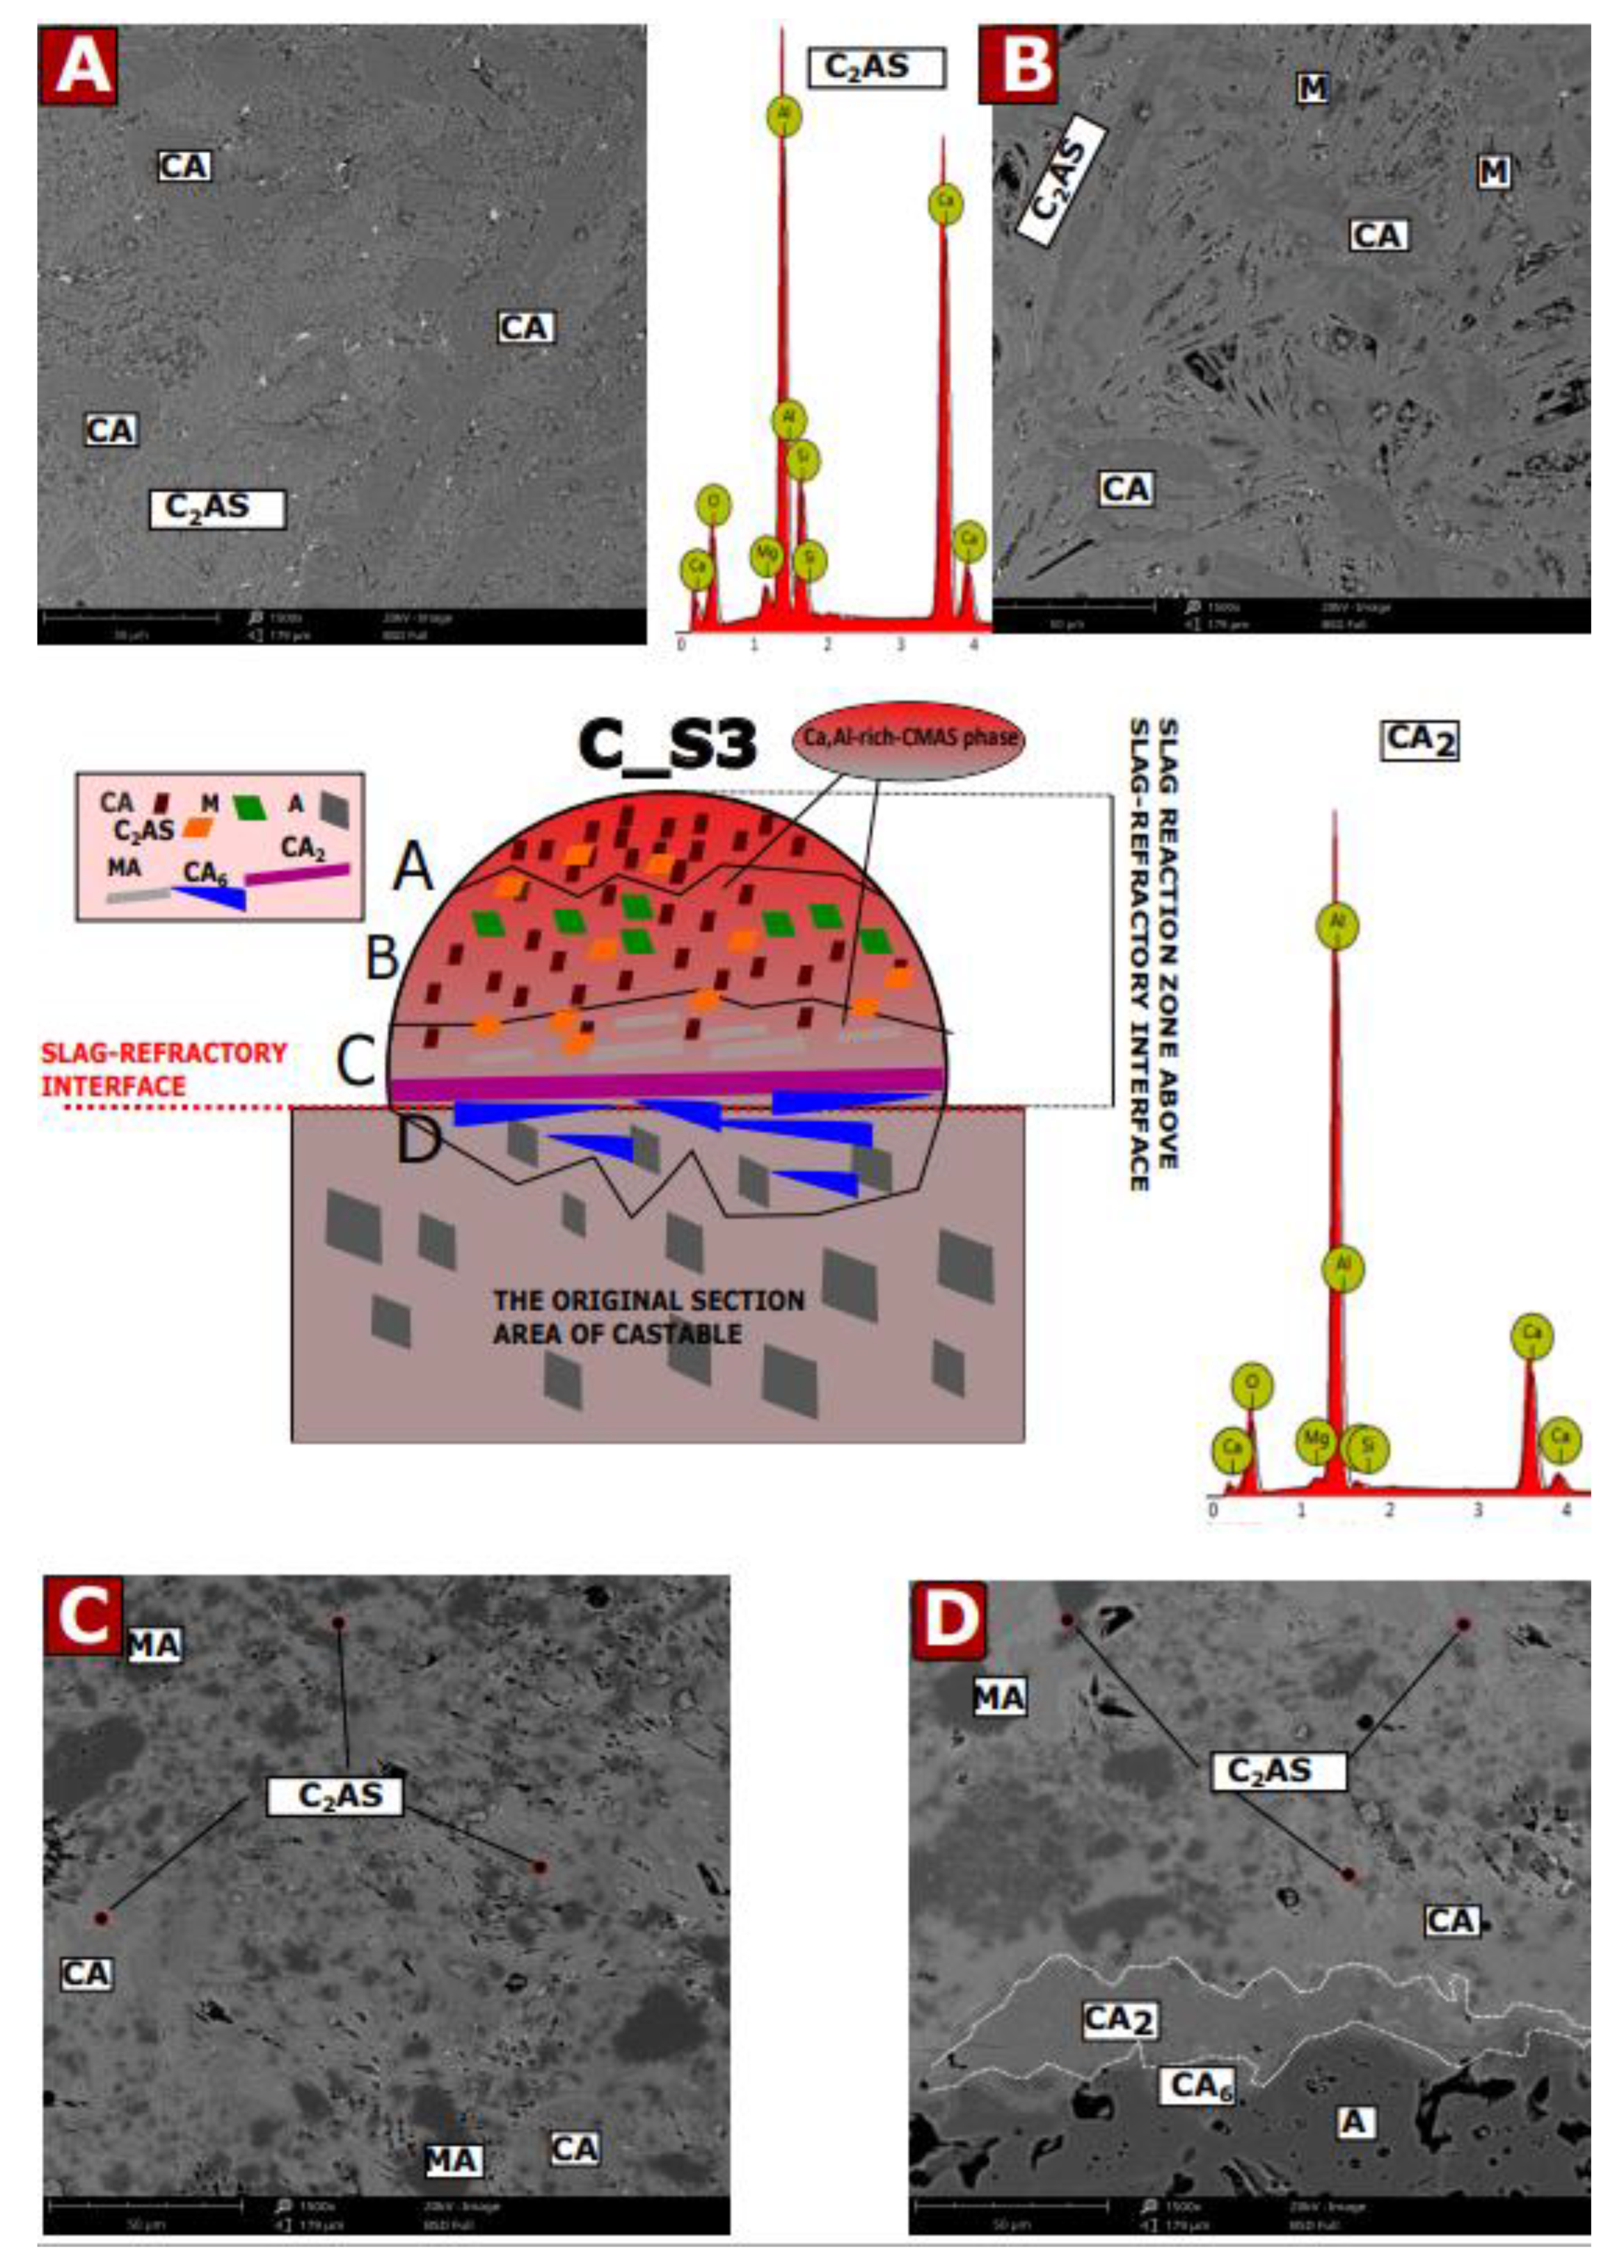
3.5. SEM-EDS Studies of Corroded Castables

Microstructural tests were performed after the corrosion test (coating method) at 1450 °C for castable C (7 wt.% MgO) with slags with mass ratios of C/S: 1.1; 3.5 and 5.5, for samples C_S1, C_S2, and C_S3, respectively. The characteristic SEM images, selected EDS results, and the diagrams of the corrosive reaction zones formed on their basis are shown in Figure A1, Figure A2 and Figure A3. Possible phases were predicted on the basis of theoretical considerations regarding the reaction mechanism in the MgO-Al2O3-SiO2, CaO-Al2O3-SiO2, and CaO-Al2O3-MgO systems [37,39,46] and by comparison of EDS of the results of the tested samples with the theoretical elemental composition of individual phases (wt.%). Figure A1, Figure A2 and Figure A3 have been compiled on this basis. For samples of castable C with slags S1, S2, and S3, a diagram is placed in the center of the picture, while in the corners, there are selected representative SEM images from each zone.
Figure A1A–D show the SEM results for specific corrosion zones for sample C_S1 and EDS spectra for the CA6 and CAS2 phases. For sample C_S2, Figure A2A–D show SEM images for specific corrosion zones and EDS results for CA2, CA6, and C2AS phases, which were identified by composition. Figure A3A–D shows the SEM results for specific corrosion zones for the C_S3 sample as well as EDS spectra for the CA2 and C2AS phases.
As can be observed in Figure A1, Figure A2 and Figure A3 for the castable in contact with the slag S1 (Figure A1), the A–D reaction sub-zones were formed below the slag-refractory contact line. For samples S2 (Figure A2) and S3 (Figure A3), the reaction sub-zones were observed above the slag–refractory contact line, on the slag–refractory interface, and slightly below the slag–refractory contact line. It can be concluded that the S1 slag has a greater tendency to infiltrate deep into the material than the S2 and S3 slags.
In the case of the C_S1 sample, all slags infiltrated into the material. Therefore, it was necessary to consider possible reactions between the mineral phases of the slags estimated by FactSage (Figure 3a) and the mineral phases of the castable. In addition, the obtained results were compared with the phases calculated by the FactSage method as reaction products formed in 50% by weight mixtures slag and 50 wt.% of the casting for sample C_S1 (Figure 4a). Based on the results of chemical analysis in the area of the slag-refractory contact line (sub-zone A), mainly C2AS and CAS2 phases were observed, but some amounts of spinel (MA) were present. According to Wang et al. [49], the C3MS2 and C2MS2 phases, which are components of the slag, form C2AS in contact with Al2O3, which is a component of the castable or the liquid phase. Then, C2AS, by reacting with SiO2 from the liquid phase and Al2O3 from the material or the liquid phase, forms CAS2, according to Equation (3) [50,51]. The spinel detected in sub-zone A probably resulted from the reaction of the CMS and Al2O3 phases [52], which in addition to spinel, may lead to the formation of the CA6 phase, which was observed in sub-zone B. The MA and CA6 phase observed in the individual sub-zones could also arise from the melting of CM2A8 in accordance with Equations (4) and (5) [48].
C2AS + 3S + A → 2CAS2
CM2A8 → MA +C2M2A14 + liq
C2M2A14 → MA + CA6 + liq
During analysis of the deeper areas of the material, i.e., sub-zone C, significant amounts of CA, CA2, and CA6 phases were observed. On the other hand, the CA6 phase was also detected in sub-zone D, where some amounts of MA phase were also observed. It should be noted that the CA6 phase could also arise according to Equation (6) [53], and the CA2 and CA phases present in subzone C and D probably formed according to Equations (7) and (8) [53,54], respectively. The corrosion progress of the castable in contact with slag S1, compared to slags S2 and S3, was the greatest. This observation may be due to the presence of CAS2 in sample C_S1 and the presence of the eutectic temperature between C2AS and CAS2. CAS2 was not calculated for samples C_S2 and C_S3. According to many authors, the temperature eutectic between the C2AS and CAS2 phases is formed around 1400 °C [38].
6 A Ca 2 + CA 6
CA 6 2 Ca 2 + 3 CA 2
CA 2 Ca 2 + 2 CA
As can be seen in Figure A2, for the castable in contact with the slag S2, the phases were distributed within four sub-zones, i.e., A, B, C sub-zones were above the slag-refractory contact line, while the D sub-zone was formed below the slag-refractory contact line. A characteristic feature of sub-zones A–C is the occurrence of the continuous Ca, Al-rich CMAS phase (the chemical composition was slightly different in the individual A–C sub-zones), where specific phase distribution can be found. Thus, in sub-zone A, we observe grains of MgO (M), spinel (MA), C2S, and CA, which are dispersed in the continuous Ca, Al-rich CMAS phase. In sub-zone B, the MgO grains disappear completely, and more secondary spinel is formed. It is predicted that all phases detected in sub-zones A and B were formed as a result of the reaction of the oxide components of the liquid phase, which were exclusively from the slag, according to Equations (9)–(11):
C ( liquid ) + A ( liquid )   CA
  M ( liquid ) + A ( liquid )   MA
2 C ( liquid ) + S ( liquid ) C 2 S
Comparing the EDS results and the theoretical composition, it was noticed that in the C sub-zone, there are phases similar to CA6, CA2, C2AS, CA, and some secondary MAs were still observed. In sub-zone C, smaller amounts of spinel and CA phase were observed. On the other hand, at the slag–refractory interface (between the reaction subzone C and D), the CA2 and CA6 phases were observed, which prevented further corrosion progressing into the material, as a result of which, in sub-zone D located below the slag-refractory interface, the material was only slightly corroded. Many authors have reported that at high temperatures, Ca2+ ions can easily diffuse into materials containing Al2O3 and segregate at the borders of corundum grains or at the surface [54,55]. According to Cinbulk, this diffusion of Ca2+ into Al2O3 occurs before CA6 generation [50]. CA6 reacts with Ca2+ ions to form CA2 followed by CA. Thus, the predicted mechanism of phase formation in the C and D sub-zones follows Equations (6)–(8). It should also be noted that gehlenite is probably formed from the CA2 or CA6 phase by reaction with SiO2, which was from the liquid phase [49].
The significant amounts of CA2 and CA6 phase prevent the further diffusion of Ca2+ ions towards the refractory material, which largely prevents further corrosion of the material. As a result, in zone D, below the contact line of the refractory slag, no significant defects in the refractory material were observed; only some amounts of CA6 phase were observed. It can be assumed that the reaction components forming the phases above the slag-refractory contact line come mainly from slag reagents, while on the contact line and below the slag–refractory contact line, both slag and material reactants take part in the reaction.
In Figure A3, for the castable in contact with the slag S3, the A–C reaction sub-zones were formed above the slag–refractory contact line, while the D sub-zone, they were formed below this line. A characteristic feature of sub-zones A–C is the occurrence of the continuous Ca, Al-rich CMAS phase. Moreover, from microscopic observation, significant amounts of CA phase were observed in sub-zone A, formed from oxides of the liquid phase derived from the components of the slag (Equation (9)). The CA phase formed probably reacts with ions Si2+ and Ca2+ of oxide from the liquid phase to form gehlenite, according to Equation (12). Moving towards the slag–refractory contact line, some amounts of MgO grains (sub-zone B) were observed. On this basis, it was found that the secondary spinel was formed from MgO and Al2O3 oxides as in Equation (10). On the other hand, significant amounts of CA2 phase were formed on the slag-refractory contact line, as well as above this line. The CA6 phase adjusted to corundum grains prevented further diffusion of Ca2+ ions into the refractory material, which stopped the corrosion processes of castables. It was found that in phase D subzone CA6, CA2 and CA were formed in accordance with Equations (6)–(8), respectively. In contrast, C2AS present in the D subzone was probably formed by the reaction of CA2 or CA6 with SiO2 from the liquid phase of the slag components.
CA Si 4 + , Ca 2 + C 2 AS
Microstructure observations of the analyzed samples confirmed that the mass ratio C/S affects the corrosion resistance of castables. As shown in Figure A1, for the C_S1 sample, the smallest mass ratio C/S in the slag caused the entire slag to infiltrate into the material. This was due to the low eutectic temperature between C2AS and CAS2 (around 1400 °C). However, in the case of an increase in the mass ratio C/S, as shown in Figure A2 for sample C_S2 and Figure A3 for sample C_S3, the slag formed a reaction zone above the slag–refractory contact line and below the slag–refractory contact line, which indicated lower slag aggression.
Thus, the presence of SiO2 in the slag composition had a significant impact on the corrosion processes of the tested castables, while the Ca2+ ions present in the slag diffused deepest towards the material, as shown by the SEM images. It should also be observed that Ca2+ ions in contact with Al2O3 coming from the material formed CA2 and CA6 phases, which at some distance from the slag–refractory contact line formed a barrier for Ca2+ ions, which prevented the corrosion processes from progressing. An important observation was the emergence of secondary spinel, which differs in the shape of the grains from the material-derivative spinel. This fact was confirmed in previous studies, both in the FactSage analysis and in the XRD analysis.

4. Summary and Conclusions

Castables with MgO content of 3–7 wt.% were prepared using tabular alumina and magnesia fume by casting, drying, and firing at elevated temperatures. In addition, three slags were prepared via classical ceramic route and calculated by FactSage to determine probable phase vs. temperature.
Based on the analysis of the results, the thermodynamic changes in the solid and liquid phases of steel slags with a mass ratio of CaO/SiO2 (C/S) 1.1 (S1), 3.5 (S2), and 5.5 (S3) were predicted, and an oxidizing atmosphere was formed as a result of the temperature increase. The presence of SiO2-rich phases, including C3MS2, in the S1 sample in the analyzed temperature range from 1300–1500 °C can be associated with a significant increase in the liquid phase content for this sample, as much as 96.76 wt.%. Sample S3 and sample S2, for which the content of SiO2-rich phases was lower, showed in the analyzed temperature range 80.15 wt.% and 65.94 wt.%, respectively.
Equiweight mixtures of slags and castables (50 wt% slag and 50 wt.% castable) were calculated by FactSage, observed by heating microscopy thermal analysis (HMTA), fired at 1350 °C, and investigated by X-ray diffraction (XRD).
Thermochemical simulations were performed using FactSage software, and on this basis, the graphs were created; thermodynamic predictions of the solid phases and liquid phase of the reactive mixtures containing components of the cement-free corundum-spinel refractory castable with 7 wt.% of MgO and steel slags with the C/S mass ratio of 1.1_S1, 3.5_S2, and 5.5_S3, as well as thermodynamic predictions of the CM2A8 solid phase of the reactive mixtures A_S1, B_S1, C_S1, A_S2, and B_S2 versus increasing temperature. In addition, the chemical composition of the liquid phase of the reactive mixtures containing components of the cement-free corundum-spinel refractory castable with 7 wt.% of MgO and steel slags with the C/S mass ratio of 1.1, 3.5, and 5.5 was determined. There were qualitative and quantitative differences between the samples, depending on the analyzed type of slag. An important observation was that more SiO2-rich phases were detected in the S1 slag compared to the S2 and S3 slags, as well as information that with increasing MgO content in the overall composition, the CM2A8 content in the samples decreases. On the other hand, it was observed that with an increase in the SiO2 content in the overall composition, the CM2A8 content in the samples increased. Moreover, comparing the phase composition of the C_S1, C_S2, and C_S3 equiweight mixtures with the phase composition of the slags S1, S2, and S3, respectively, for a specific temperature of 1350 °C (the temperature at which the sintering processes took place, and the content of the liquid phase is so low that the analysis of the results could be reliably carried out), showed that the content of silica-rich phases is much lower for the equiweight mixtures than for the slags themselves. This is related to the widening of the temperature range in which the liquid phase forms. In sample C_S1, where the proportion of the SiO2-containing phase was the highest, the first amounts of the liquid phase were formed at the lowest temperature.
In order to perform the HMTA, cubic samples were prepared from the mixtures of 50 wt% slag and 50 wt.% castable.
Based on the thermal analysis of heating microscopy in the measuring range, it was found that the concretes showed shrinkage only in contact with the slag with the lowest C/S mass ratio, and it was observed that the higher the MgO mass content in the analyzed sample, the lower its shrinkage. Characteristic points of transformation of reactive mixtures were also determined. For castables with the highest mass content of MgO (7 wt.%), significant shrinkage occurred at higher temperatures than for other castables.
Based on the results from FactSage of equiweight mixes castable with slag, the samples of 50 wt.% castable and 50 wt.% slag firing temperature of 1350 °C were selected for the X-ray diffraction (XRD) analysis. This allowed for a phase analysis because the synthesis processes took place, and the liquid phase content was so small that it did not affect the test results.XRD analysis allowed us to observe significant qualitative differences between the sample with a lower C/S mass ratio and the remaining samples. A graph was compiled with no-corroded castable C (7 wt.% Of MgO) with an equilibrium phase composition and three mixtures C_S1, C_S2, and C_S3. Note that only for sample C_S1, CAS2 was found during the analysis, which, together with gehlenite, reduces the melting point, and thus, causes the appearance of the liquid phase at lower temperatures.
X-ray results carried out on the equiweight castable and slag mixes confirm the thermal analysis and the presence of the phases calculated by FactSage. HMTA showed that the CAS2 phase detected in the XRD analysis, observed only for the castable sample with the slag S1 (lowest C/S mass ratio), has a significant impact on the castable shrinkage caused by the formation of the liquid phase.
The static corrosion test was conducted by means of the coating method on rectangular castable samples in contact with slag sat 1450 °C. The samples were tested in a perpendicular direction to the slag–refractory interface. The corrosion index IC in the regions of castables affected by slags was calculated in the MATLAB program. Phases and phase distributions were evaluated by SEM-EDS on polished samples of castables (7 wt.% MgO) with slags S1, S2, and S3.
On the basis of the analysis, SEM images were obtained, allowing for the determination of the distribution of individual phases in the sample, as well as for the determination of zones and subzones formed as a result of corrosion. A relationship was observed between the mass ratio of C/S in the slag and the tendency to form reaction zones. For the slag S1 with the lowest mass ratio C/S, only the slag zones below the slag–refractory interference contact line were observed, while for slags S2 and S3 with a higher mass ratio C/S, there are zones both above the slag-refractory interference and below the slag–refractory interference contact line. Based on the SEM-EDS analysis, it was found that the CA2 and CA6 phases form the deepest in the material. Some amounts of free oxides (MgO) could be observed for samples C_S2 and C_S3 above the contact line slag-refractory material. Moreover, the zone below the contact line slag-refractory material was slightly degraded. Thus, the reactions mainly ran between the slag components upstream of this line, and the CA2 phases of CA6 prevented further material degradation.
The highest corrosion tendency, determined on the basis of IC, concerns the concretes with the lowest C/S ratio, which is confirmed in the HRTM analysis (sample with the highest shrinkage) and also in the SEM images, where the reaction zone was only below the slag-refractory material contact line.
The most important conclusions from this work are included in several points:
-
As the content of SiO2-rich phases in the slag increases, the tendency for accelerated liquid phase formation in a narrow temperature range also increases.
-
The macroscopic image is influenced by the composition and quantity of the liquid phase.
-
CAS2, formed as a result of corrosion of the slag with a lower C/S content, reduces the temperature of the liquid phase formation and increases the degradation of the material
-
The lower the C/S mass ratio in the slag, the greater the area of castable that will be degraded.
-
It was found that with an increase in the MgO content in the material, the IC decreases (with increasing MgO content in castable, the castable’s resistance to slag increases), while with the decrease in the mass ratio C/S in the slag, the IC increases, i.e., the aggressive character of the slag increases.
-
Insights on in situ secondary MgAl2O4 formation mechanism and its correlation with the corrosion resistance study were conducted of spinel-containing refractory castables.
-
The Ca2+ ions that most deeply diffuse into the material form a continuous zone of CA2 and CA6, which prevents further degradation of the material. As the C/S ratio decreases, this zone is deeper in the material.

Author Contributions

J.R.: methodology, writing—original draft preparation, visualization, data curation, investigation, software; K.W.-T.: FactSage calculations; R.P.: sample preparation; D.M.: conceptualization, methodology, validation, formal analysis, resources, writing—review and editing, supervision, project administration, and funding acquisition. All authors have read and agreed to the published version of the manuscript.

Funding

This study was funded by The National Centre for Research and Development (Poland) within the framework of LIDER VIII project No. LIDER/5/0034/L-8/16/NCBR/2017 (Recipient: Dominika Madej). The sponsor had no role in the design, execution, interpretation, or writing of the study.

Institutional Review Board Statement

Not applicable.

Informed Consent Statement

Not applicable.

Data Availability Statement

Data used in this study are available upon reasonable request to the corresponding author.

Conflicts of Interest

The authors declare no conflict of interest.

Appendix A

Figure A1. (A–D) In the center is a schematic diagram of the phases present in the castables-slag S1 sample after corrosion. In the corners, there are photos of SEM micro-areas, as well as selected EDS.
Applsci 12 00704 g0a1
Figure A2. (AD) In the center is a schematic diagram of the phases present in the castables-slag S2 sample after corrosion. In the corners, there are photos of SEM micro-areas, as well as selected EDS.
Applsci 12 00704 g0a2
Figure A3. (AD) In the center is a schematic diagram of the phases present in the castables-slag S3 sample after corrosion. In the corners, there are photos of SEM micro-areas, as well as selected EDS.
Applsci 12 00704 g0a3

References

  1. Nakabo, K.; Nishida, S.; Kitamura, M. Technologies of alumina-magnesia refractories for steel ladles part II, castable properties under restrained heating. In Proceedings of the 72° Congresso Anual da ABM, Sao Paulo, Brazil, 2–8 October 2017; Volume 72, pp. 291–301. [Google Scholar]
  2. Nieformowanewyrobyogniotrwałe—Część 1: Wprowadzenieiklasyfikacja, PN-EN 1402-1:2005. Available online: https://sklep.pkn.pl/pn-en-1402-1-2005p.html (accessed on 2 September 2021).
  3. Warmuz, K.; Madej, D. Effect of the particle size on the reactivity of MgO-Al2O3hydratingmixtures: A long-term kinetic investigation of hydrotalcite synthesis. Appl. Clay Sci. 2021, 211, 106196. [Google Scholar] [CrossRef]
  4. Lee, W.E.; Vieira, W.; Zhang, S.; Ahari, K.G.; Sarpoolaky, H.; Parr, C. Castable refractory concretes. Int. Mater. Rev. 2001, 46, 145–167. [Google Scholar] [CrossRef]
  5. Zawrah, M.F.M.; Khalil, N.M. Effect of mullite formation on properties of refractory castables. Ceram. Int. 2001, 27, 689–694. [Google Scholar] [CrossRef]
  6. Myhre, B. Strength development of bauxite-based ultralow-cement castables. Am. Ceram. Soc. Bull. 1994, 73, 68–73. [Google Scholar]
  7. Aïtcin, P.C. Supplementary cementitious materials and blended cements. In Science and Technology of Concrete Admixtures; Woodhead Publishing: Cambridge, UK, 2016; pp. 53–73. [Google Scholar] [CrossRef]
  8. Firoozjaei, E.A.; Saidi, A.; Monshi, A.; Koshy, P. The Effect of Microsilica and Refractory Cement Content on the Properties of Andalusite Based Low Cement Castables Used in Aluminum Casthouse. Cerâmica 2010, 56, 411–421. [Google Scholar] [CrossRef]
  9. Majchrowicz, I.; Witel, J.; Barański, J.; Cholewa, M. Monolitycznemateriałyogniotrwałe do zastosowań w odlewnictwie. XII Konferencjaodlewnicza Technical; 2010. Available online: http://docplayer.pl/14339381-Monolityczne-materialy-ogniotrwale-do-zastosowan-w-odlewnictwie.html (accessed on 15 September 2021).
  10. Souza, T.M.; Braulio, M.A.L.; Luz, A.P.; Bonadia, P.; Pandolfelli, V.C. Systemic analysis of MgO hydration effects on alumina–magnesia refractory castables. Caram. Int. 2012, 38, 3969–3976. [Google Scholar] [CrossRef]
  11. Chan, C.F.; Ko, Y.C. Effect of CaO content on the hot strength of alumina–spinel castables in the temperature range of 1000 °C to 1500 °C. J. Am. Ceram. Soc. 2005, 81, 2957–2960. [Google Scholar] [CrossRef]
  12. Chen, S.; Cheng, M.; Lin, S.; Ko, Y. Thermal characteristics of Al2O3–MgO and Al2O3–spinel castables for steel ladles. Ceram. Int. 2002, 28, 811–817. [Google Scholar] [CrossRef] [Green Version]
  13. Diaz, L.A.; Torrecillas, R.; de Aza, A.; Pena, P.; de Aza, S. Alumina-rich refraktory concretes with added spinel, periclase and dolomite: A comparative study of their microstructural evolution with temperature. J. Eur. Ceram. 2005, 25, 1499–1506. [Google Scholar] [CrossRef]
  14. Nanba, M.; Kaneshige, T.; Hamazaki, Y.; Nishio, H.; Ebizawa, I. Thermal characteristics of castables for teeming ladles. Taikabutsu Overseas 1996, 16, 17–21. [Google Scholar]
  15. Sako, E.Y.; Braulio, M.A.L.; Milanez, D.H.; Brant, P.O.; Pandolfelli, V.C. Microsilica role in the CA6 formation in cement-bonded spinelrefractorycastables. J. Mater. Process. Technol. 2009, 209, 5552–5557. [Google Scholar] [CrossRef]
  16. Braulio, M.A.L.; Rigaud, M.; Buhr, A.; Parr, C.; Pandolfelli, V.C. Spinel-containing alumina-based refractory castables. Ceram. Int. 2011, 37, 1705–1724. [Google Scholar] [CrossRef]
  17. Sumimura, H.; Yamamura, T.; Kubota, Y.; Kaneshige, T. Study on slag penetration of alumina-spinel castable. In Proceedings of the UNITECR’99, Berlin, Germany, 6–9 September 1999; pp. 97–101. [Google Scholar]
  18. Fujii, K.; Furusato, I.; Takita, I. Composition of spinel clinker for teeming ladle casting materials. Taikabutsu Overseas 1999, 12, 4–9. [Google Scholar]
  19. Kriechbaum, G.W.; Wohrmeyer, C.; Routschka, G. Neue Spinell-Rohstoffe fur FeuerfestauskleidungenimStahlbereich. In Proceedings of the 35th International Colloquium on Refractories, Aachen, Germany, 26–27 February 1992. [Google Scholar]
  20. Mori, J. Structure change of alumina castable by addition of magnesia or spinel. Taikabutsu Overseas 1995, 15, 20–23. [Google Scholar]
  21. Nagasoe, A.; Tsurumoto, S.I.; Kitamura, A. Refractory characteristics of spinels with various MgO contents. Taikabutsu Overseas 1991, 11, 20–28. [Google Scholar]
  22. Mori, J.; Yoshimura, M.; Oguchi, Y.; Kawakami, T.; Ohishi, I. Effect of slag composition on wear of alumina-spinel castable for steel ladle. Taikabutsu Overseas 1992, 12, 40–45. [Google Scholar]
  23. Naigai, B.; Matsumoto, O.; Isobe, T.; Nishiumi, Y. Wear mechanism of castasble for steel ladle by slag. Taikabutsu Overseas 1992, 12, 15–20. [Google Scholar]
  24. Sato, Y.; Joguchi, H.; Hiroki, N. Test results of alumina-spinel castable for steel ladle. Taikabutsu Overseas 1992, 12, 10–14. [Google Scholar]
  25. Yamamura, T.; Kubota, Y.; Kaneshige, T.; Nanba, M. Effect of spinel clinker composition on properties of alumina-spinel castable. Taikabutsu Overseas 1994, 13, 39–45. [Google Scholar]
  26. Holleyn, F.; Krause, O.; Rossdeutscher, J.; Brochen, E.; Dannert, C.; Odziomek, M. Matrix Design for Improved Spinel Formation in High Alumina Refractory Monolithics that is Adjusted to the Service Conditions. In Proceedings of the UNITECR, Santiago, Chile, 26–29 September 2017; pp. 465–468. [Google Scholar]
  27. Zhang, S.; Lee, W.E. Spinel-containing refractories. In Refractories Handbook; Schacht, C.A., Monticello, M.D., Eds.; CRC Press: Boca Raton, FL, USA, 2004; pp. 81–139. [Google Scholar]
  28. Yamamura, T.; Hamazaki, Y.; Kaneshige, T.; Toyoda, T.; Nishi, M.; Kato, H. Alumina-spinel castable refractories for steel teeming ladle. Taikabutsu Overseas 1992, 12, 21–27. [Google Scholar]
  29. Salomao, R.; Bittencourt, L.R.M.; Pandolfelli, V.C. A novel approach for magnesia hydration assessment in refractory castables. Ceram. Int. 2007, 33, 803–810. [Google Scholar] [CrossRef]
  30. Yilmaz, S. Corrosion of high alumina spinel castables by steel ladle slag. Ironmak. Steelmak. 2006, 33, 151–156. [Google Scholar] [CrossRef]
  31. Qiu, W.; Ruan, G.; Ouyang, J.; Zhao, Y. Effect of Spinel Kinds on Properties of Alumina-Spinel Castables. Int. J. Appl. Ceram. Technol. 2014, 11, 993–1000. [Google Scholar] [CrossRef]
  32. Diaz, L.A.; Torrecillas, R.; de Aza, A.H.; Pena, P. Effect of spinel content on slag attack resistance of high alumina refractory castables. J. Eur. Ceram. Soc. 2007, 27, 4623–4631. [Google Scholar] [CrossRef]
  33. Pogorzałek, J.; Różański, P. Steelmaking Slags Utilization. Prace IMŻ 1, 2010. Available online: https://fbc.pionier.net.pl/details/nnlt3T5 (accessed on 6 July 2021).
  34. Guo, M.; Parada, S.; Smets, S.; Jones, P.T.; van Dyck, J.; Blanpain, B.; Wollants, P. Laboratory study of the interaction mechanisms between magnesia-chromite refractories and Al2O3-rich VOD slags. In Proceedings of the VII International Conference on Molten Slags Fluxes and Salts, Institute of Mining and Metallurgy, Cape Town, South Africa, 25–28 January 2004. [Google Scholar]
  35. Rose, L.; Reichel, J.; Germershausen, T. Innovations in Refining Process Technique Combined Blowing Vacuum Converter with CO2; SMS Siemag AG: Düsseldorf, Germany, 2013. [Google Scholar]
  36. Jonczy, I.; Lata, L. Characteristic of chemical composition of converter and blast furnace slags. Górnictwo I Geol. 2013, 8, 51–61. [Google Scholar]
  37. Belmonte, D.; Ottonello, G.; VetuschiZuccolini, M.; Attene, M. The system MgO-Al2O3-SiO2 under pressure: A computational study of melting relations and phase diagrams. Chem. Geol. 2017, 461, 54–64. [Google Scholar] [CrossRef]
  38. Prince, A.T. Phase Equilibrium Relationships in a Portion of the System MgO-A12O3-2CaO·SiO2. J. Am. Ceram. Soc. 1951, 34, 44–51. [Google Scholar] [CrossRef]
  39. Prince, A.T. Liquidus Relationships on 10% MgO Plane of the System Lime-Magnesia-Alumina-Silica. J. Am. Ceram. Soc. 1954, 37, 402–408. [Google Scholar] [CrossRef]
  40. Shin, J.W. The experimental and theoretical determination of the thermodynamic properties of melts and glasses from the system CaO-MgO-Al2O3-SiO2. Aachen Techn. Hochsch. Diss. 2005. Available online: http://publications.rwth-aachen.de/record/59938/files/59938.pdf (accessed on 6 June 2021).
  41. Lee, W.E.; Zhang, S. Direct and indirect slag corrosion of oxide and oxide-c refractories. In Proceedings of the VII International Conference on Molten Slags Fluxes and Salts, Cape Town, South Africa, 25–28 January 2004; pp. 309–319. [Google Scholar]
  42. Chen, L.; Li, S.; Jones, P.T.; Guo, M.; Blanpain, B.; Malfliet, A. Identification of magnesia–chromite refractory degradation mechanisms of secondary copper smelter linings. J. Eur. Ceram. Soc. 2016, 36, 2119–2132. [Google Scholar] [CrossRef]
  43. Mosner, P.; Vorokhta, M.; Koudelka, L. Application of heating microscopy to the study of thermal behaviour of ZnO–P2O5–WO3 glasses. J. Therm. Anal. Calorim. 2013, 112, 659–664. [Google Scholar] [CrossRef]
  44. Rankin, G.A.; Wright, F.E. The ternary system CaO-Al2O3-SiO2. Am. J. Sci. 1915, 39, 1–79. [Google Scholar] [CrossRef]
  45. Shu, Q.; Wang, Y.; Li, J.; Liu, Y.; Li, P.; Chou, K. Effect of Na2O on Dissolution Rate of Alumina in CaO–Al2O3–MgO–SiO2 Slag. ISIJ Int. 2015, 55, 2297–2303. [Google Scholar] [CrossRef] [Green Version]
  46. Rao, M.R. Liquidus Relations in the Quaternary Subsystem CaA12O4-CaAl4O7-Ca2Al2SiO7-MgAl2O4. J. Am. Ceram. Soc. 1968, 51, 50–54. [Google Scholar] [CrossRef]
  47. De Aza, A.H.; Iglesias, J.E.; Pena, P.; de Aza, S. Ternary System Al2O3–MgO–CaO: Part II, Phase Relationships in the Subsystem Al2O3–MgAl2O4–CaAl4O7. J. Am. Ceram. Soc. 2000, 83, 919–927. [Google Scholar] [CrossRef]
  48. Sako, E.Y.; Braulio, M.A.L.; Zinngrebe, E.; van der Laan, S.R.; Pandolfelli, V.C. In-Depth Microstructural Evolution Analyses of Cement-Bonded Spinel Refractory Castables: Novel Insights Regarding Spinel and CA6 Formation. J. Am. Ceram. Soc. 2012, 95, 1732–1740. [Google Scholar] [CrossRef]
  49. Wang, Z.; Sohn, I. Effect of the Al2O3/SiO2 mass ratio on the crystallization behavior of CaO-SiO2-MgO-Al2O3 slags using confocal laser scanning microscopy. Ceram. Int. 2018, 44, 19268–19277. [Google Scholar] [CrossRef]
  50. Allu, A.R.; Balaji, S.; Tulyaganov, D.U.; Mather, G.C.; Margit, F.; Pascual, M.J.; Siegel, R.; Milius, W.; Senker, J.; Agarkov, D.A.; et al. Understanding the Formation of CaAl2Si2O8 in Melilite Based Glass-Ceramics: Combined Diffraction and Spectroscopic Studies. J. Am. Chem. Soc. 2017, 29, 6233–6243. [Google Scholar] [CrossRef]
  51. Martinez, A.G.T.; Luz, A.P.; Braulio, M.A.L.; Sako, E.Y.; Pandolfelli, V.C. Revisiting CA6 formation in cement-bonded alumina-spinel refractory castables. J. Eur. Ceram. 2017, 37, 5023–5034. [Google Scholar] [CrossRef]
  52. Park, S.Y.; Kim, K.H.; Kang, S.J.L. Formation of CaO6Al2O3 and MgAl2O4 During Dissolution of Al2O3 into CaMgSiO4 Melt. J. Mater. Sci. 1992, 11, 315–316. [Google Scholar]
  53. Geiger, C.A.; Kleppa, O.J.; Mysen, B.O.; Lattimer, J.M.; Grossman, L. Enthalpies of formation of CaAl4O7 and CaAl12O19 (hibonite) by high temperature, alkali borate solution calorimetry. Geochim. Cosmochim. Acta 1988, 52, 1729–1736. [Google Scholar] [CrossRef]
  54. Mercury, J.M.R.; de Aza, A.H.; Pena, P. Synthesis of CaAl2O4 from powders: Particle size effect. J. Eur. Ceram. 2005, 25, 3269–3279. [Google Scholar] [CrossRef]
  55. Johnson, W.C.; Stein, D.F. Additive and Impurity Distributions at Grain Boundaries in Sintered Alumina. J. Am. Ceram. Soc. 1975, 58, 485–489. [Google Scholar] [CrossRef]
Figure 1. Shape changes of the sample during measurements with the heating microscope. (a) starting shape; (b) deformation temperature; (c) softening temperature; (d) sphere temperature; (e) hemisphere temperature; (f) flow temperature [43].
Applsci 12 00704 g001
Figure 2. Method of determining the corroded area of castable below slag refractory interface area and the original section area of castable in a graphic program. (a1,a2) Schematic diagram of stating corrosion test by a coating method; (b) real images of the sample after the corrosion test.
Applsci 12 00704 g002
Figure 3. Thermodynamic predictions of the solid phases and liquid phase of the steel slags with the C/S mass ratio of 1.1_S1 (a), 3.5_S2 (b), 5.5_S3 (c), when exposed to an oxidizing atmosphere vs. an increasing temperature.
Applsci 12 00704 g003
Figure 4. Thermodynamic predictions of the solid phases and liquid phase of the reactive mixtures containing components of the cement-free corundum-spinel refractory castable with 7 wt.% of MgO (castable C) and steel slags with the C/S mass ratio of 1.1_S1 (a), 3.5_S2 (b), 5.5_S3 (c), when exposed to an oxidizing atmosphere vs. increasing temperature.
Applsci 12 00704 g004
Figure 5. Thermodynamic predictions of the CM2A8 solid phase of the reactive mixtures A_S1, B_S1, C_S1, A_S2, and B_S2 versus increasing temperature.
Applsci 12 00704 g005
Figure 6. Liquid vs. temp. content and chemical compositions of the liquid phase from FactSage calculation in wt.% of the reactive mixtures containing components of the cement-free corundum-spinel refractory castable with 7 wt.% of MgO (castable C) and steel slags with the C/S mass ratio of 1.1 (a), 3.5 (b), 5.5 (c).
Applsci 12 00704 g006
Figure 7. Schematic diagram presenting eutectic temperatures between binary and ternary compounds prepared based on Refs. [37,38,40,44,45,46,47].
Applsci 12 00704 g007
Figure 8. Shrinkage curves of castable compositions (A, B, and C) with slags (S1, S2, and S3) versus increasing temperature.
Applsci 12 00704 g008
Figure 9. (a) The total liquid phase content in castables composition (A, B, and C) with slag (S1) [wt.%] vs. temperature, (b) insert figure to a lesser extent.
Applsci 12 00704 g009
Figure 10. Schematic showing the division into reaction zones in materials.
Applsci 12 00704 g010
Figure 11. (a–d) X-ray diffraction of castable C (7 wt.% MgO) and mixtures (50 wt.% slag and 50 wt.% castable) with castable C and slags: S1, S2, S3 after firing at the maximum temperature of 1350 °C for 2 h.
Applsci 12 00704 g011
Figure 12. Diagram showing the corrosion index (IC) of individual castables samples in contact with the slag.
Applsci 12 00704 g012
Table 1. The overall chemical composition of mixtures containing 50 wt.% slag and 50 wt.% castable.
SampleSiO2CaOMgOAl2O3TiO2Fe2O3MnOCaF2C/SM/AC/AC/M
wt.%Mass Ratio
A_S119.1620.657.4751.330.150.700.300.251.080.150.402.76
A_S25.5717.919.7165.660.150.650.100.253.210.150.271.84
A_S35.4827.363.7962.830.150.050.100.255.000.060.447.22
B_S119.1620.658.4750.330.150.700.300.251.080.170.412.44
B_S25.5717.9110.7164.660.150.650.100.253.210.170.281.67
B_S35.4827.364.7961.830.150.050.100.255.000.080.445.71
C_S119.1620.659.4749.330.150.700.300.251.080.190.422.18
C_S25.5717.9111.7163.660.150.650.100.253.210.180.281.53
C_S35.4827.365.7960.830.150.050.100.255.000.100.454.73
Table 2. Temperature of the onset of the appearance of the liquid phase.
Reactive MixturesTemperature (°C)
A_S11086
B_S1
C_S1
A_S21221
B_S21226
C_S21203
A_S31230
B_S31231
C_S3
Table 3. Characteristic transformation points of reactive mixtures containing components of the cement-free corundum-spinel refractory castables and steel slags.
Samples
A_S1B_S1C_S1A,B,C_S2 and A,B,C_S3
Temperature of Characteristic Points [°C]
Deformation point135013201340out of measuring range
Softening point136513701365
Sphere point137713921392
Half sphere point140814201421
Total melting point/Flow141114311425
Table 4. Rietveld analysis of corroded mixtures 50 wt.% castable: 50 wt.% slag.
SamplePhases
AMAC2ASCACA2CAS2
A80.919.1----
B74.825.2----
C62.137.9----
A_S315.614.221.437.211.0-
B_S311.618.021.540.27.9-
C_S37.923.121.541.06.1-
A_S216.633.219.011.220.1-
B_S214.838.818.215.112.7-
C_S211.943.518.514.112.1-
A_S111.733.836.5--18.0
B_S18.339.334.6--17.8
C_S15.341.435.5--17.8
Publisher’s Note: MDPI stays neutral with regard to jurisdictional claims in published maps and institutional affiliations.

