
A Framework for Pedestrian Attribute Recognition Using Deep Learning


Abstract
:1. Introduction
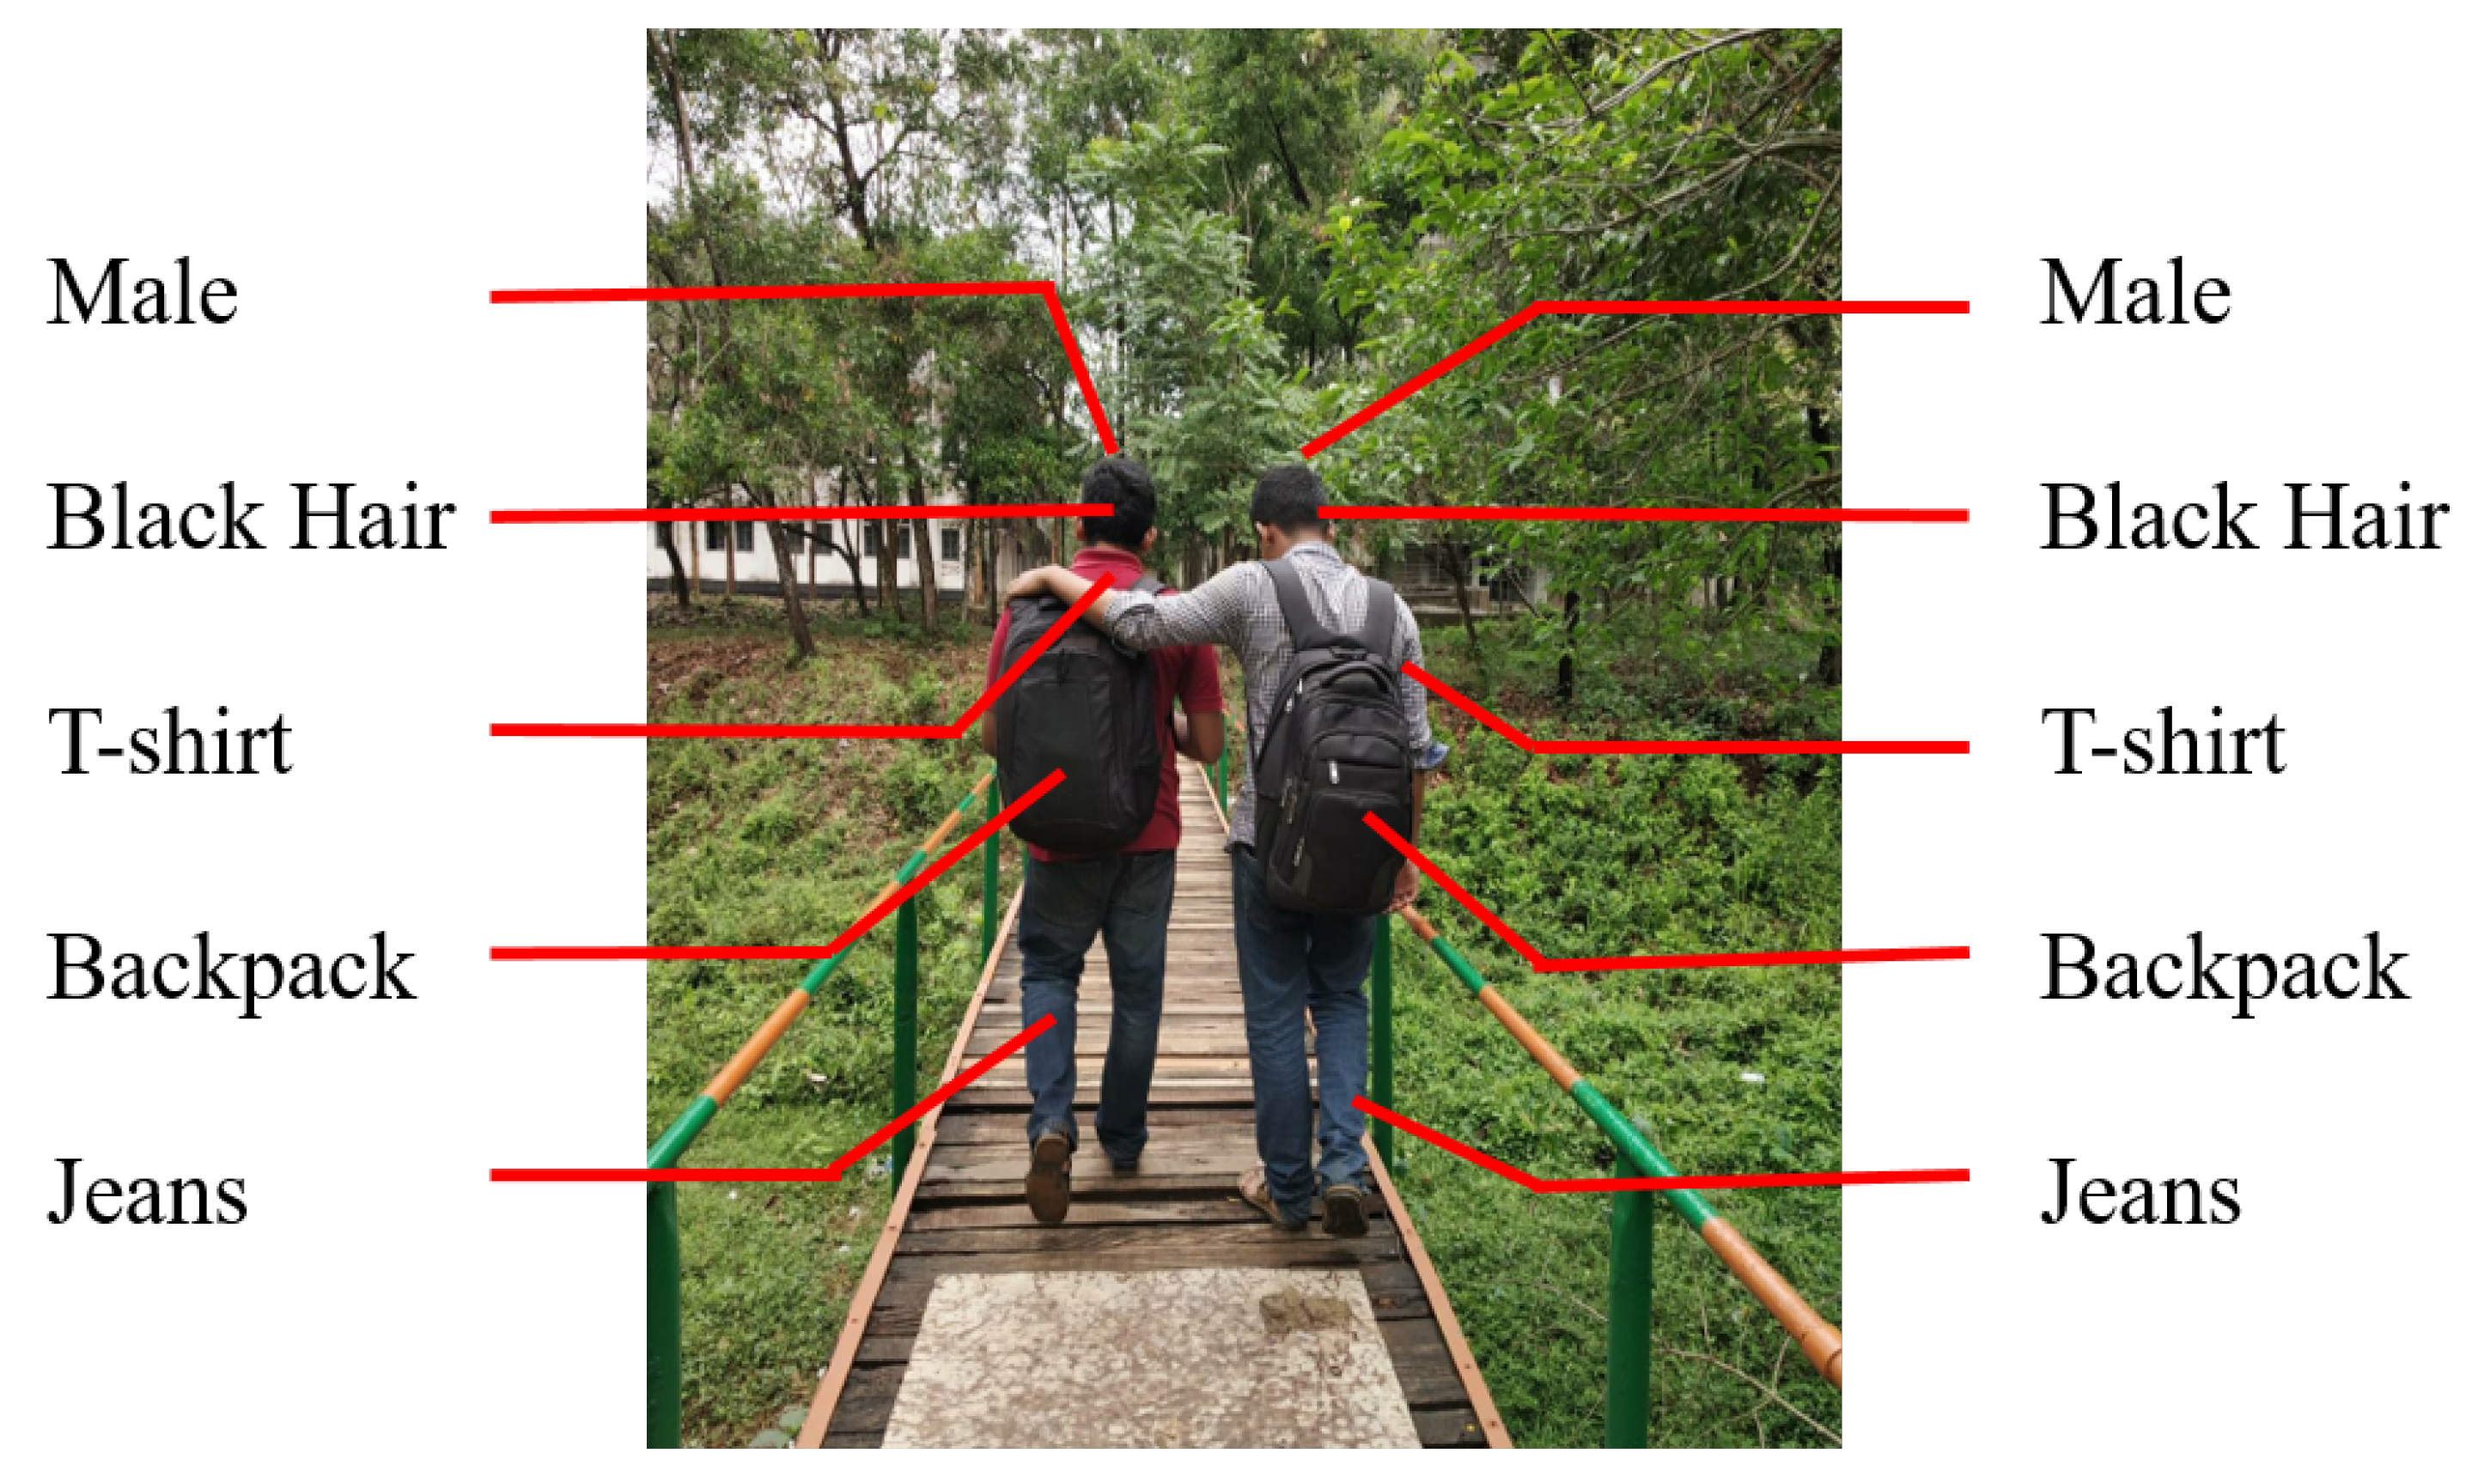
- Proposing a framework for recognizing attributes from a multiple pedestrian scenario.
- Applying the transfer learning technique among various CNN architectures, i.e., Inception ResNet v2, Xception, ResNet 152 v2, ResNet 101 v2 to recognize pedestrian attributes.
- Tuning the best performing model ResNet 152 v2 by freezing some layers and designing a customized fully connected layer.
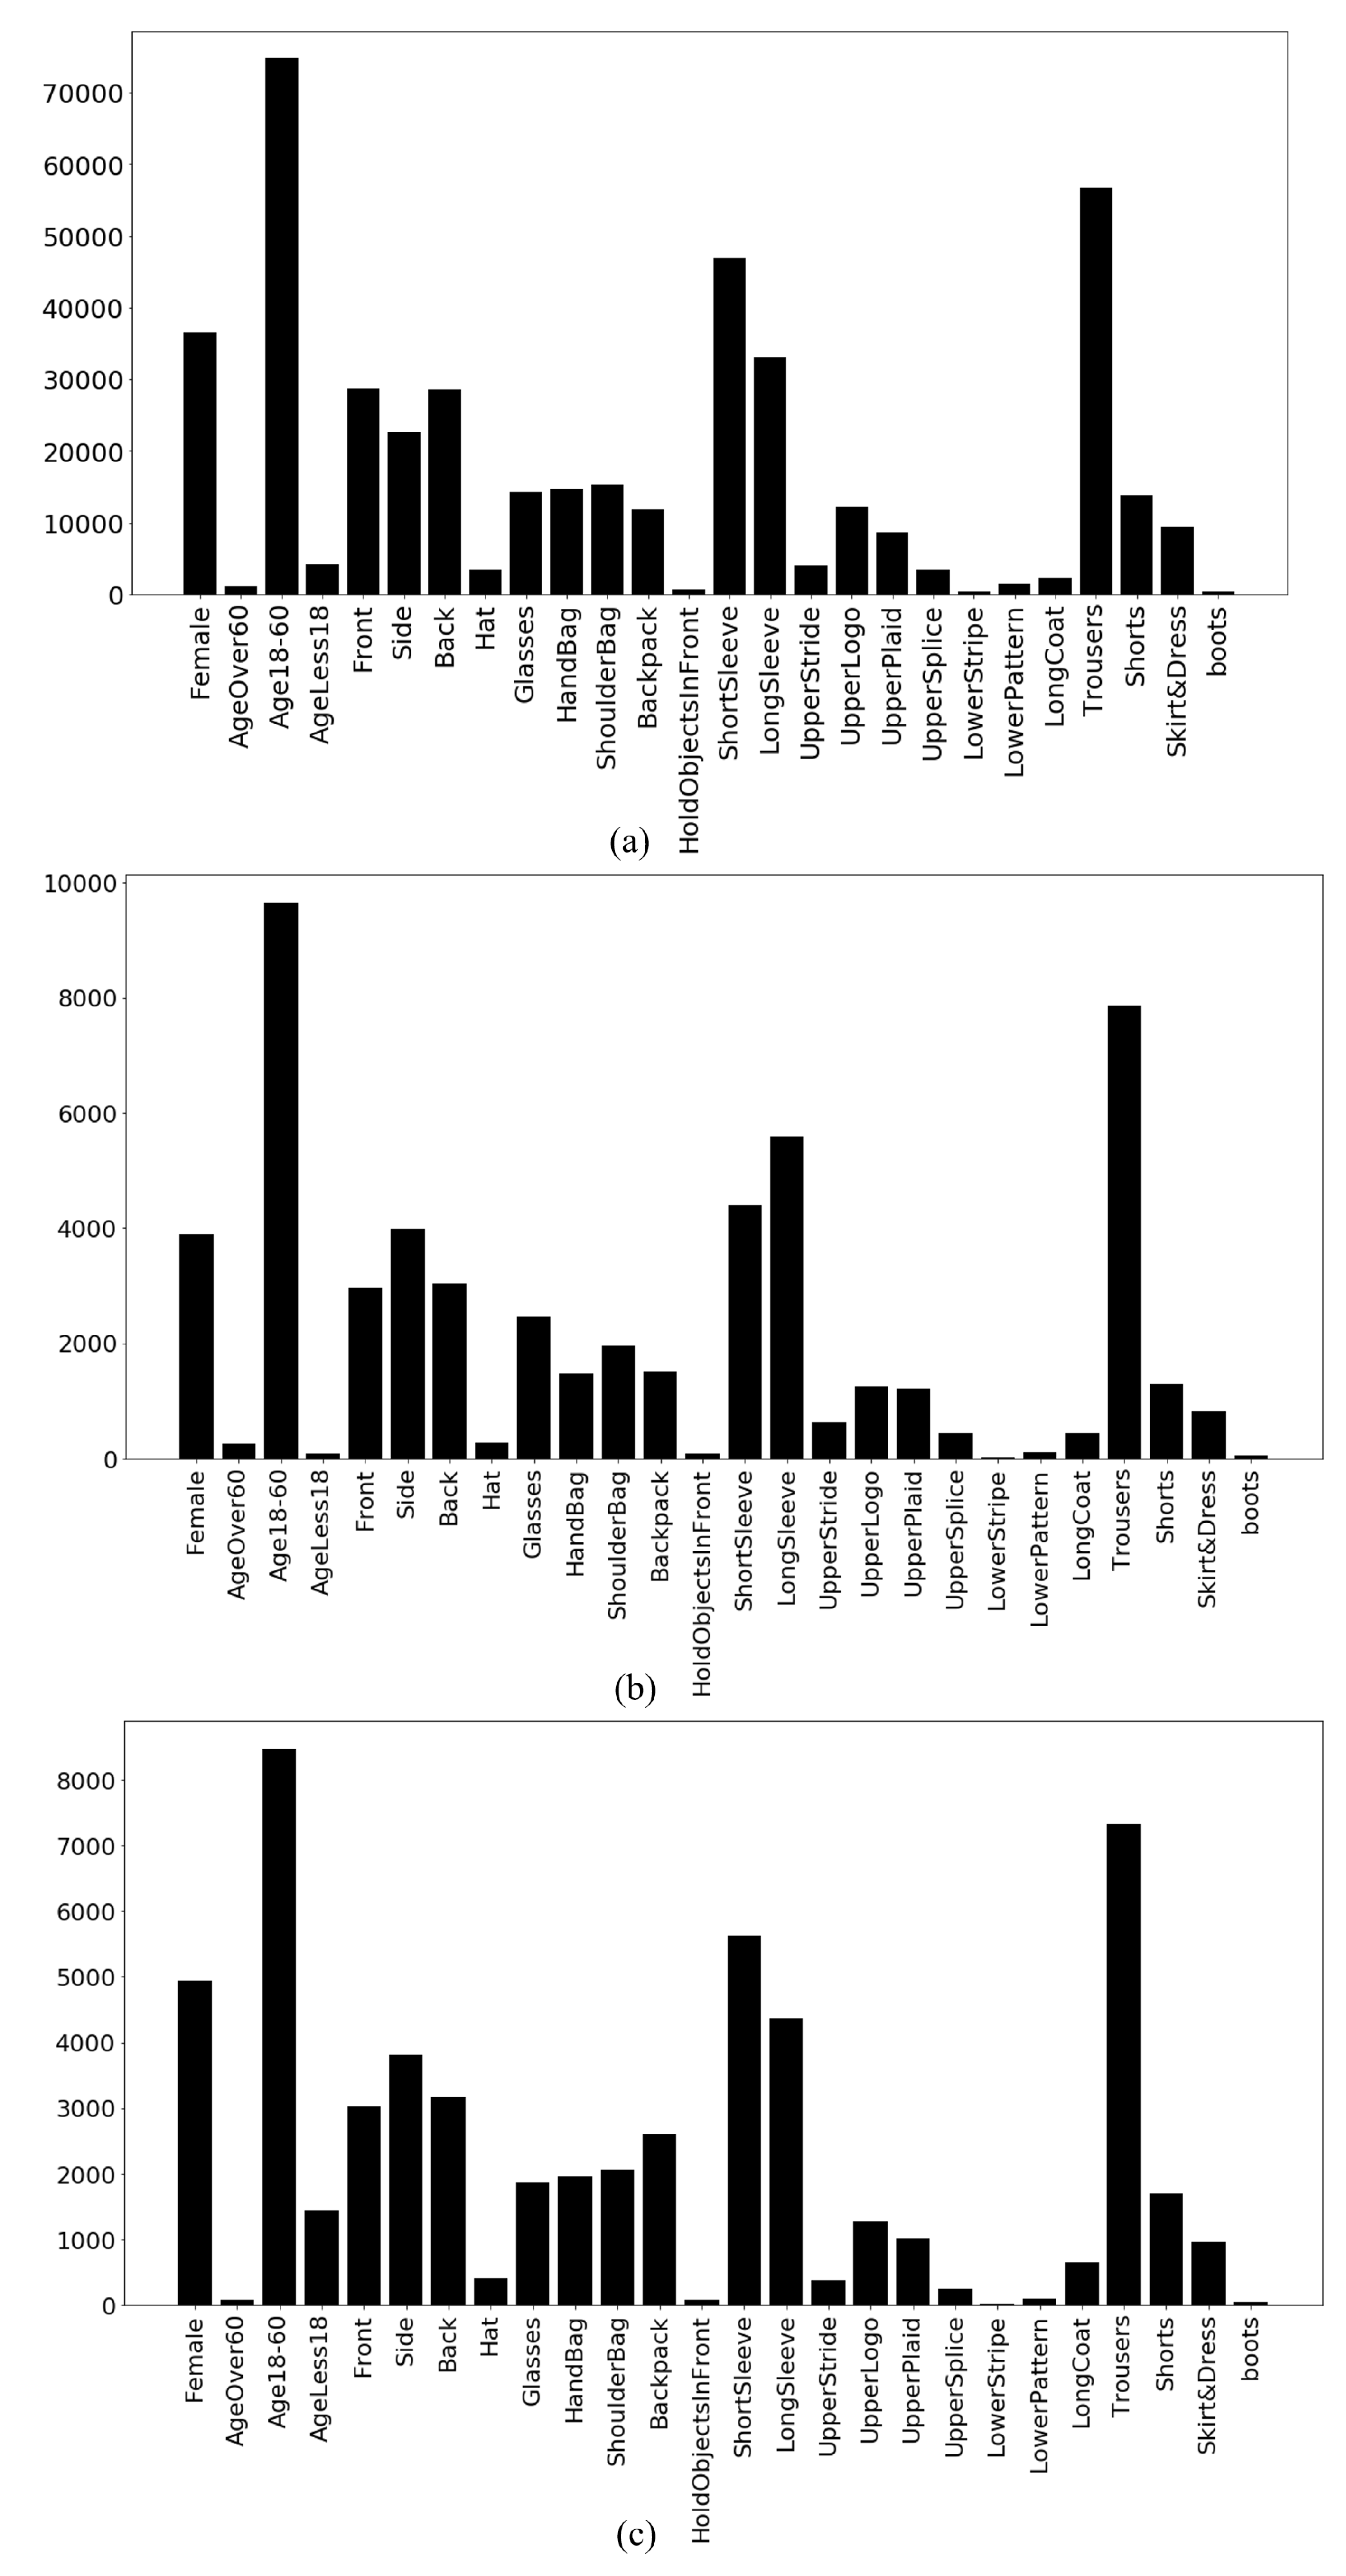
- Analyzing the RAP v2 dataset and applying data balancing techniques, i.e., oversampling.
2. Related Work
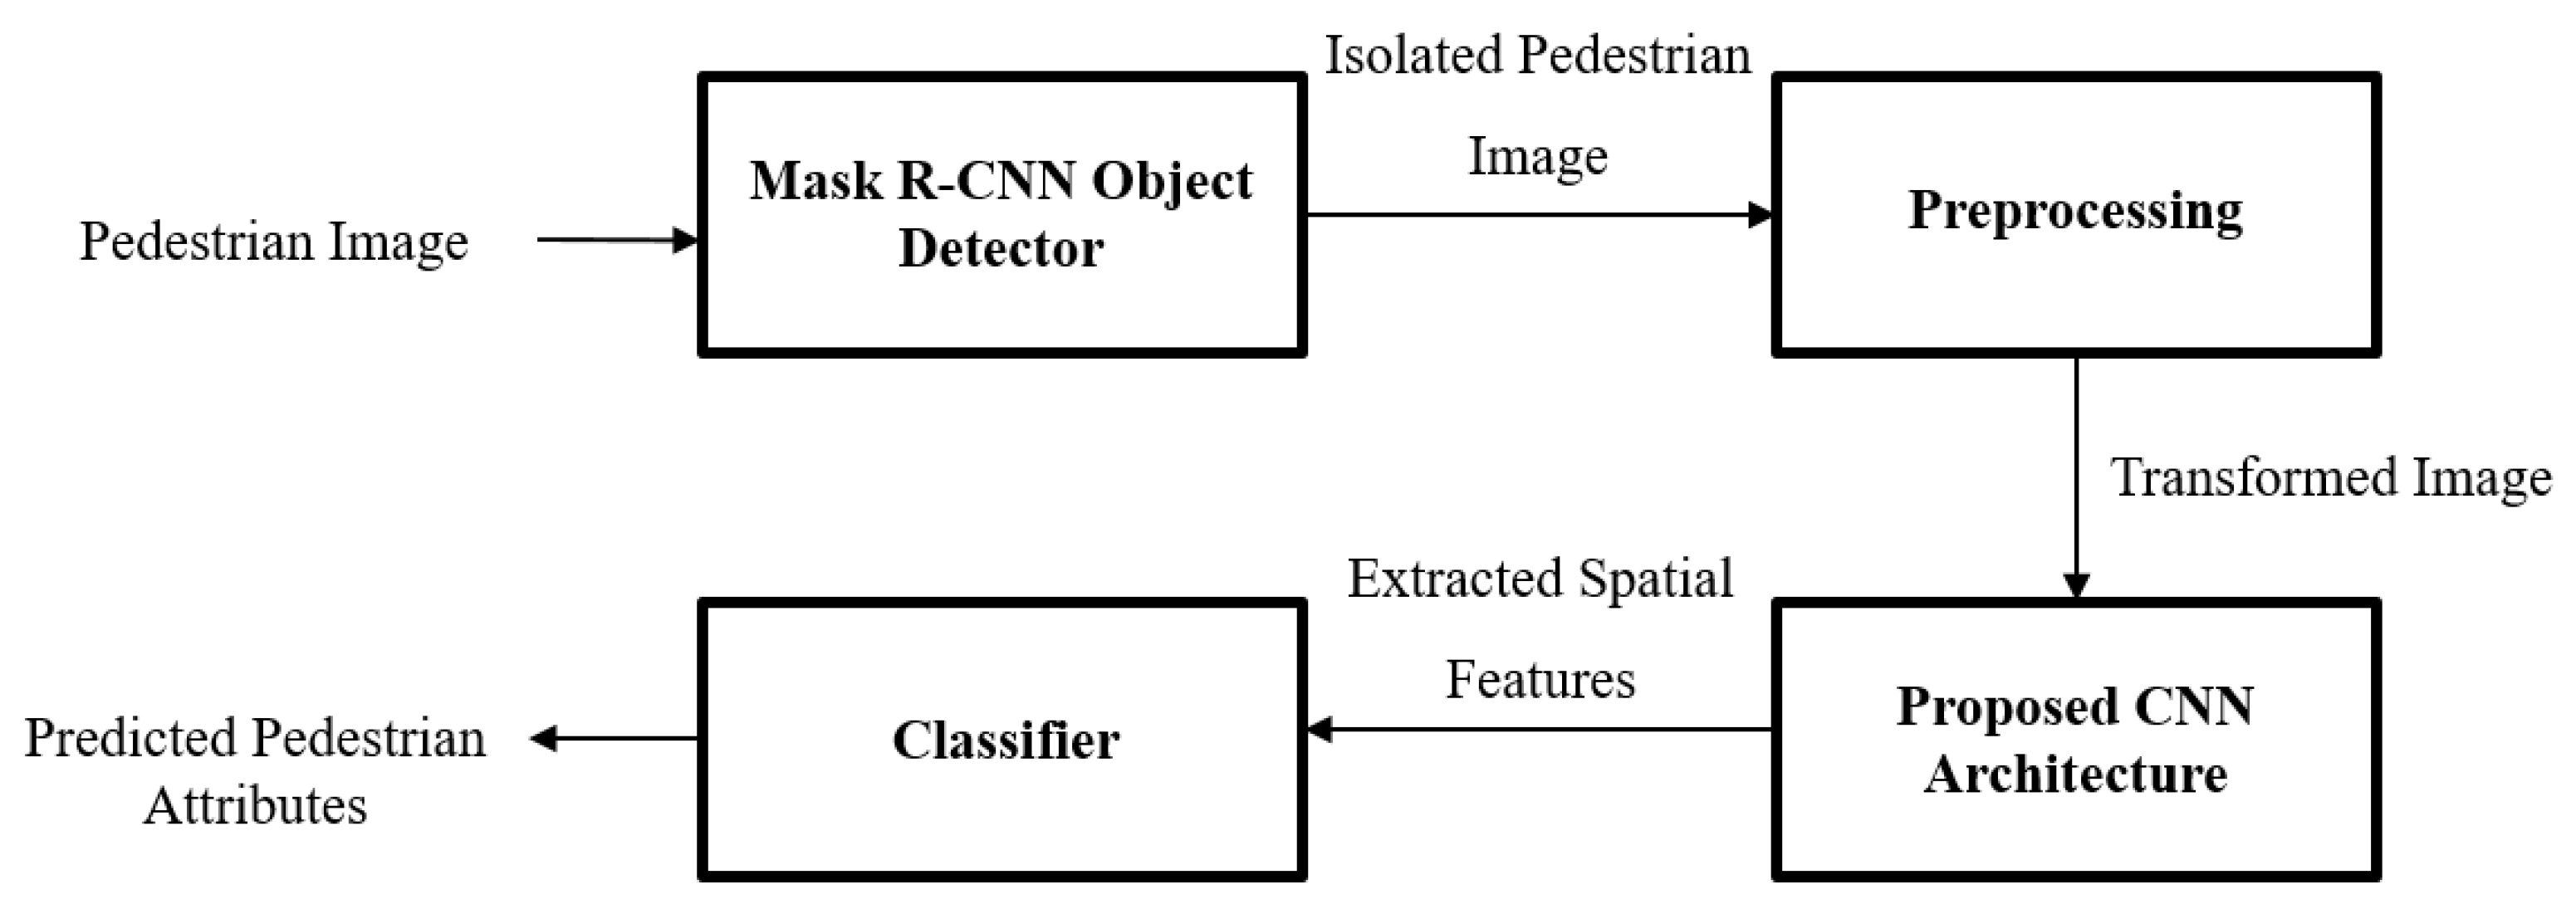
3. Proposed Approach
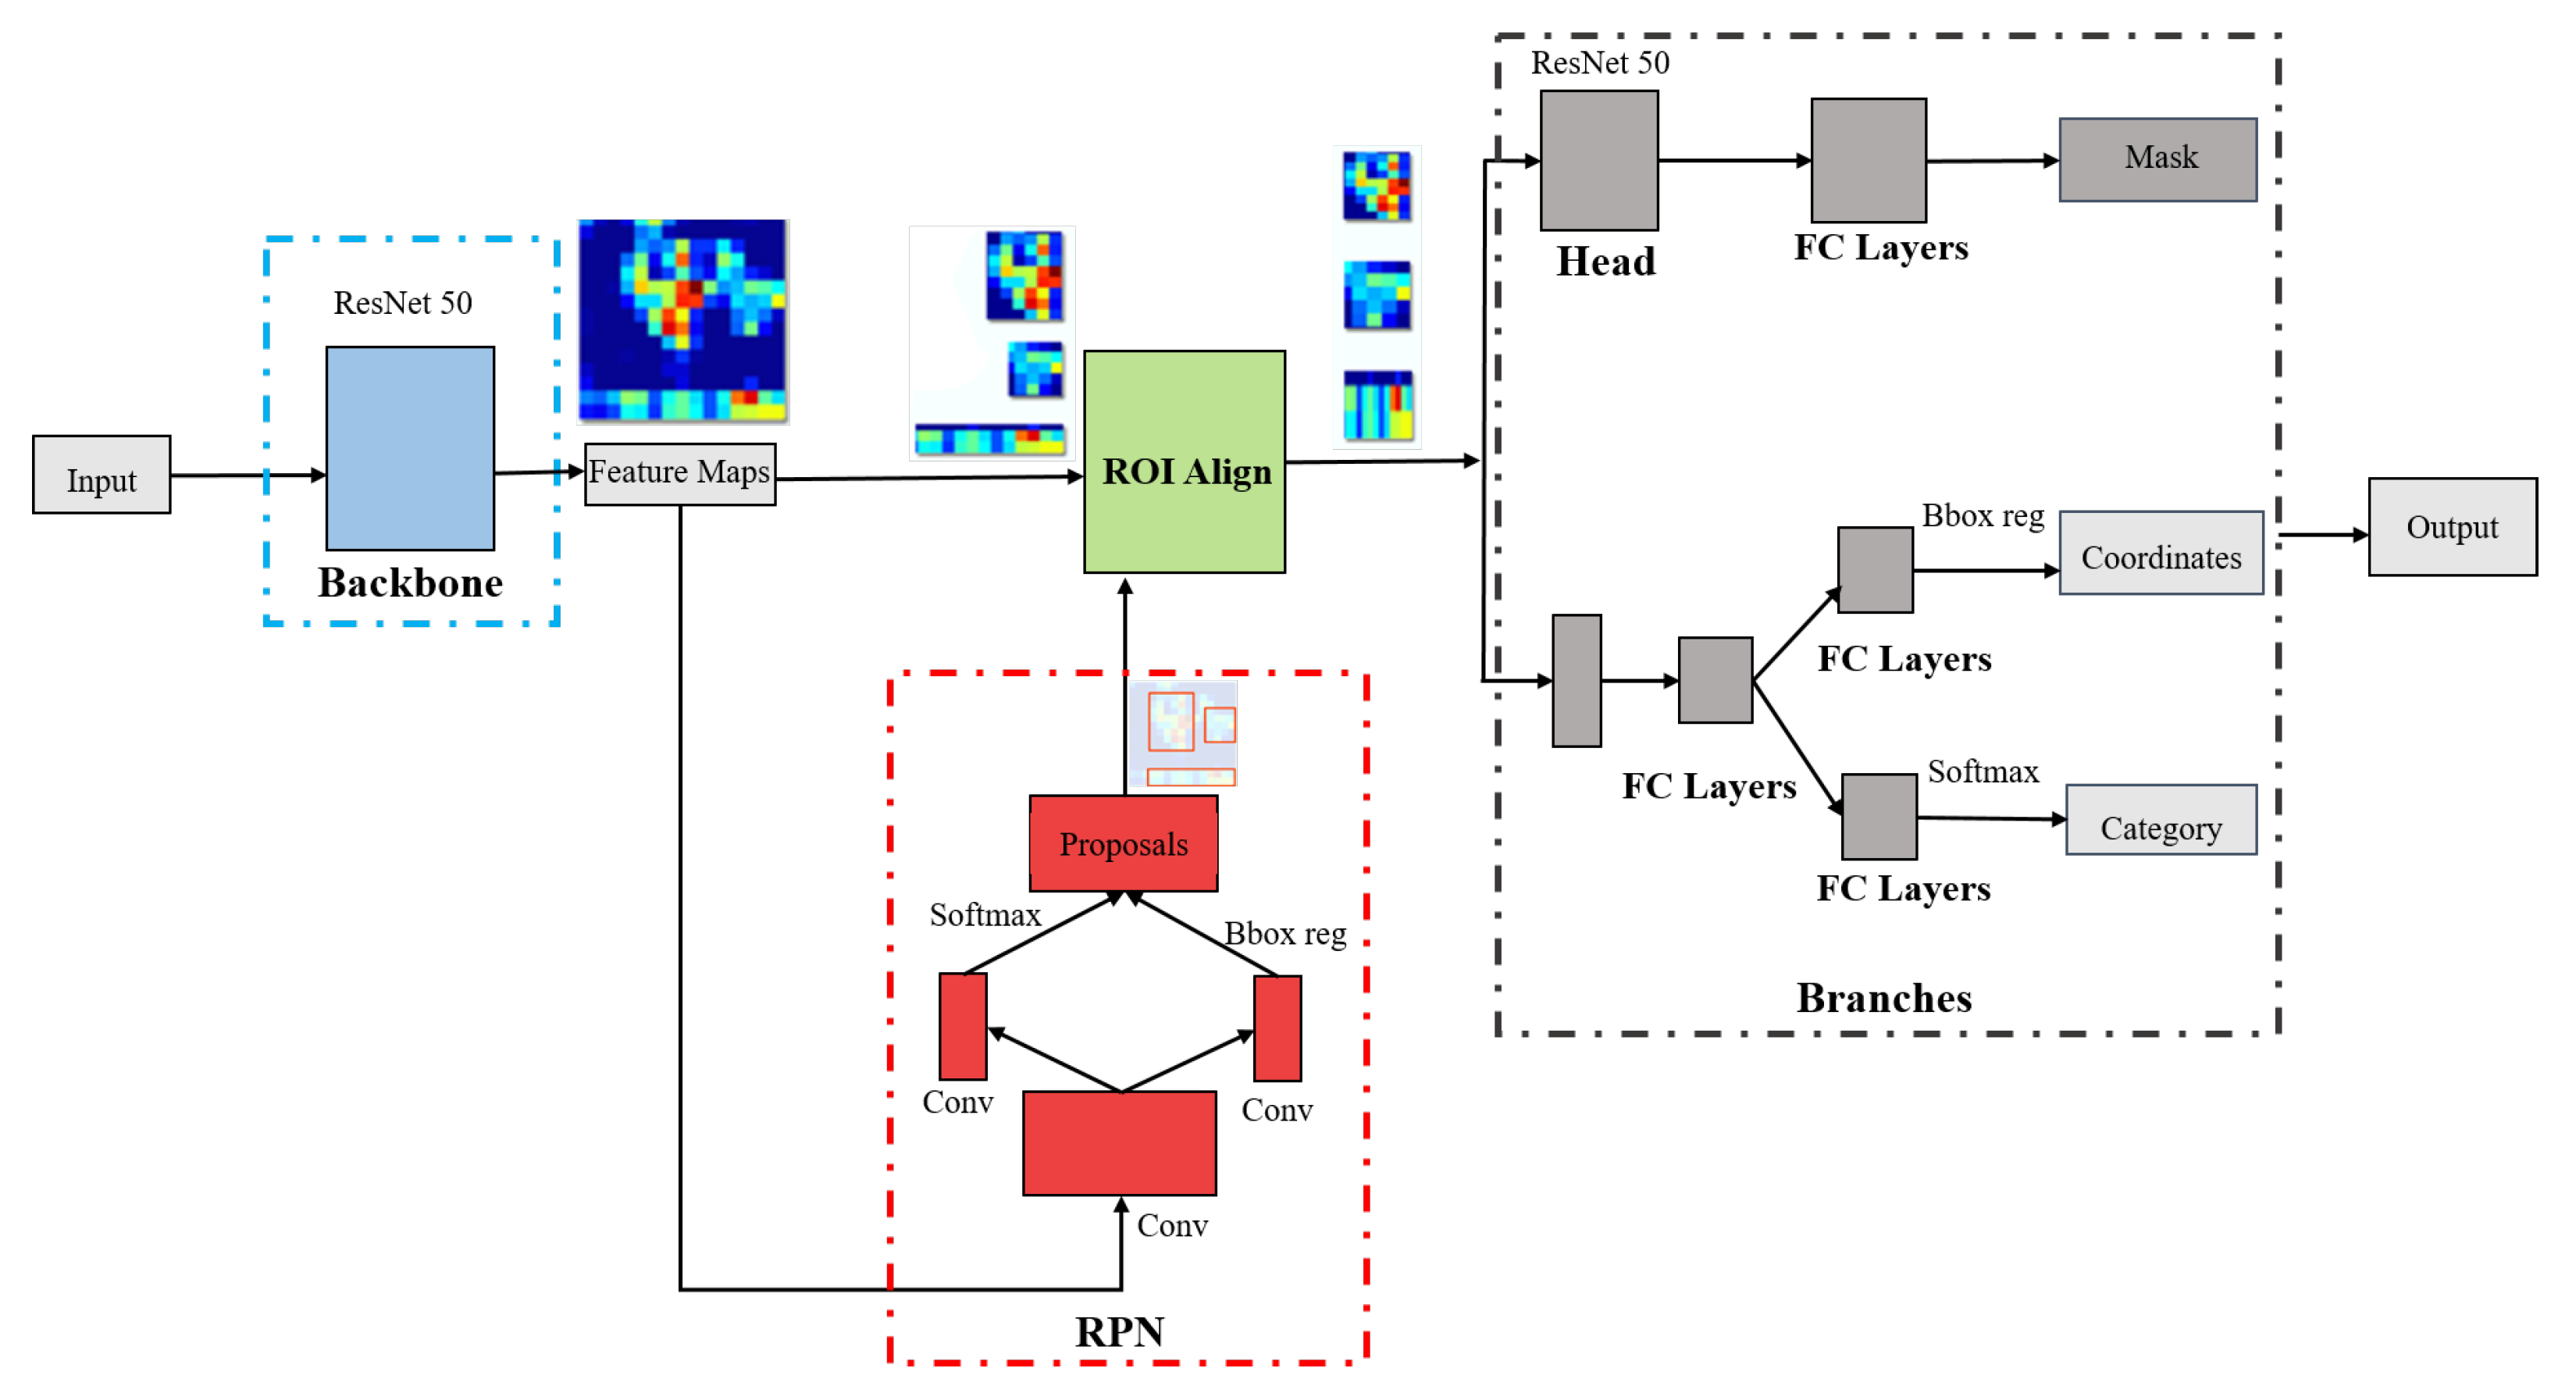
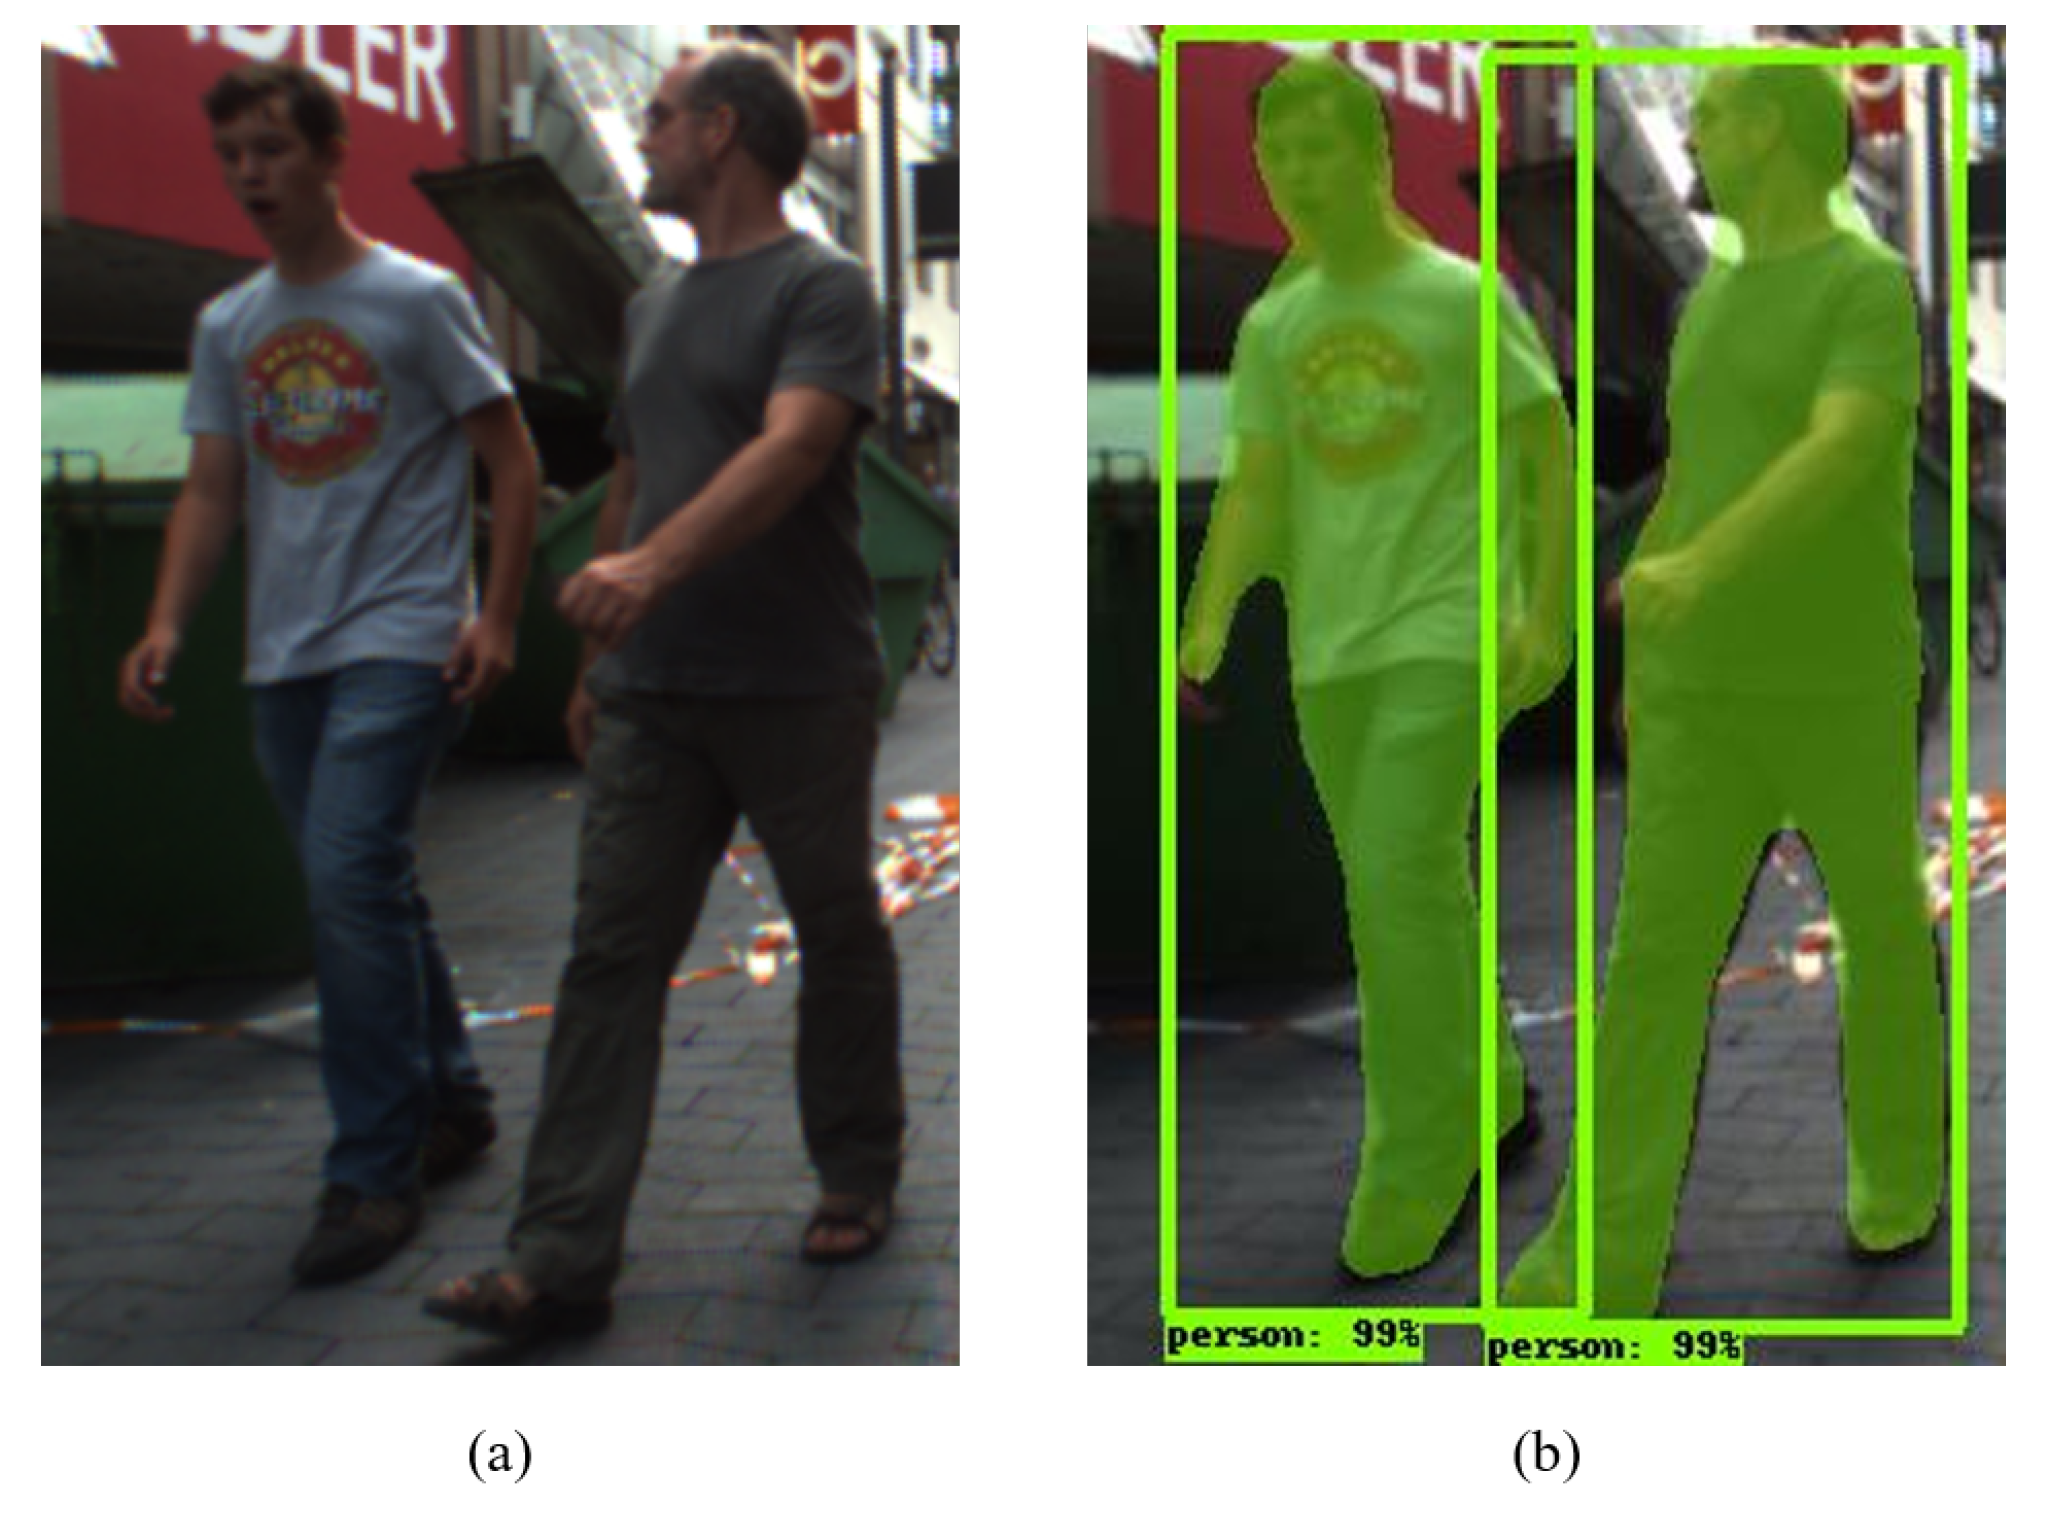
3.1. Mask R-CNN Object Detector
- First Stage
- Backbone: The first stage of Mask R-CNN consists of Backbone and RPN. The Backbone of the Mask R-CNN is responsible for extracting the features of a given input image. ResNet 50 CNN architecture is used in the Backbone to extract the features. The extracted features are passed to the second stage via the ROI layer. Additionally, the features are also forwarded to the RPN network.
- RPN: Region Proposal Network(RPN) is responsible for proposing regions of the location of an object. Several convolution layers are used to predict the probability of an object presence using the softmax function. The bounding box of the objects is also predicted in the RPN. The RPN provides the objects to the ROI align layer, passing the individual objects to the second stage.
- Second Stage
- Branches: The objects from the ROI align layers are passed to the Branches stage. This stage has three parts, i.e., Mask, Coordinates, Category. The Mask part provides the masked regions of an object. Similarly, the Coordinate part provides the object’s bounding box, and the Category part provides the object’s class name.
3.2. Preprocessing
3.3. Spatial Feature Extraction
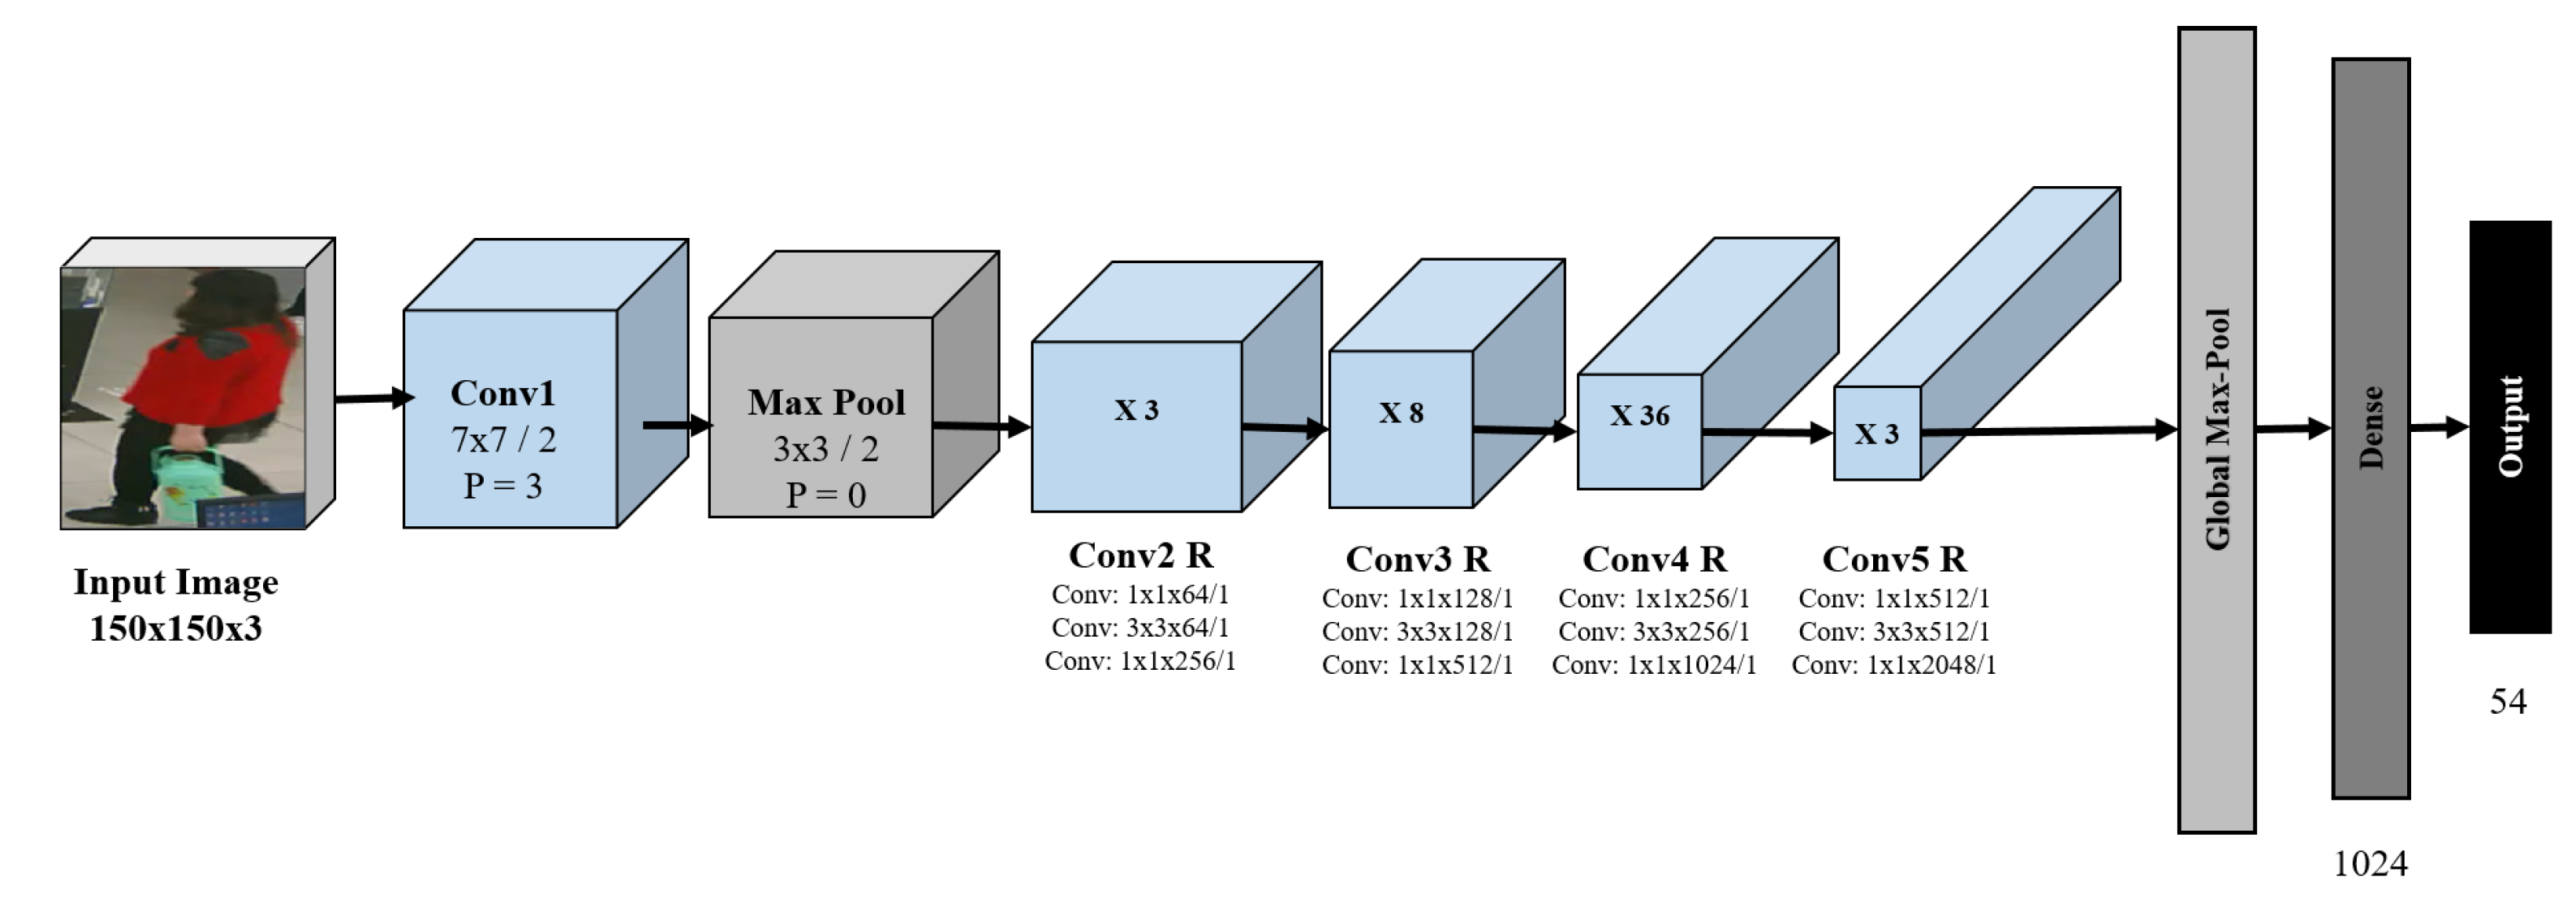
3.4. Transfer Learning Approach
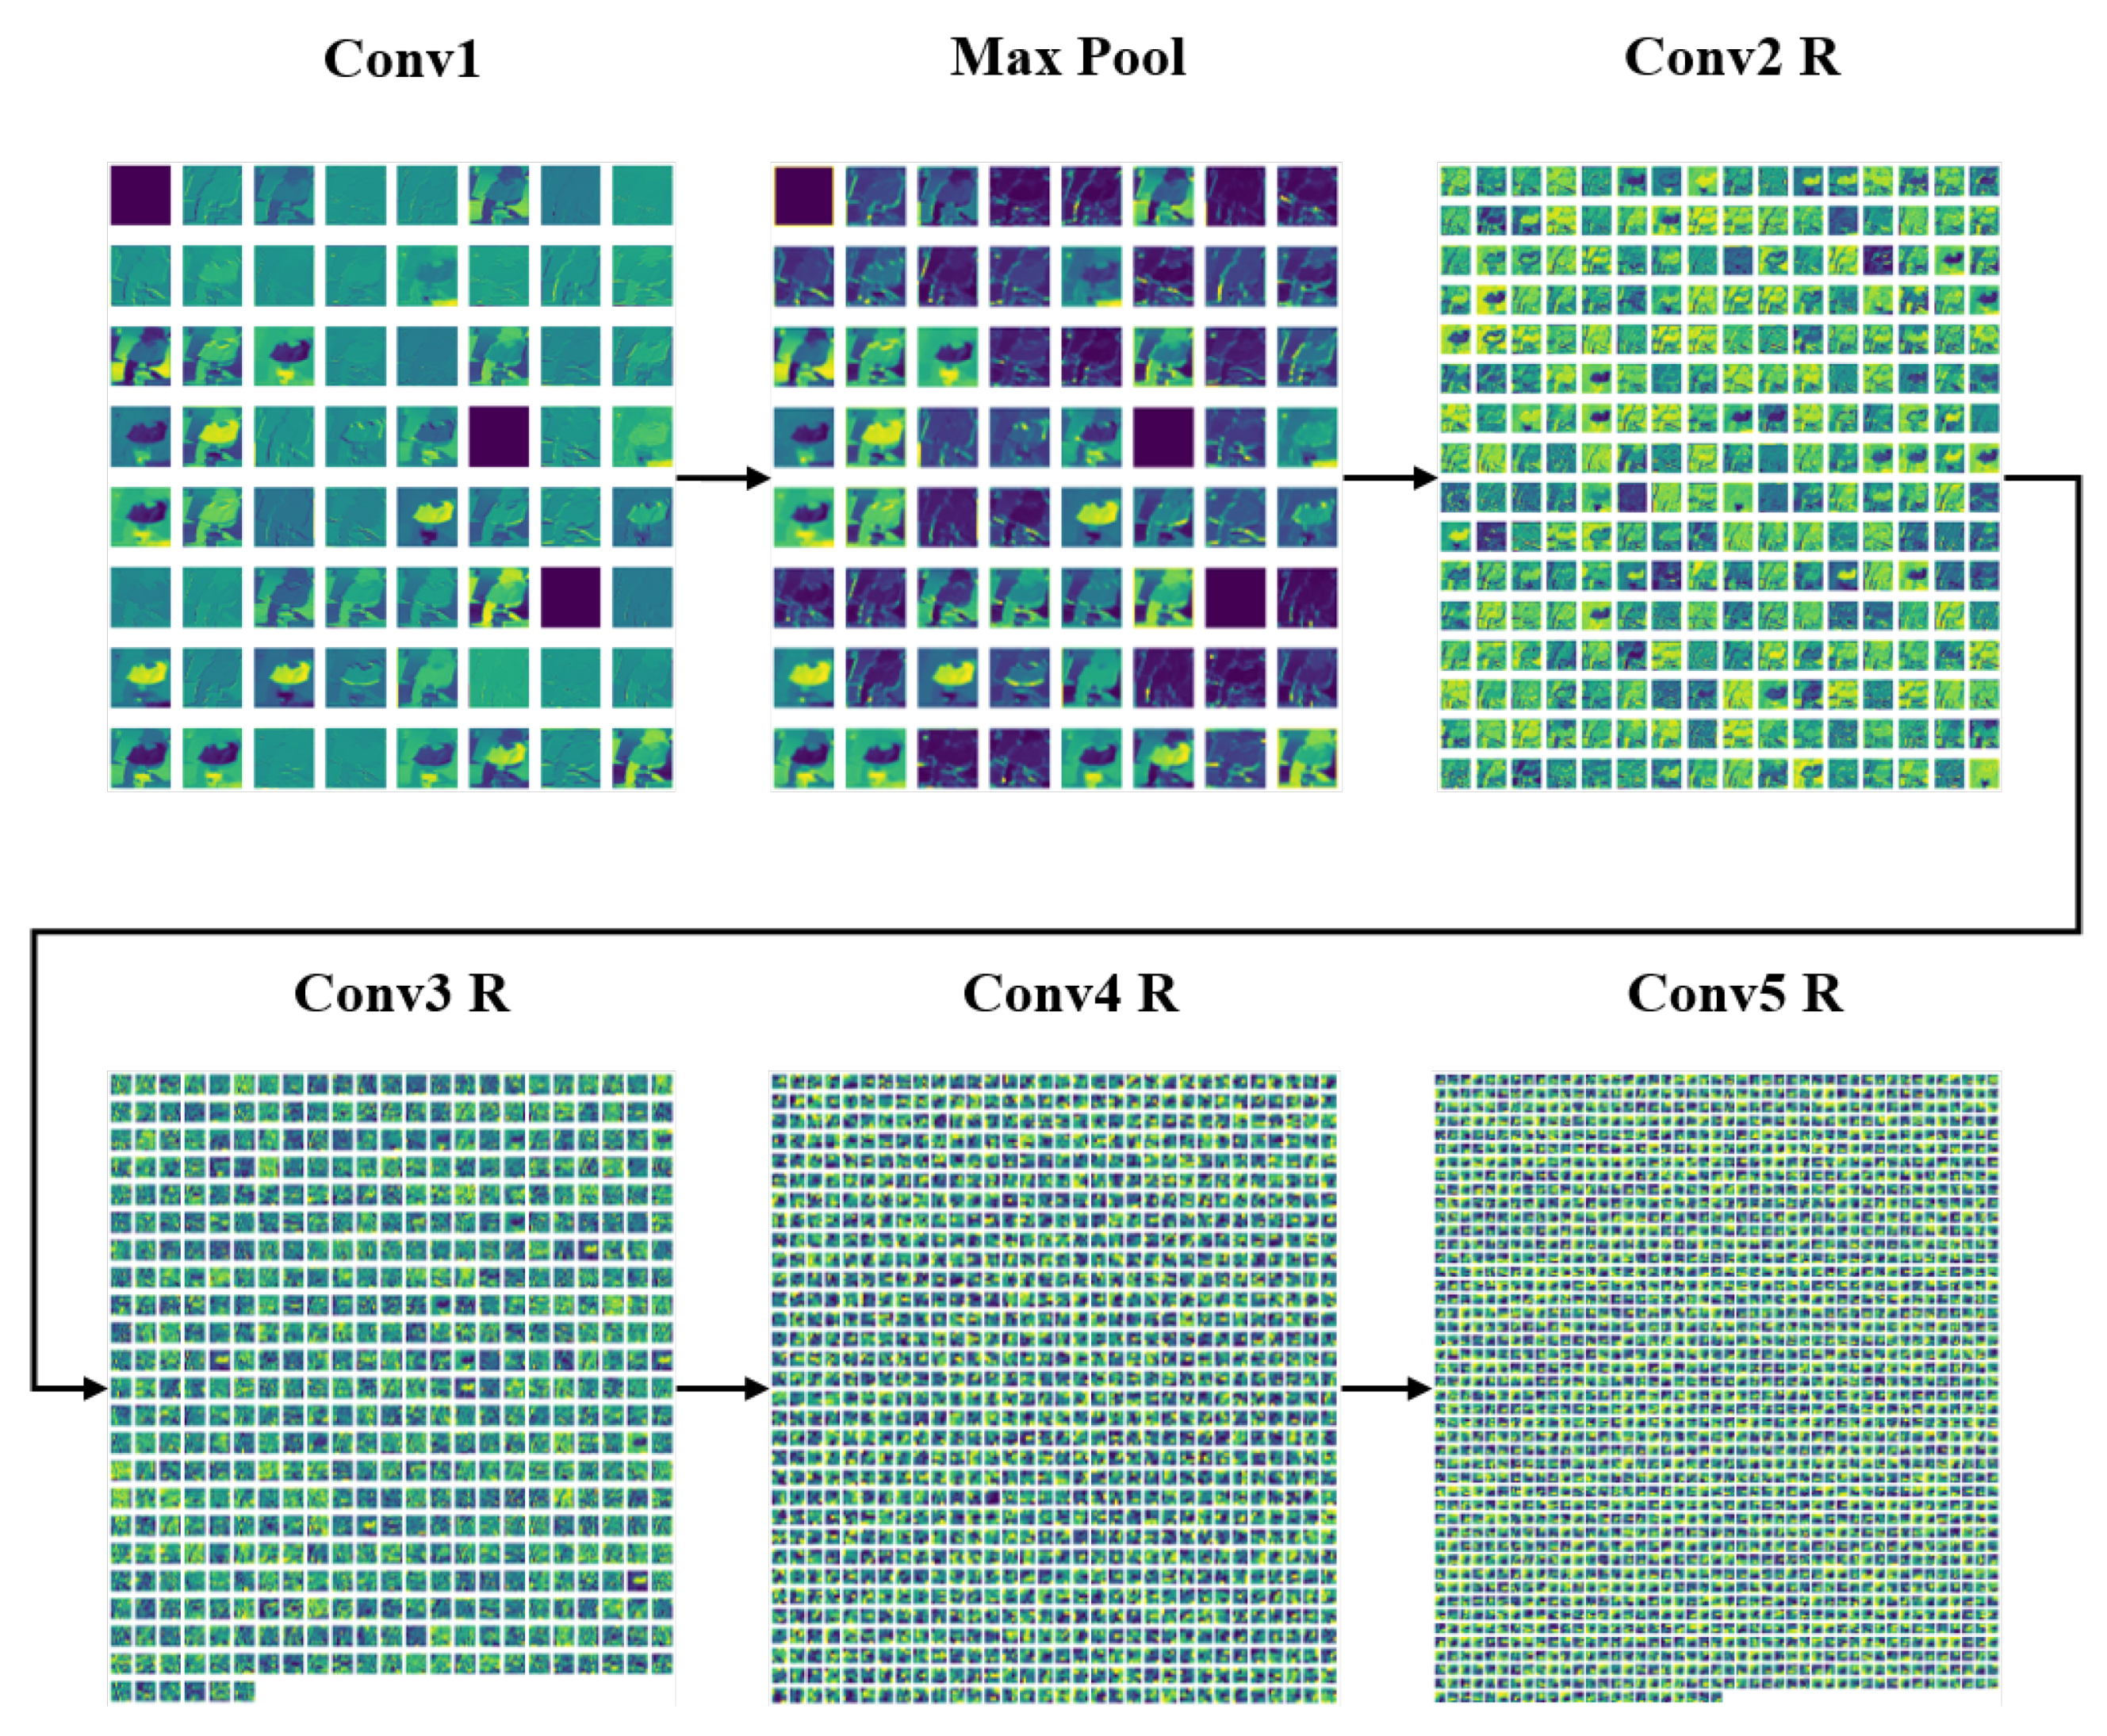
- Conv1: It is the first block of ResNet 152 architecture. The kernel size is which reduces the feature map. The purpose of this block is to reduce image size.
- Max Pool: To extract the dominant features, initially, a max pool operation is performed. As a result, the feature map becomes smaller.
- Conv R: Several blocks, i.e., Conv2 R, Conv3 R, Conv4 R, Conv5 R with residual connections are shown in Figure 5. Each block has a series of convolution layers with an increasing number of channels. The convolution layer has a residual connection among them. This connection aims to make the network learn from its early layers so that the knowledge is not forgotten. The increasing number of channels indicates that the feature map gradually decreases and captures the dominant spatial features.
3.5. Classification
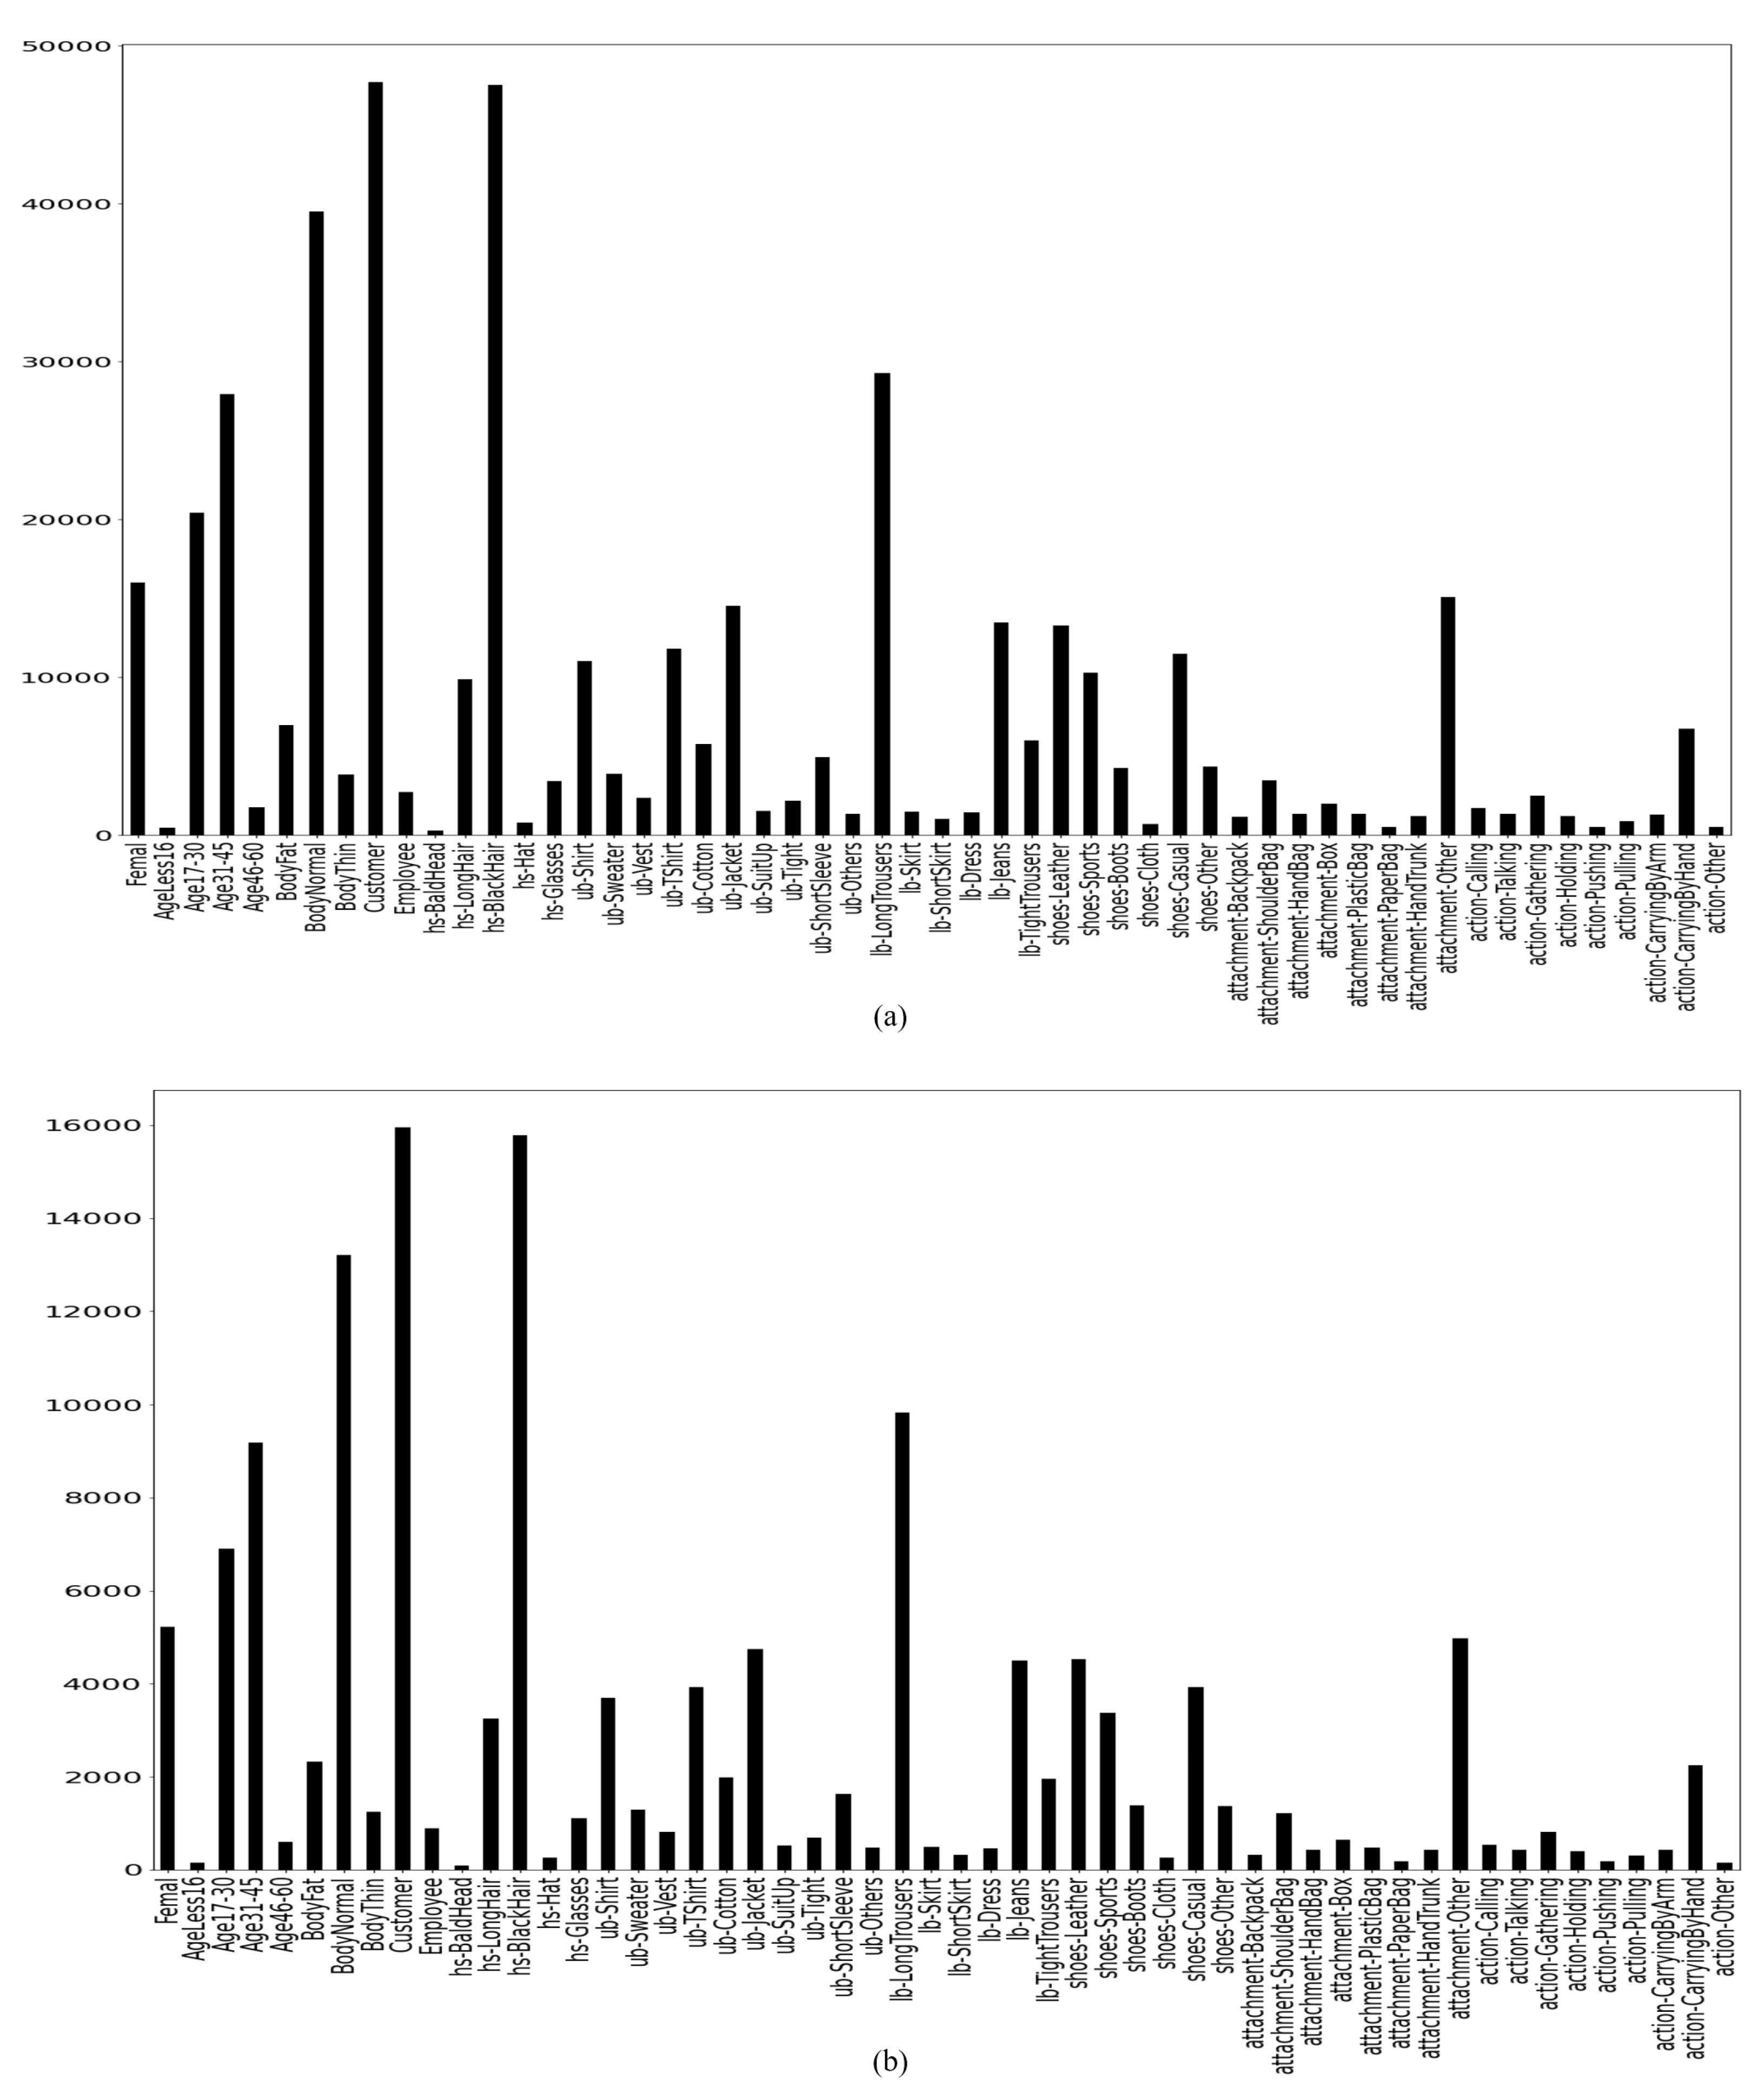
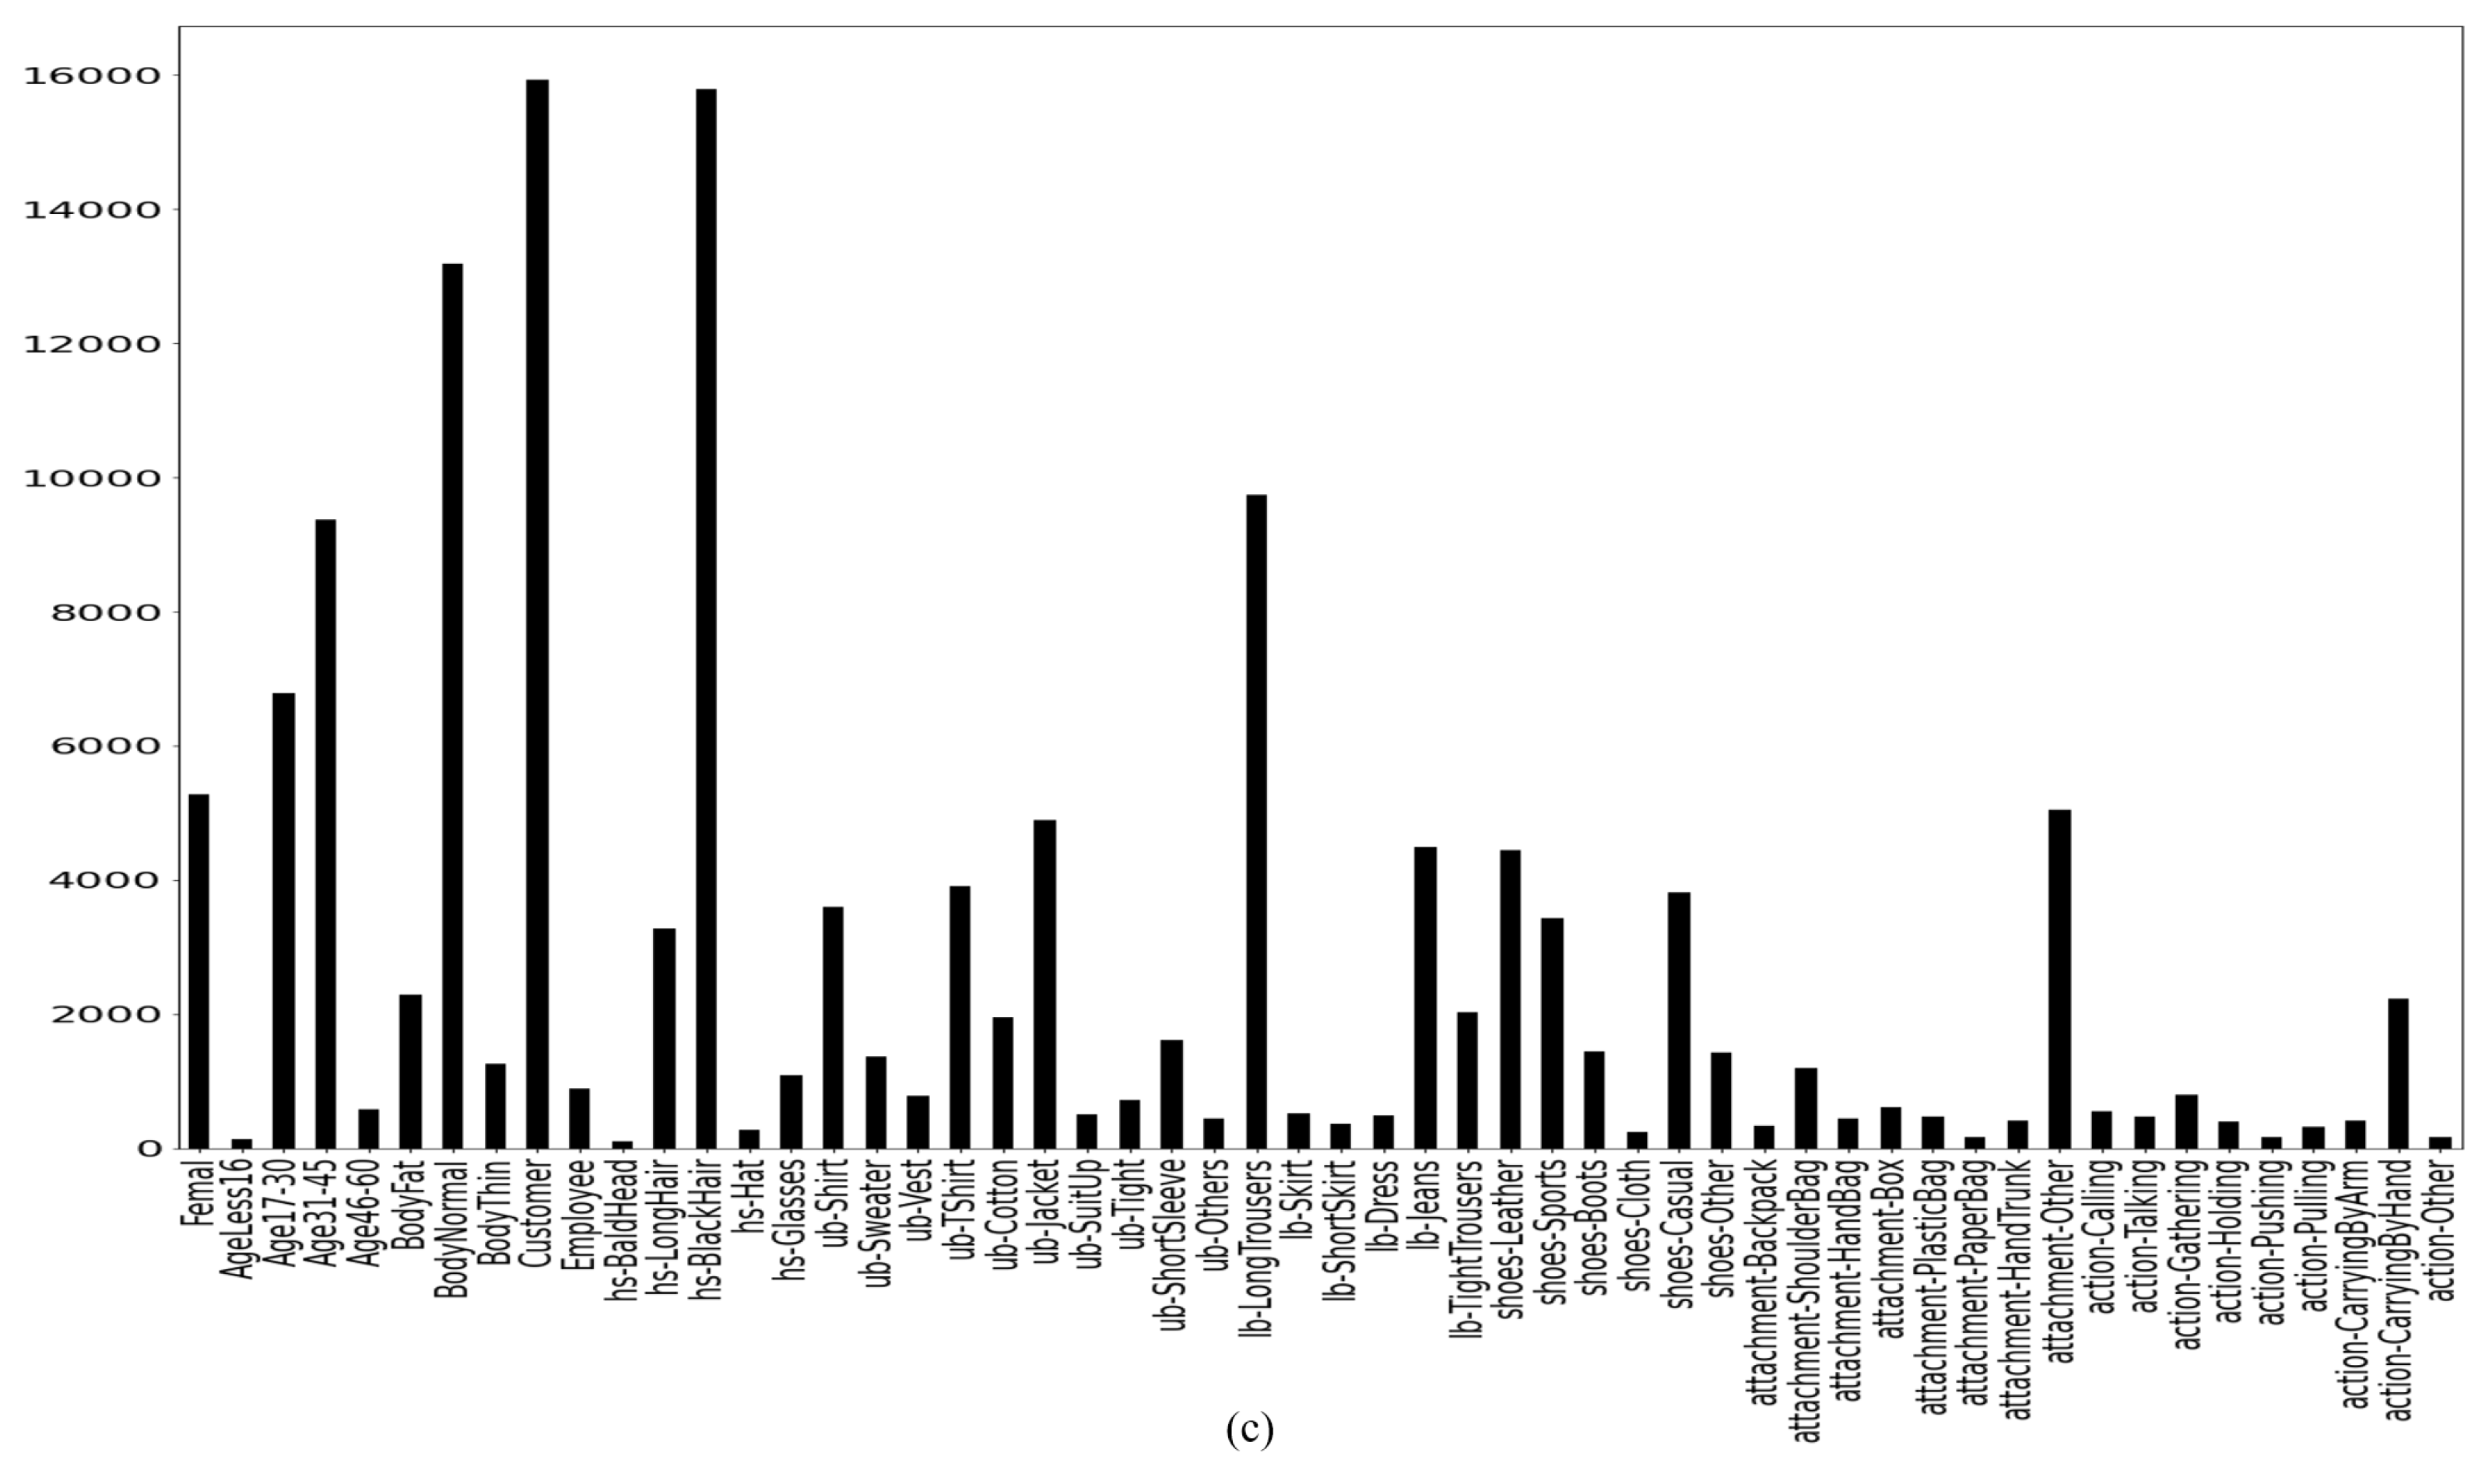
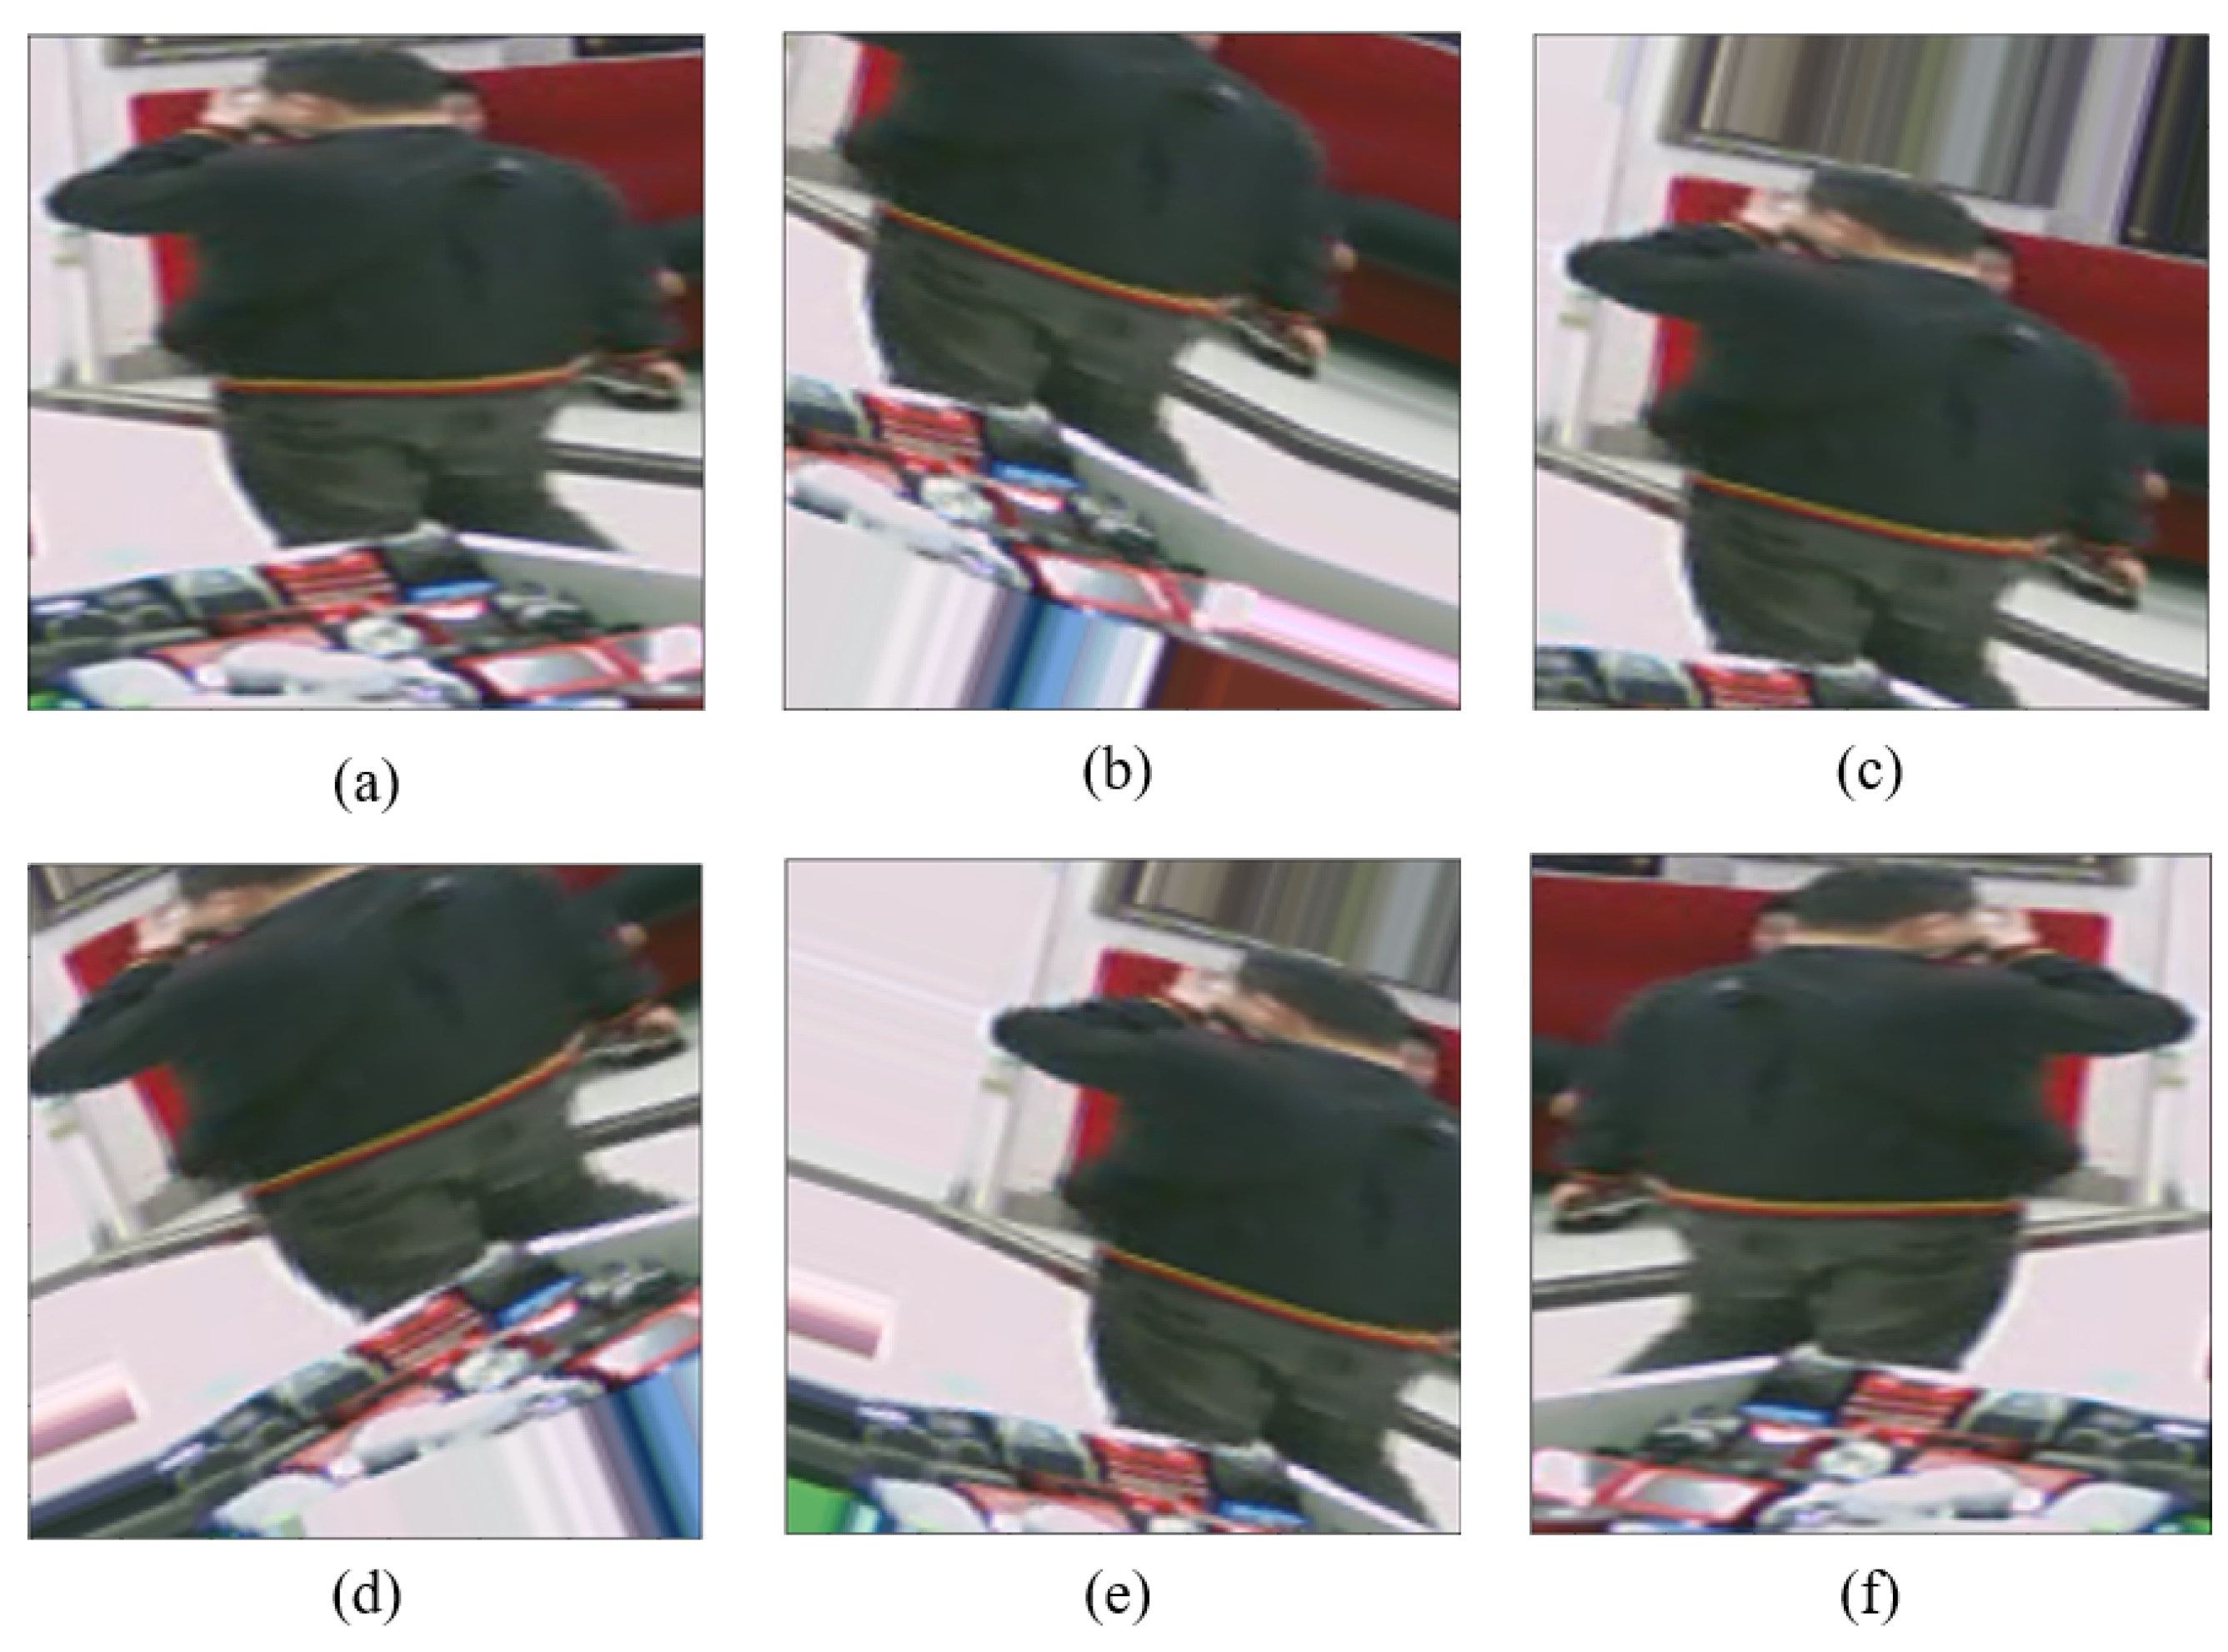
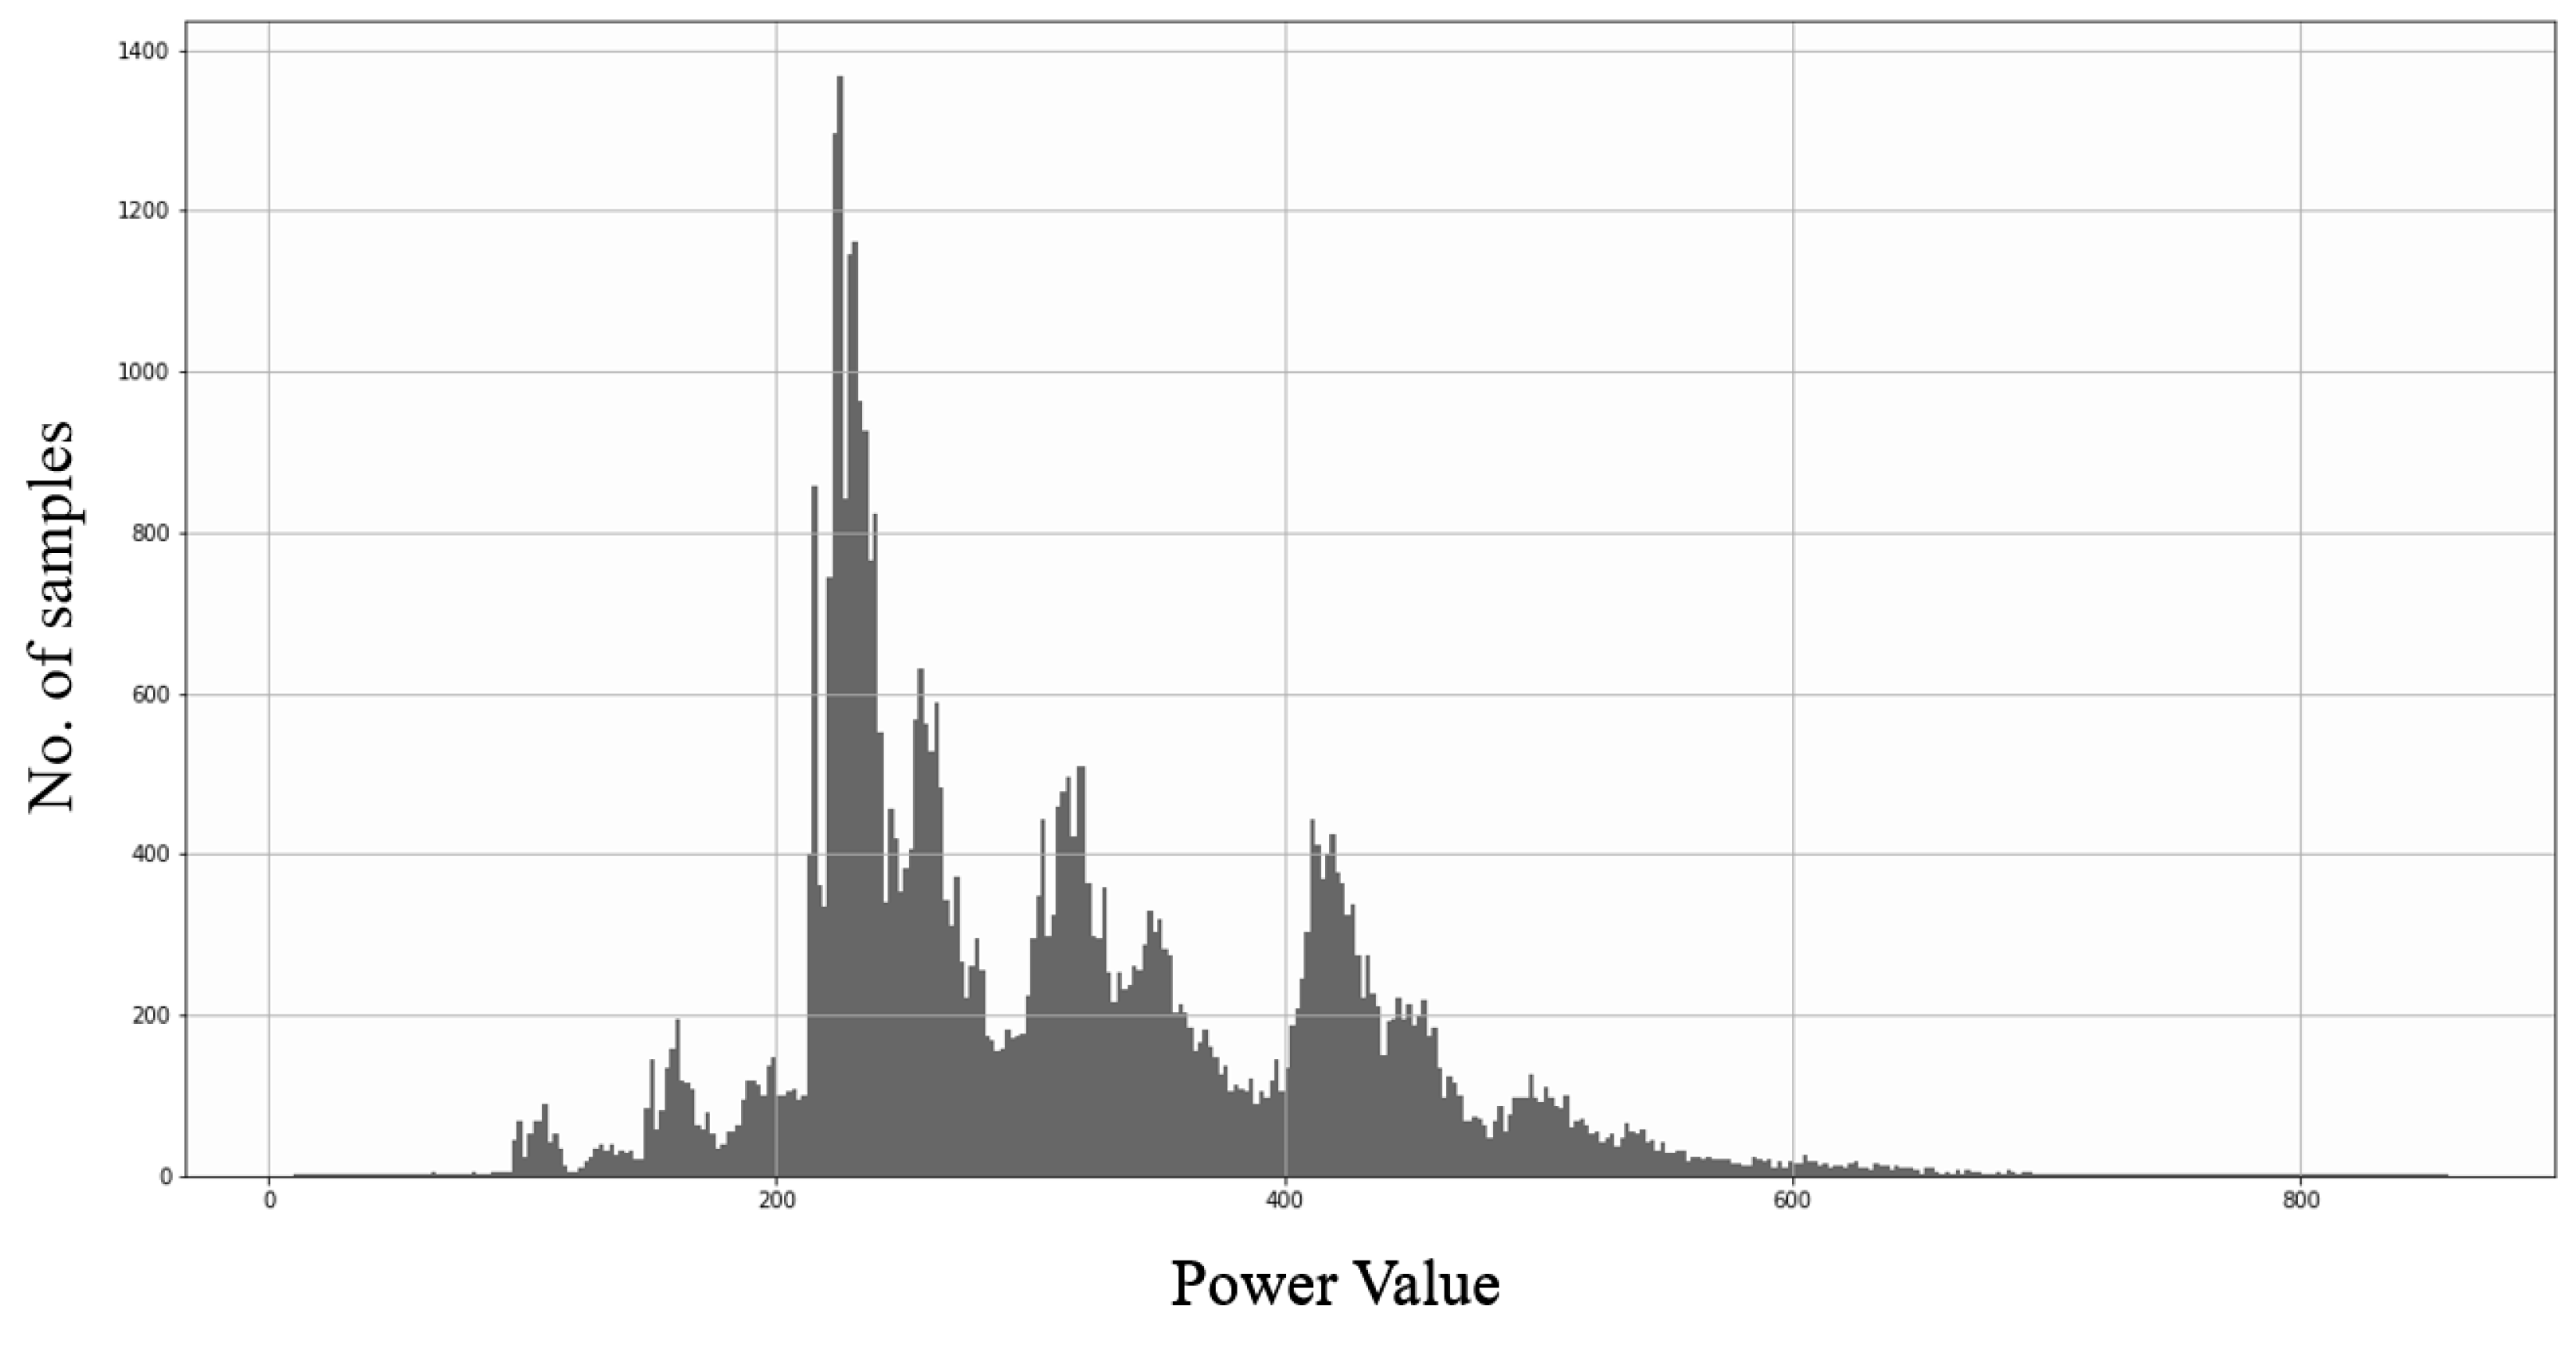
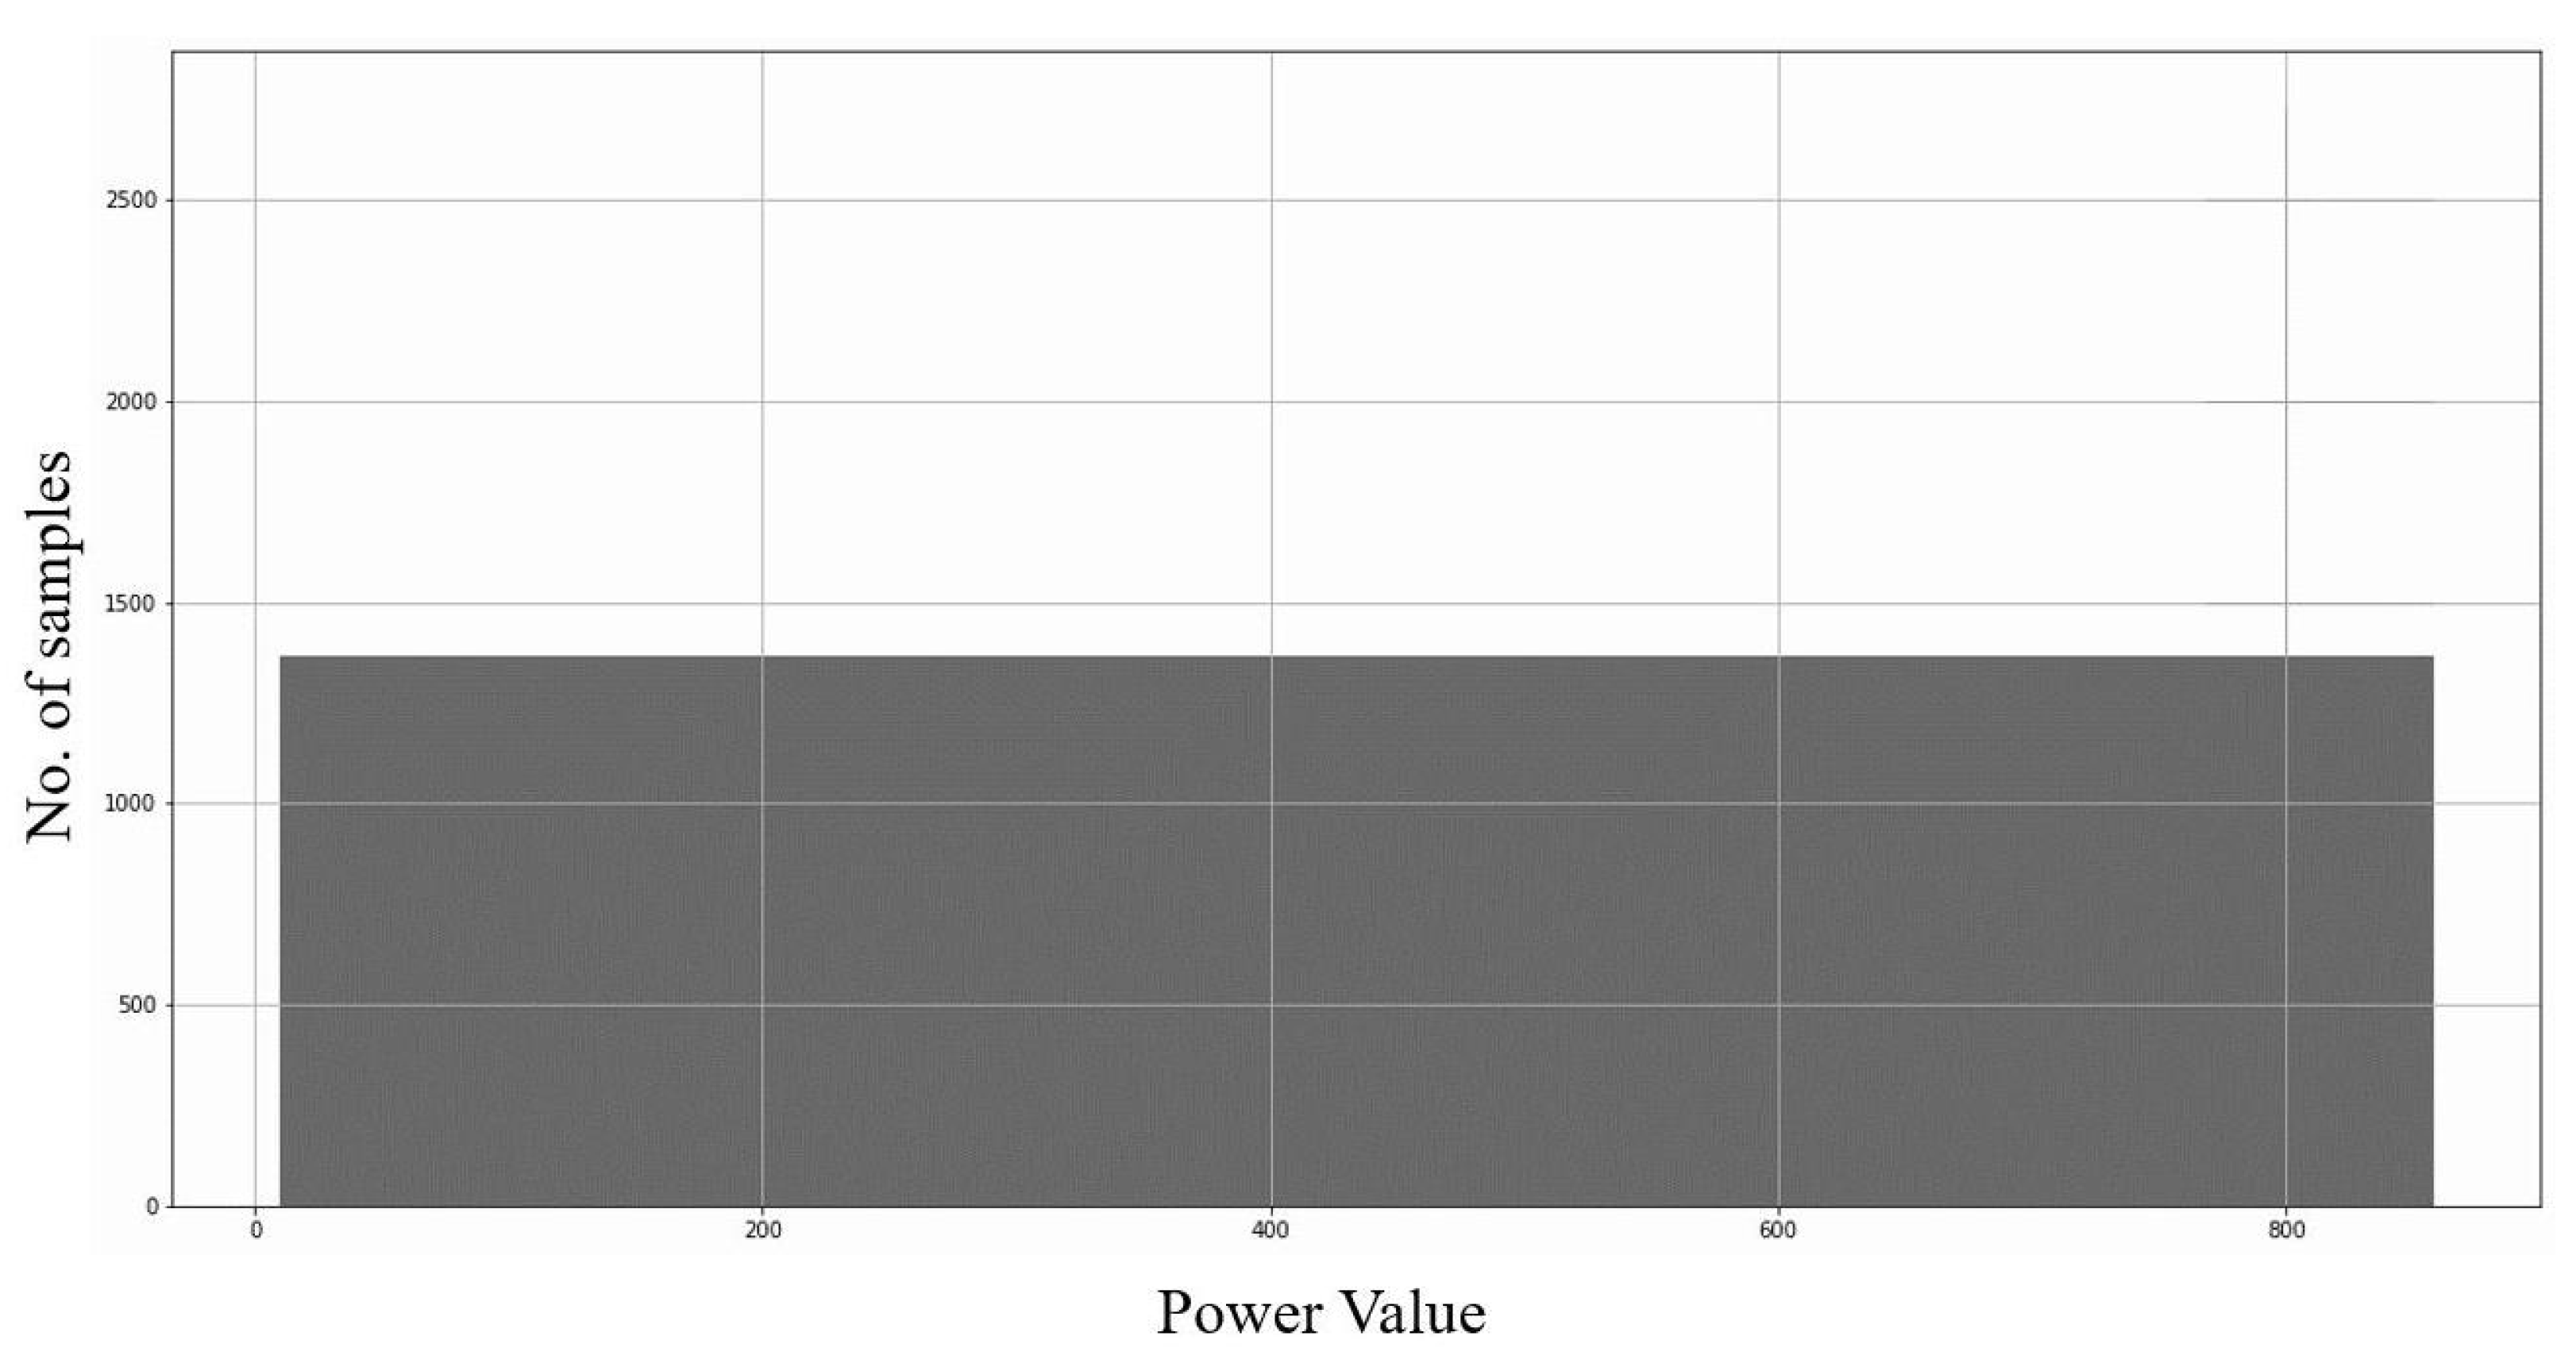
3.6. Data Oversampling
- Give every data a power value;
- Find the frequency of power values;
- Take the max power value;
- For each power value:
- –
- Get size of data = (max power value − power value);
- –
- Take a random copy from the dataset with the same power value;
- –
- Add it with the amount of size of data in the original dataset.
3.7. Weighted Binary Cross-Entropy Loss
- For each attribute:
- –
- Compute positive weight, = Total data size/2 × Total Positive Samples.
- –
- Compute negative weight, = Total data size/2 × Total Negative Samples.
- Apply the weights to the following loss function in (4):where, represents the actual class and is the probability of that class.
4. Experiments
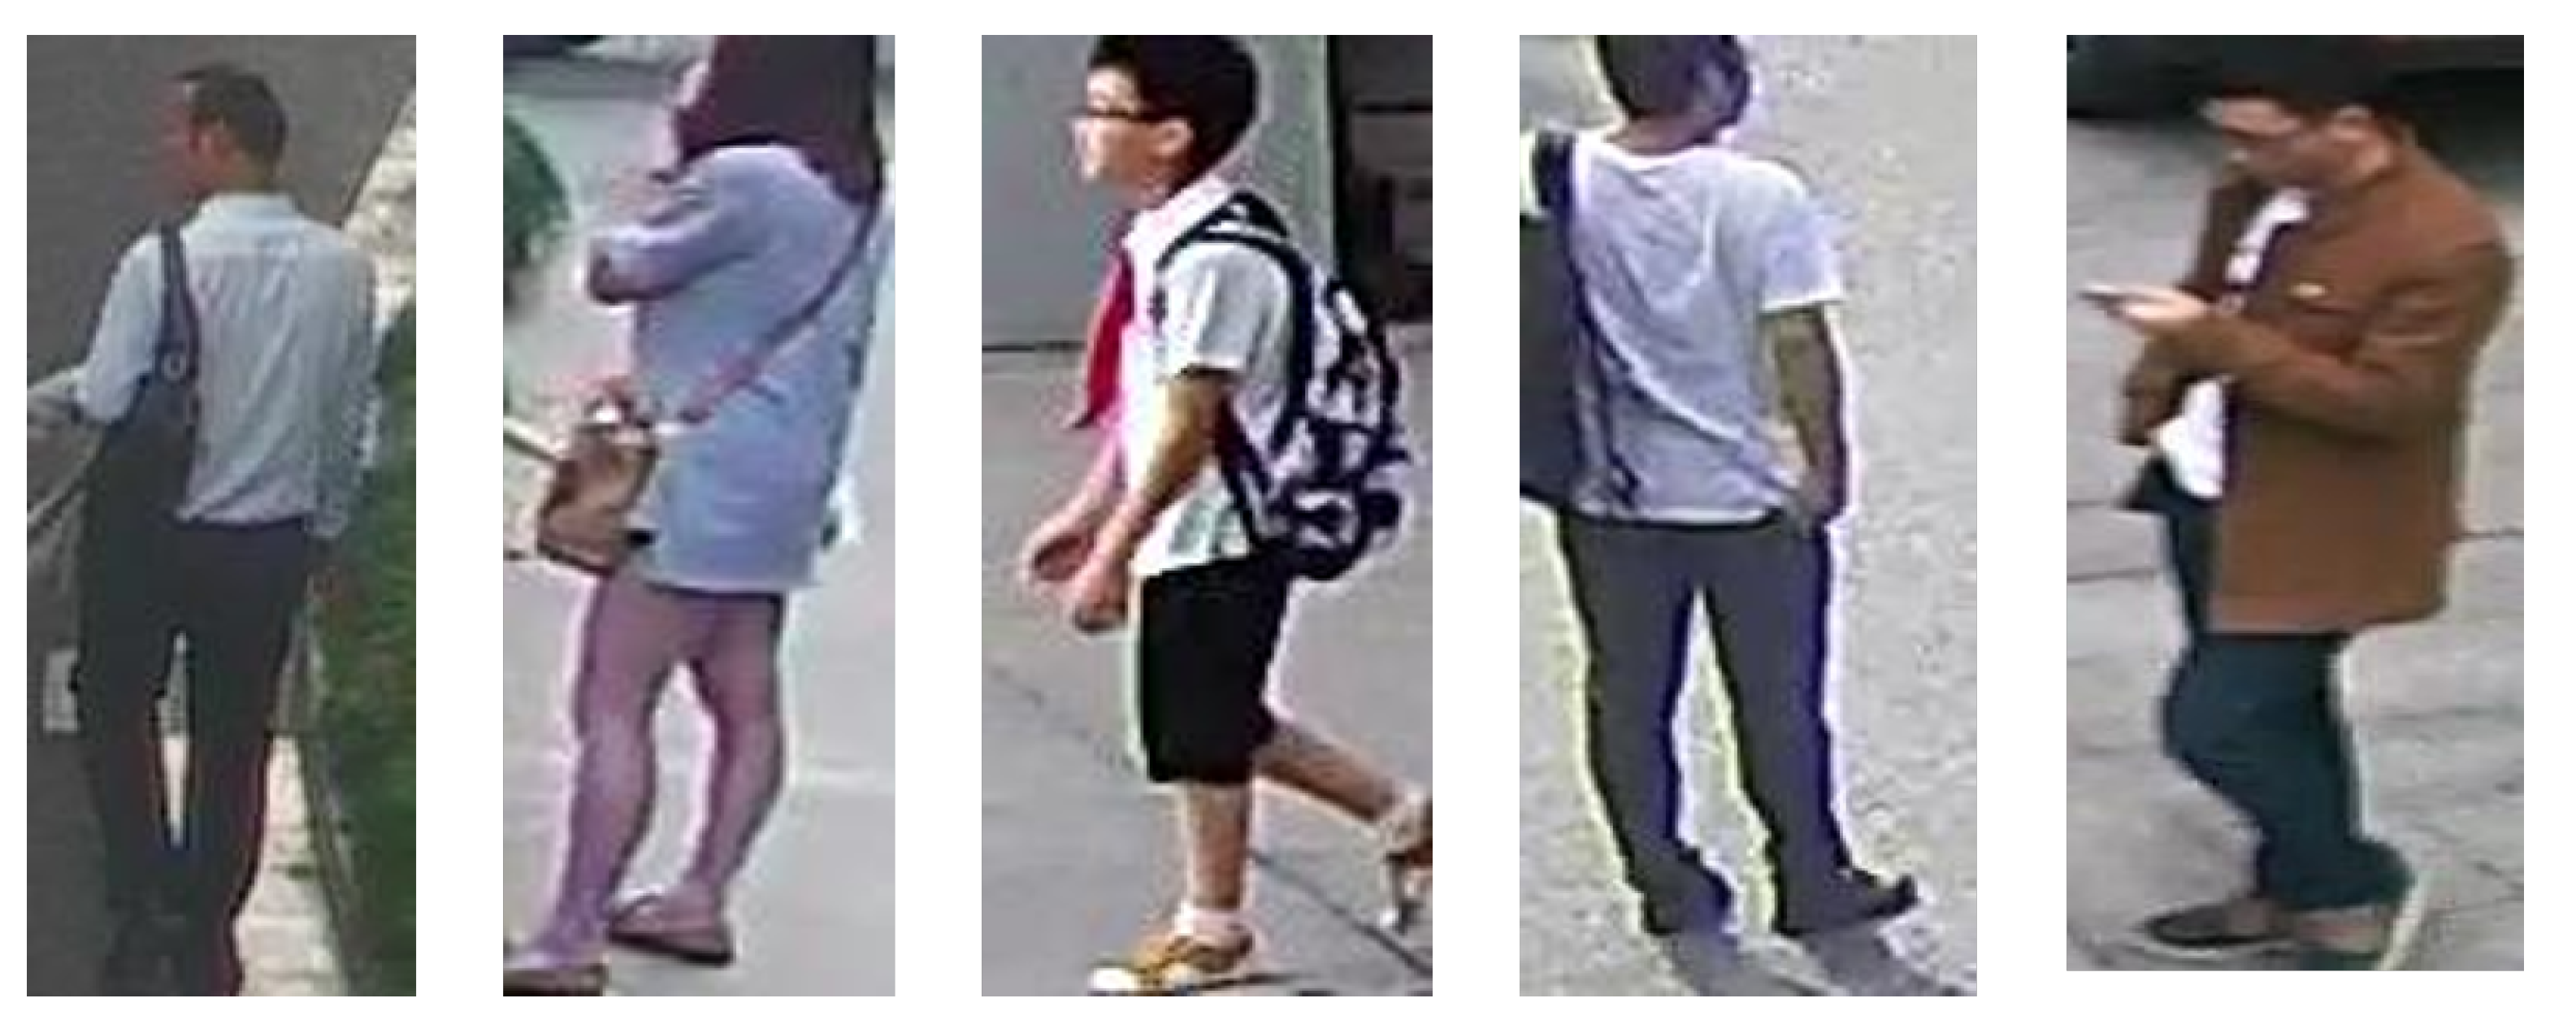
4.1. Dataset Description
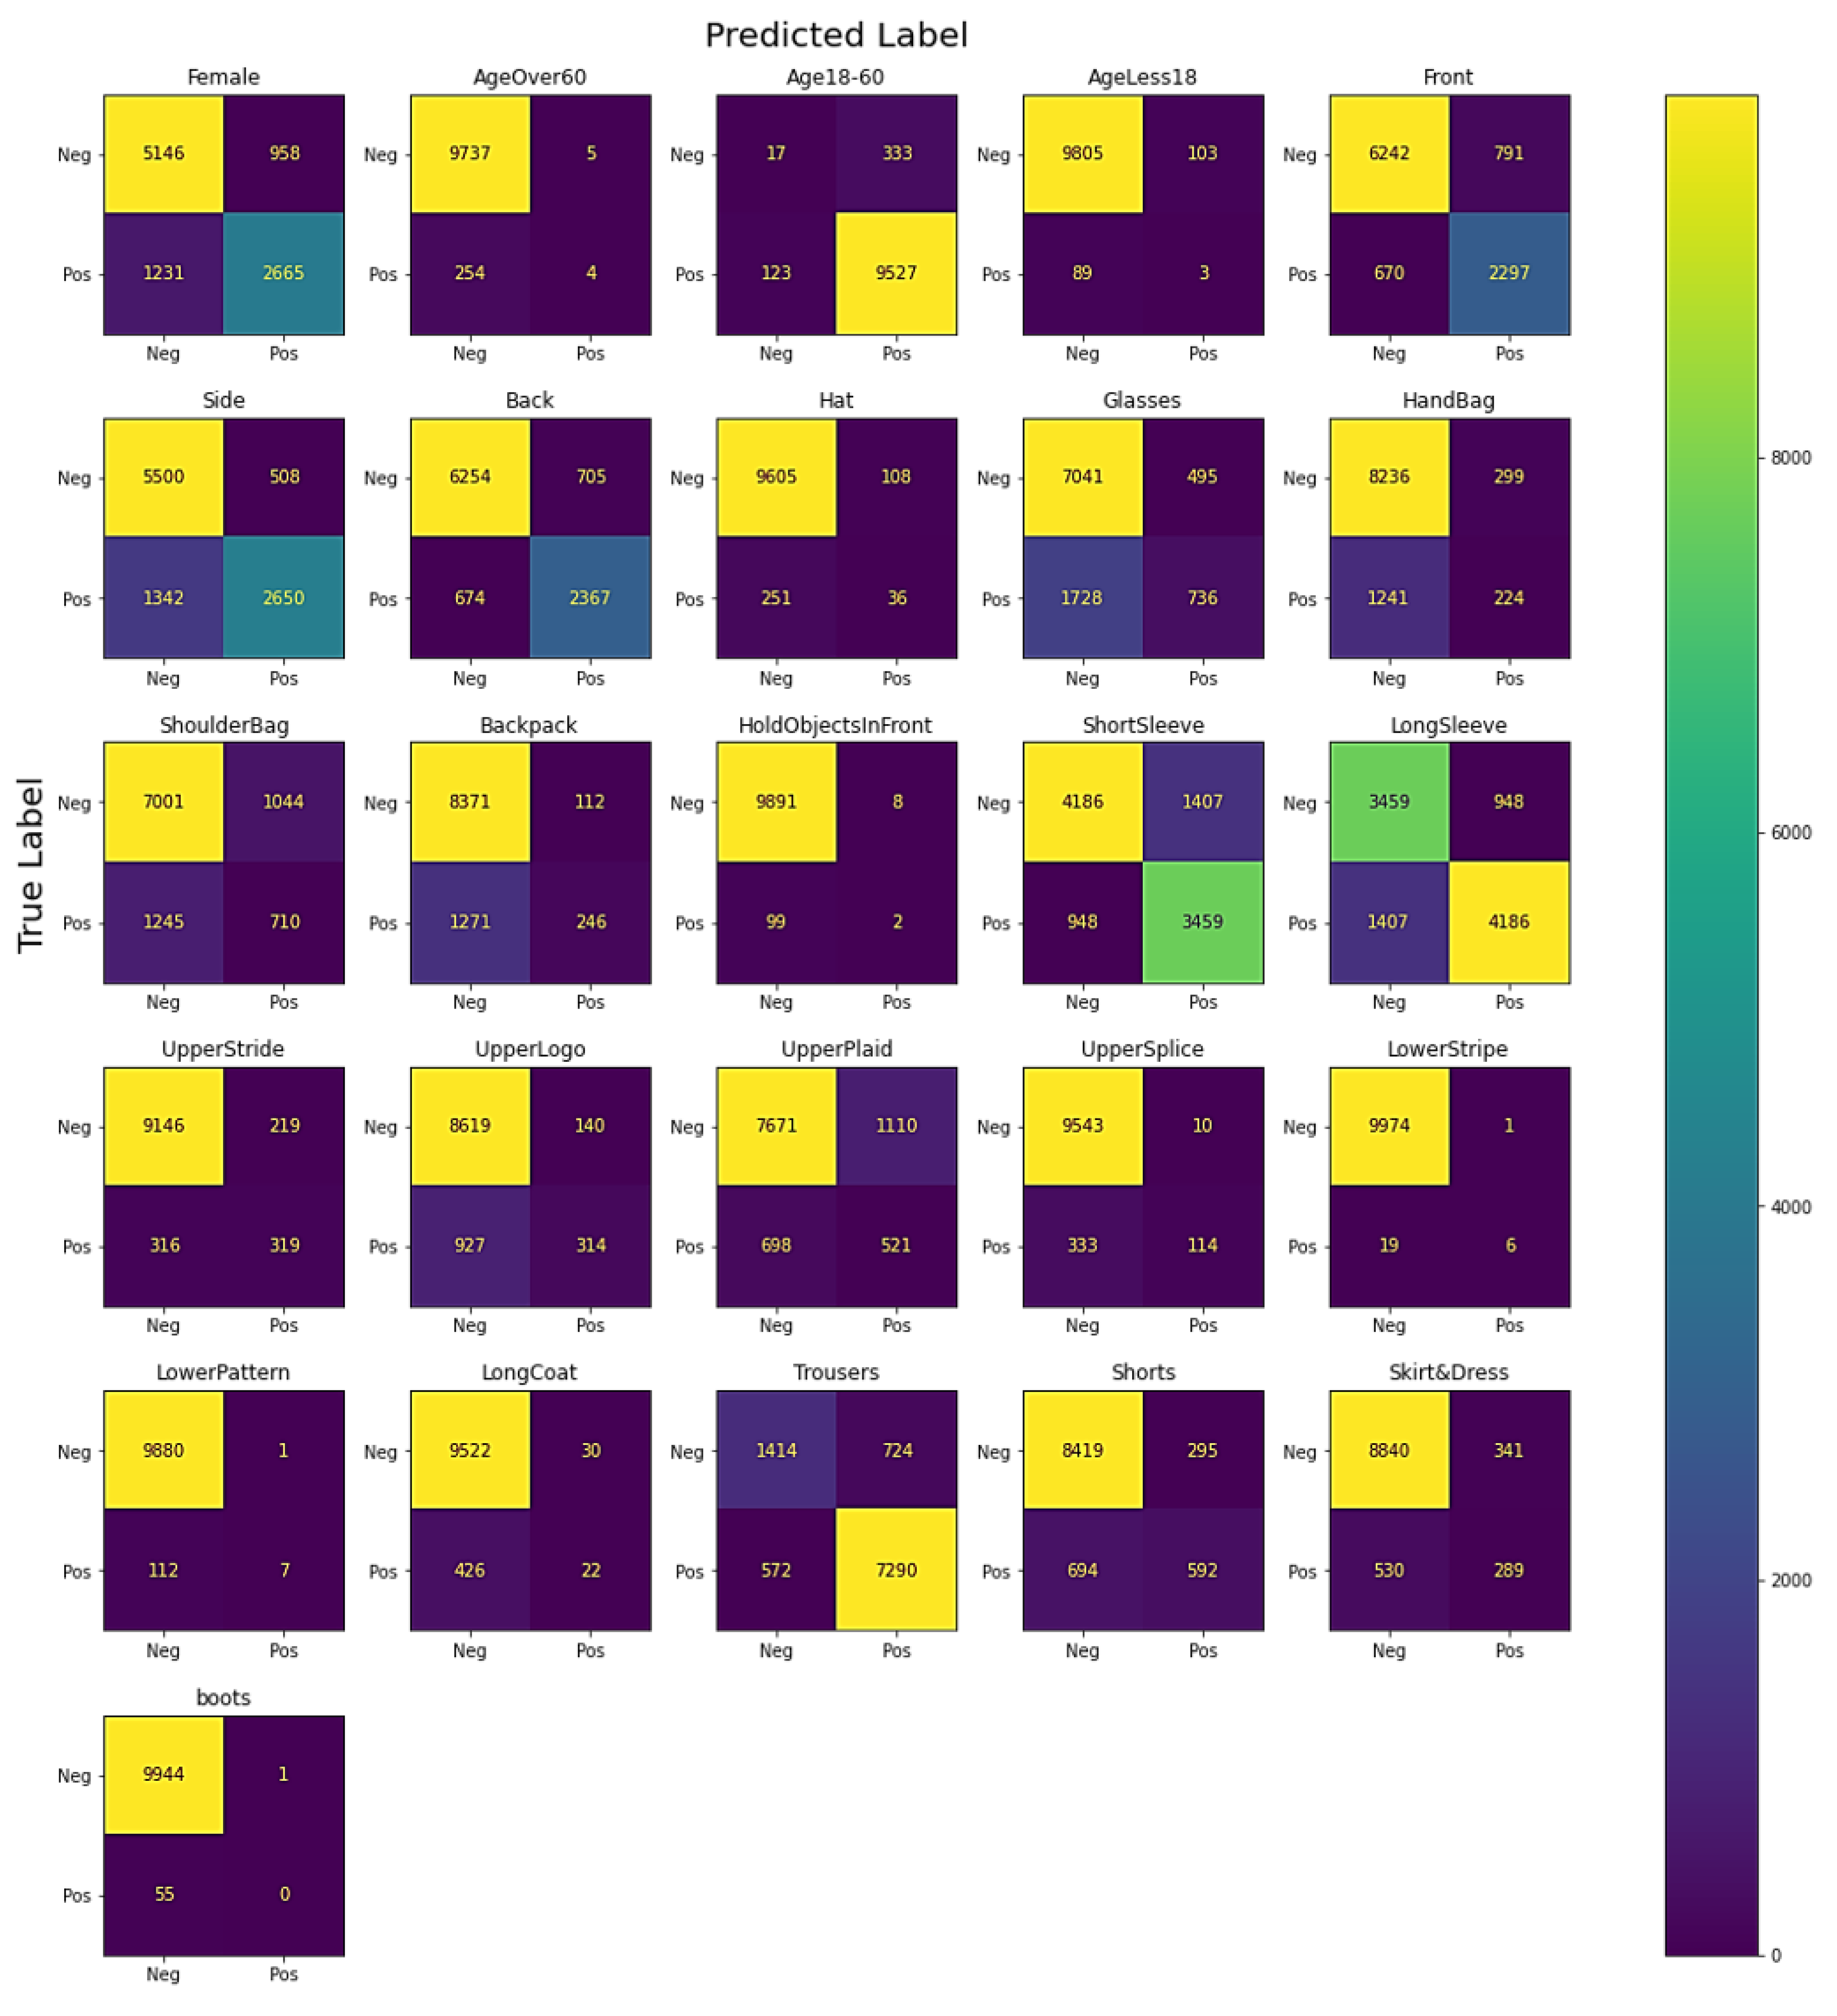
4.2. Evaluation Metrics
4.3. Results and Discussion
5. Conclusions
Author Contributions
Funding
Institutional Review Board Statement
Informed Consent Statement
Data Availability Statement
Conflicts of Interest
References
- Li, D.; Chen, X.; Huang, K. Multi-attribute learning for pedestrian attribute recognition in surveillance scenarios. In Proceedings of the 2015 IEEE 3rd IAPR Asian Conference on Pattern Recognition (ACPR), Kuala Lumpur, Malaysia, 3–6 November 2015; pp. 111–115. [Google Scholar]
- Khan, A.; Sohail, A.; Zahoora, U.; Qureshi, A.S. A survey of the recent architectures of deep convolutional neural networks. Artif. Intell. Rev. 2020, 53, 5455–5516. [Google Scholar] [CrossRef] [Green Version]
- Zhang, J.; Ren, P.; Li, J. Deep Template Matching for Pedestrian Attribute Recognition with the Auxiliary Supervision of Attribute-wise Keypoints. arXiv 2020, arXiv:2011.06798. [Google Scholar]
- Chen, Y.; Duffner, S.; Stoian, A.; Dufour, J.Y.; Baskurt, A. Pedestrian attribute recognition with part-based CNN and combined feature representations. In VISAPP2018; HAL Open Science: Funchal, Portugal, 2018. [Google Scholar]
- Wang, J.; Zhu, X.; Gong, S.; Li, W. Attribute recognition by joint recurrent learning of context and correlation. In Proceedings of the IEEE International Conference on Computer Vision, Venice, Italy, 22–29 October 2017; pp. 531–540. [Google Scholar]
- Fang, W.; Chen, J.; Hu, R. Pedestrian attributes recognition in surveillance scenarios with hierarchical multi-task CNN models. China Commun. 2018, 15, 208–219. [Google Scholar]
- Astawa, I.; Putra, I.; Sudarma, I.M.; Hartati, R.S. The impact of color space and intensity normalization to face detection performance. TELKOMNIKA (Telecommun. Comput. Electron Control) 2017, 15, 1894. [Google Scholar]
- Han, H.; Tong, M. Human detection based on optical flow and spare geometric flow. In Proceedings of the 2013 IEEE Seventh International Conference on Image and Graphics, Qingdao, China, 26–28 July 2013; pp. 459–464. [Google Scholar]
- Hoang, V.D.; Hernandez, D.C.; Jo, K.H. Partially obscured human detection based on component detectors using multiple feature descriptors. In Proceedings of the International Conference on Intelligent Computing, Taiyuan, China, 3–6 August 2014; Springer: Berlin/Heidelberg, Germany, 2014; pp. 338–344. [Google Scholar]
- AlDahoul, N.; Md Sabri, A.Q.; Mansoor, A.M. Real-time human detection for aerial captured video sequences via deep models. Comput. Intell. Neurosci. 2018, 2018, 1639561. [Google Scholar] [CrossRef] [PubMed] [Green Version]
- Girshick, R.; Donahue, J.; Darrell, T.; Malik, J. Rich feature hierarchies for accurate object detection and semantic segmentation. In Proceedings of the IEEE Conference on Computer Vision and Pattern Recognition, Columbus, OH, USA, 23–28 June 2014; pp. 580–587. [Google Scholar]
- Girshick, R. Fast r-cnn. In Proceedings of the IEEE International Conference on Computer Vision, Santiago, Chile, 7–13 December 2015; pp. 1440–1448. [Google Scholar]
- Ren, S.; He, K.; Girshick, R.; Sun, J. Faster r-cnn: Towards real-time object detection with region proposal networks. Adv. Neural Inf. Process. Syst. 2015, 28, 91–99. [Google Scholar] [CrossRef] [PubMed] [Green Version]
- He, K.; Gkioxari, G.; Dollár, P.; Girshick, R. Mask r-cnn. In Proceedings of the IEEE International Conference on Computer Vision, Venice, Italy, 22–29 October 2017; pp. 2961–2969. [Google Scholar]
- Liu, W.; Anguelov, D.; Erhan, D.; Szegedy, C.; Reed, S.; Fu, C.Y.; Berg, A.C. Ssd: Single shot multibox detector. In Proceedings of the European Conference on Computer Vision, Amsterdam, The Netherlands, 11–14 October 2016; Springer: Berlin/Heidelberg, Germany, 2016; pp. 21–37. [Google Scholar]
- Redmon, J.; Divvala, S.; Girshick, R.; Farhadi, A. You only look once: Unified, real-time object detection. In Proceedings of the IEEE Conference on Computer Vision and Pattern Recognition, Las Vegas, NV, USA, 27–30 June 2016; pp. 779–788. [Google Scholar]
- Ansari, M.; Singh, D.K. Human detection techniques for real time surveillance: A comprehensive survey. Multimed. Tools Appl. 2021, 80, 8759–8808. [Google Scholar] [CrossRef]
- Gray, D.; Tao, H. Viewpoint invariant pedestrian recognition with an ensemble of localized features. In Proceedings of the European Conference on Computer Vision, Marseille, France, 12–18 October 2008; Springer: Berlin/Heidelberg, Germany, 2008; pp. 262–275. [Google Scholar]
- Prosser, B.J.; Zheng, W.S.; Gong, S.; Xiang, T.; Mary, Q. Person re-identification by support vector ranking. BMVC 2010, 2, 6. [Google Scholar] [CrossRef] [Green Version]
- Layne, R.; Hospedales, T.M.; Gong, S.; Mary, Q. Person re-identification by attributes. BMVC 2012, 2, 8. Available online: https://homepages.inf.ed.ac.uk/thospeda/papers/layne2012attribreid.pdf (accessed on 10 November 2021).
- Layne, R.; Hospedales, T.M.; Gong, S. Attributes-based re-identification. In Person Re-Identification; Springer: Berlin/Heidelberg, Germany, 2014; pp. 93–117. [Google Scholar]
- Deng, Y.; Luo, P.; Loy, C.C.; Tang, X. Pedestrian attribute recognition at far distance. In Proceedings of the 22nd ACM International Conference on Multimedia, Orlando, FL, USA, 3–7 November 2014; pp. 789–792. [Google Scholar]
- Li, D.; Zhang, Z.; Chen, X.; Ling, H.; Huang, K. A richly annotated dataset for pedestrian attribute recognition. arXiv 2016, arXiv:1603.07054. [Google Scholar]
- Vaquero, D.A.; Feris, R.S.; Tran, D.; Brown, L.; Hampapur, A.; Turk, M. Attribute-based people search in surveillance environments. In Proceedings of the 2009 IEEE Workshop on Applications of Computer Vision (WACV), Snowbird, UT, USA, 7–8 December 2009; pp. 1–8. [Google Scholar]
- Sudowe, P.; Spitzer, H.; Leibe, B. Person attribute recognition with a jointly-trained holistic cnn model. In Proceedings of the IEEE International Conference on Computer Vision Workshops, Santiago, Chile, 7–13 December 2015; pp. 87–95. [Google Scholar]
- Zhu, J.; Liao, S.; Yi, D.; Lei, Z.; Li, S.Z. Multi-label cnn based pedestrian attribute learning for soft biometrics. In Proceedings of the 2015 IEEE International Conference on Biometrics (ICB), Phuket, Thailand, 19–22 May 2015; pp. 535–540. [Google Scholar]
- Matsukawa, T.; Suzuki, E. Person re-identification using CNN features learned from combination of attributes. In Proceedings of the 2016 IEEE 23rd International Conference on Pattern Recognition (ICPR), Cancun, Mexico, 4–8 December 2016; pp. 2428–2433. [Google Scholar]
- Kurnianggoro, L.; Jo, K.H. Identification of pedestrian attributes using deep network. In Proceedings of the IECON 2017-43rd Annual Conference of the IEEE Industrial Electronics Society, Beijing, China, 29 October–1 November 2017; pp. 8503–8507. [Google Scholar]
- Liu, P.; Liu, X.; Yan, J.; Shao, J. Localization guided learning for pedestrian attribute recognition. arXiv 2018, arXiv:1808.09102. [Google Scholar]
- Han, K.; Wang, Y.; Shu, H.; Liu, C.; Xu, C.; Xu, C. Attribute aware pooling for pedestrian attribute recognition. arXiv 2019, arXiv:1907.11837. [Google Scholar]
- Tan, Z.; Yang, Y.; Wan, J.; Hang, H.; Guo, G.; Li, S.Z. Attention-based pedestrian attribute analysis. IEEE Trans. Image Process. 2019, 28, 6126–6140. [Google Scholar] [CrossRef] [PubMed]
- Li, Y.; Xu, H.; Bian, M.; Xiao, J. Attention based CNN-ConvLSTM for pedestrian attribute recognition. Sensors 2020, 20, 811. [Google Scholar] [CrossRef] [PubMed] [Green Version]
- Zeng, H.; Ai, H.; Zhuang, Z.; Chen, L. Multi-Task Learning Via Co-Attentive Sharing For Pedestrian Attribute Recognition. In Proceedings of the 2020 IEEE International Conference on Multimedia and Expo (ICME), London, UK, 6–10 July 2020; pp. 1–6. [Google Scholar]
- Ji, Z.; He, E.; Wang, H.; Yang, A. Image-attribute reciprocally guided attention network for pedestrian attribute recognition. Pattern Recognit. Lett. 2019, 120, 89–95. [Google Scholar] [CrossRef]
- Yu, K.; Leng, B.; Zhang, Z.; Li, D.; Huang, K. Weakly-supervised learning of mid-level features for pedestrian attribute recognition and localization. arXiv 2016, arXiv:1611.05603. [Google Scholar]
- He, K.; Wang, Z.; Fu, Y.; Feng, R.; Jiang, Y.G.; Xue, X. Adaptively weighted multi-task deep network for person attribute classification. In Proceedings of the 25th ACM International Conference on Multimedia, Mountain View, CA, USA, 23–27 October 2017; pp. 1636–1644. [Google Scholar]
- Zhang, S.; Song, Z.; Cao, X.; Zhang, H.; Zhou, J. Task-aware attention model for clothing attribute prediction. IEEE Trans. Circuits Syst. Video Technol. 2019, 30, 1051–1064. [Google Scholar] [CrossRef]
- Bharati, P.; Pramanik, A. Deep learning techniques—R-CNN to mask R-CNN: A survey. In Computational Intelligence in Pattern Recognition; Springer: Berlin/Heidelberg, Germany, 2020; pp. 657–668. [Google Scholar]
- Xiang, J.; Dong, T.; Pan, R.; Gao, W. Clothing attribute recognition based on RCNN framework using L-Softmax loss. IEEE Access 2020, 8, 48299–48313. [Google Scholar] [CrossRef]
- Yu, W.; Kim, S.; Chen, F.; Choi, J. Pedestrian Detection Based on Improved Mask R-CNN Algorithm. In International Conference on Intelligent and Fuzzy Systems; Springer: Berlin/Heidelberg, Germany, 2020; pp. 1515–1522. [Google Scholar]
- GitHub—Facebookresearch/Detectron: FAIR’s Research Platform for Object Detection Research, Implementing Popular Algorithms Like Mask R-CNN and RetinaNet. Available online: https://github.com/facebookresearch/Detectron (accessed on 13 April 2021).
- Keras Applications. Available online: https://keras.io/api/applications/ (accessed on 1 July 2021).
- Li, D.; Zhang, Z.; Chen, X.; Huang, K. A richly annotated pedestrian dataset for person retrieval in real surveillance scenarios. IEEE Trans. Image Process. 2018, 28, 1575–1590. [Google Scholar] [CrossRef]
- Drummond, C.; Holte, R.C. C4. 5, class imbalance, and cost sensitivity: Why under-sampling beats over-sampling. In Workshop on Learning from Imbalanced Datasets II; Citeseer: Washington, DC, USA, 2003; Volume 11, pp. 1–8. [Google Scholar]
- Zhu, J.; Liao, S.; Lei, Z.; Yi, D.; Li, S. Pedestrian attribute classification in surveillance: Database and evaluation. In Proceedings of the IEEE International Conference on Computer Vision Workshops, Sydney, Australia, 2–8 December 2013; pp. 331–338. [Google Scholar]
- Gray, D.; Brennan, S.; Tao, H. Evaluating appearance models for recognition, reacquisition, and tracking. In Proceedings of the IEEE International Workshop on Performance Evaluation for Tracking and Surveillance (PETS), Rio de Janeiro, Brazil, 14–20 October 2007; Citeseer: Washington, DC, USA, 2007; Volume 3, pp. 1–7. [Google Scholar]
- Liu, X.; Zhao, H.; Tian, M.; Sheng, L.; Shao, J.; Yi, S.; Yan, J.; Wang, X. Hydraplus-net: Attentive deep features for pedestrian analysis. In Proceedings of the IEEE International Conference on Computer Vision, Venice, Italy, 22–29 October 2017; pp. 350–359. [Google Scholar]
- Sarafianos, N.; Xu, X.; Kakadiaris, I.A. Deep imbalanced attribute classification using visual attention aggregation. In Proceedings of the European Conference on Computer Vision (ECCV), Munich, Germany, 8–14 September 2018; pp. 680–697. [Google Scholar]
- Guo, H.; Zheng, K.; Fan, X.; Yu, H.; Wang, S. Visual attention consistency under image transforms for multi-label image classification. In Proceedings of the IEEE/CVF Conference on Computer Vision and Pattern Recognition, Long Beach, CA, USA, 15–20 June 2019; pp. 729–739. [Google Scholar]
- Nature News & Comment. Can We Open the Black Box of AI? Available online: https://www.nature.com/news/can-we-open-the-black-box-of-ai-1.20731 (accessed on 6 November 2021).


| Richly Annotated Pedestrian (RAP) v2 Dataset | |
|---|---|
| Number of binary attributes | 69 |
| Number of multi-class attributes | 3 |
| Number of samples | 84,928 |
| Resolution () | From to |
| Scene | Indoor |
| Number of cameras | 25 |
| Pre-Trained Models | Trainable Parameters | Nodes in Dense Layer | Test Accuracy (%) |
|---|---|---|---|
| Xception | 2.1 M | 1024 | 91.56 |
| Inception ResNet V2 | 1.6 M | 91.61 | |
| ResNet 101 V2 | 2.1 M | 92.11 | |
| ResNet 152 V2 | 2.1 M | 92.14 |
| ResNet 152 v2 Model | Trainable Layers (Excluding FC Layer) | Nodes in Dense Layer | Trainable Parameters | mA (%) | F1 (%) |
|---|---|---|---|---|---|
| Model 1 | None | 1024 | 2,184,274 | 92.14 | 27.58 |
| Model 2 | Last 4 layers | 3,238,994 | 91.96 | 24.61 | |
| Model 3 | Last 8 layers | 3,415,040 | 92.61 | 34.08 | |
| Model 4 | Last 12 layers | 4,464,640 | 93.09 | 40.16 | |
| Model 5 | Last 14 layers | 6,653,010 | 93.41 | 45.18 | |
| Model 6 | Last 20 layers | 7,879,680 | 93.01 | 37.09 | |
| Model 7 | All | 60,372,178 | 93.16 | 36.70 |
| Training Accuracy (%) | Validation Accuracy (%) | Test Accuracy (%) | Total Epochs | |
|---|---|---|---|---|
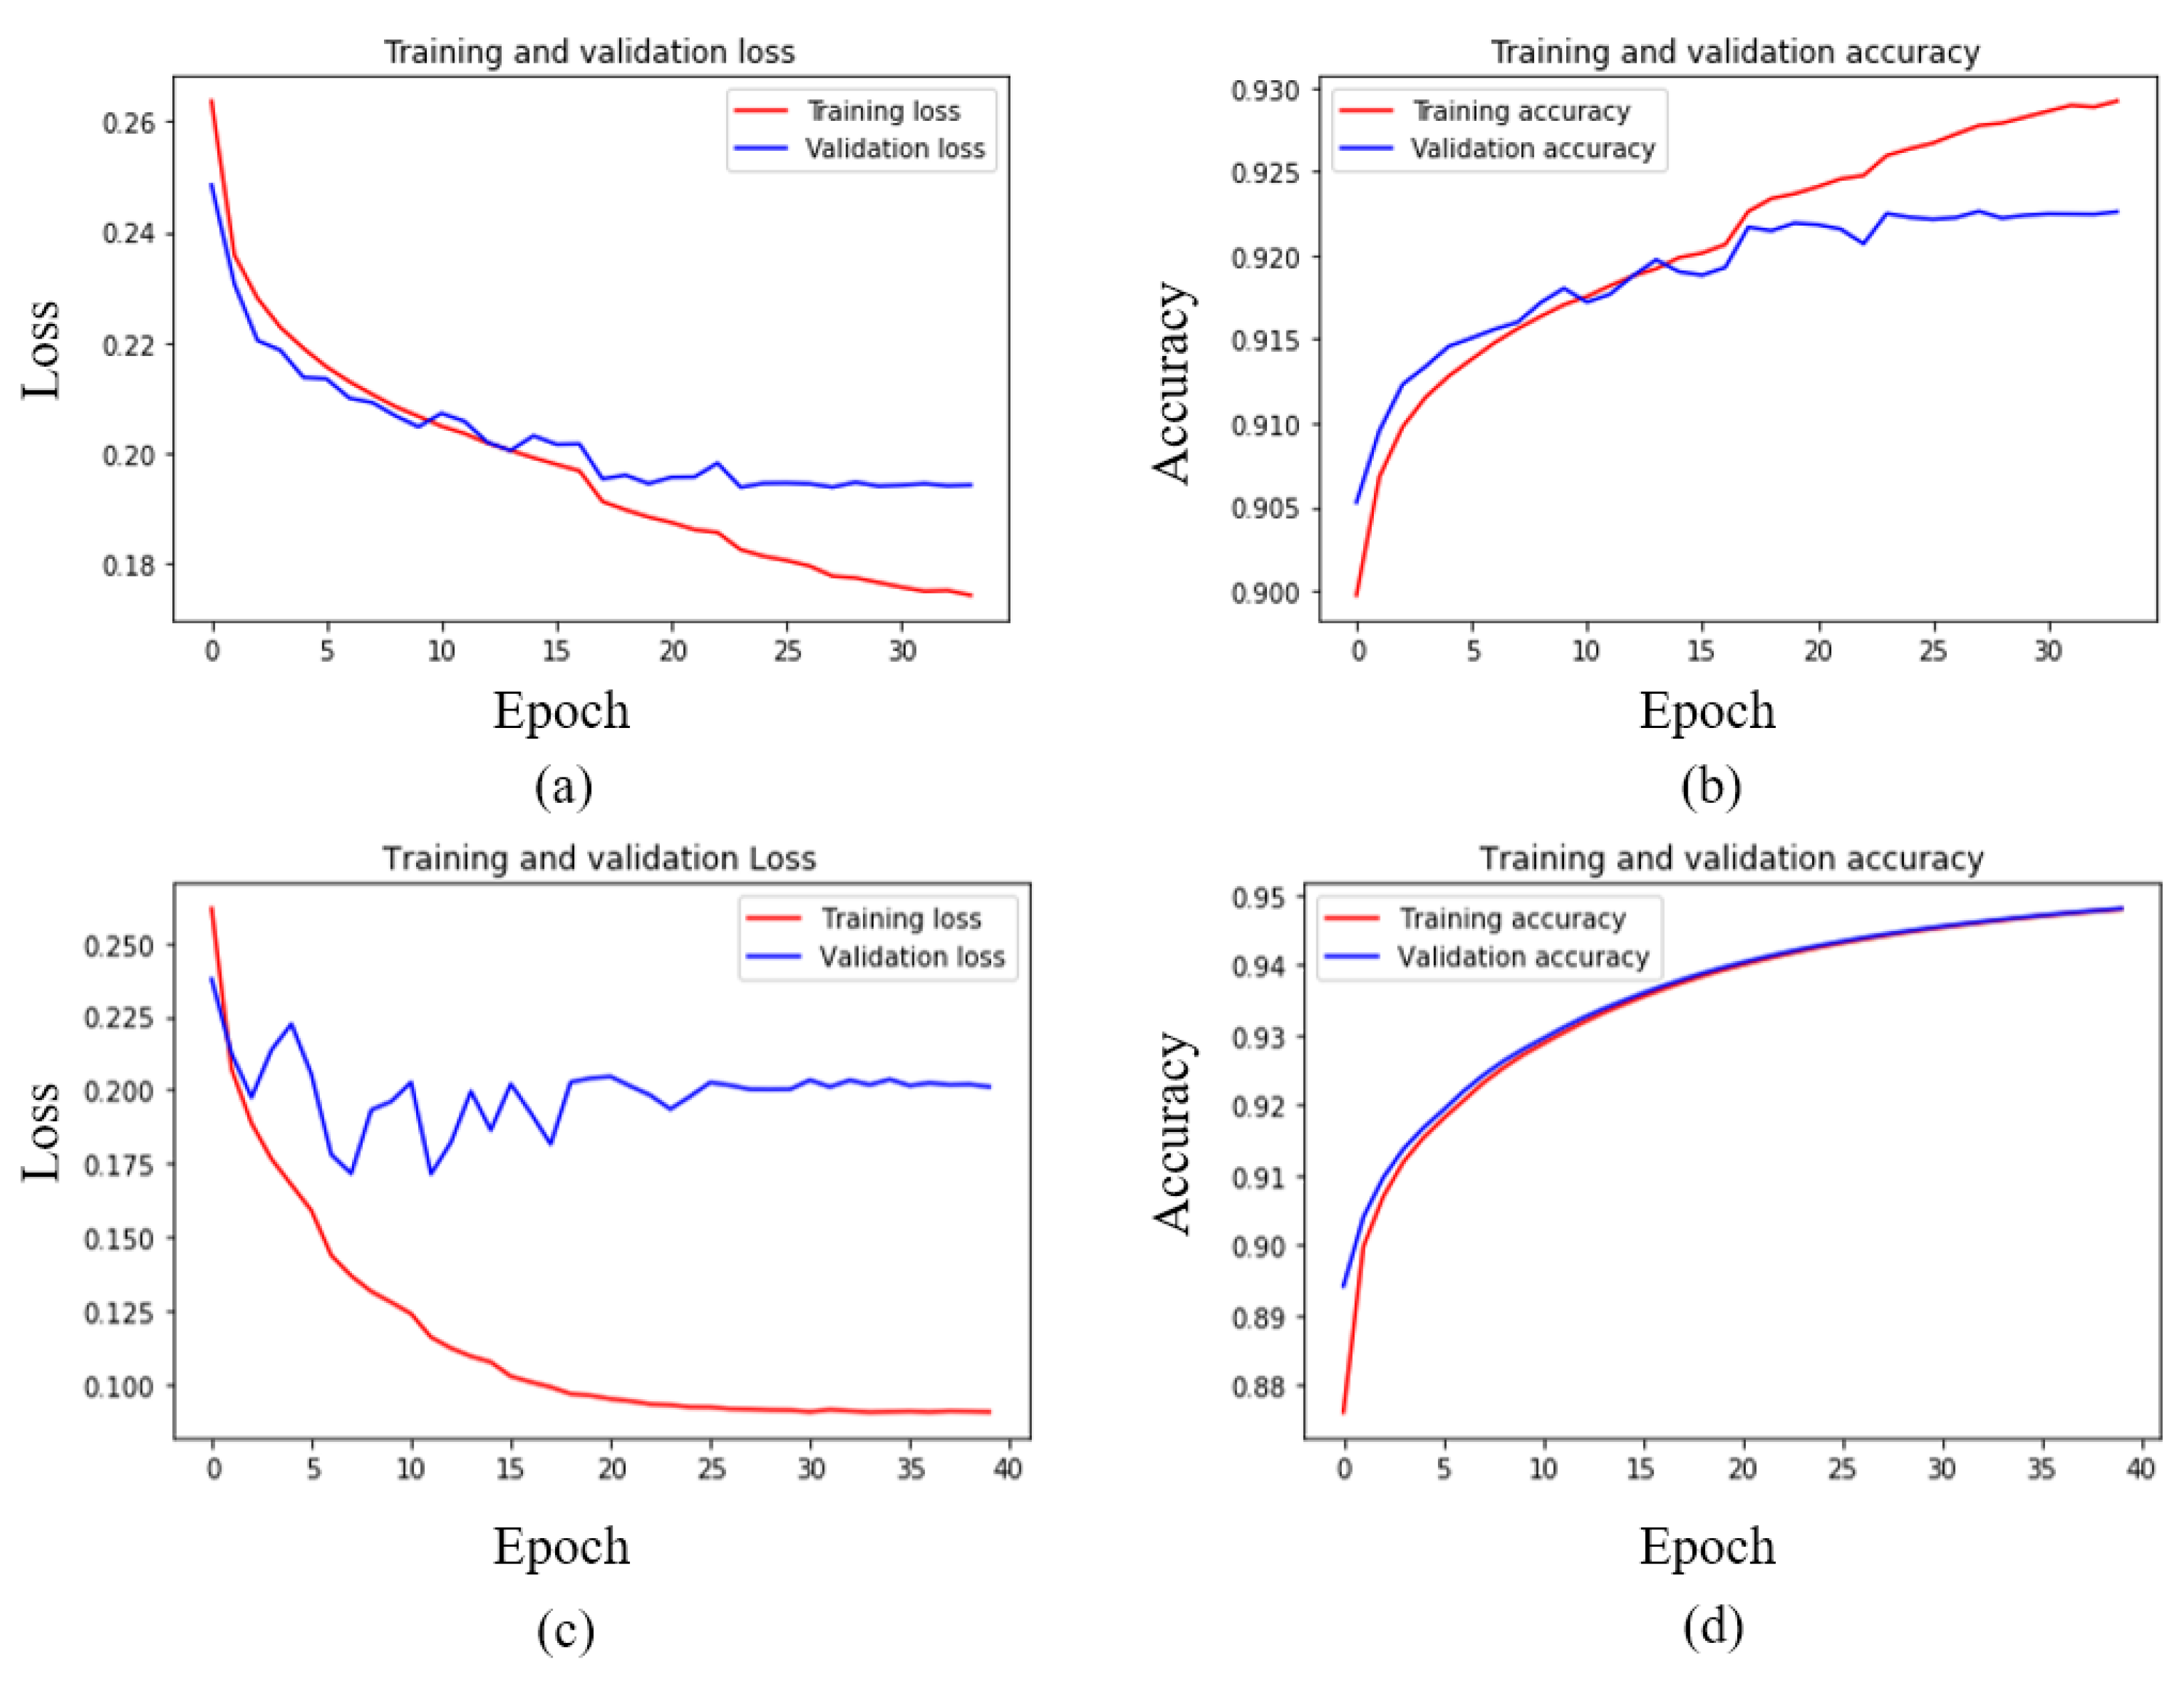
| Normalized Data | 92.45 | 92.48 | 92.45 | 40 |
| Unnormalized Data | 94.25 | 93.46 | 93.41 | 40 |
| Architecture | Experiment | No. of Images | mA (%) | mP (%) | mR (%) | F1 (%) |
|---|---|---|---|---|---|---|
| Model 5 | With oversampling and weighted loss | 462,046 | 86.50 | 37.89 | 58.66 | 44.48 |
| Without oversampling and weighted loss | 50,862 | 93.41 | 61.34 | 39.15 | 45.18 |
| Hyperparameters | Hyperparameter Space | Optimum Hyperparameter |
|---|---|---|
| No. of Dense Layer | 1, 2, 3 | 1 |
| No. of Neurons in Dense Layer | 128, 256, 512, 1024, 2048 | 1024 |
| Learning Rate | 0.1, 0.5, 0.01, 0.05, 0.001, 0.005 | 0.01 |
| Batch Size | 32, 64, 128, 256 | 64 |
| Epochs | 10, 20, 30, 40, 50 | 40 |
| Optimizer | ‘SGD’, ‘RMSProp’, ‘Adam’ | ‘Adam’ |
Publisher’s Note: MDPI stays neutral with regard to jurisdictional claims in published maps and institutional affiliations. |
© 2022 by the authors. Licensee MDPI, Basel, Switzerland. This article is an open access article distributed under the terms and conditions of the Creative Commons Attribution (CC BY) license (https://creativecommons.org/licenses/by/4.0/).
Share and Cite
Sakib, S.; Deb, K.; Dhar, P.K.; Kwon, O.-J. A Framework for Pedestrian Attribute Recognition Using Deep Learning. Appl. Sci. 2022, 12, 622. https://doi.org/10.3390/app12020622
Sakib S, Deb K, Dhar PK, Kwon O-J. A Framework for Pedestrian Attribute Recognition Using Deep Learning. Applied Sciences. 2022; 12(2):622. https://doi.org/10.3390/app12020622
Chicago/Turabian StyleSakib, Saadman, Kaushik Deb, Pranab Kumar Dhar, and Oh-Jin Kwon. 2022. "A Framework for Pedestrian Attribute Recognition Using Deep Learning" Applied Sciences 12, no. 2: 622. https://doi.org/10.3390/app12020622
APA StyleSakib, S., Deb, K., Dhar, P. K., & Kwon, O.-J. (2022). A Framework for Pedestrian Attribute Recognition Using Deep Learning. Applied Sciences, 12(2), 622. https://doi.org/10.3390/app12020622