1. Introduction
The need for high-resolution seismic imaging has increased over the last three decades to solve shallow geological, engineering, and environmental problems in addition to generating a better velocity model for static corrections. Shallow geophysical applications require the investigation of the subsurface velocity model for depths less than 300 m. This shallow-depth and high-resolution subsurface investigation require acquisition with high-fold and densely spaced receivers. The recording of high-fold and densely spaced receivers’ seismic data with traditional acquisition techniques is highly time consuming and requires labor for receiver planting and cable moving, which is a major obstacle in shallow applications of the seismic method.
The shallow seismic velocity model is widely used for engineering and geological applications [
1,
2,
3,
4,
5,
6]. In deep seismic applications, the shallow velocity model still required for the static corrections. The static corrections are associated with seismic reflection and refraction methods, where it is normally applied to remove the effect of the surface topography, weathering, and sub-weathering layers from the recorded seismic data [
7]. Static corrections are defined by [
8] as “Corrections applied to seismic data to compensate for the effects of variations in elevation, near-surface low-velocity-layer (weathering) thickness, weathering velocity, and/or reference to a datum”. Static corrections are usually required for land and transition seismic surveys, however, for most marine surveys, static corrections are not required [
7].
Developing shallow velocity models for various applications started in the early days of seismic surveys and continued until recently, where new approaches and techniques have been introduced and published [
9,
10,
11,
12,
13,
14].
The importance of finding an accurate shallow-velocity model is very clear, for example, in static corrections, where the effect of ignoring or using wrong static corrections on deep reflectors could be severe. This effect is shown as discontinuity and/or misplacing in deep reflectors [
15,
16,
17,
18,
19,
20,
21,
22,
23,
24]. A key input for calculating static corrections is an accurate near-surface velocity model, which includes a description of the thickness, velocities, and variations along the line of the near-surface layers. The shallow-depth velocity model can be found using several approaches such as;
Uphole surveys. It is used to obtain near-surface information at specific points along the survey profile. The offset between boreholes is ranging between a few hundred meters to several km depending on the survey site and complexity of the near-surface model. The depth of the borehole is ranging between tens to hundreds of meters, where the borehole should reach the bottom of the weathering and sub-weathering zones [
7,
25]. The disadvantages of this approach are that the obtained information is limited to the borehole and the area around it as well as the cost and time required to complete the drilling and up-hole surveys. The velocity model between boreholes is an estimate and obtained by interpolation.
Refraction surveys. It is used for many decades to procure the near-surface velocity models [
1,
3,
4,
5,
6,
14]. The refraction method only works if the velocity increases with depth, however, it is not appropriate in areas with high near-surface velocities such as permafrost. Many techniques are used to model refraction surveys such as the intercept time method [
26], ABC method [
27], Plus-minus method [
28], and Generalized Reciprocal method [
29]. However, the most used method is the first-arrival travel-time inversion [
27]. The tomograms generated from the first-arrival travel-time inversion show the velocity distribution in both horizontal and vertical dimensions, which can be used to calculate the values of the static corrections. The accuracy of the traveltime tomograms depends on the receiver intervals. In a typical refraction survey, the receiver interval is ranging between 2 to 5 m, however, in a typical reflection survey, the receiver interval is ranging between 25 and 50 m, which produces a low-resolution first arrival traveltime tomograms.
There are other techniques used to find the near-surface velocity model such as simple elevation correction, sand thickness curve method, Ground Penetrating Radar (which will give the shape and the thickness of the near-surface layers but not the seismic wave velocities), Surface Wave Dispersion (which will give the shear-wave velocity model), etc. [
7,
30].
A solution to the two problems mentioned above (low-resolution results and time-consuming surveys) could be the use of a land-streamer [
31,
32], which is known since the 1970s.
Land-streamers have been used for many applications such as fault detection [
33,
34], shear-wave shallow application [
35,
36,
37], archaeology [
38], and cavity and tunnel studies [
39,
40]. The main advantage of a land streamer is that it saves acquisition time. The data quality of the land-streamer is very comparable to the traditional acquisition technique [
41]. However, land-streamers suffer from two limitations; the first is land-streamers are usually less than 150 m in length with 48 to 120 receivers. The second limitation is the lack of good contact between the receiver and the ground. In conventional seismic acquisition, the receivers have spikes that are buried in the ground to increase the receiver-ground coupling, contrary to conventional setup, the spikes in land-streamer setup are removed from the receivers. Long land-streamers suffer from a low signal-to-noise ratio (SNR) due to the bad receiver-ground coupling and will cause logistic problems due to transportation and dragging over rough ground.
In this study, we show a comparison between the conventional and land-streamer seismic data. Here, we present the trace comparison in time-offset (T−x), frequency-offset (F−x), and frequency-wavenumber (F−κ) domains. We also compare the first arrival travel-time picks of both land-streamer and conventional data sets. Then, we generated a synthetic data set to compare the accuracy of both techniques to map near-surface local anomalies. The target of this work is to show the advantages and disadvantages of a land-streamer compared to conventional seismic data; hence, the land-streamer data can replace the conventional data to obtain high-resolution near-surface velocity models that can be used in static corrections as well as other near-surface applications such as engineering.
2. Land-Streamer Design
The name of the land-streamer is originally borrowed from marine streamers, however, rather than a streamer of hydrophones, a land-streamer is consisting of a group of geophones designed to be towed along the surface of the ground. Early land-streamers were designed for different innovative towing mechanisms.
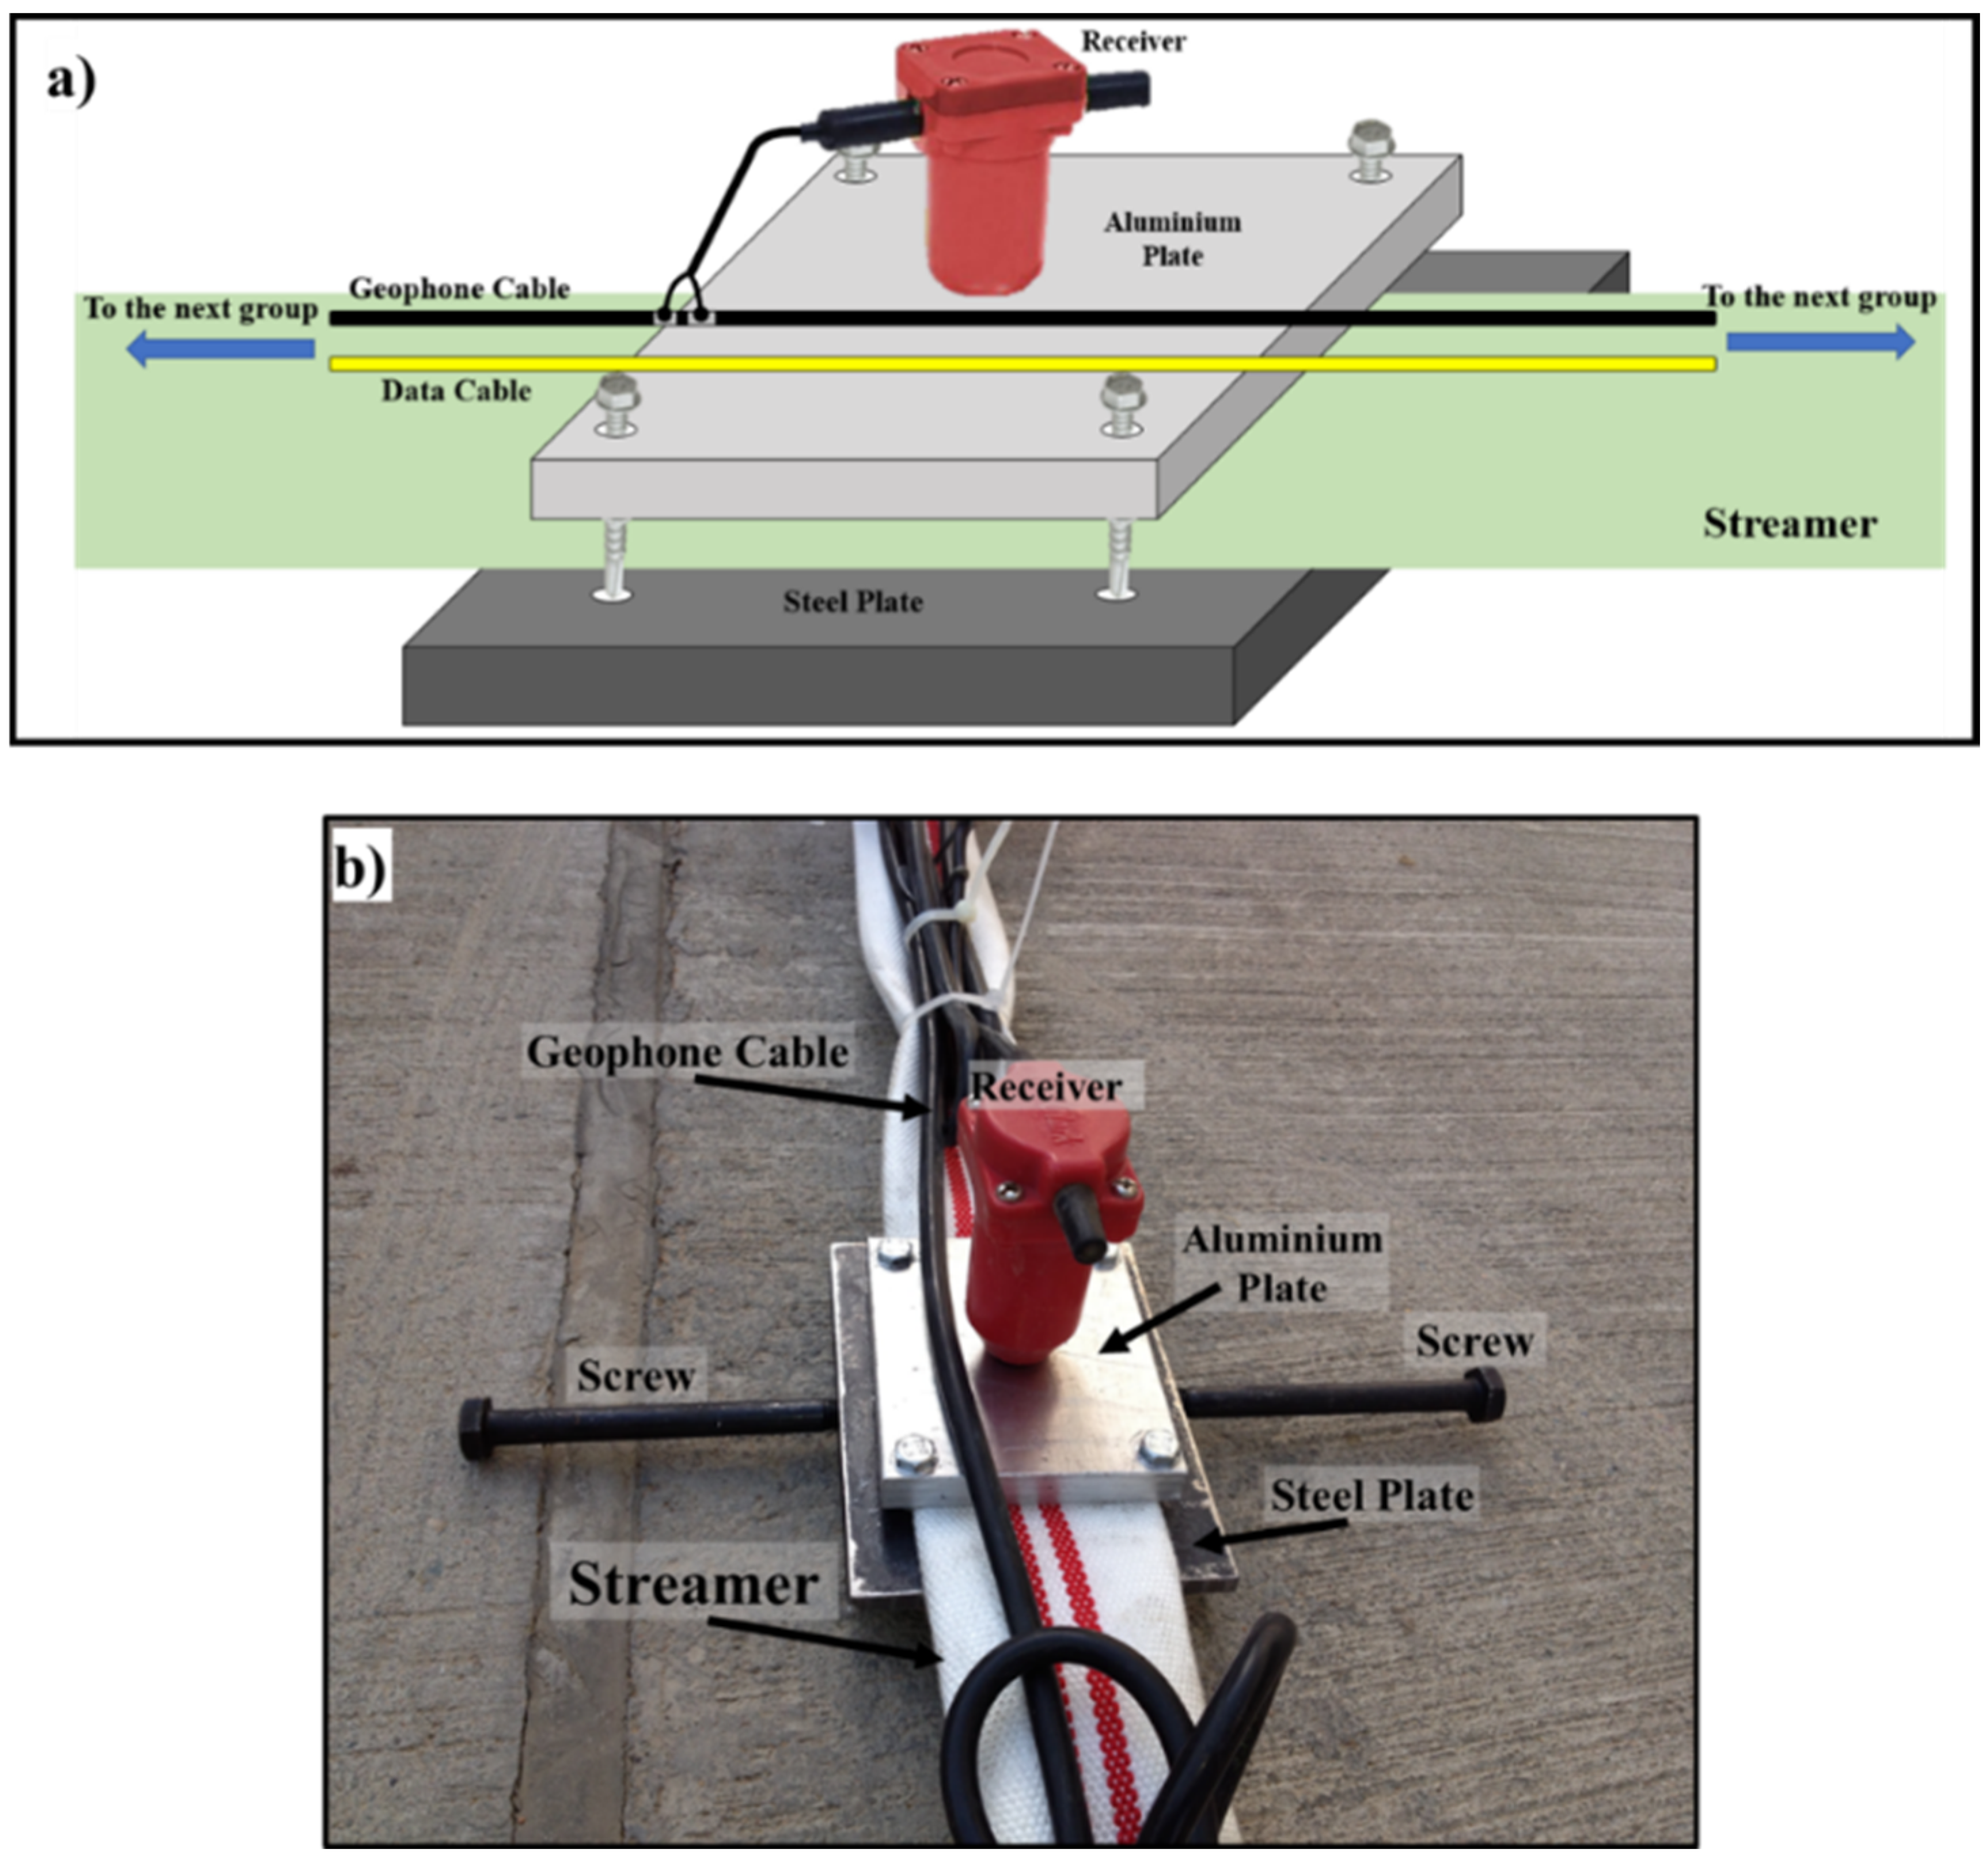
The main components of land-streamers (
Figure 1a) are (a) the geophone, which could be a P-wave or S-wave receiver, (b) the plate, which is a heavy metal that enhances the coupling between the receiver and the ground. In our design, we have two plates, the lower is a steel plate and the upper is aluminum. We also added two side wings made of iron to increase stability during the acquisition (
Figure 1b,c) the streamer, which is any tough material that can connect all plates together, (d) the cables that connects the receivers to the recording system, and (e) the recording system. Components (a–d) are connected to each other (
Figure 1b) and moved to/from the field as one unit, which saves a lot of installing time at the field.
Generally, geophones planted in the ground set the standard for data quality, but land-streamers record excellent data in many applications while making the survey economically feasible. A “good” affordable survey often will be a better choice than a “great” survey that can’t be done due to its cost.
To reach deeper depths without increasing the length of the land-streamer, Hanafy showed in [
42] how the length of a land-streamer can be effectively doubled or tripled if two or three seismic sources are used at offsets equal to the length of the land-streamer. Hence, the depth of penetration will be increased without increasing the logistics requirements.
3. Data Recording
To assemble the land-streamer system we used spike-less 40-Hz P-wave receivers and then connecting them to a Geometrics Geode recording system. We use a regular fire hose to connect all plates together; the fire hose is fixed between the lower and the upper plates (
Figure 1b). The streamer consists of 48 channels with a receiver interval of 127.5 cm.
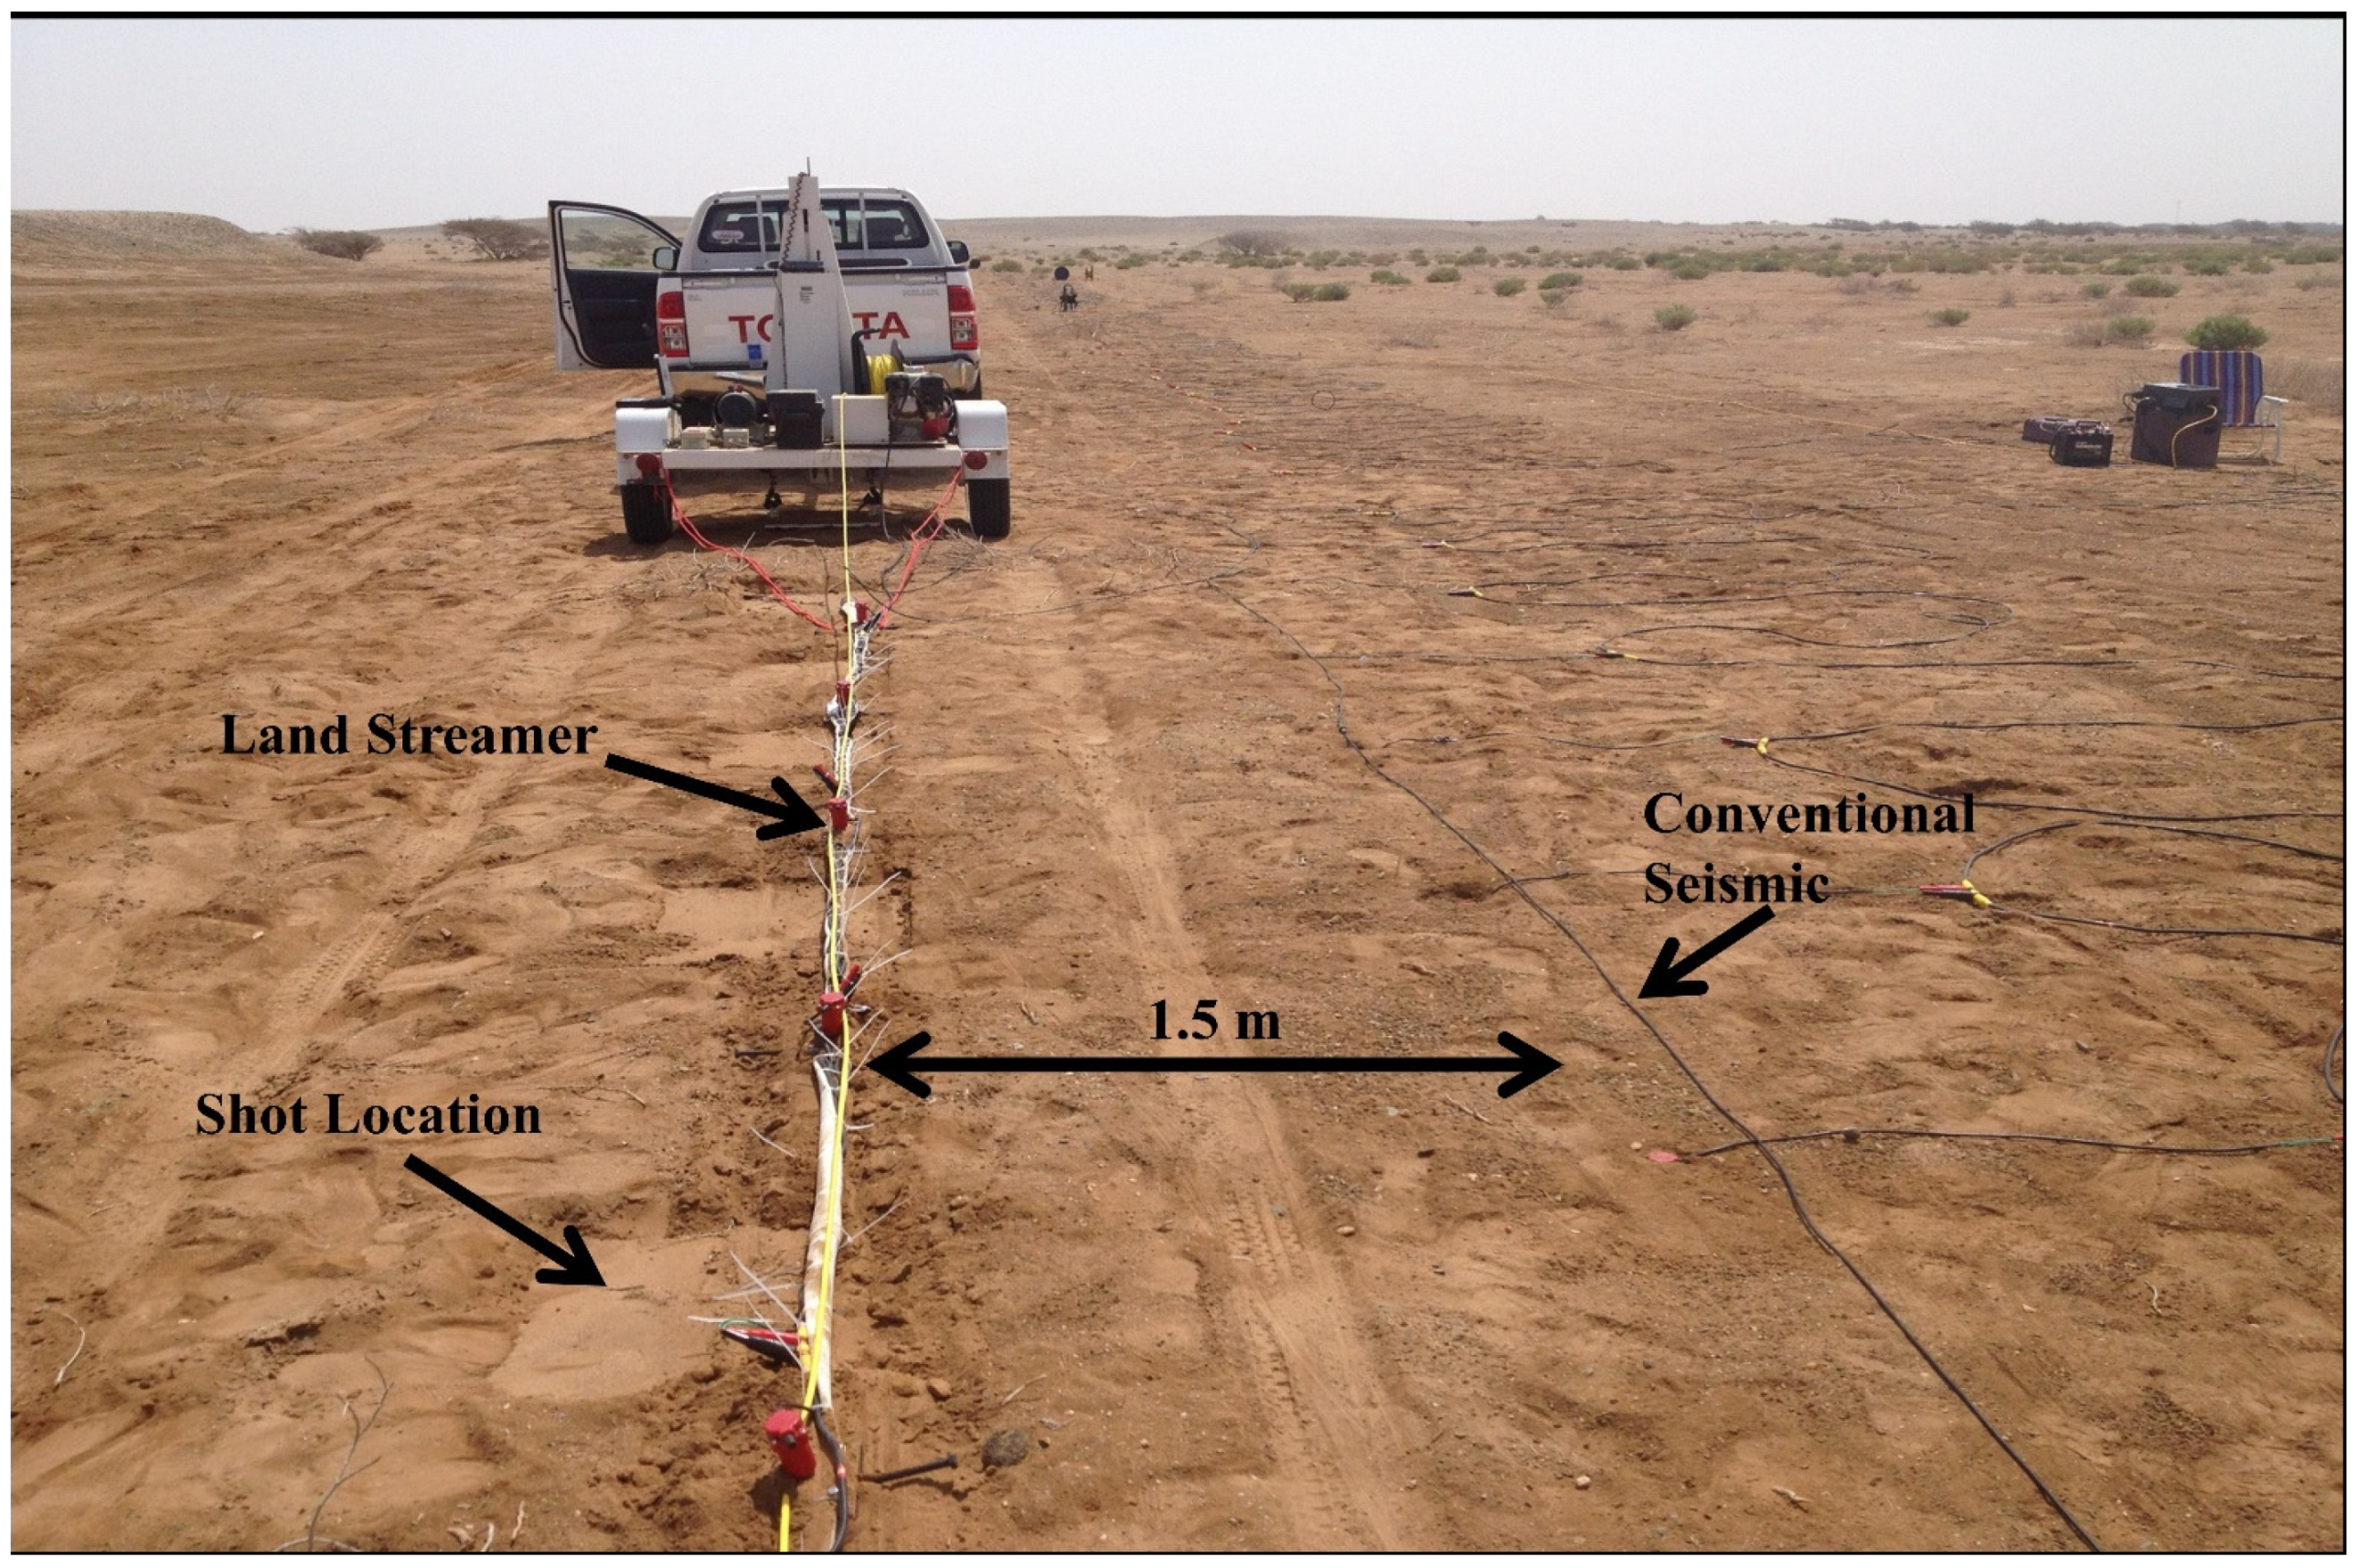
We used this land-streamer to record seismic data at Qademah Village, north of Jeddah, KSA. A conventional seismic profile is also recorded at the same location of the land-streamer profile for comparison (
Figure 2). The conventional seismic profile consists of 96 channels with a 127.5 cm receiver interval. A total of 96 shot gathers are recorded where one shot is located at each receiver location; 96 shots are also recorded using the land-streamer system, however, only shot gathers 49 to 96 can be compared to the conventional data.
4. Land-Streamer vs. Conventional Data
We now compare the recorded land-streamer traces with the recorded corresponding traces from the conventional seismic data set.
4.1. Installation Time
Land-streamer seismic surveys require less installation time when compared to conventional seismic surveys since the receivers and cables are already assembled, and no receiver planting is required. In this field test, it took around 20 min to set up the land-streamer system, while planting 96 channels and connecting them to the recording system took around 120 min.
In addition to the installation time, we also save a lot of time in collecting the equipment after the data acquisition. Land-streamer only needs a few minutes (less than 15 min) to collect the streamer and move to the next acquisition site, while the conventional system requires at least one hour to collect all cables and receivers from the site. Hence, in total, land-streamer survey saves about 80% of the acquisition time, which is used for planting/collecting equipment in the field.
In the case of recording long seismic profiles, land-streamer is very efficient in operation. To record a very long conventional data set, we need to divide the profile into several segments, plant the receivers and connect the cables for each segment, collect receivers and cables after shooting each segment, which is very time consuming, while all of this is not required in the land-streamer survey.
In summary, (1) the time required to install and collect the land-streamer system is 4 to 6 times less than the time required to install and collect the conventional system. (2) in the case of long profiles where the conventional system must be installed and moved several times to cover the whole profile, the land-streamer is much more efficient and will save days of field-work.
4.2. Trace Comparison in Time-Offset Domain
One conventional and one land-streamer shot gathers are shown in
Figure 3a,b, respectively. Traces of both shot gathers show a very good agreement with each other. Both first arrivals and later arrivals are very similar. The land-streamer traces (
Figure 3b) show a slightly lower signal-to-noise ratio (SNR), especially before the first break and at large source-receiver offsets (traces 1 to 6 at offsets 52.3 to 60 m from the first trace); however, the first break and later arrivals are easily recognized in both shot gathers.
4.3. Trace Comparison in Frequency-Offset Domain
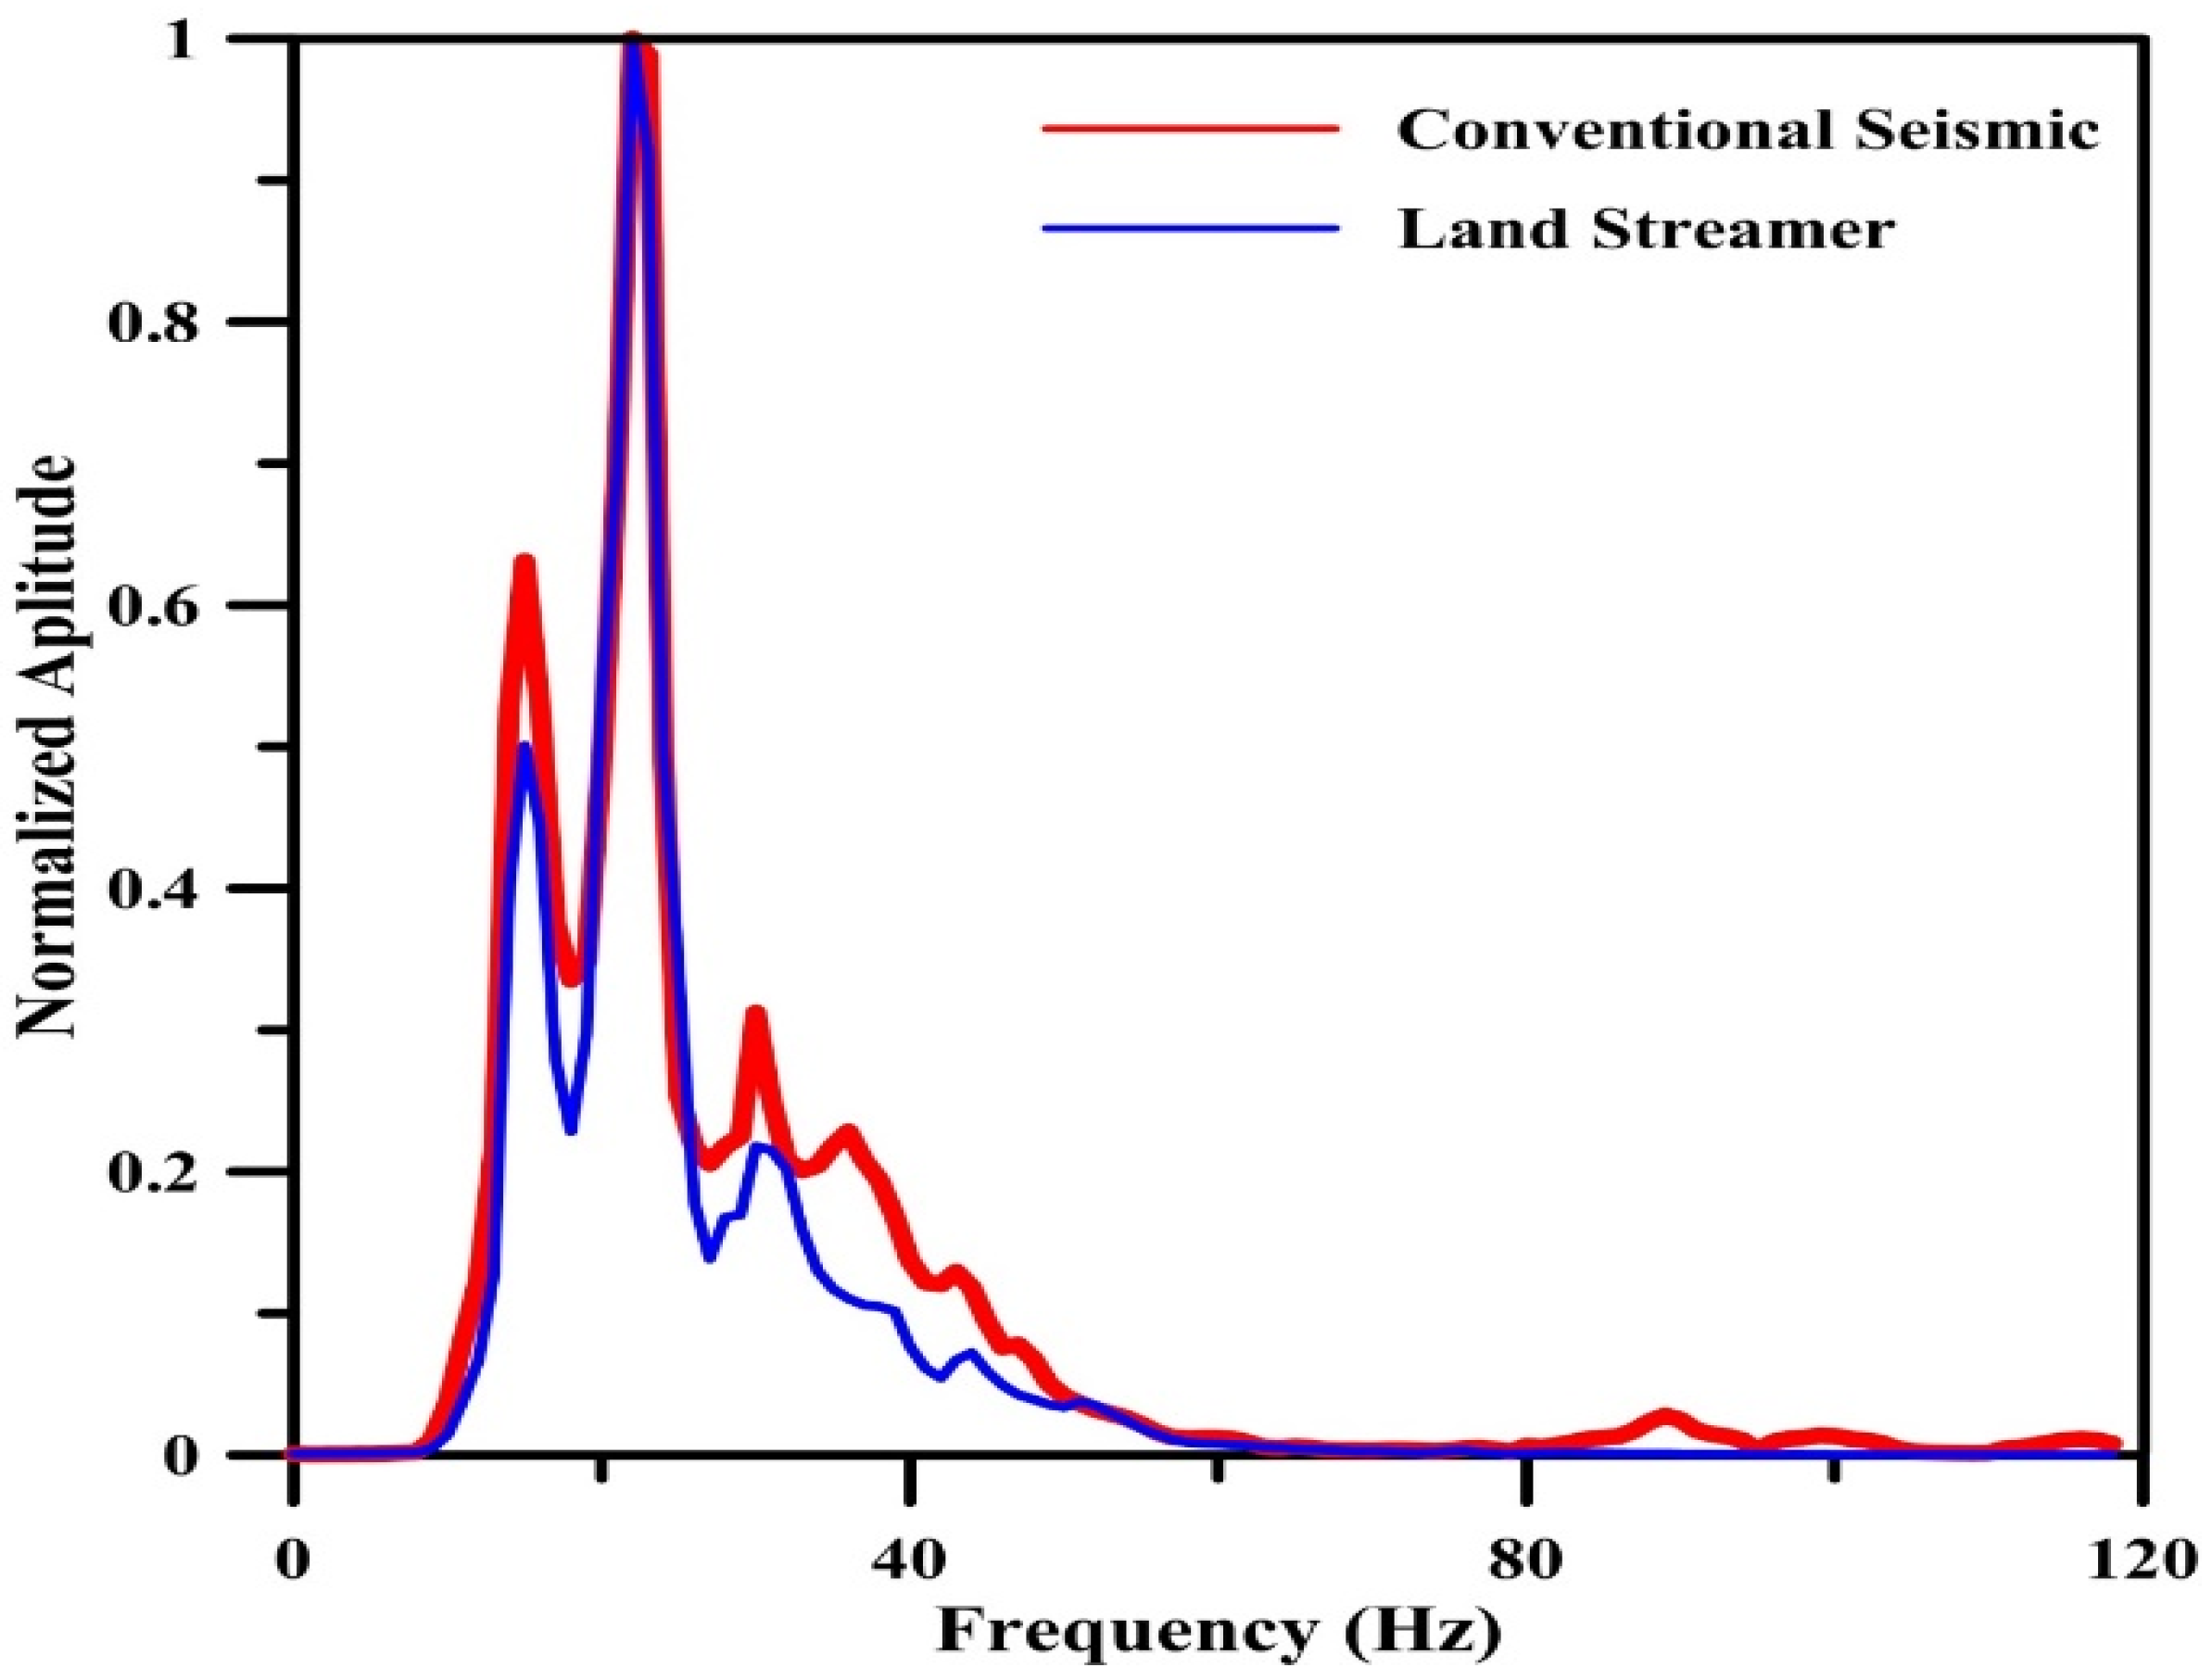
The amplitude spectra of the conventional and land-streamer data sets are shown in
Figure 4. Here, we show the normalized summation of amplitude spectra of all traces in shot gather no. 74 (
Figure 3). Both data sets show almost the same frequency content with peaks at the same frequency values (17 and 22 Hz). However, the conventional seismic data set contains more energy, especially at frequencies higher than 30 Hz. This is probably due to the better coupling of conventional receivers with the ground.
4.4. Trace Comparison in Frequency-Wavenumber Domain
Shot gather no. 74 for both the conventional and land-streamer data sets are converted to the frequency-wavenumber (
F−κ) domain (
Figure 5). Both spectra show that the frequency content of both data sets are similar, especially for the low-frequency part. The differences between the spectra in
Figure 5a,b could be due to the better coupling of the conventional receivers with the ground.
4.5. First-Arrival Traveltimes
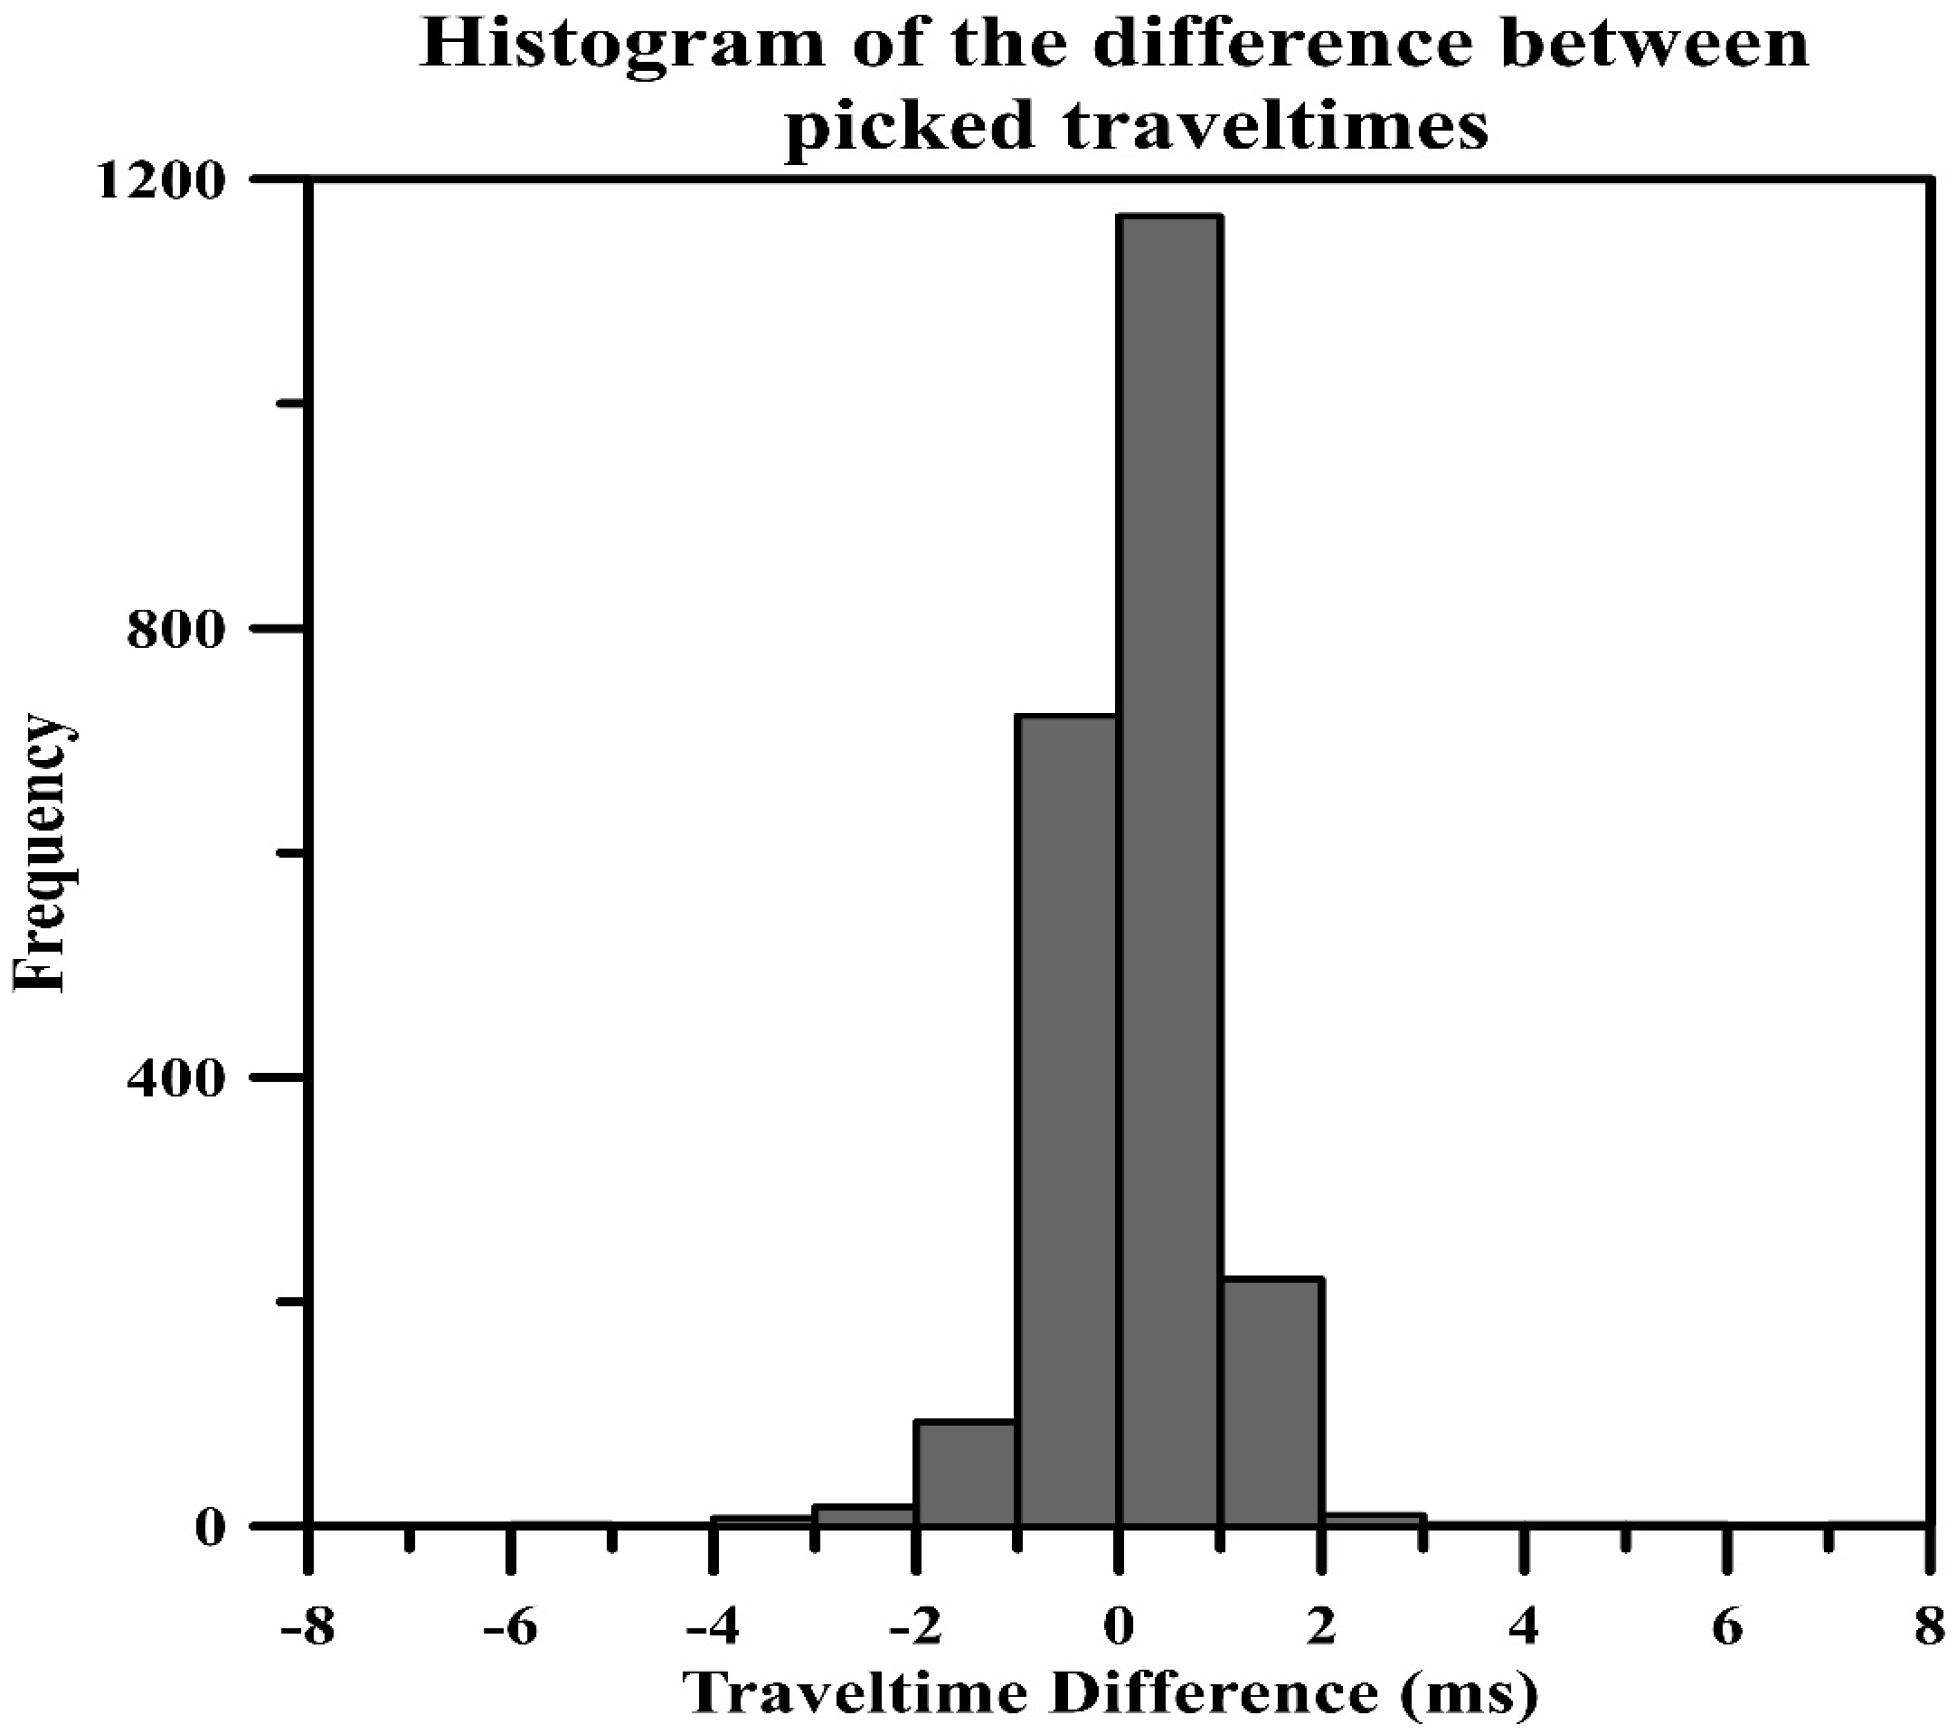
The first arrival traveltimes for both conventional and land-streamer data sets are picked and compared to one another. To compare both data sets together we subtracted the conventional picks from the land-streamer picks, then presented the difference in the histogram shown in
Figure 6. The two sets of traveltime picks agree with one another, most of the picks (82%) are almost identical with a difference of less than ±0.5 ms, however, there are some picks (18%) with an error within about ±4 ms (
Figure 6), which is smaller than T/10 for the 22 Hz data (T = 45 ms) and T/14 for the 17 Hz data (T = 58 ms), where T is the dominant period of the source wavelet. This is much smaller than the accepted error margin of T/4. This close agreement suggests that the associated traveltime tomograms should be similar.
5. Numerical Simulation Test
In the previous section, we showed that the seismic traces recorded using the land-streamer setup is in very good agreement with those recorded using a conventional setup, not only in the time domain (
Figure 3) but also in the frequency content (
Figure 4 and
Figure 5). On top of that, the traveltime picks of both data sets are almost identical for most of the picking (
Figure 6) with a maximum error of ±4 ms, which is much smaller than the accepted error. However, this doesn’t show the effect of the acquisition setup on the accuracy of the final subsurface velocity model.
In this section, we will cover this point using a synthetic simulation. Here, we will show the effect of using conventional setup vs. land-streamer setup on the shallow and deep geological structure and local anomalies.
Figure 7 shows the synthetic velocity model used in this simulation. The model is 450 m long by 85 m deep. It shows 4 subsurface layers; all having a flat boundary and homogenous velocities. The velocity and thickness values are shown in
Table 1. In this model, we used horizontal layers with homogeneous velocities to focus only on the effect of local anomalies. We added four local anomalies at offsets 50 m, 150 m, 250 m, and 350 m with a velocity of 400 m/s. The sizes of these anomalies are gradually increasing in both spatial and vertical dimensions (
Table 2), and all of them have the shape of half an oval. All four local anomalies are located within the first layer, which represents the weathering layer in this synthetic model.
The synthetic first arrival traveltimes are calculated using an algorithm based on the finite-difference solution of the Eikonal equation [
43].
5.1. Conventional Data Sets
To simulate a conventional data setup, we assumed that the sources and receivers are placed on the ground surface at equal offsets, and there is one source at each receiver point. For the conventional data, we generated three different source-receiver layouts; the first has a source interval (ds) and a receiver interval (dg) equal to 1m, the second has ds and dg equal to 2 m, and the third has ds and dg equal to 5 m. In shallow application conventional surveys, the ds and dg are usually 2 to 5 m, however, we added the 1 m interval to compare it with the land-streamer data that will be discussed in the next section.
The calculated traveltimes are then inverted to generate the traveltime tomograms shown in
Figure 8. The total number of iterations is 23, and the minimum root mean squares (RMS) error is 8 ms.
The three tomograms (
Figure 8) failed to show the fourth layer (5000 m/s) due to the short profile length. We believe that a longer profile would detect the fourth layer; however, we did not repeat the simulation with a longer profile since our target was detecting the shallow anomalies at depths less than 20 m. The first and second refractors (red- and blue-lines in
Figure 8) are detected using the conventional setup, the velocity values, and the thicknesses of layers 1 to 3 are close to the correct values; however, the refractors are shown on the synthetic velocity models (
Figure 7) as horizontal lines, while in the tomogram it appears as irregular refractors. These irregularities in the refractor are caused by the presence of shallow near-surface anomalies.
The three local anomalies (B, C, and D) are shown on the three tomograms (
Figure 8a–c), however, their sizes are larger than the actual sizes shown in
Figure 7 and
Table 2, for example, the thickness of anomaly (D) is 20 m, however, it is shown as 27 m in the tomograms. Due to the increase in the size of the anomaly at the final tomogram, we missed the local anomaly (A) in all three tomograms.
Although all four local anomalies are disconnected in the true velocity model (
Figure 7), they are shown as one layer (connected) in the tomograms with irregular bottom, these irregularities reflect the shape and location of the local anomalies. This might lead to an inaccurate interpretation of the subsurface geology.
5.2. Land-Streamer Data Sets
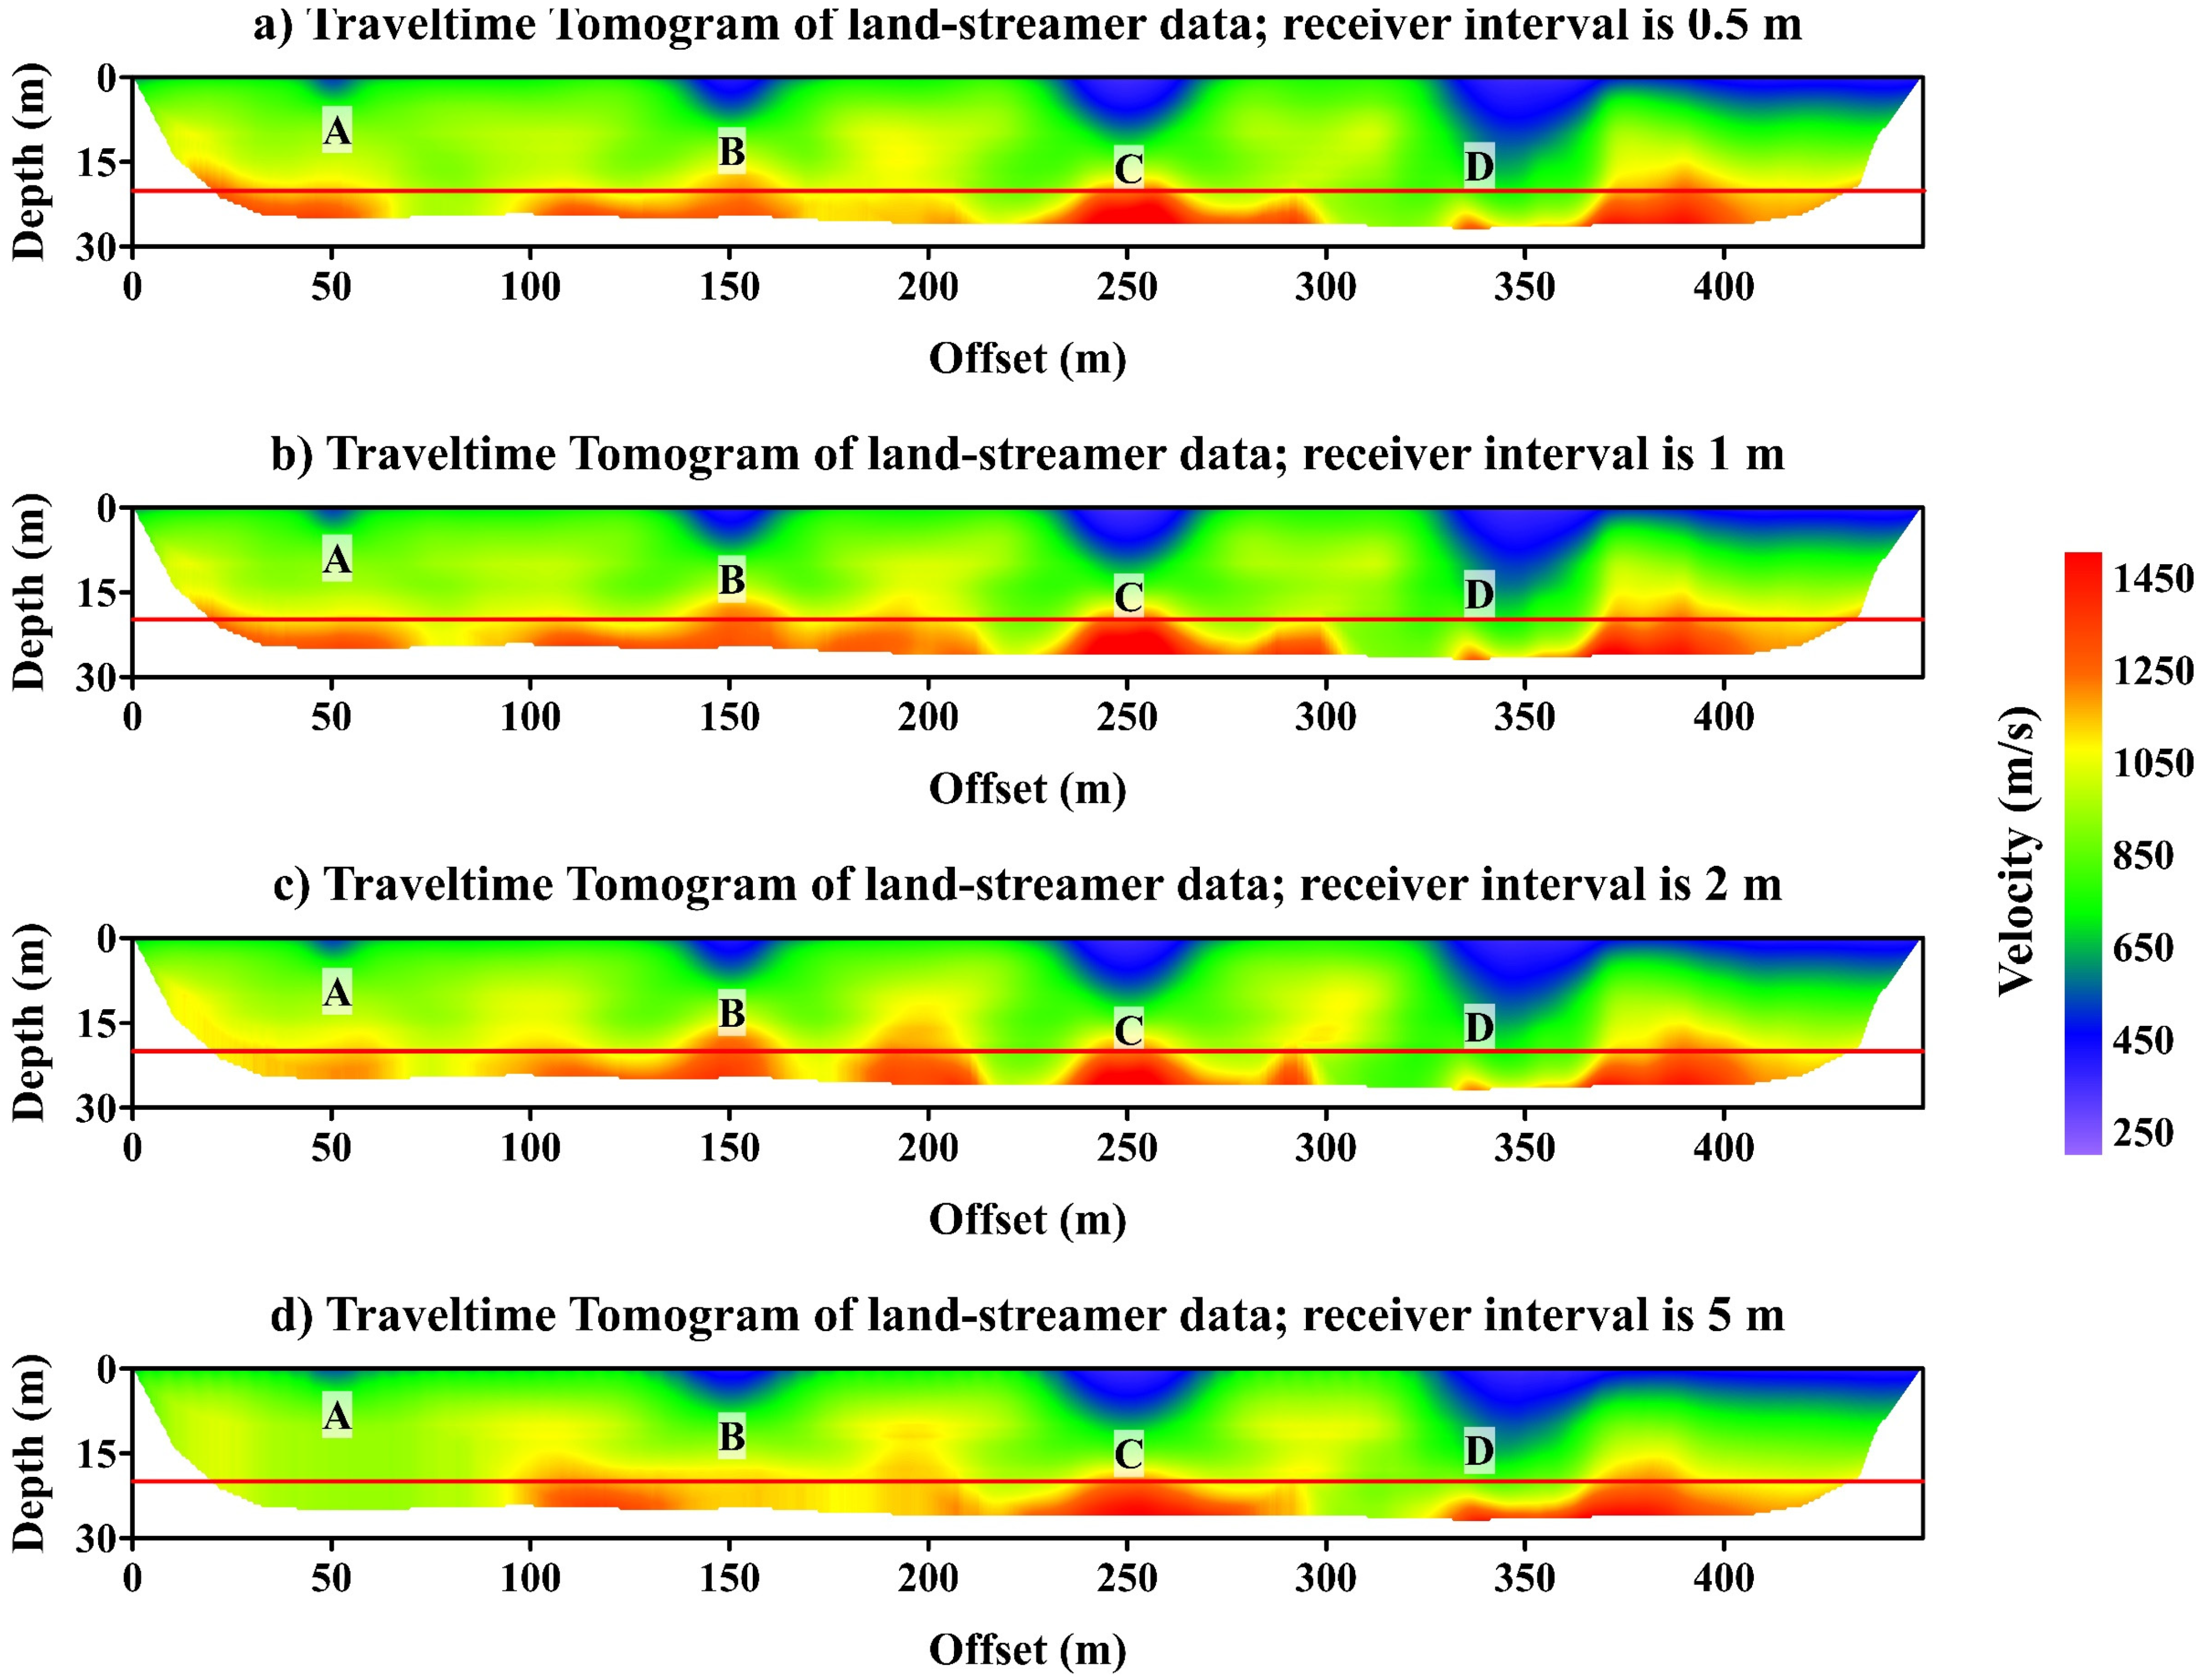
We generated four different land-streamer data sets where the shot and receiver intervals are 0.5 m, 1.0 m, 2.0 m, and 5.0 m, respectively. In standard land-streamer data, the receiver interval should be ranging between 0.5 and 2.0 m. In this simulation, we added the 5.0 m to compare its results with that of the conventional data set (
Figure 8c). In the land-streamer data, only receivers at offset ≤ 100 m from the source point are alive and all receivers are located to the right of the shot point. This setup decreased the number of calculated traces relative to the conventional setup, which affect the number of equations in the inversion process. For example, in the case of 1.0 m shot and receiver intervals, the conventional data has 450 shot gathers, each has 450 receivers, hence the number of calculated traces is 202,500 traces, while the land-streamer data has 350 shot gathers that each has 100 receivers, hence the total number of calculated traces is 35,000.
Figure 9 shows the traveltime tomograms of the land-streamer simulation after 23 iterations. Here, we used the same inversion parameters as in the conventional setup case, and the minimum RMS error was about 2.3 ms. The maximum penetration depth is 29 m, which is less than the conventional data set. This is expected since the maximum source-receiver offset in the land-streamer data is 100 m while in the conventional data is 450 m.
The refractor between the first and the second layers is shown in all tomograms (red line in
Figure 9), but the shape of the refractor is also affected by the shape of the overburden anomalies. The main advantage of the land-streamer setup, as shown in
Figure 9, is the accurate mapping of the four local anomalies. All four local anomalies are shown on the correct position with the correct shape and correct velocity values in the case of source and receiver offsets of 0.5 m, 1.0 m, and 2.0 m, while in the 5.0 m anomalies B, C, and D are correctly shown on the tomogram, while anomaly A is too weak relative to the other three tomograms. This is expected since the shot and receiver interval in the case of
Figure 9d is equal to the thickness of the anomaly and half its width. The four local anomalies are shown on the land-streamer tomograms as four separate bodies, which is more accurate than the result of the conventional setup.
The two synthetic simulations shown in
Figure 8 and
Figure 9 show that the seismic conventional setup would reach a larger depth relative to the land-streamer setup, however, the land-streamer setup would detect shallow local anomalies better than the conventional setup.
6. Discussion
This study shows a comparison between the conventional and land-streamer setup for recording field seismic data. The comparison listed here can be divided into two main parts: (1) data comparison and (2) result comparison.
The data comparison shows that both conventional and land-streamer traces have the same signal-to-noise ratio (SNR), same data quality in the time, frequency, and wavenumber domains. However, the conventional setup is characterized by higher SNR at larger offsets. From our experience, the SNR of land-streamer data depends on several factors, such as the weight of the receiver plates, the terrain of the ground surface, and the source used in the data recording. In general, source-receiver offset in land-streamer surveys should not exceed 300 m (150 m is a common land-streamer length) unless in special cases such as sites with very low attenuation or when using a strong seismic source.
For shallow applications, the land-streamer setup has more advantages than conventional setup; it saves time during installing and collecting equipment as well as covers larger areas in much shorter time relative to conventional setup; note that the data quality is almost the same; hence, the land-streamer setup would be preferred in such cases. The main shortage in a land-streamer survey is that the maximum penetration depth is smaller than the conventional survey.
In terms of result comparison, despite that the conventional setup has more data and deeper penetration, we noticed that the land-streamer survey yields better results in shallow depth relative to the conventional setup (see
Figure 8 and
Figure 9) even if we used the same source and receiver offsets. For example,
Table 3 shows a comparison between the tomogram generated from the conventional setup (
Figure 8a) and that generated from a land-streamer setup (
Figure 9b).
The numbers shown in
Table 3 are in favor of the conventional setup; (1) more picks, (2) larger source-receiver offset, and (3) larger penetration depth, however, the tomogram of the land-streamer (
Figure 9b) shows a better mapping of the near-surface anomalies relative to the conventional tomogram (
Figure 8a), which is also true in case of source and receiver offsets 2.0 m and 5.0 m.
Table 4 and
Table 5 show a numerical comparison between the conventional tomogram vs. true model (
Table 4) and the land-streamer tomogram vs. the true model (
Table 5). Both comparisons are conducted with respect to the result of the 1m geophone interval, i.e., the conventional tomogram shown in
Figure 8a, and the land-streamer tomogram shown in
Figure 9b. Results in
Table 4 shows that:
Anomaly A is not shown at the conventional-seismic tomogram
The center position of the local anomalies B, C, and D has no errors
The errors in imaging the anomalies’ width are ranging between 77% and 145%
The errors in imaging the anomalies’ thickness are ranging between 35% and 50%
All four local anomalies are shown at the land-streamer-seismic tomogram
The center position of all local anomalies has no errors
The errors in imaging the anomalies’ width are ranging between 5% and 12%
The errors in imaging the anomalies’ thickness are ranging between 10% and 20%
This numerical comparison clearly shows that the land-streamer can detect the near-surface local anomalies with higher accuracy relative to the conventional seismic data.
In terms of velocity values, the conventional tomogram shows that the local anomalies and the first layer are merged in one layer with irregular bottom and a velocity of 700 m/s to 750 m/s, which is a value between the true velocity of the local anomalies (400 m/s) and the true velocity of the first layer (800 m/s). The second layer at the conventional tomogram has a velocity ranging between 1400 and 1550 m/s, and the third layer shows a velocity of 2500 m/s or greater. The land-streamer tomogram successfully differentiated between the local anomalies and the first layer. The seismic velocity of the local anomalies at the land-streamer tomogram is ranging between 430 and 450 m/s, while the seismic velocity of the first layer is ranging between 850 and 950 m/s. The seismic velocity of the second layer is ranging between 1300 and 1500 m/s. In summary, the conventional tomogram successfully showed the third layer and the correct velocity values of the second and third layers but failed to differentiate between the first layer and the local anomalies, while the land-streamer tomogram successfully showed the local anomalies, first layer, and second layer with correct thickness and velocity values, but was not able to detect the third layer due to its limited depth of penetration.
The differences between the conventional and land-streamer results can be explained as follows; the land-streamer raypaths are shorter than those of the conventional surveys, hence, the inversion algorithm will not be affected by the high-velocity values at a deeper depth. However, in the conventional setup case, the long raypaths will be smeared along many velocity cells, some of them are at shallow depths while the others are at deep depths, hence, the effect of the high-velocity values at the deep depths will contaminate the low-velocity values at the shallow depth and vice versa. This phenomenon will decrease the accuracy of the tomogram, especially at shallow depths.
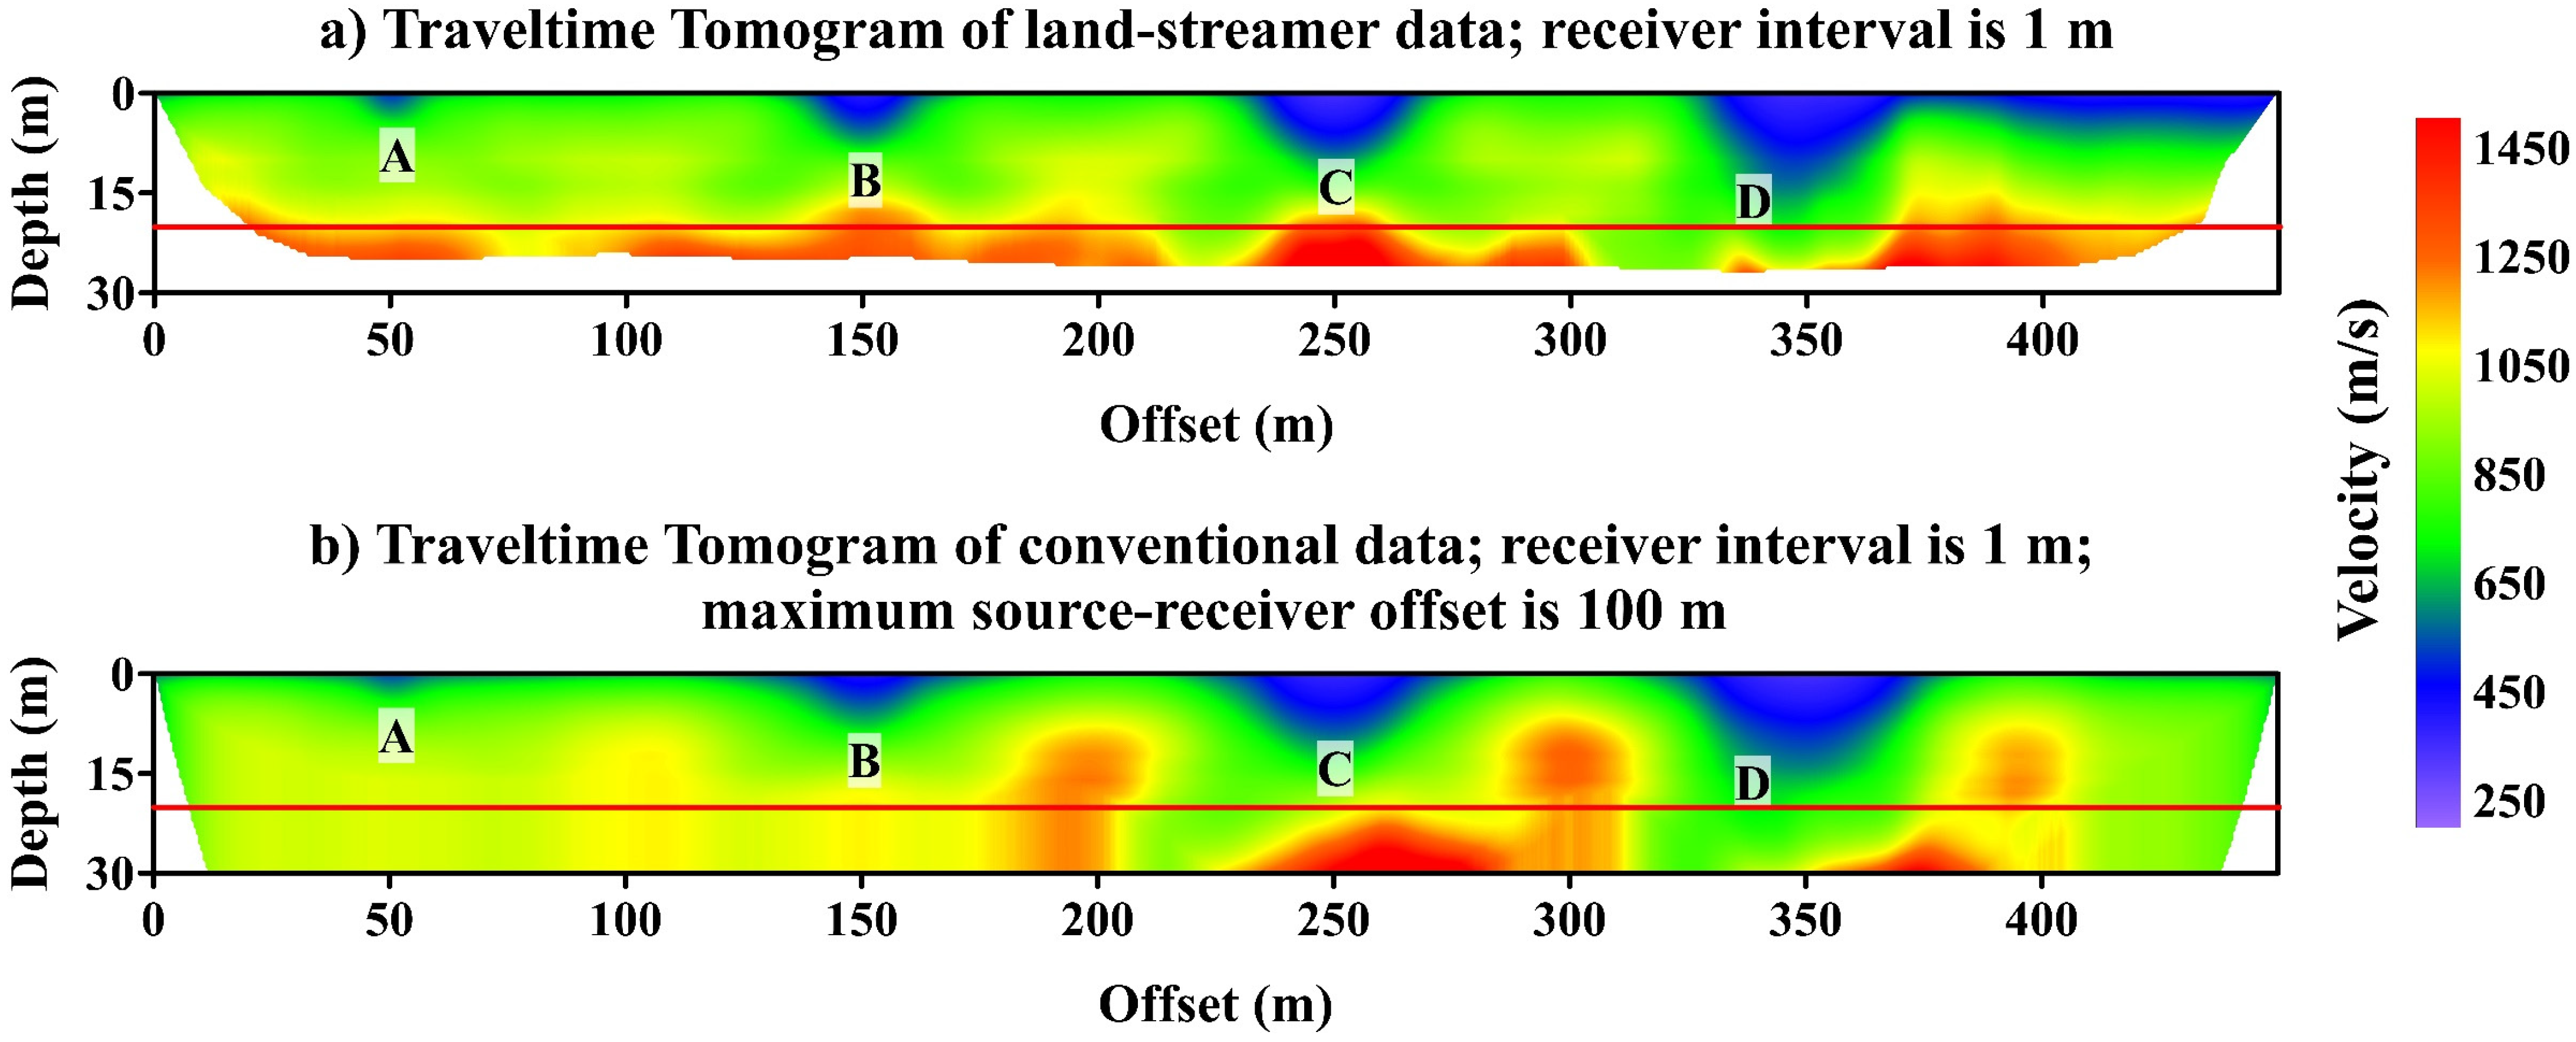
One final comparison is made between the land-streamer 1-m receiver-interval data (
Figure 10a) and the conventional 1-m receiver-interval data (
Figure 10b) after limiting the maximum source-receiver offset of the conventional data to 100 m at both sides of the shot point. The two tomograms show that the four local anomalies can be detected with similar shapes and sizes. However, the conventional tomogram shows better imaging of layer 1, especially between offsets 360 m and 450 m where the land-streamer tomogram shows a wrong low-velocity anomaly, and the conventional tomogram did not show it. The land-streamer shooting contains single-direction shots, while the conventional data characterize by shooting from both sides, which increased the resolution of the tomogram, as shown in
Figure 10b. It is possible to add another shot at the other end of the land-streamer to record shooting from both directions, however, it will slow the acquisition rate.
The recommendation of one survey setup over the other depends on the target of the survey. In general, if the survey target is reaching high depths, then a conventional setup is recommended, however, if the survey target is to get an accurate velocity model at a shallow depth, then the land-streamer setup is recommended.
Land-streamer is also recommended for engineering and environmental applications. For static corrections required in deep reflection application, the land-streamer could be a very good solution to cover large areas with high accuracy in a very short period of time, however, this claim requires more studies to prove that it is correct.
7. Conclusions
In this paper, we compared the conventional setup versus the land-streamer setup to record near-surface seismic data. Our results show that both setups have the same data quality, however, the land-streamer gives better results in the near-surface zone relative to the conventional setup.
The two setups are compared in terms of time, frequency, and wavenumber domains. A synthetic velocity model is used to generate three simulations for the case of conventional setup and four simulations for the land-streamer setup.
The calculated first arrival traveltimes of all seven simulations are then inverted to generate the corresponding subsurface tomograms. The subsurface tomograms show that the conventional setup successfully reached a depth of 80 m from the ground surface, though failed to identify the correct shape of the local anomalies. The velocity-tomogram of the conventional setup located three of the four local anomalies, however, with large errors in imaging both anomalies’ width and thickness. The errors in imaging the anomalies’ width are ranging between 77% and 145%, while the errors in imaging the anomalies’ thickness are ranging between 35% to 50%. On the other hand, the land-streamer setup successfully identified the correct shape, position, and velocity of all four local anomalies but failed to reach a depth more than 30 m from the ground surface. The errors in imaging the anomalies’ width in the land-streamer case are ranging from 5% to 12% and the errors in imaging the thickness is ranging between 10% and 20%, which are much smaller than that for the conventional setup.
It is worth noting that the land-streamer shooting contains single-direction shots. It is possible to add another shot at the other end of the land-streamer to record shooting from both directions, and, hence, increase the accuracy of the subsurface imaging. However, it will slow the acquisition rate.
We recommend using the land-streamer setup in case of shallow applications such as engineering and environmental. It could also be successful in static corrections for deep reflection applications.
