Abstract
Regular scaffolding quality inspection is an essential part of construction safety. However, current evaluation methods and quality requirements for temporary structures are based on subjective visual inspection by safety managers. Accordingly, the assessment process and results depend on an inspector’s competence, experience, and human factors, making objective analysis complex. The safety inspections performed by specialized services bring additional costs and increase evaluation times. Therefore, a temporary structure quality and safety evaluation system based on experts’ experience and independent of the human factor is the relevant solution in intelligent construction. This study aimed to present a quality evaluation system prototype for scaffolding parts based on computer vision. The main steps of the proposed system development are preparing a dataset, designing a neural network (NN) model, and training and evaluating the model. Since traditional methods of preparing a dataset are very laborious and time-consuming, this work used mixed real and synthetic datasets modeled in Blender. Further, the resulting datasets were processed using artificial intelligence algorithms to obtain information about defect type, size, and location. Finally, the tested parts’ quality classes were calculated based on the obtained defect values.
1. Introduction
In the construction industry, accidents are not uncommon and lead to many dangerous situations, including fatalities. One of the causes of accidents is the collapse of scaffolding, which occurs due to poor quality. According to the Bureau of Labor Statistics’ Census of Fatal Occupational Injuries [1], more than 500 people died from scaffolding injuries in the United States between 2011 and 2018, an average of more than 65 people per year. In Korea, 241 people died from the same cause in 2019 [2]. Quality control of temporary equipment in Korea is under the general management and supervision of the Ministry of Employment and Labor, which oversees workplace safety in accordance with the Industrial Safety and Health Act. Nevertheless, a significant amount of scaffolding is reused without proper quality control, which affects the quality of construction work and its safety. Moreover, it is difficult to maintain and define performance standards for the distribution and use of temporary equipment [2]. Additionally, it is difficult for regulators and consumers to distinguish between illegal and defective products. It is also difficult for regulators and consumers to distinguish between illegal and defective products. Manufacturers and distributors of temporary equipment are often small and medium-sized companies that do not typically invest in safety and in improving the quality of temporary equipment. Construction companies might argue that building and operating AI in scaffolding could sharply increase costs. Indicators from other companies [3] that have implemented AI in their process confirm the effectiveness and benefits of the technology. Systems for monitoring the safety of workers [4], the safe movement of moving objects on the construction site [5], video analysis to eliminate unfavorable situations in production [6], video monitoring of product quality, monitoring the operation of production equipment, and work optimization of production personnel not only ensure the safety of workers, but also significantly improve the quality of work and the final product.
Currently, the evaluation of the quality of the scaffold is carried out only visually by people, as there are no technologies that ensure automation. However, quality control based on computer vision is successfully used in various fields. According to the indicators from other companies [3] that have implemented AI in their process, the effectiveness and profitability of the technology were confirmed.
There are several challenges to implementing automation in scaffolding inspection:
- The lack of a regulatory framework that defines the quantitative indicators of the extent of the deformation and its impact on the quality of the scaffold.
- The lack of technologies that allow the automatic detection of different types of deformations necessary for quality assessment, which can be combined into an overall assessment.
This study aimed to quantitatively and objectively improve the existing evaluation of scaffold quality using machine learning algorithms, which can avoid most human errors. In addition, our study presents and explains the first automatic defect detection solution for reused scaffold quality assessment based on 2D and 3D data. There are several important areas where the technologies in this study make an original contribution to the inspection of used scaffolds:
- Improvement of the existing inspection process by reducing the time for quality inspection and independence from human errors.
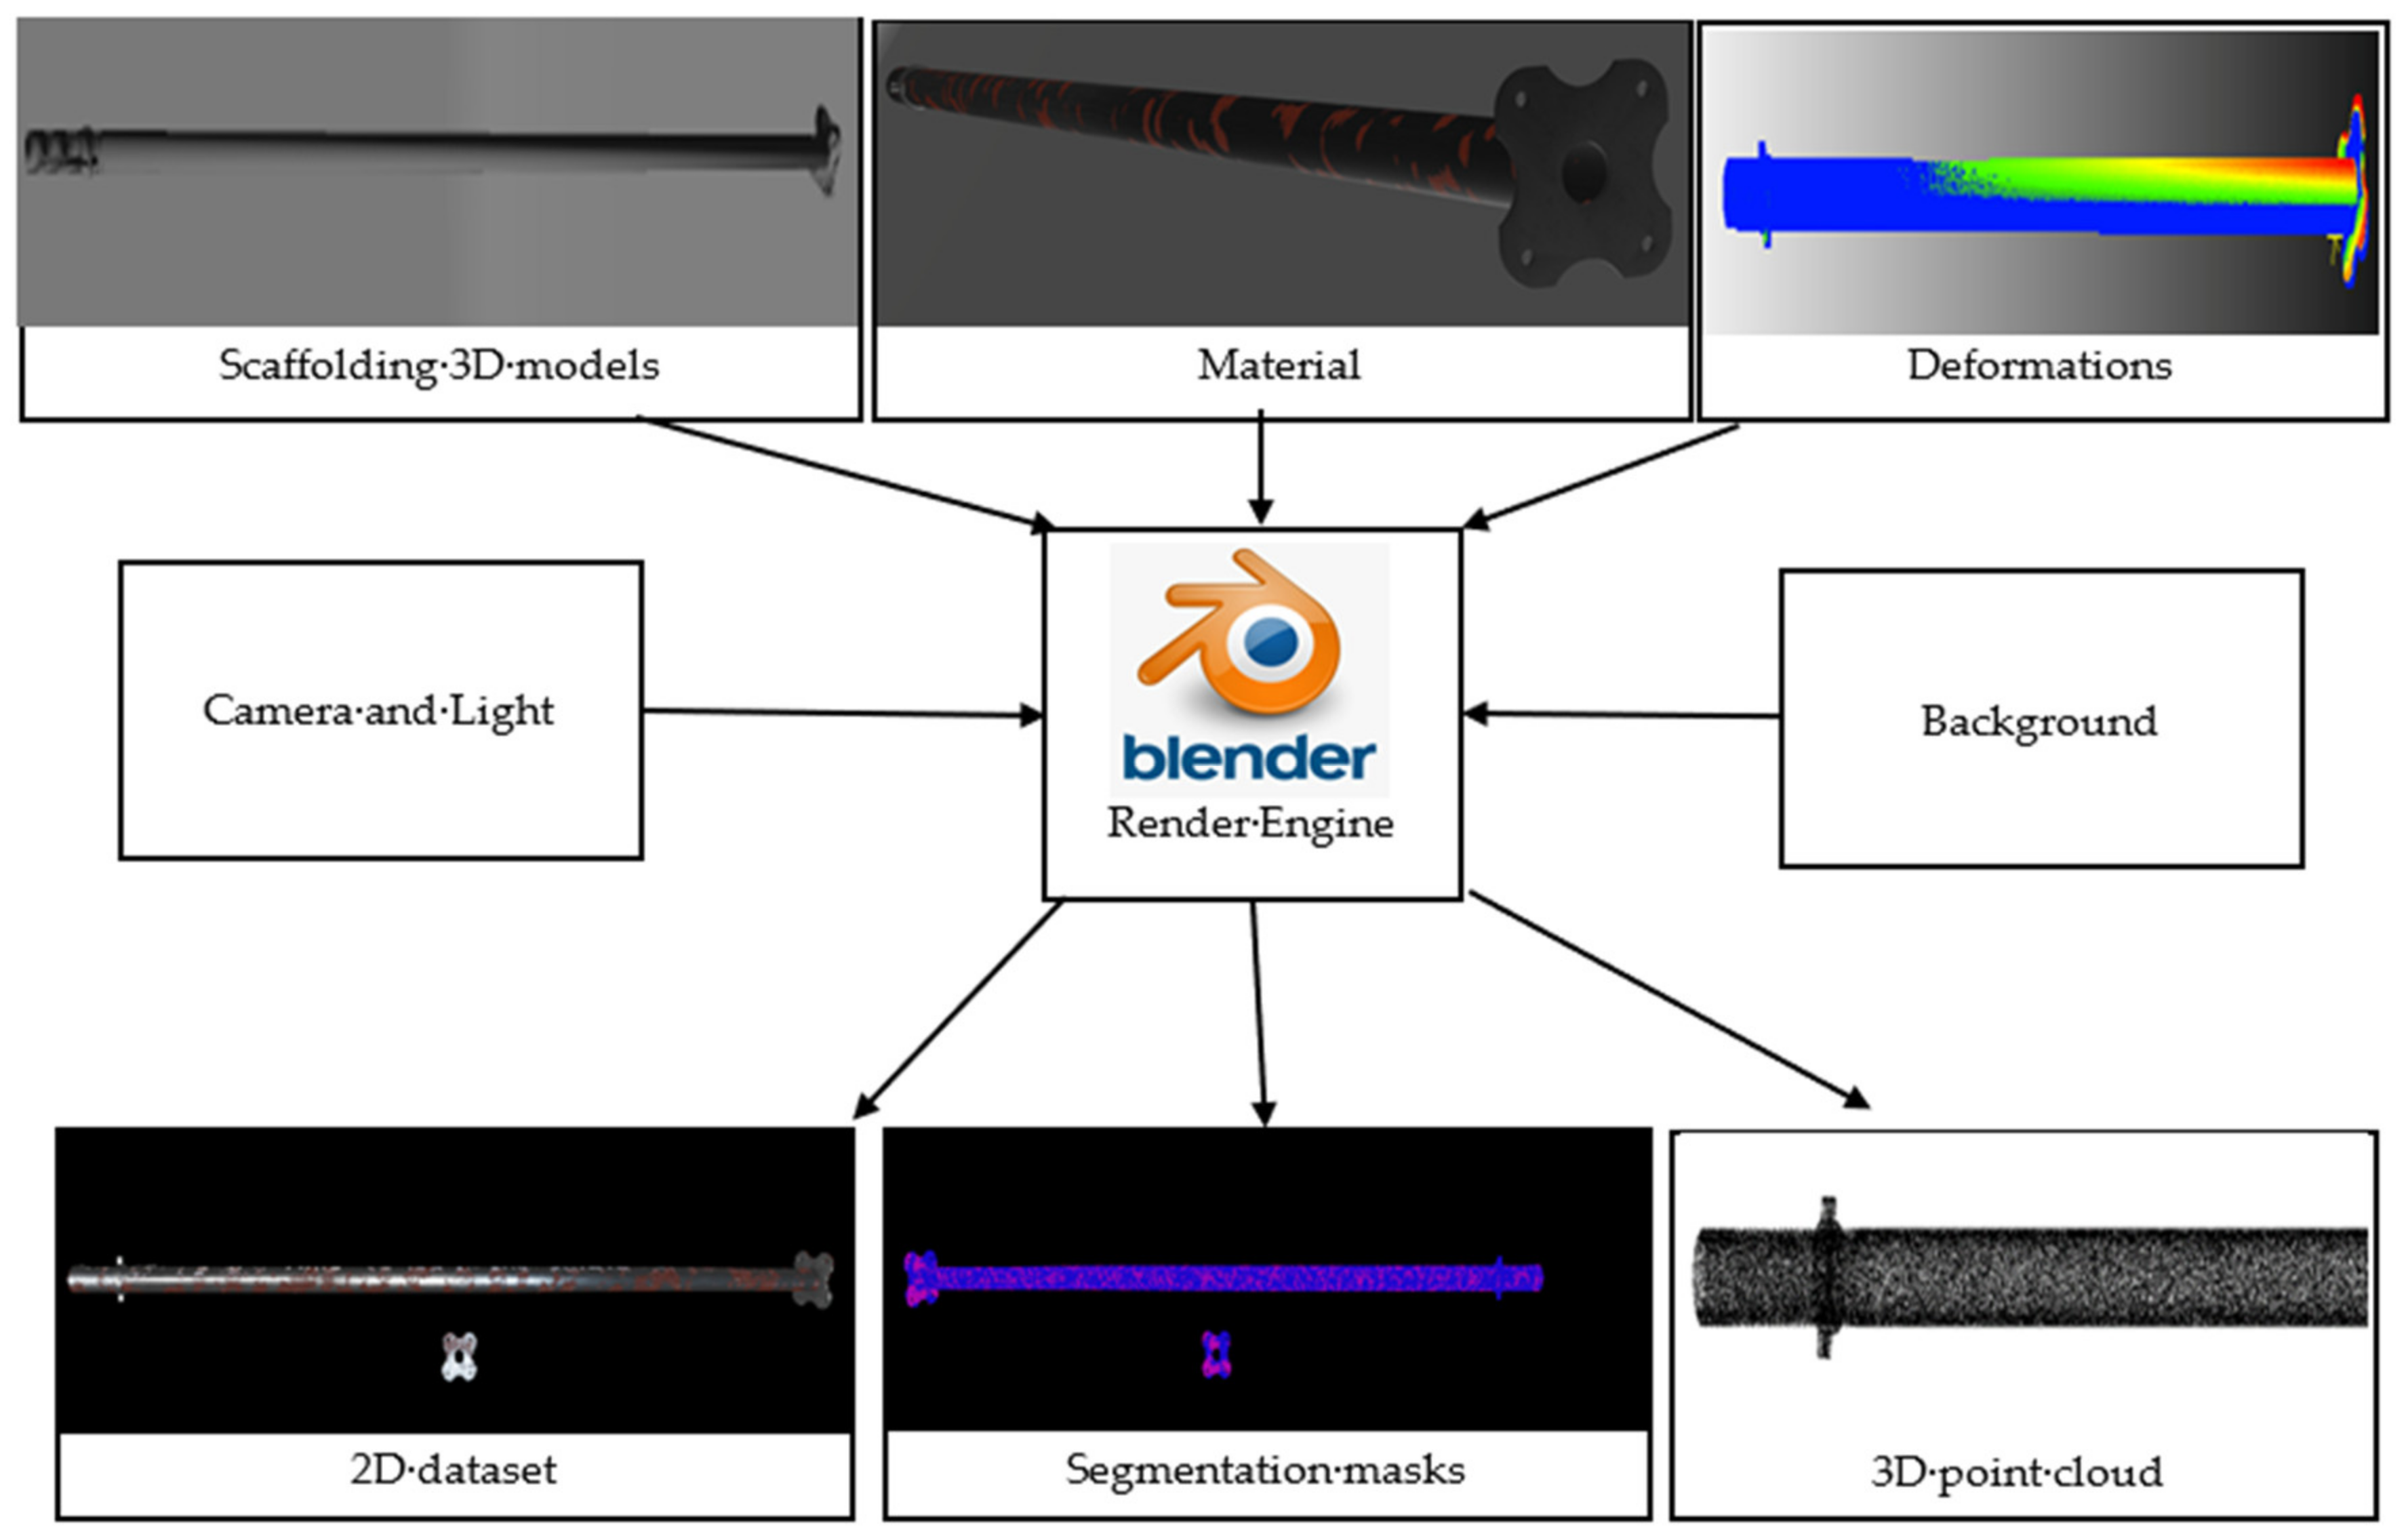
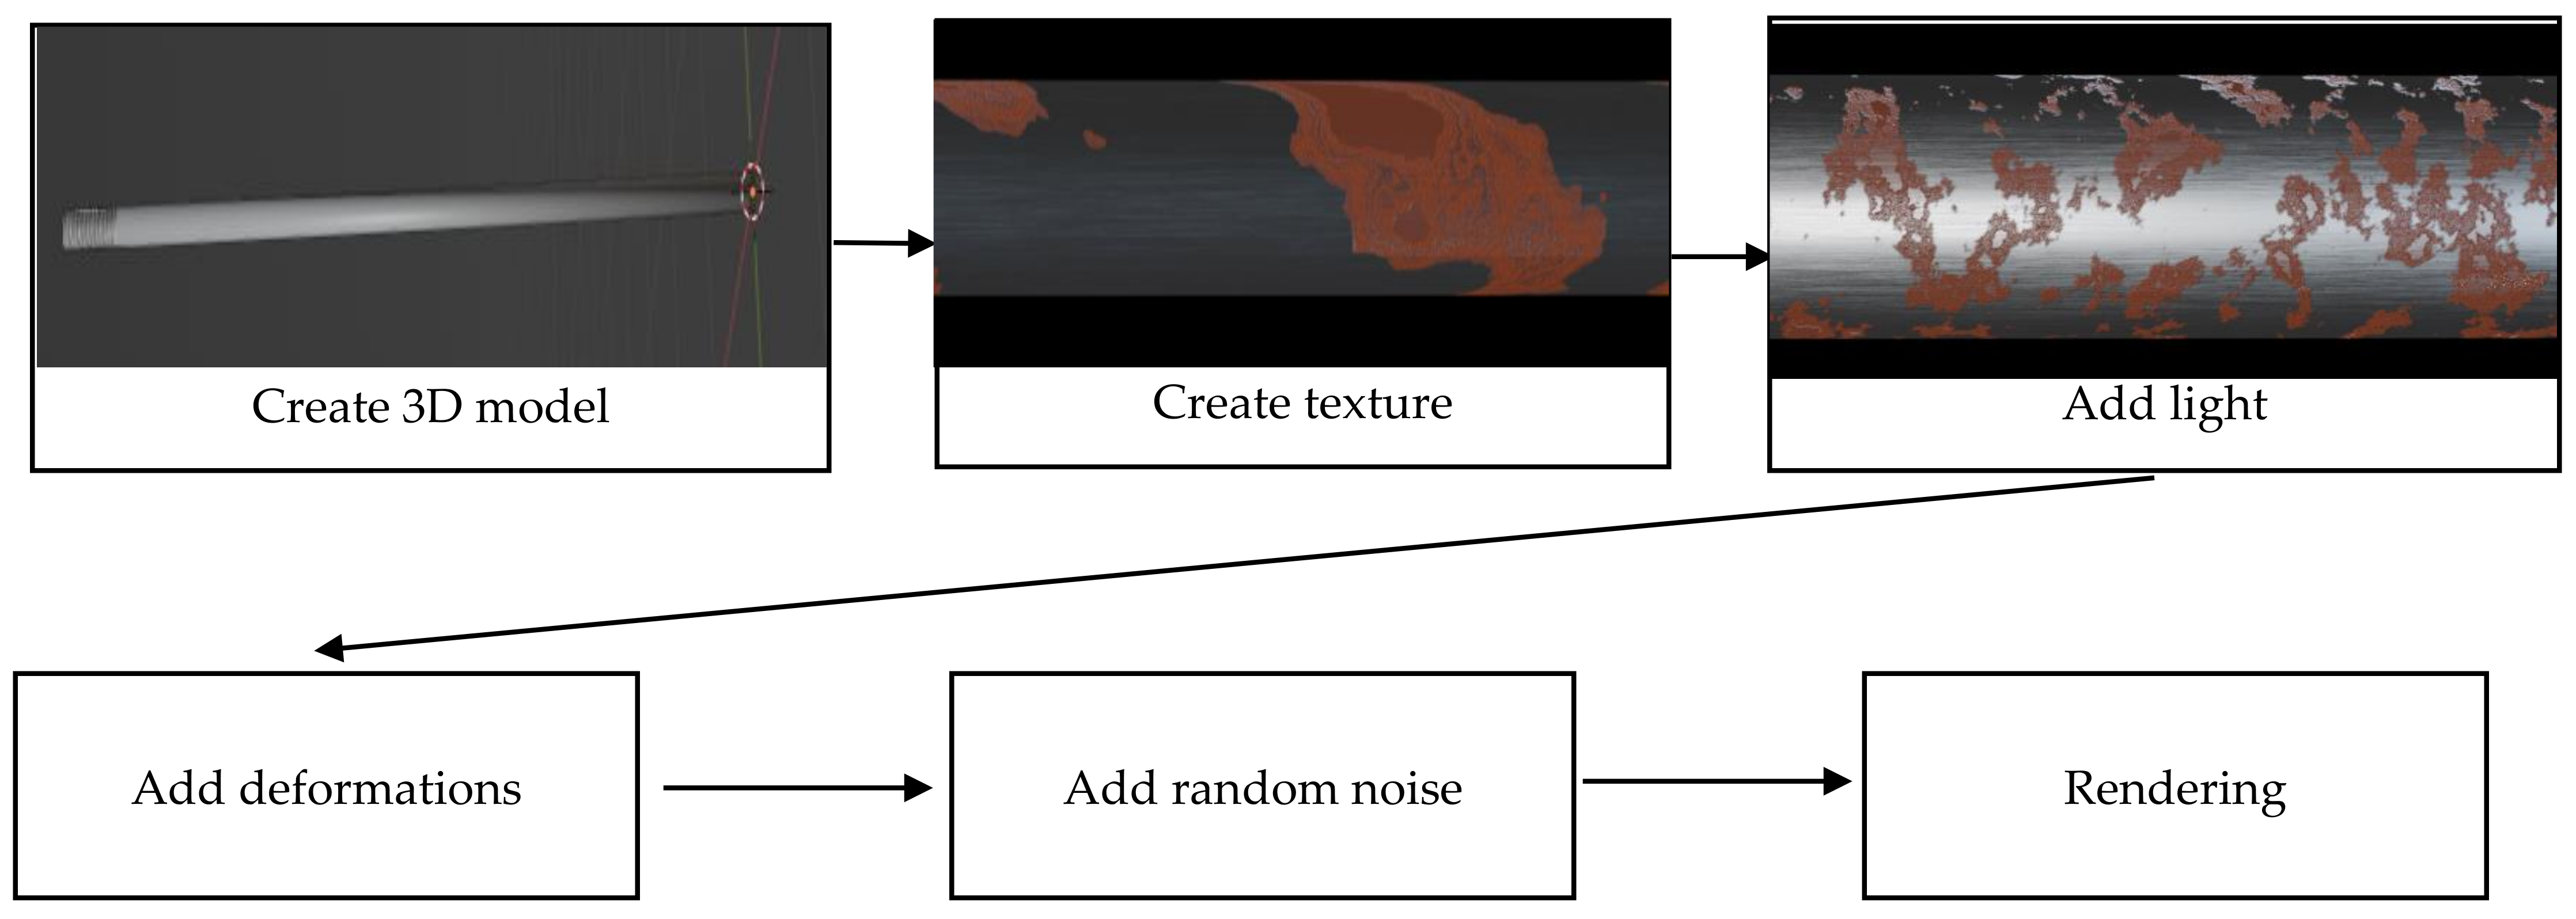
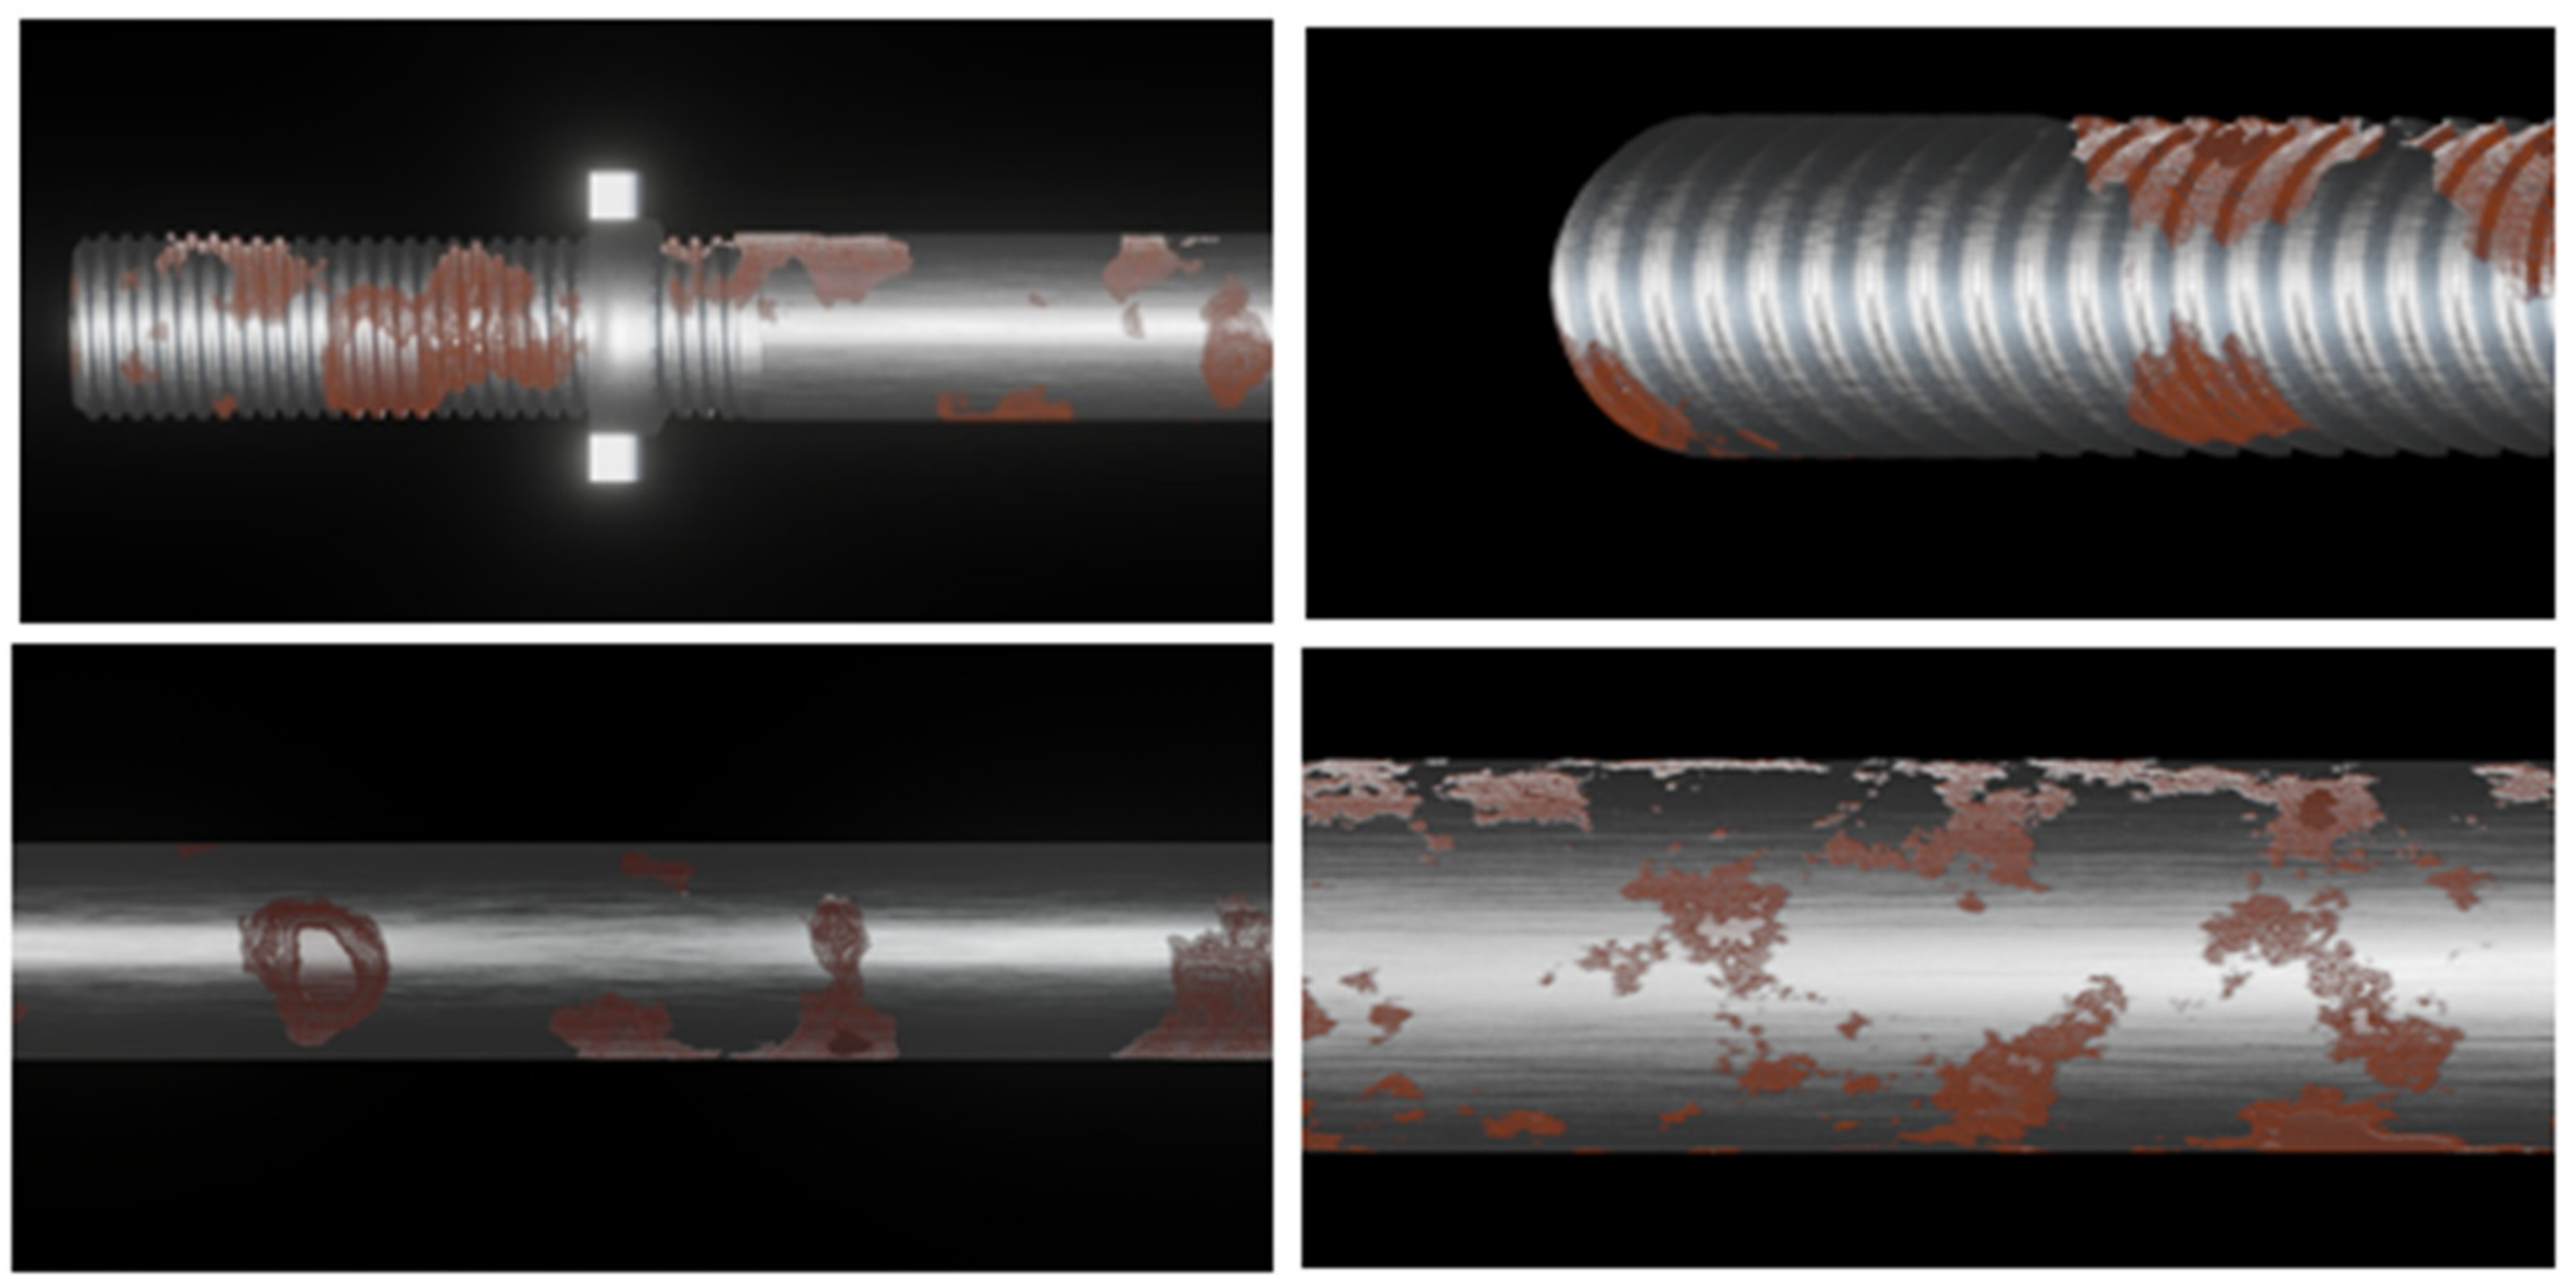
- Describing an augmentation process of the real dataset by synthetic data prevents over-fitting of the model during the training phase and reduces the time needed for the preparation of the dataset.
- Describing the advantages of using dice loss for mask branch or mask R-CNN models.
- Defining the scaffolding quality classes as a function of the deformation values obtained from the expert survey.
2. Research Background
There is much movement in the machine learning market worldwide towards automating quality assurance. Numerous automated machine learning (ML) solutions, pre-build products, or solutions for specific applications make it possible to replace employees. Currently, ML and computer vision (CV) use a large number of applications for solving defect-detection tasks, for instance, in concrete [7,8,9], asphalt [9,10,11], plastic [12], and metallic [13] surfaces. The popularity of machine vision can be explained by advantages such as high productivity, accuracy, and equipment availability.
Similarly, laser scanning [14], image processing [13], and infrared scanning [15] mainly use surface-defect detection. These techniques can identify from 92% to 99% of all defects in various jobs in different ways, with false positives at the level of 3–4%, which are quite relevant results. The average number of rejects in different industries range from 0.5% to small units of percent. Such methods may be suitable for replacing the person who discovers these defects or can improve the results even further.
2.1. 3D Scanner-Based Defect Detection
In 2014 in the 3D scanner field, Park [16] used a scanner for an automobile parts automated inspection system. The scanned point cloud was compared with the CAD model by a modified iterative closest point algorithm to calculate deviations. In a similar way, Xiong [14] proposed a 3D laser profiling system that integrated a laser scanner, an odometer, an inertial measurement unit, and a global position system to automatically detect defects on rail surfaces. The proposed system calculated the deviation between the measured rail surface and a standard rail profile. The adaptive iterative closest point algorithms marked points with large deviations as potential defect points. In 2018, Zhang [17] proposed an automatic defect detection method to detect cracks and deformation information simultaneously in asphalt pavement. This method relied on a sparse processing algorithm to extract crack candidate points and deformation support points, and then combined the extracted candidate points with an improved minimum-cost spanning tree algorithm to detect pavement cracks. Furthermore, Madrigal [18] used a local 3D model Point Feature Histogram descriptor for defect detection based on the point cloud.
Although each of these methods had certain advantages, such as high accuracy in detecting metal surface defects, they also had limitations in detecting rust, a capacity that is necessary for evaluating scaffolding quality.
2.2. 2D Image-Based Defect Detection
One of the valuable methods for detecting defects on a metal surface was proposed by Li [19]. The researchers used a convolutional neural network based on YOLO architecture, which detected defects in real time with high accuracy on steel trips; however, this method had a strong limitation in calculating the area of defects. Another approach was presented by Wang [20]. According to the study, the main proposal was a semi-supervised semantic segmentation network for concrete crack detection based on two neural network methods: student and teacher models. The two models have the same network structure and use the Efficient UNet architecture to extract multi-scale crack feature information that reduces the loss of image information. The proposed model had high accuracy in a crack-detection task. Solutions for real-time defect detection were proposed by Pan [21]. The author developed PipeUNet for sewer defect segmentation. The model used CCTV images to detect cracks, infiltrations, and joint offsets. It worked with a mean IOU of 76.37 accuracies. However, during the real-time defect detection, accuracy was lower than for the non-real-time model. This can be explained by limitations of control and interaction between quality of scanning and speed. In 2020, Feng [22] proposed a method based on high dynamic range image analysis and processing to solve the problem of visual inspection of industrial parts with a highly reflective surface. The research focused on image color correction and adaptive segmentation.
Manual quality control is still prevalent in many types of production, as any industrial enterprise has a whole staff of trained employees and honed quality standards. However, automated visual flaw detection based on computer vision can significantly reduce the direct participation of workers in the quality control process on all types of production lines. Table 1 summarizes the above research, with the methods divided into two groups: 3D laser-scanning-based and 2D image-recognition-based detection. Each method has its strengths and weaknesses. Laser scanning methods are more accurate, but generally do not detect rust unless a surface is deformed. On the other hand, methods based on 2D image recognition can visually detect such defects as rust, paint stains, and dirt. However, they are less accurate and more dependent on the imaging conditions, the illumination quality, and the reflection of a metal surface.
Table 1.
A comparison between previous studies and the current study.
Furthermore, with only 2D images, it is more complicated to detect surface deformations. In consequence, it was decided to use 2D and 3D scanning methods together to exploit their strengths and compensate for their shortcomings. The current study proposed a detection method for rusted areas based on image segmentation and for deformation and cracks based on point cloud analysis. In many manufacturing companies, quality control is still a manual operation. Even though humans are highly capable of visually inspecting a wide range of objects, subjectivity and fatigue can lead to mistakes when performing repetitive tasks. In contrast, CV-based automation systems offer an effective solution for quality and process control, improving the efficiency of inspection operations by increasing productivity and process accuracy, and reducing operating costs. For detecting detective objects, the CV-based automated system uses a camera that captures images, which are then compared algorithmically with predefined images.
3. Materials and Methods
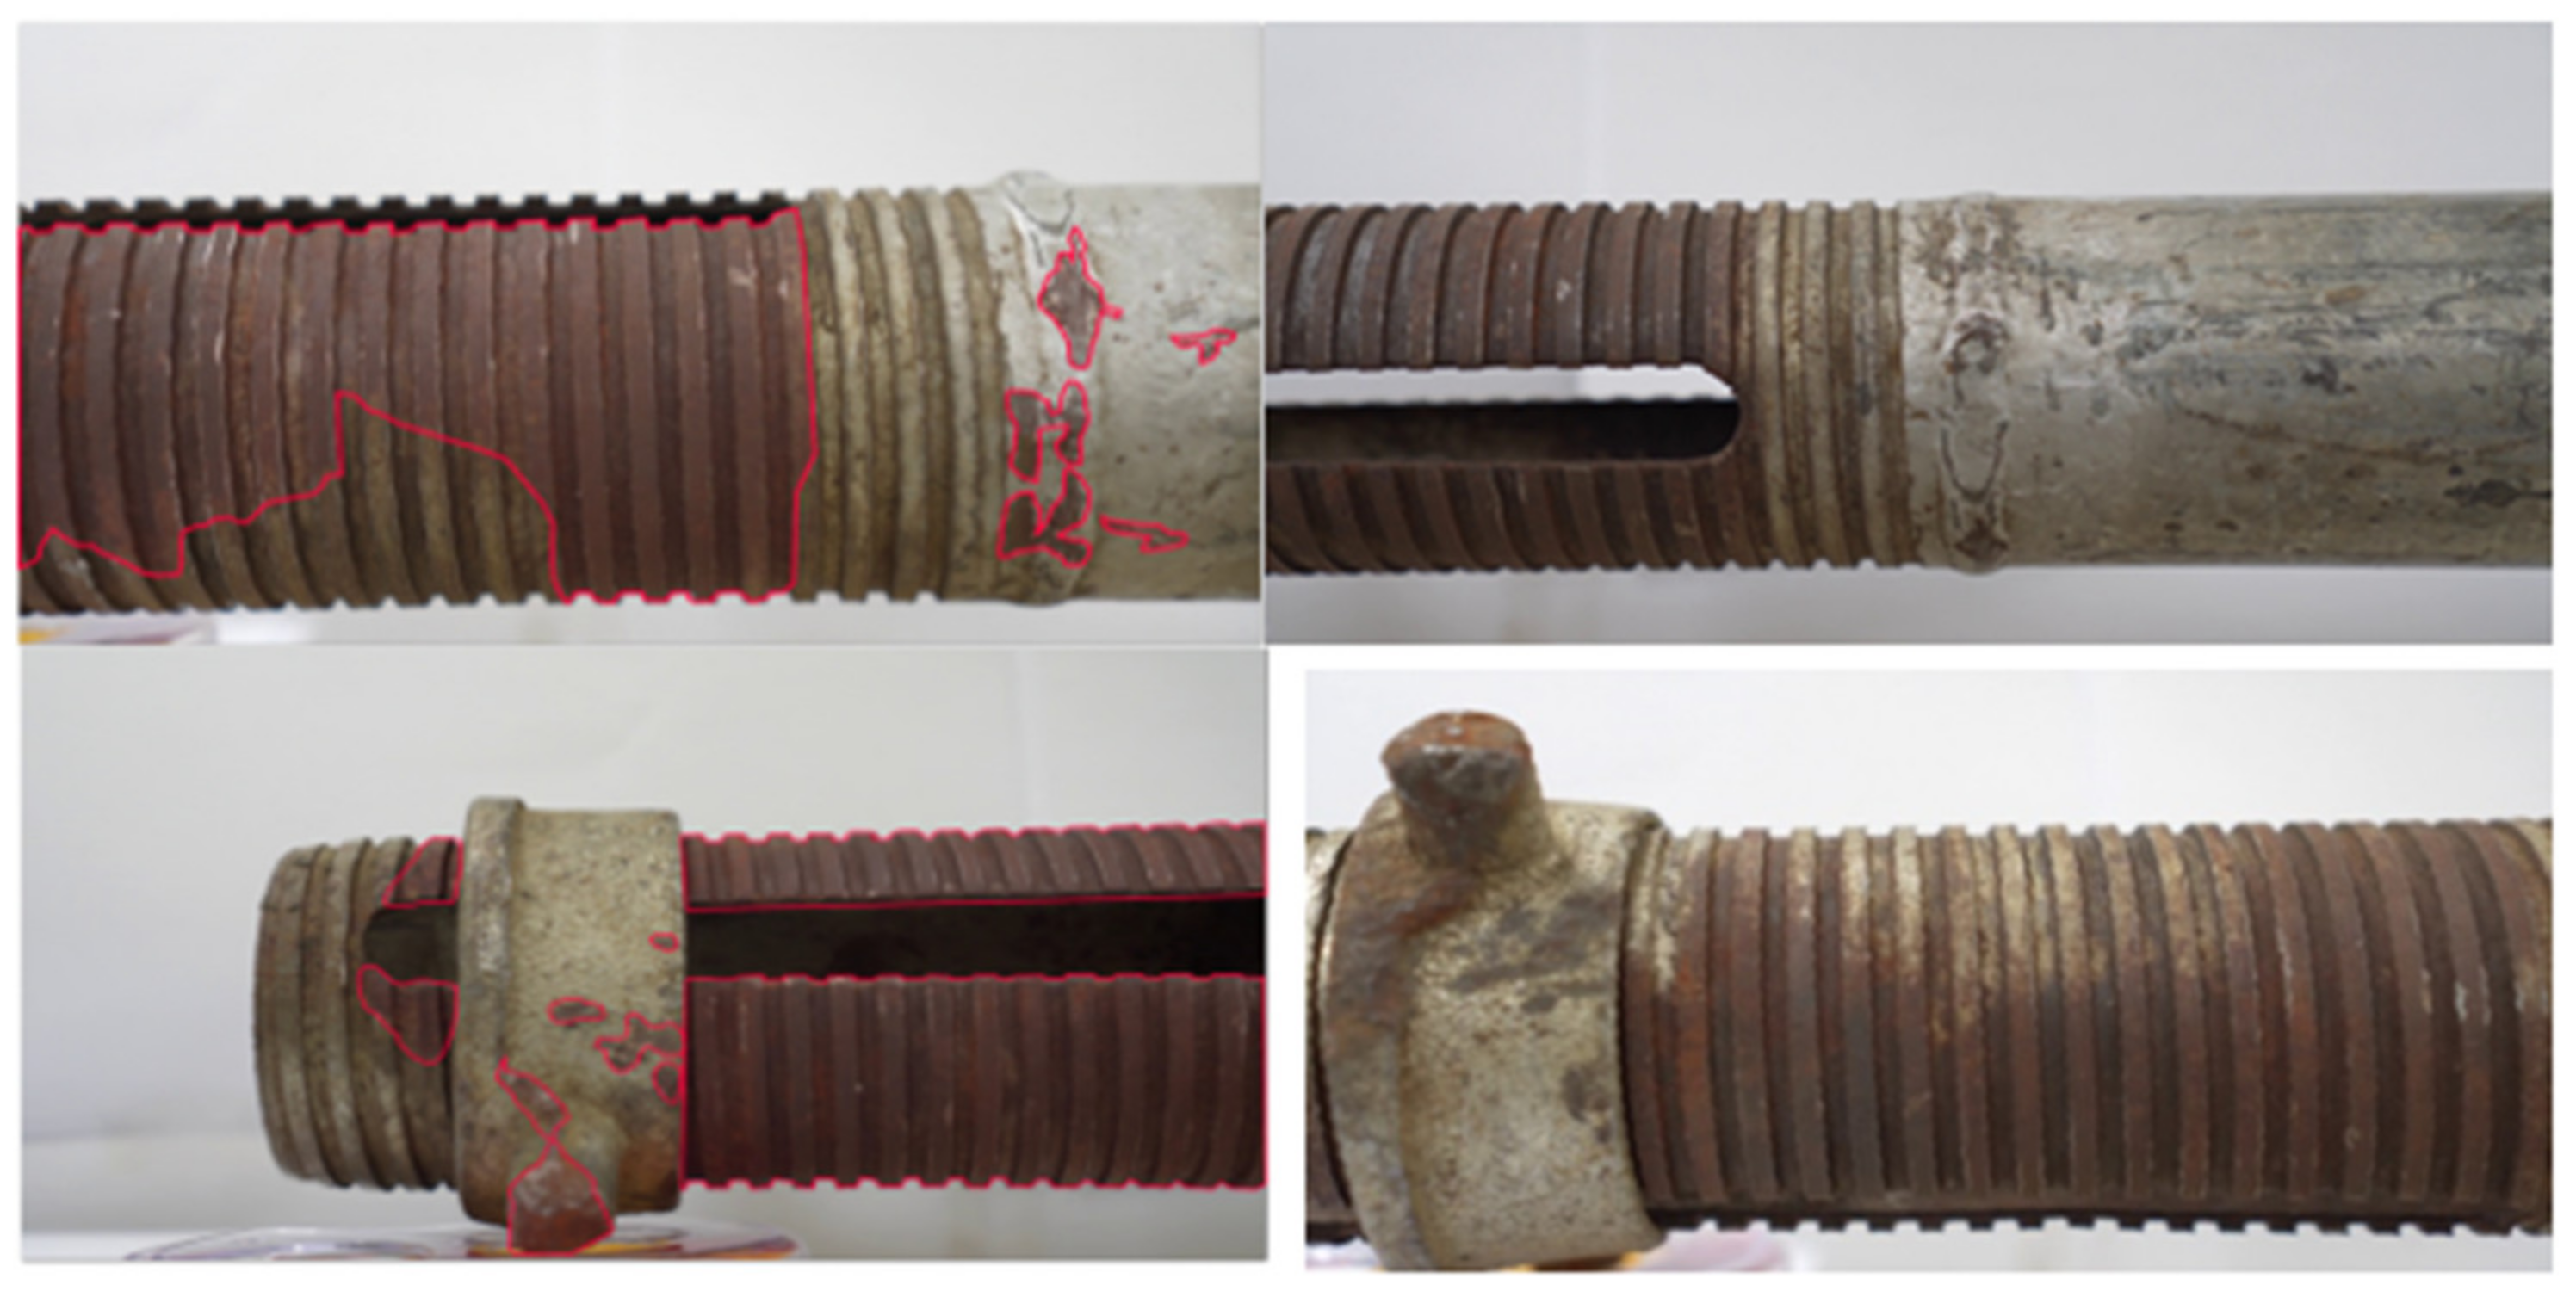
In Korea, scaffolding quality certification is regulated by KOSHA, which determined three quality classes: A class—for parts without deformation that can be used without repairing, B class—for parts that can be used after repairing, and C class—for parts that should be recycled. For each quality class, KOSHA Guide has acceptable defect sizes and recommended test methods. In addition, the Korea Temporary Association has established procedures and methods stipulated in Article 27 of the Industrial Standardization Act to prevent industrial accidents the defective temporary equipment reusing case.
Most of these methods are applicable only for visual inspection by a human.
The current study proposes a method based on combining 2D image segmentation results and 3D point cloud comparison results to determine the final quality class. Figure 1 illustrates the main steps of the proposed approach.
Figure 1.
Quality classification flow chart.
Firstly, a tested part is scanned. The scanned data are analyzed using artificial intelligence, the sizes and types of deformations are calculated, and a quality class is determined based on size. Finally, all results are visualized in a web interface. The quality class B is divided into three new classes, depending on the repairing works, which is useful for the end-user when calculating the number of works. Furthermore, users can weight quality classes, shifting boundaries in one direction or another depending on the organization’s requirements so that each user can customize a classification process.
The deep learning part of the proposed method includes three main steps: data generation, data preparation, and model building. The model includes model tuning, training, and testing parts. The main objectives of the segmentation part are the detection of rusted metal areas, surface cracks, and deformation.
3.1. Datasets
Preparing a dataset is one of the most important and time-consuming parts of machine learning. The performance and accuracy of the future deep learning model strongly depend on its quality. Additionally, the dataset preparing step should consider such a common problem in industrial flaw detection as a class imbalance.
The class imbalance arises when one class is overrepresented, and one or more is not much represented in the model training dataset. In our case, the rust detection part detected rust in the original dataset, which was prepared from real images; more than 95% of pixels were labeled as non-rusted areas and fewer than 5% were rusted. An imbalanced dataset leads to a situation where the model defines an entire image as a non-rusted image and obtains more than 90% accuracy. Several methods solve the class imbalance problem, including class weighting, data augmentation, the variable classification threshold [23], and synthetic minority over-sampling technique [24].
The original dataset was increased by using synthetic images generated and rendered by the 3D content creation suite Blender. The synthetic data can improve the performance [25] of neural networks and various machine learning algorithms by increasing the dataset and solving the class imbalance problem. In addition, the generation of synthetic data allows a reduction in the number of real data. Thus, it can be useful for reducing the time and cost of preparation. However, it is not enough to achieve only a quantitative gain from the generator according to the data; it is important that the data be of good quality. If the distribution of the generator data differs from that of the real data, the use of a mixed dataset will lead to a deterioration in the algorithm’s quality.
The synthetic dataset was sampled from a 3D polygonal model. All work on preparing the synthetic dataset was carried out with the Blender software package. Blender creates a realistic 3D model and adds deformations and light, and simulates different image shooting conditions, thereby making the dataset more general. Figure 2 illustrates the process flow chart for dataset generation in Blender. For model training, both the images themselves and the corresponding masks, defects, and rust were generated in the shaders stage. In addition, shaders allow rendering images and masks in different channels, saving time for labeling. The cracks were generated as a deformed ellipse and randomly added to the polygonal model.
Figure 2.
Dataset rendering flow chart.
Figure 3 illustrates texture and defects generating flow. The rendered synthetic images samples are represented in Figure 4. By generating and rendering 200 synthetic images, we were able to increase the original training dataset with 300 real images, thus preventing the model from overfitting.
Figure 3.
Blender shading flow.
Figure 4.
Real images with GT masks.
Rendering or visualization in computer graphics is the process of translating a mathematical model of an object into a graphical representation. In Blender, this is conducted by projecting the vertices that make up the objects onto the screen plane and calculating the pixels between them by rasterizing the polygons.
The real dataset consisted of 300 color images with a resolution of 1920 × 1080, which were resized to 1024 × 1024 for network training. The photos were taken by a scaffolding rental company, then labeled and prepared in COCO dataset format. The COCO dataset format included images and polygonal masks in JSON format. Figure 5 shows sample images with GT polygonal masks.
Figure 5.
Synthetic images.
Finally, defects were added to the polygonal model, and the point cloud was sampled, with the random noise on each point to simulate laser scanning results. Figure 6 illustrates the sampled synthetic 3D point cloud.
Figure 6.
Sampled point cloud.
The point cloud obtained from scanners has a noise. All sensors have specific errors that turn into various artifacts, such as isolated points that hang in the air where they should not be. In addition, the object can stand on a supporting surface. To select the object under study and solve a number of the problems mentioned above, it is first necessary to preprocess the point cloud to remove noises and support surfaces.
3.2. 2D Image Segmentation
For segmentation tasks, various solutions were used, such as Fully Connected Neural Network [26], U-net model [27], and Mask R-CNN [28]. However, Mask R-CNN is considered one of the standard CNN architectures for image instance segmentation tasks, as it not only performs complete image classification but also segments the regions by class; that is, it creates a mask that divides the image into several classes.
The original Mask R-CNN segmentation model was developed by He [29] in 2018 as an extension of Faster R-CNN, by adding a branch for predicting an object mask in parallel with the existing branch for bounding box recognition. Mask R-CNN develops the Faster R-CNN architecture by adding another branch that predicts the position of the mask covering the found object, and thus solves the instance segmentation problem. The mask is just a rectangular matrix, in which 1 at a certain position means that the corresponding pixel belongs to an object of the specified class, and 0 means that the pixel does not belong to the object. Figure 7 illustrates the predicted heat map of the deformation area by using the Mask R-CNN network.
Figure 7.
The predicted heat map of the deformation area.
The authors of the document conditionally divide the developed architecture into a CNN network for computing image features, which they call backbone, and a head, which is the union of parts responsible for predicting the enclosing frame, classifying an object, and determining its mask. Loss function (1) is common for them and includes three components:
where Lclass is classification loss, Lbbox is bounding box regression loss, and Lmask is mask loss
L = Lclass + Lbbox + Lmask
The selection of the mask takes place in the class-agnostic style: the masks are predicted separately for each class, without prior knowledge of what is depicted in the region, and then the mask of the class that won in the independent classifier is simply selected. It is argued that this approach is more efficient than the one based on a priori knowledge of the class.
One of the main modifications that arose due to the need to predict the mask is the change in the RoIPool procedure (calculating the feature matrix for the candidate region) to the so-called RoIAlign. The fact is that the feature map obtained from CNN has a smaller size than the original image, and the region covering an integer number of pixels in the image cannot be mapped into a proportional map region with an integer number of features:
To evaluate the neural network mask prediction, this study used a loss function based on the Dice [30] coefficient, which is a measure of the overlap between the predicted mask and the ground truth mask. This coefficient ranges from 0 to 1, where 1 means complete overlap. Dice coefficient (2):
where ∑ (ytrue × ypred) represents the common pixels between ground truth mask ytrue and predicted mask ypred.
In addition, for more accurate model evaluation, this study used such metrics as precision (3) and recall (4):
where TP true positive: prediction is positive and ground truth is positive, FP false positive: prediction is positive and ground truth is negative, FN false negative: prediction is negative and ground truth is positive.
Precision = TP/(TP + FP)
Recall = TP/(TP + FN)
The mean average precision (5)—the most commonly used metric to model evaluation can be calculated as:
where n is number of classes, and k is current class.
To determine better accuracy in 2D image segmentation, Mask R-CNN model was trained on the real images dataset with two different backbone architectures—ResNet-50 and ResNet-101—and then accuracy was compared with the real images dataset. The main difference between the ResNet-50 and ResNet-101 architectures is the additional 3-layer blocks (Table 2) that make model ResNet-101 deeper; however, by this increases calculation cost.
Table 2.
ResNet-50 and ResNet-101 architecture.
Moreover, the original Mask R-CNN used the average binary cross-entropy loss for mask loss calculation, while to increase accuracy in this work Dice loss (2) function was used. Finally, Mask R-CNN was tuned by weighting loss function for better model training. Table 3 illustrates model settings and datasets.
Table 3.
Mask-RCNN model settings and datasets.
The training dataset included 300 real and 200 synthetic images, and 50 real images in the validation dataset, corresponding masks, and 50-point clouds. Since it was overfitted during 2D model training, it was decided to augment the original dataset with real images by synthetic data.
The original Mask R-CNN can be used with a ResNet-50 or ResNet-101 backbone. The performances of the two backbones were compared on the real dataset. Figure 8 illustrates that the total loss of Mask R-CNN with a ResNet-101 backbone was lower than with ResNet-50; therefore, in the next experiment, a ResNet-101 backbone was used.
Figure 8.
The comparison of ResNet-50 and ResNet-101 backbone.
In computer vision tasks, accuracy depends on image quality, shooting conditions, lighting brightness, reflective metal surface, shooting angle, and relative position of the camera and subject. Therefore, the original dataset with real images was augmented by synthetic images rendered in Blender to prevent overfitting and make the model more generalized. Figure 9 illustrates total loss on the validation dataset. The model was trained on real and on mixed datasets. The validation loss decreased in the mixed dataset, which indicated that the model fitted better on the mixed data. In the next experiments, only mixed data were used.
Figure 9.
Real and mixed datasets validation losses.
The original Mask R-CNN used the average binary cross-entropy loss. In this research, Dice loss was used in the mask branch to achieve a better result. Figure 10 illustrates validation losses after the implementation of Dice loss function.
Figure 10.
Dice loss function.
In addition, loss function was weighted as: rpn class loss: 1.0, rpn bbox loss: 0.3, class loss: 1.0, bbox loss: 0.8, mask loss: 0.8., which decreased total loss. Figure 11 illustrates total validation losses.
Figure 11.
Total validation losses.
The real defect size (6) can be calculated as:
where D is distance from the object to the camera, d is focal distance, and h is sensor size. Figure 12 indicates how the actual size can be calculated.
H = (D × h)/d
Figure 12.
A diagram indicating how the actual size can be calculated.
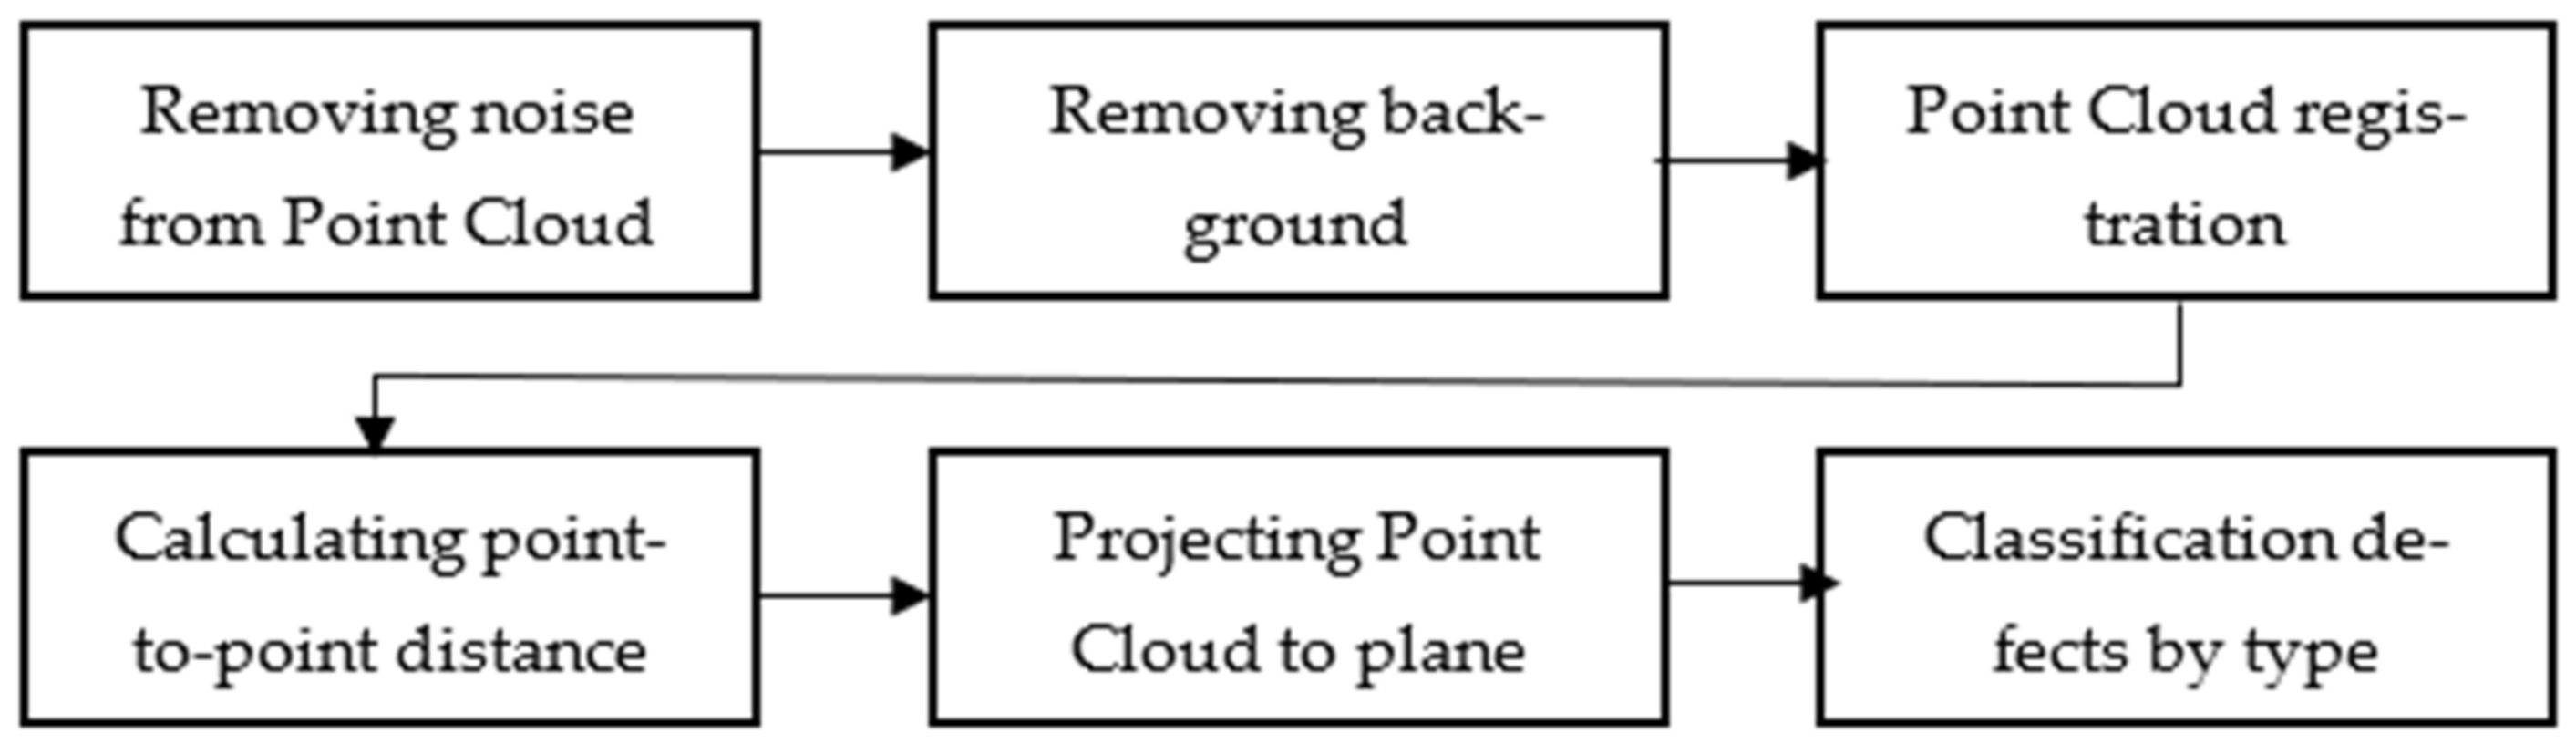
3.3. 3D Point Cloud Classification
The main steps of the proposed method are illustrated in Figure 13. The first step is to remove noise from the scanned image. All sensors have certain errors that turn into various artifacts; for example, isolated dots that hang in the air where they should not be. To remove noise, this research used an algorithm based on calculating statistical characteristics of distances to other points. In addition, the background surface was removed from the point cloud, since it was not needed for further analysis. For this purpose, a plane detection model based on the Random Sample Consensus algorithm was used [31].
Figure 13.
Defect detection and classification flow chart.
The next step is point set registration. For the point cloud registration, the Iterative Closest Point algorithm is used to align referents and defective point clouds. The algorithm minimizes the total difference between each point in two datasets.
Then, defects are detected based on point-to-point distance and projected to plane.
The last step is defect classification. For this purpose, this study used the Mask R-CNN algorithm to classify defect types based on point-to-point distance and shape.
3.4. Quality Classes
According to the Korean Quality Standard [32] of reuse temporary equipment, the used equipment is divided into A, B, and C classes according to the condition. Table 4 shows standards for quality classification. However, most of the requirements are related to visual inspection by humans. The lack of quantitative standards negatively affects the quality of the assessment.
Table 4.
Quality classification for reused scaffolds.
This study proposed new quantitative quality classification recommendations based on the strength characteristics of steel and the recommendations of specialists working in this field. To determine deformation size for each quality class, a survey was conducted among 10 scaffolding rental firm safety managers with more than 10 years of experience. Table 5 illustrates the proposed quality classes.
Table 5.
Proposed quality classes.
The class B quality for repairable parts was separated into three classes, B, C, and D, dependent on the type of repair needed: B class for alignment of surface deformations, C for cleaning the rusty part and re-painting, and D for welding works. These quality classes allow the division of defective parts into several groups for a more convenient distribution of work. Moreover, for the end-user, it is possible to change class boundaries or create new ones for more convenient use and customization possibilities, following the company’s requirements.
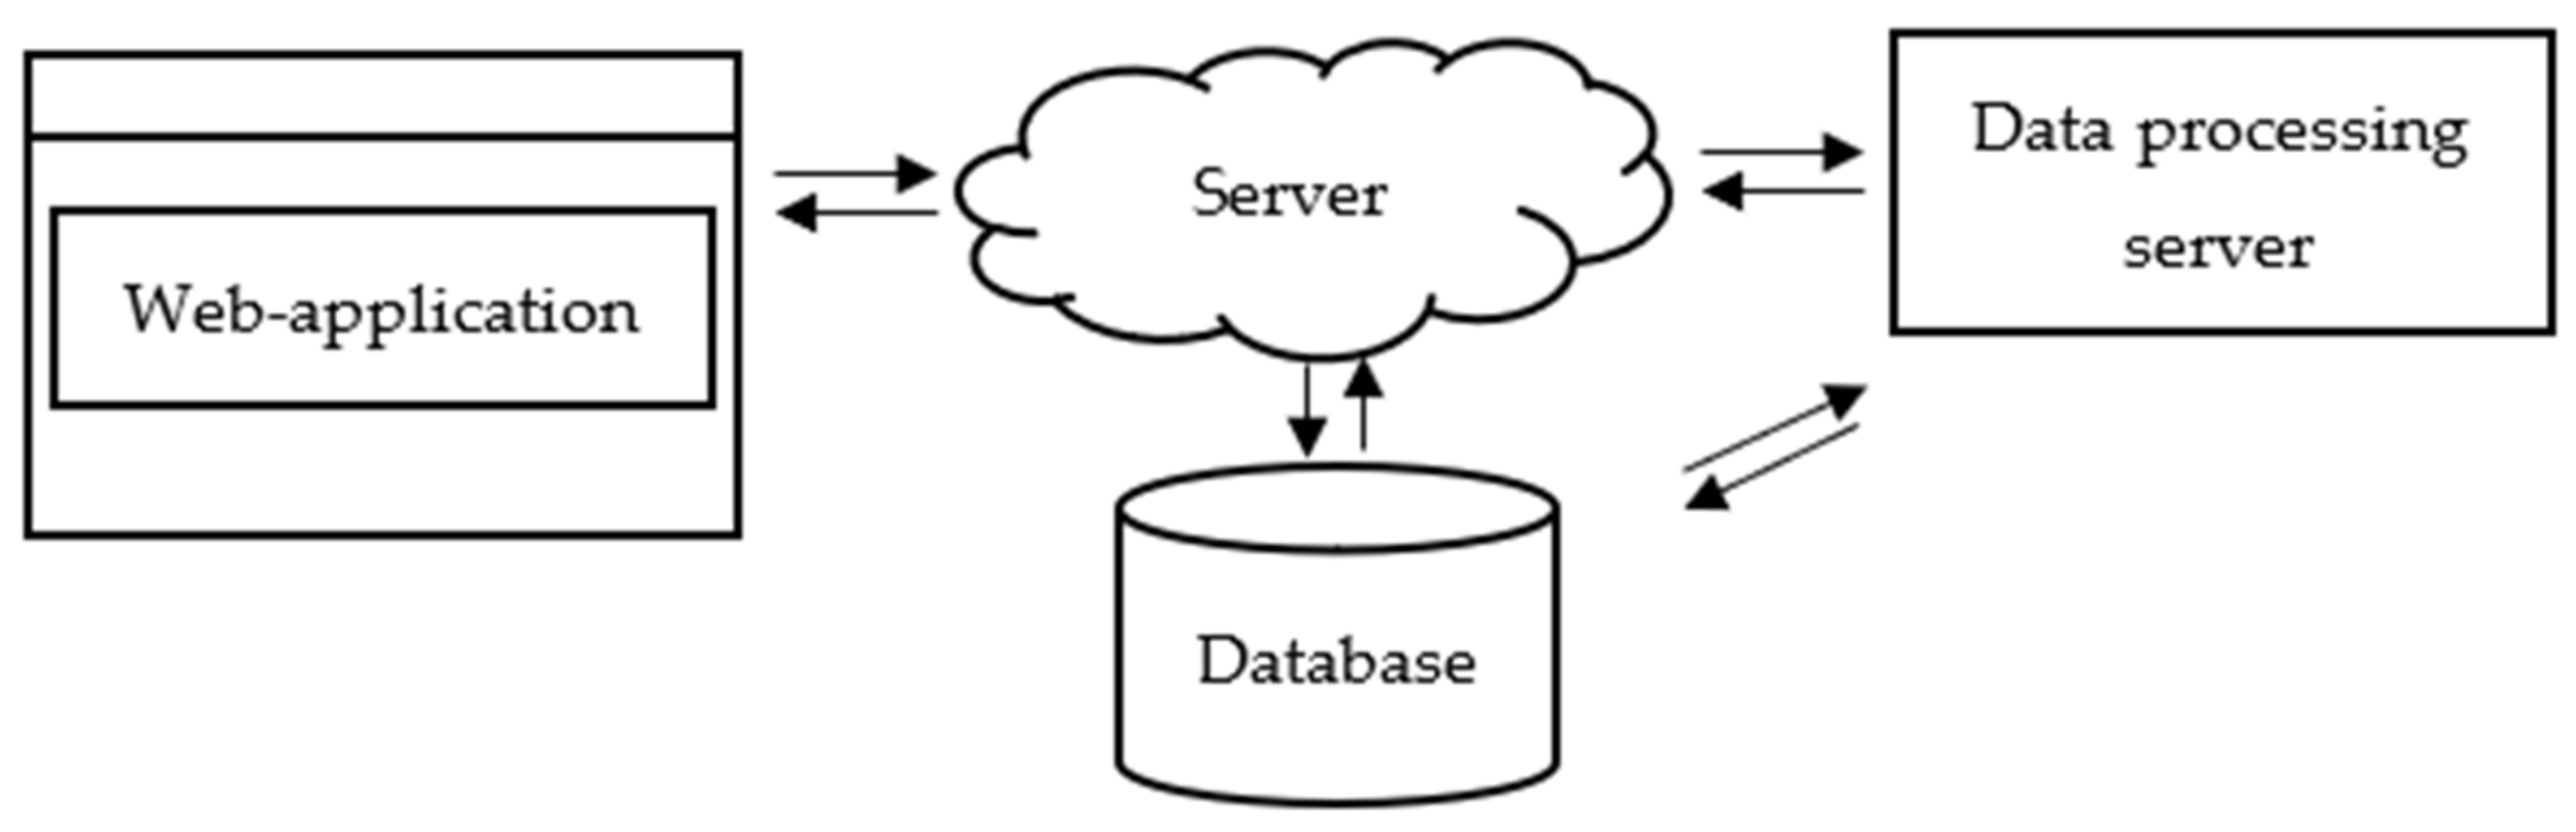
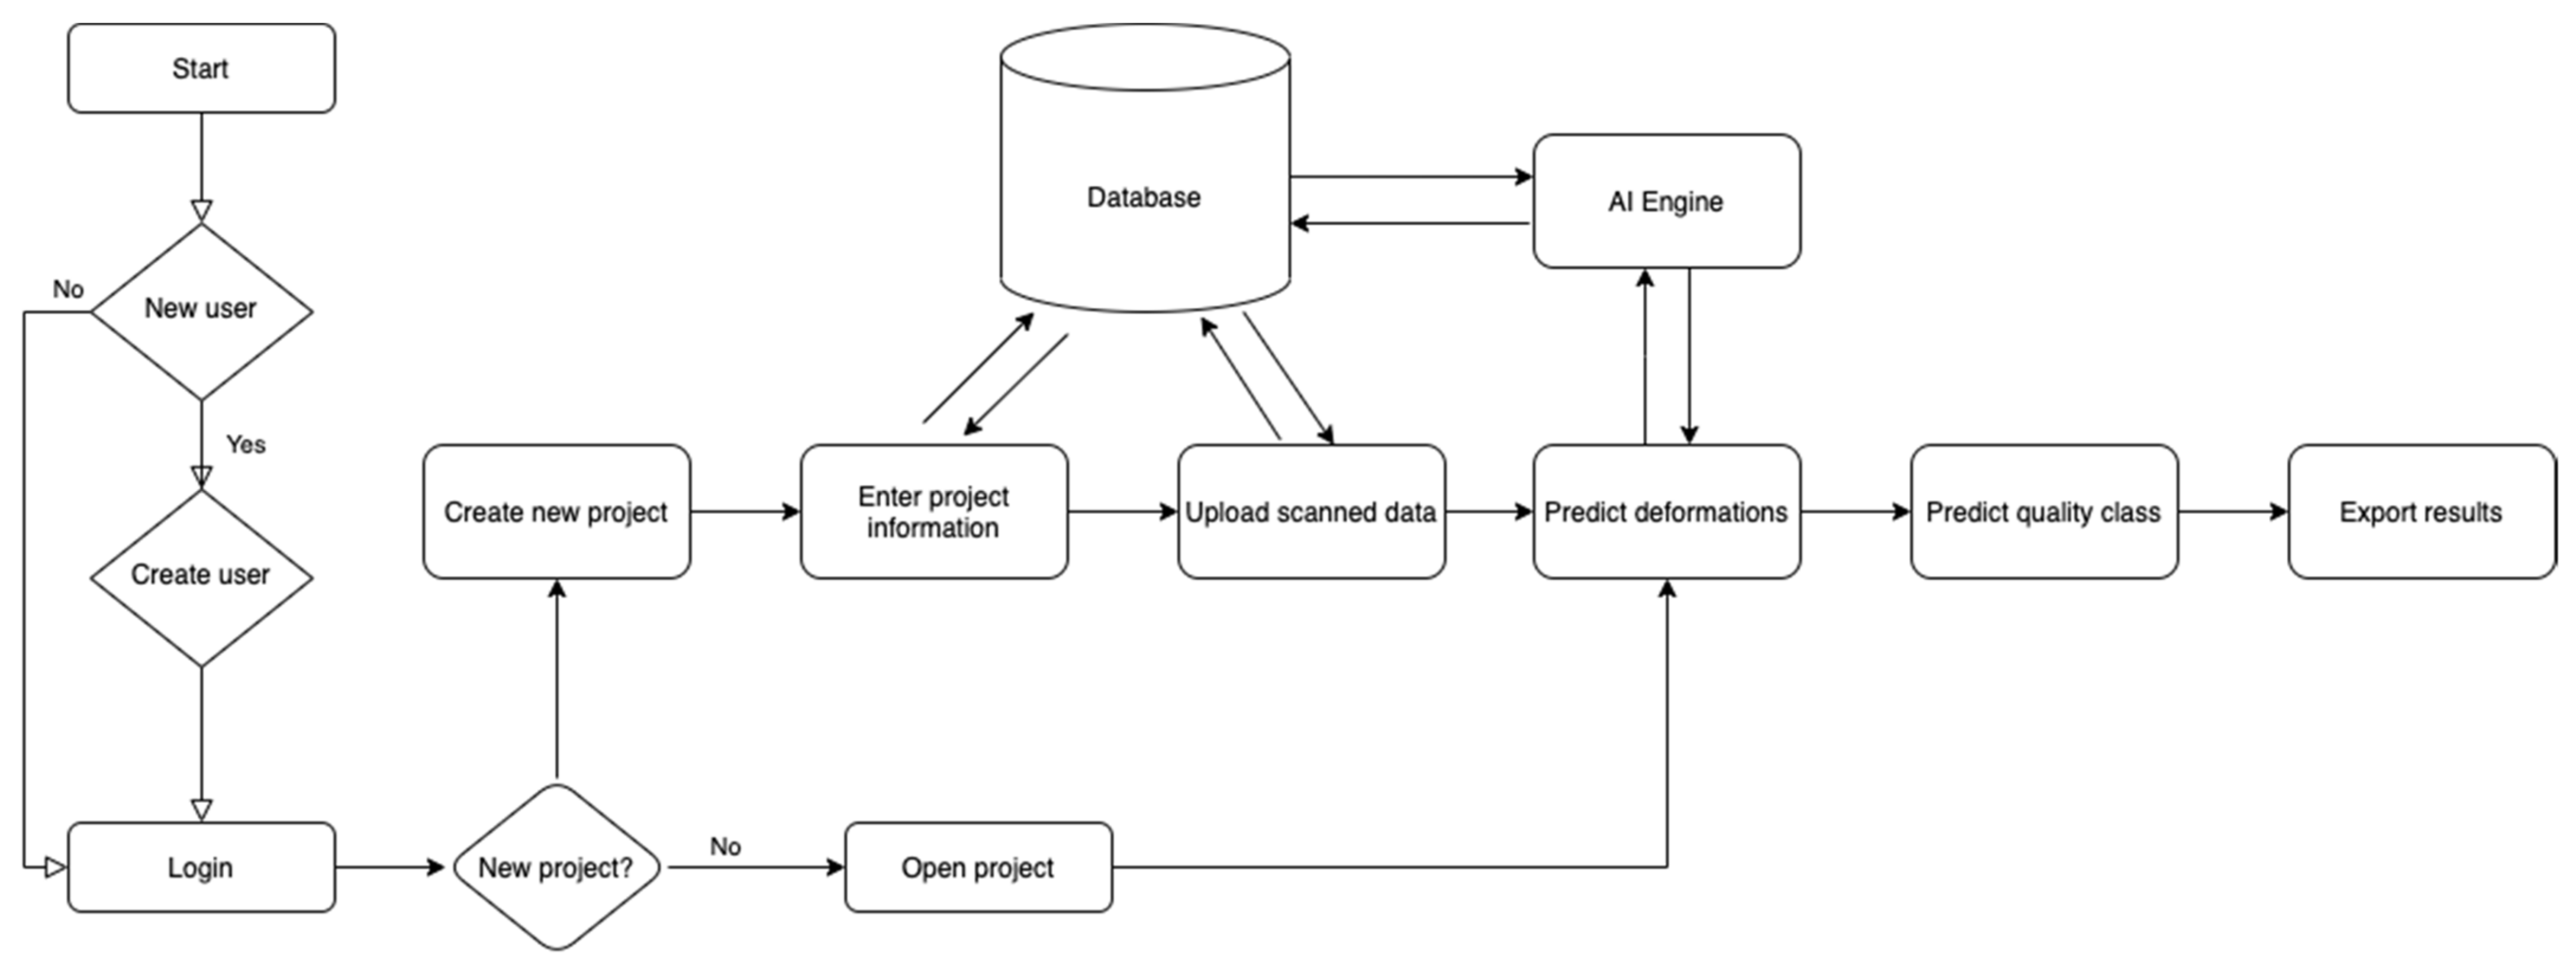
3.5. Quality Inspection System
The visualization system is a web-based application by which a user uploads new scanned data to the server and processes it to predict deformation. Then, the predicted deformation and quality classes are visualized on web page. Figure 14 illustrates the core parts of the proposed visualization system: web application, backend server and database server, and data processing server.
Figure 14.
Quality inspection system.
Figure 15 illustrates the system flow chart. There are several essential parts:
Figure 15.
Quality inspection system flow chart.
- ▪
- User authorization flow, which includes creating a new or login user.
- ▪
- Creating a new project, adding project information and scanned data.
- ▪
- Predicting deformation by using AI engine in a server.
- ▪
- Predicting quality class based on deformation values.
- ▪
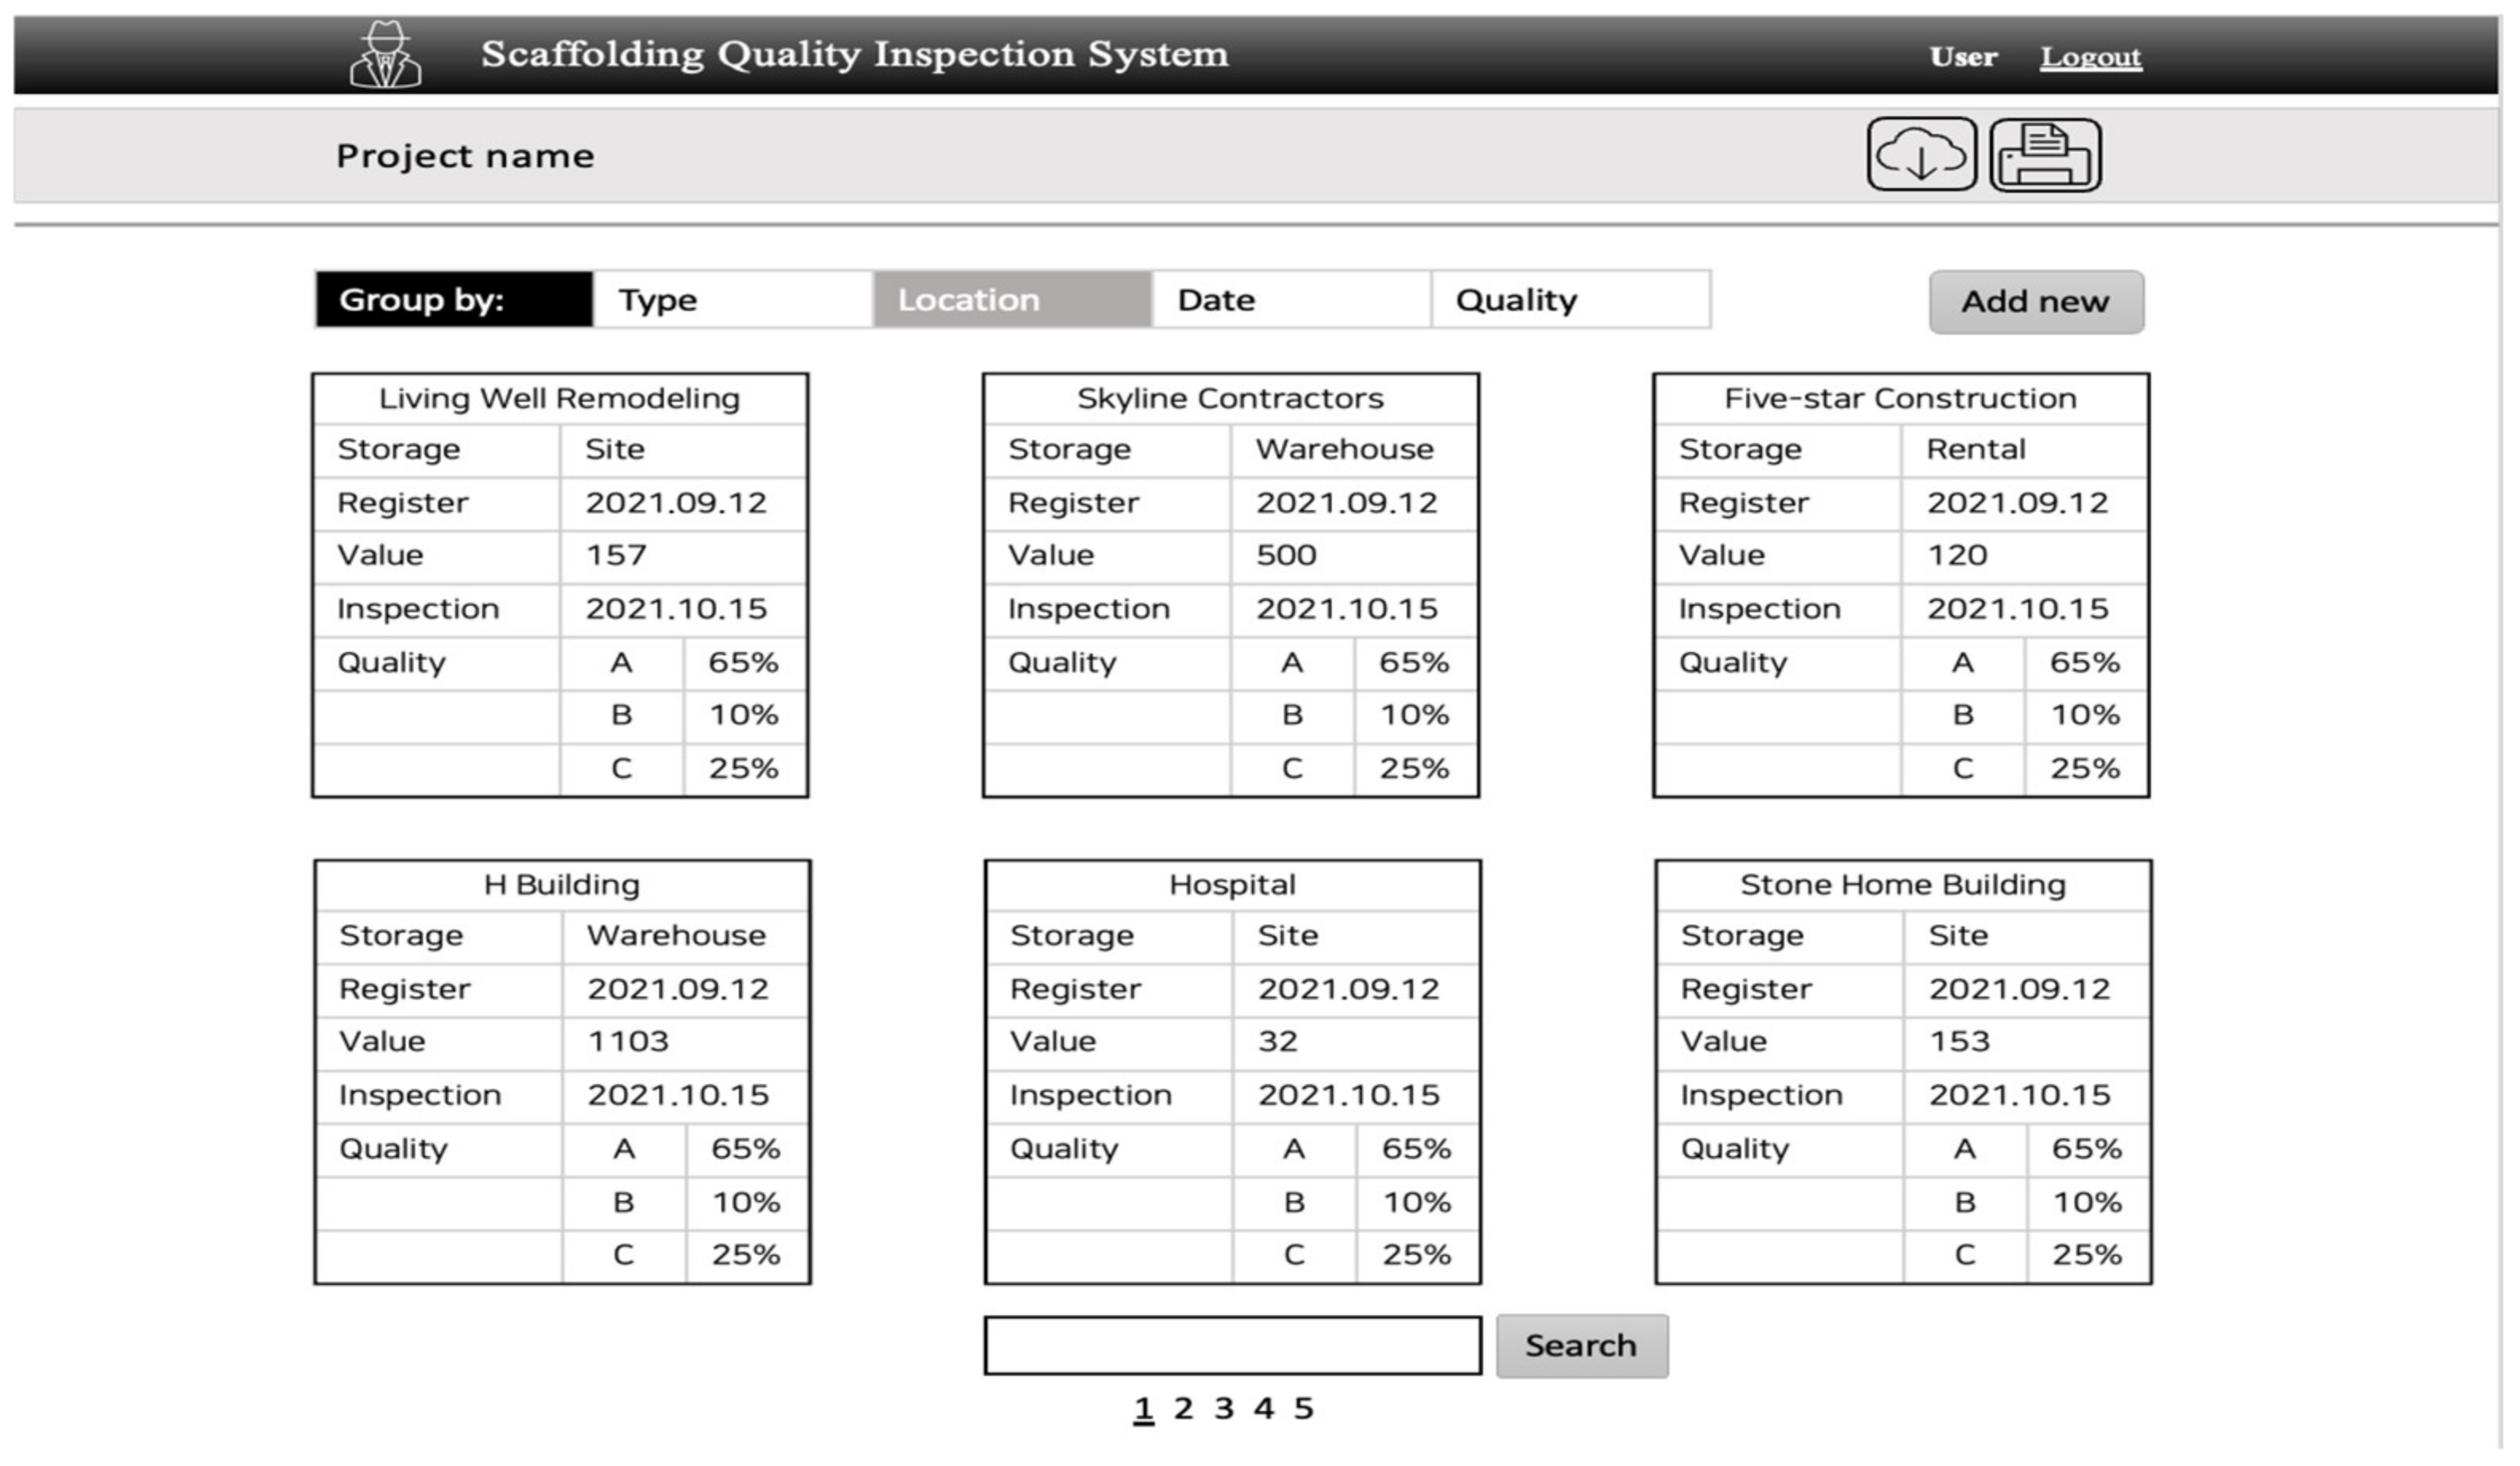
- Visualizing and exporting results.
All information is saved on the SQL database server.
4. Results
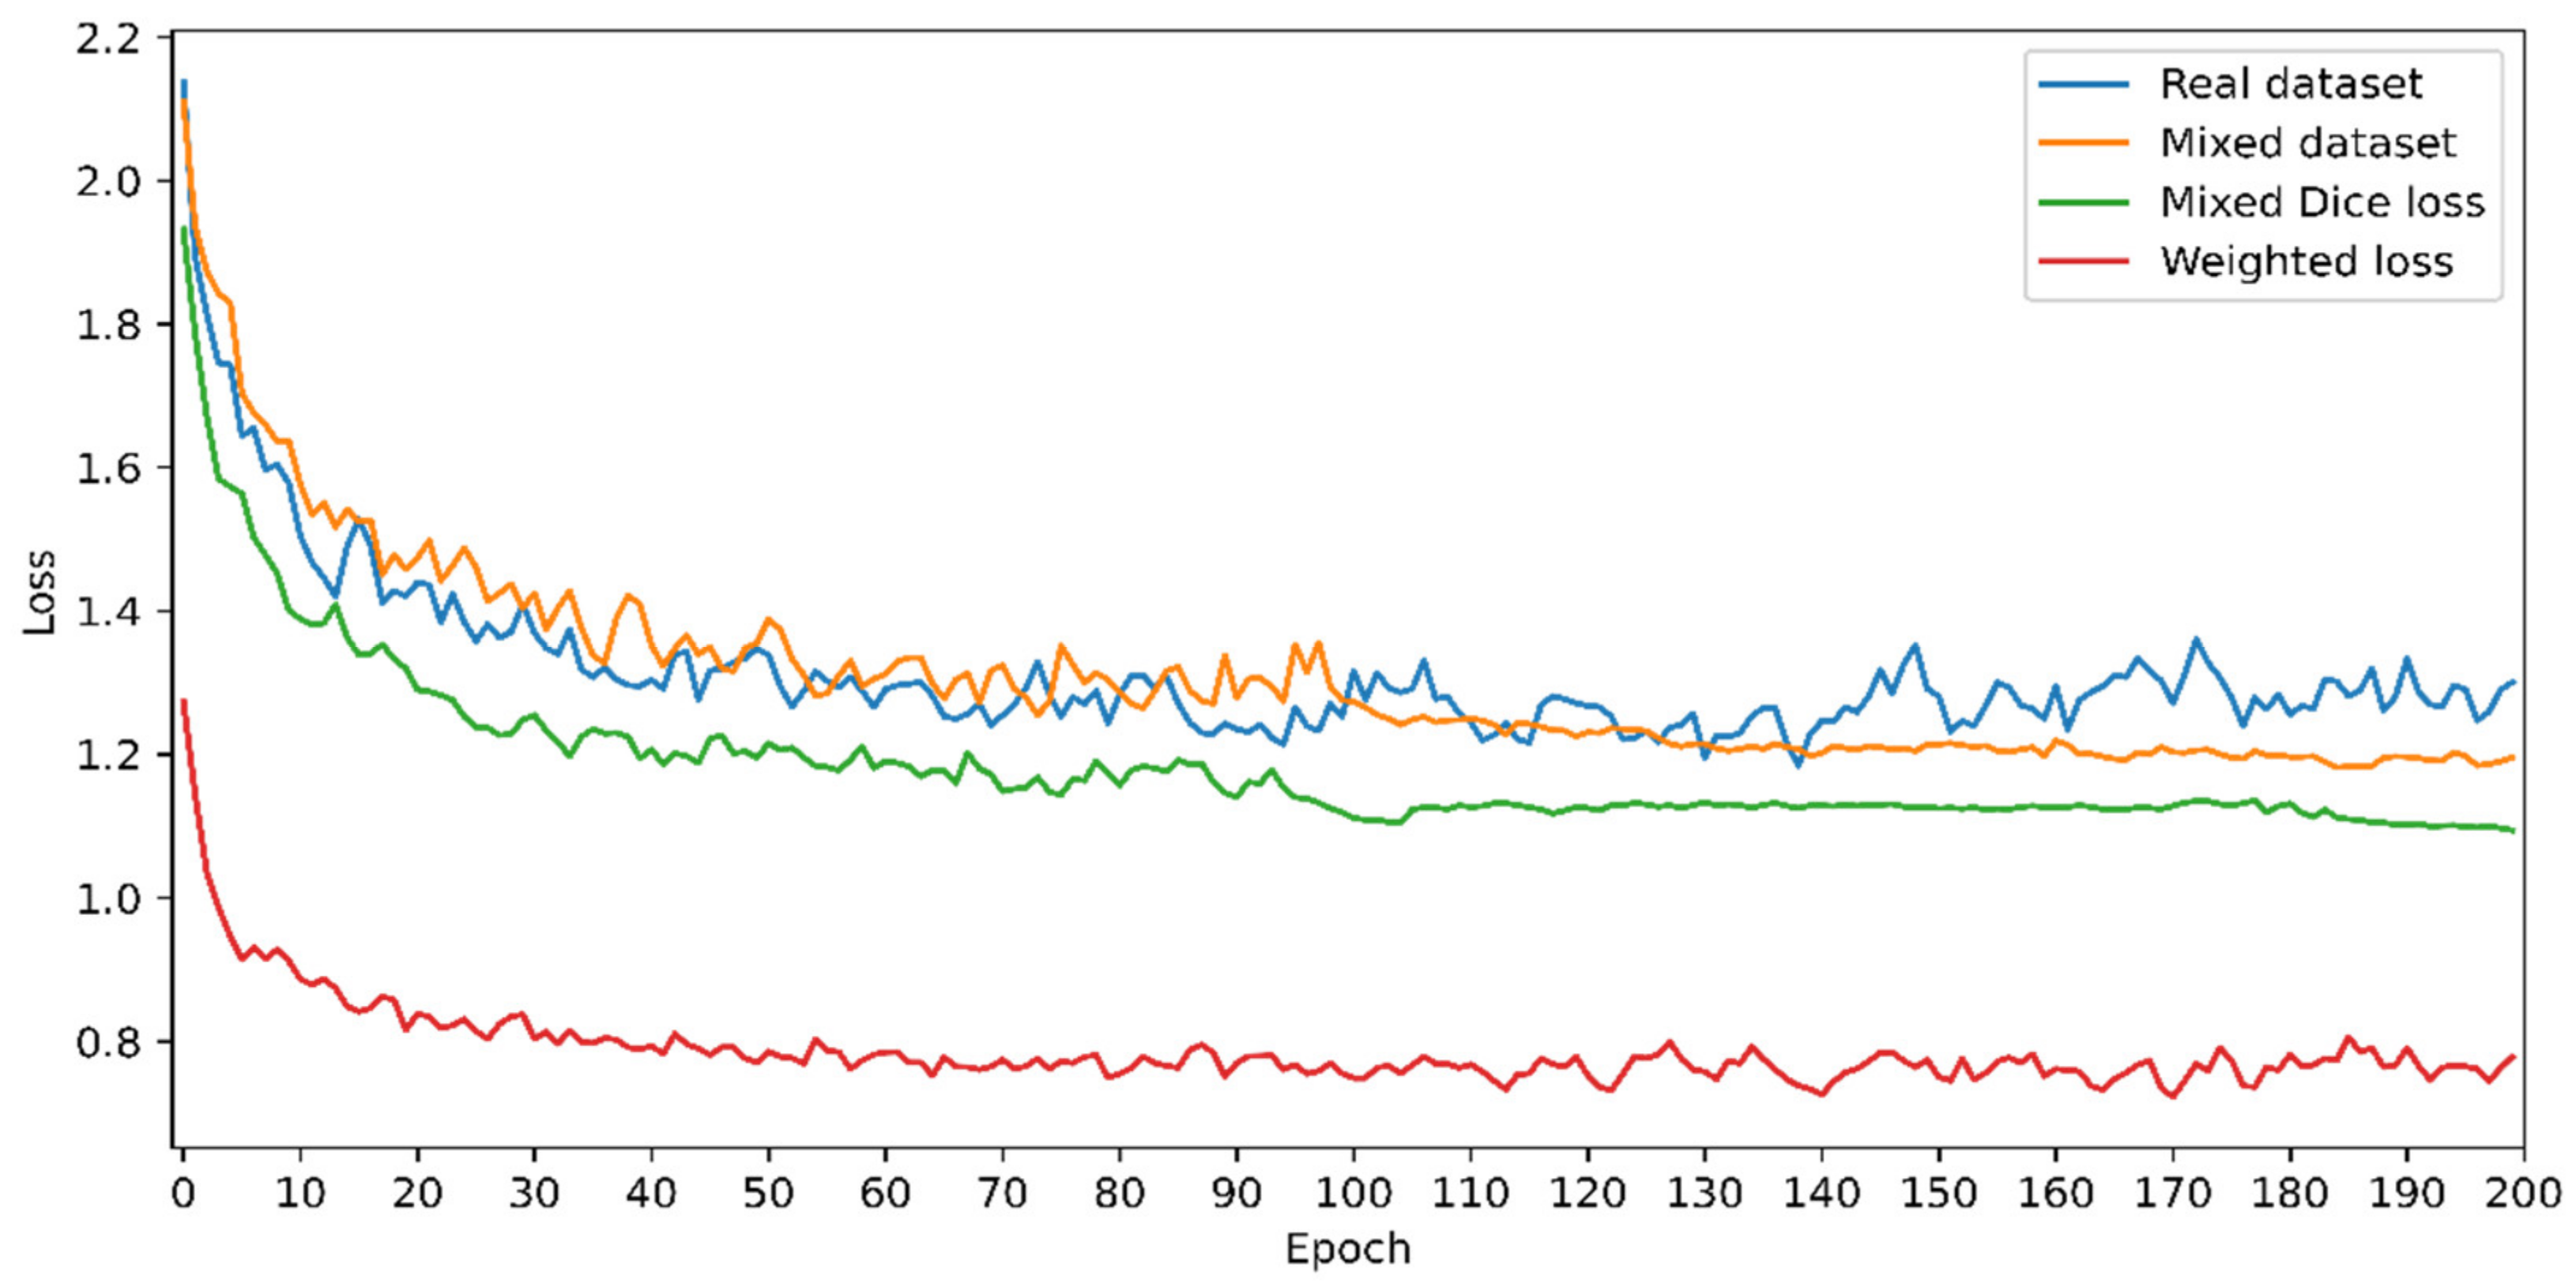
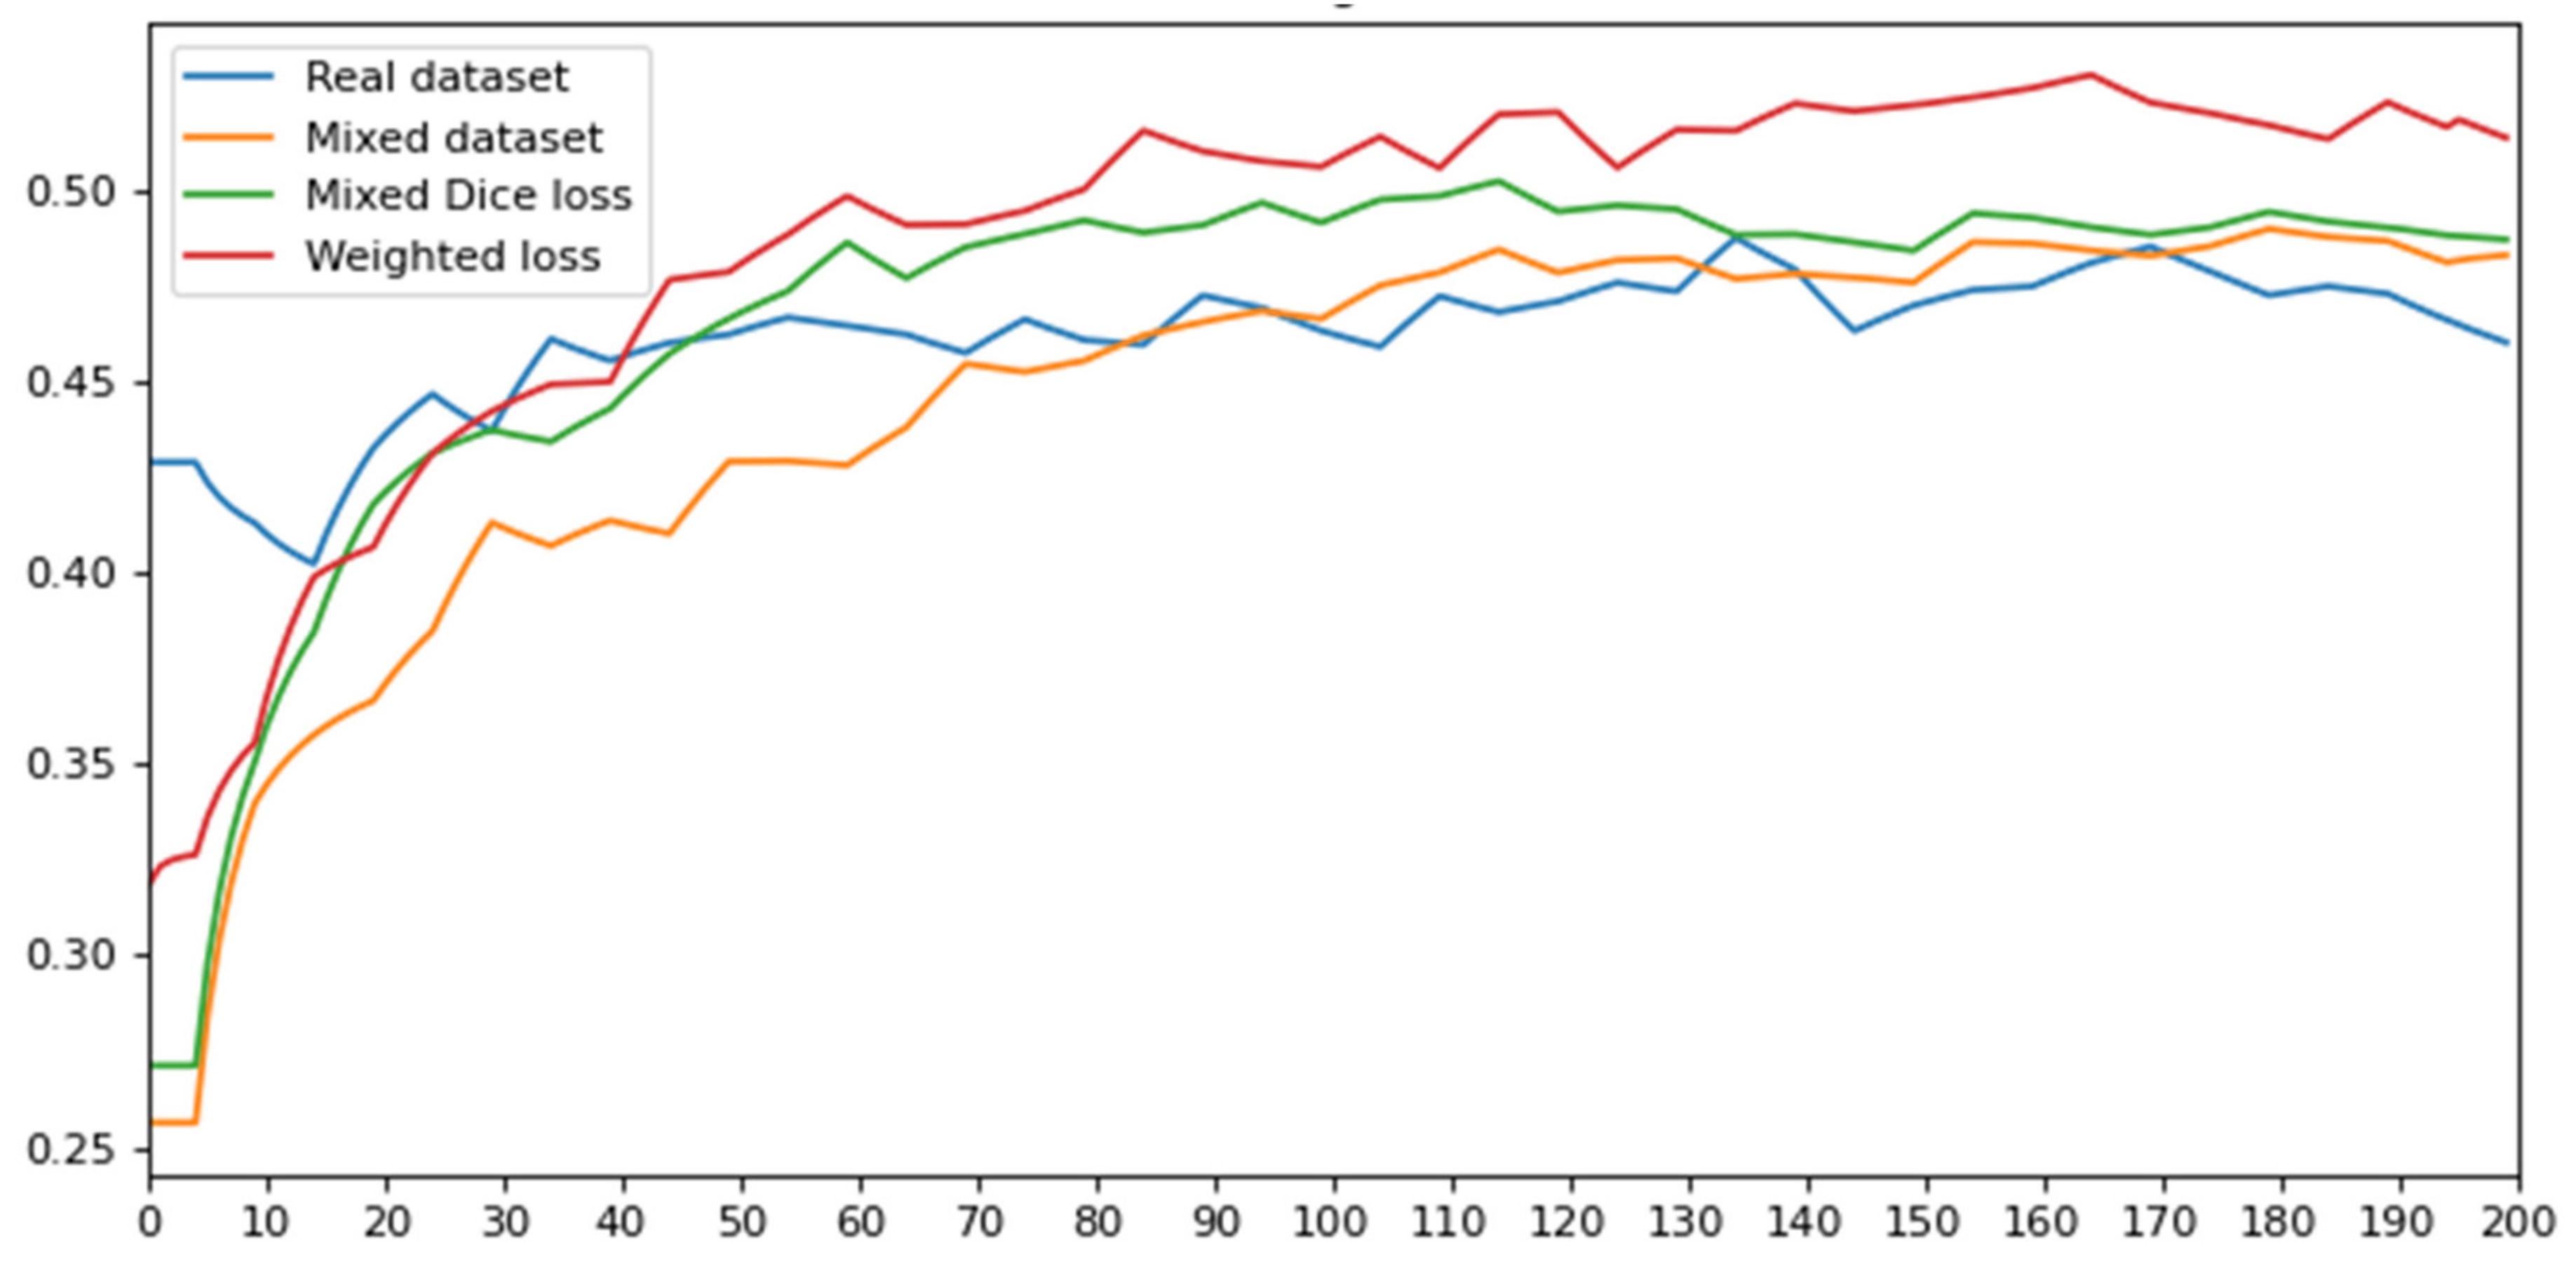
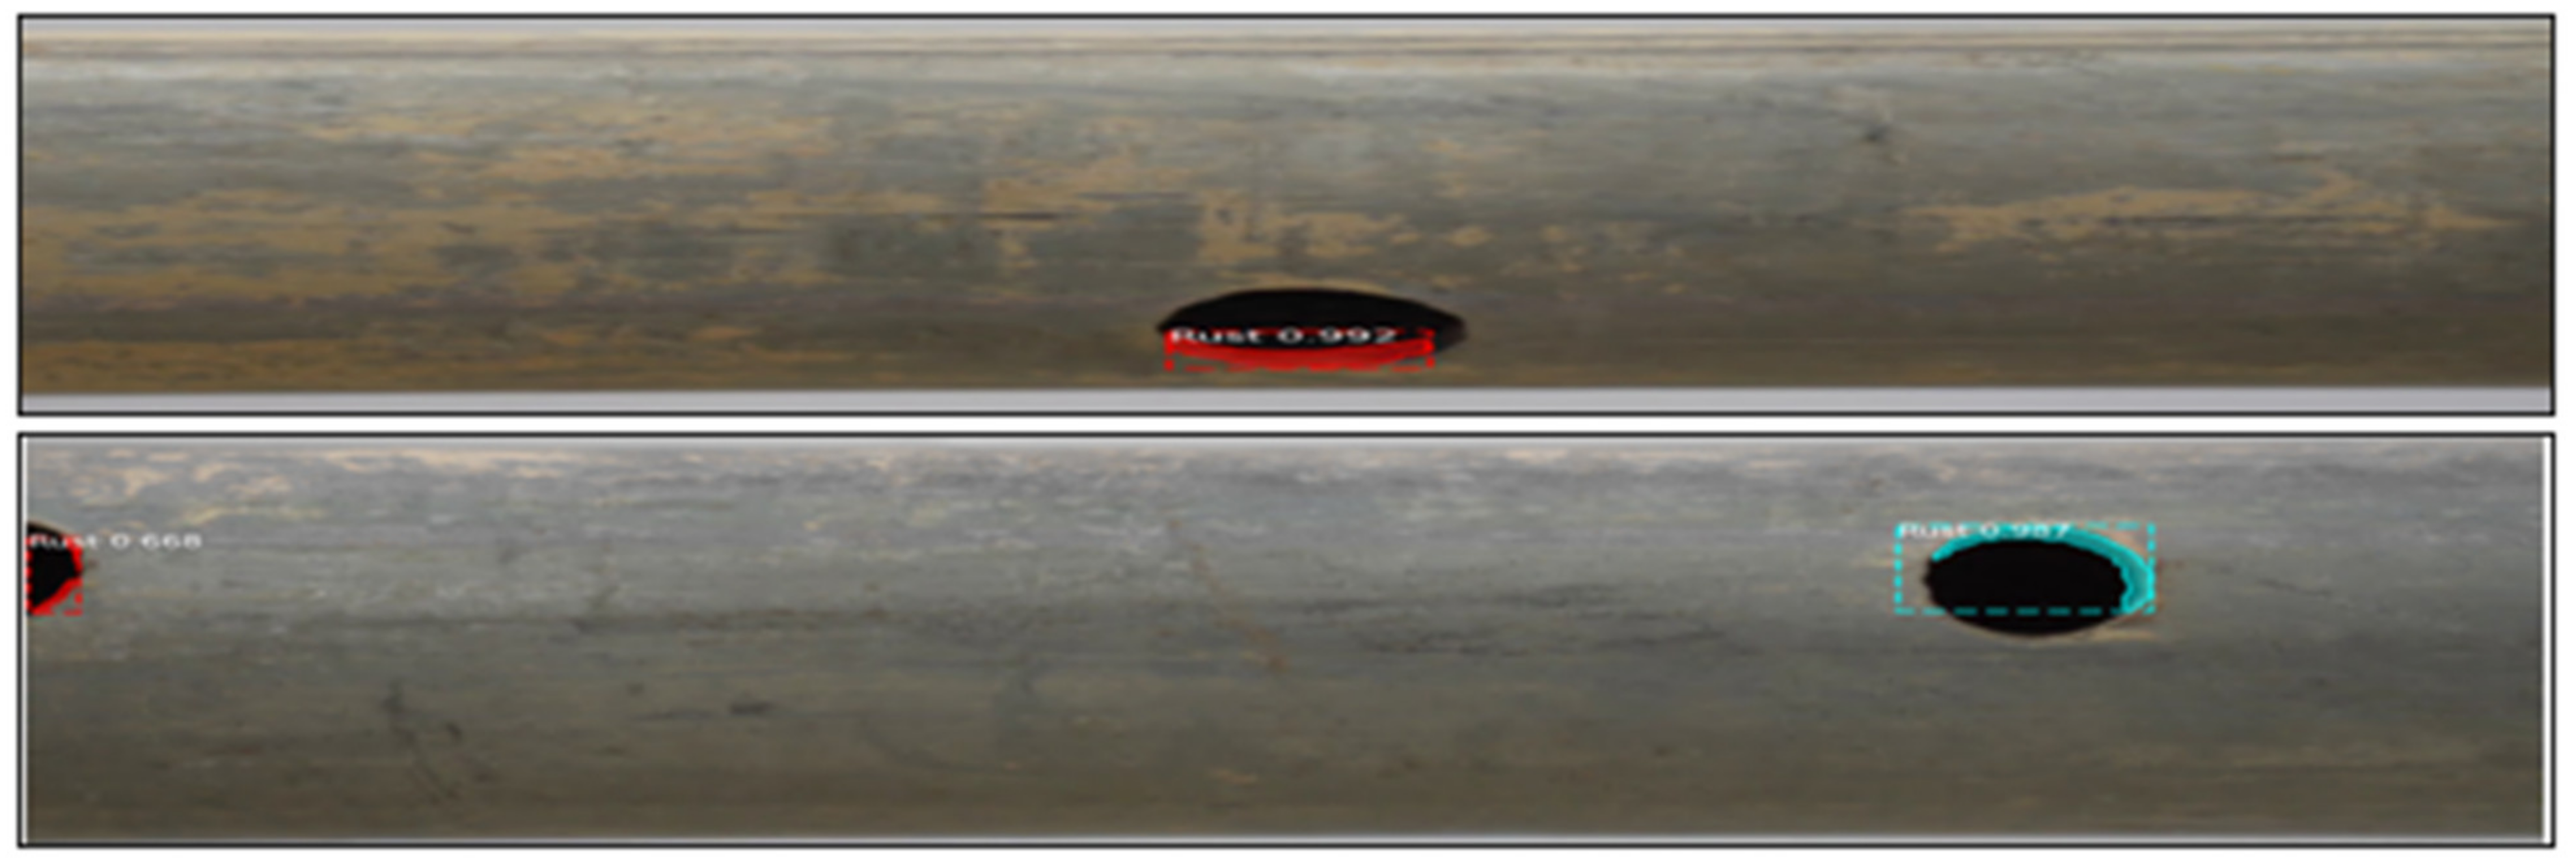
4.1. 2D Image-Based Defect Detection
Figure 16 and Table 6 illustrate mean average precision after 200 epochs. The obtained prediction accuracy can be attributed to the difficulty of defining an exact rusted area boundary, even for an experienced professional. However, this accuracy can be improved by increasing the dataset and fine-tuning the model in an implementation stage.
Figure 16.
Mean average precision.
Table 6.
Mean average precision.
Figure 17 shows an example of a predicted mask.
Figure 17.
Predicted mask.
The real dimensions of deformations are calculated by Equation (6) as the ratio of the pixel and real sizes.
4.2. 3D Point Cloud-Based Defect Detection
All sensors have certain errors that turn into various artifacts, such as isolated dots that hang in the air where they should not be. To remove noise, the method of calculating the statistical characteristics of distances to other points was used. Figure 18 illustrates the sample point cloud (a) before noise removal and (b) after.
Figure 18.
Noise removal. (a) Before, (b) after.
To determine defects, two sets of point clouds were compared: non-defective parts, as a reference, and defective parts. Figure 19a shows examples of the calculated distance between point clouds, with the defect depth represented in color gradations.
Figure 19.
Point-to-point distance. (a) Point-to- point distance, (b) projected to plane, (c) segmented by Mask R-CNN.
After calculating point-to-point distance, the point cloud was projected to plane (Figure 19b) and then defects were divided into deformation and cracks, depending on the form, by using Mask R-CNN. The model was trained on a mixed dataset with weighted dataset and Dice mask loss. The process was the same as for the 2D image segmentation part. The final mAP on the validation dataset was 0.65.
4.3. Quality Inspection System
Figure 20 illustrates the prototype of the graphical user interface of the proposed inspection system. The web application allows the grouping of the inspection results by location, type, quality, and date. In addition, the search engine was implemented to search by word.
Figure 20.
Prototype of graphical user interface.
The results of the inspection could be printed and saved on local computer or cloud database to be accessible through the internet.
5. Limitations
There are a few limitations in the current study that can be improved in future studies.
- With the same brightness as the background, the object may not have a clear border in the image, or it may be “noisy” with noise, making it impossible to select the contours of deformations.
- Overlapping objects, or the problem of their grouping results in the contour not matching the border of the scaffolding.
- Results vary greatly, depending on image quality, shooting conditions, and scaffolding distance.
- Currently, there are insufficient data on the quantitative indicators of deformations and their effects on the structural integrity of the scaffolding.
- The metrics for model accuracy are based on the assumption that the ground truth in the training dataset with real images is 100% true. However, since deformations have unusual shapes, it is sometimes difficult to determine the exact boundaries of the deformations, which ultimately affects the accuracy of the dataset.
6. Conclusions
Safety at the construction site depends on the quality of temporary structures. Therefore, periodic scaffolding quality inspection is essential. However, current methods involve only subjective assessment by workers, which has specific weaknesses.
The current study aimed to improve the quality evaluation system for temporary structures to evaluate the quality of scaffolding parts necessary to measure such parameters as rusty areas, cracks, and surface deformations. Recently, computer vision approaches have been widely used in various industries, and are relevant solutions in the construction field. Thus, this study proposed an automated quality inspection technology based on 2D and 3D data processing by ML algorithm.
The solution included two parts. Firstly, Mask R-CNN model-based convolutional neural network was used for recognizing rusty areas on images. The model training was performed on a combined real and synthetic dataset to solve the overfitting problem. The use of synthetic data improved the performance of neural networks and various machine learning algorithms, allowed reduction of the percentage of distortions, and significantly reduced the amount of necessary “real” data, saving time and money for the customer. Since the generator allows the obtainment of 3D data, it can become a source of new data not only for the task of classical computer vision, but also for several tasks of geometric computer vision.
Secondly, point-to-point differences were calculated, and classification of defects was carried out for the purpose of deformation and crack detection on point cloud. The use of a point cloud for deformation detection obtains more accurate results than 2D images, but the method has a limitation in detection of rusted areas and more expensive computational costs.
The findings of the current study present a few recommendations and options for improving the current inspections. Despite their various limitations, new methods are extremely important for future studies. The benefits of the new methodology were significant during the experiments, and we expect that they will be realized in the future.
Author Contributions
Conceptualization, A.K., S.L., J.S. and S.C.; data curation, A.K.; formal analysis, A.K.; investigation, A.K.; methodology, A.K.; project administration, K.L. and S.K.; resources, A.K.; software, A.K.; supervision, K.L. and S.K.; validation, A.K.; visualization, A.K.; writing—original draft, A.K.; writing—review & editing, A.K. All authors have read and agreed to the published version of the manuscript.
Funding
This work was financially supported by the Korea Ministry of Land, Infrastructure and Transport (MOLIT) under the “Innovative Talent Education Program for Smart City”. This research was conducted with the support of the “National R&D Project for Smart Construction Technology (No. 21SMIP-A158708-03)” funded by the Korea Agency for Infrastructure Technology Advancement under the Ministry of Land, Infrastructure and Transport, and managed by the Korea Expressway Corporation.
Institutional Review Board Statement
Not applicable.
Informed Consent Statement
Not applicable.
Conflicts of Interest
The authors declare no conflict of interest.
References
- U.S. Bureau of Labor Statistics. Census of Fatal Occupational Injuries. Available online: https://www.bls.gov/iif/oshcfoi1.htm (accessed on 17 September 2021).
- Analysis of Industrial Accident Status 2019. Available online: http://www.moel.go.kr/index.do (accessed on 17 September 2021).
- Darko, A.; Chan, A.P.C.; Adabre, M.A.; Edwards, D.J.; Hosseini, M.R.; Ameyaw, E.E. Artificial Intelligence in the AEC Industry: Scientometric Analysis and Visualization of Research Activities. Autom. Constr. 2020, 112, 103081. [Google Scholar] [CrossRef]
- Li, H.; Lu, M.; Hsu, S.-C.; Gray, M.; Huang, T. Proactive Behavior-Based Safety Management for Construction Safety Improvement. Saf. Sci. 2015, 75, 107–117. [Google Scholar] [CrossRef]
- Kim, H.; Kim, K.; Kim, H. Vision-Based Object-Centric Safety Assessment Using Fuzzy Inference: Monitoring Struck-By Accidents with Moving Objects. J. Comput. Civ. Eng. 2016, 30, 04015075. [Google Scholar] [CrossRef]
- Xu, S.; Wang, J.; Shou, W.; Ngo, T.; Sadick, A.-M.; Wang, X. Computer Vision Techniques in Construction: A Critical Review. Arch. Comput. Methods Eng. 2021, 28, 3383–3397. [Google Scholar] [CrossRef]
- Dung, C.V.; Anh, L.D. Autonomous Concrete Crack Detection Using Deep Fully Convolutional Neural Network. Autom. Constr. 2019, 99, 52–58. [Google Scholar] [CrossRef]
- Yamaguchi, T.; Hashimoto, S. Fast Crack Detection Method for Large-Size Concrete Surface Images Using Percolation-Based Image Processing. Mach. Vis. Appl. 2010, 21, 797–809. [Google Scholar] [CrossRef]
- Liu, Z.; Cao, Y.; Wang, Y.; Wang, W. Computer Vision-Based Concrete Crack Detection Using U-Net Fully Convolutional Networks. Autom. Constr. 2019, 104, 129–139. [Google Scholar] [CrossRef]
- Zhang, A.; Wang, K.C.P.; Li, B.; Yang, E.; Dai, X.; Peng, Y.; Fei, Y.; Liu, Y.; Li, J.Q.; Chen, C. Automated Pixel-Level Pavement Crack Detection on 3D Asphalt Surfaces Using a Deep-Learning Network. Comput. Aided Civ. Infrastruct. Eng. 2017, 32, 805–819. [Google Scholar] [CrossRef]
- Zhang, A.; Wang, K.C.P.; Fei, Y.; Liu, Y.; Tao, S.; Chen, C.; Li, J.Q.; Li, B. Deep Learning–Based Fully Automated Pavement Crack Detection on 3D Asphalt Surfaces with an Improved CrackNet. J. Comput. Civ. Eng. 2018, 32, 04018041. [Google Scholar] [CrossRef]
- Liu, B.; Wu, S.; Zou, S. Automatic Detection Technology of Surface Defects on Plastic Products Based on Machine Vision. In Proceedings of the 2010 International Conference on Mechanic Automation and Control Engineering, Wuhan, China, 26–28 June 2010; pp. 2213–2216. [Google Scholar]
- Tao, X.; Zhang, D.; Ma, W.; Liu, X.; Xu, D. Automatic Metallic Surface Defect Detection and Recognition with Convolutional Neural Networks. Appl. Sci. 2018, 8, 1575. [Google Scholar] [CrossRef]
- Xiong, Z.; Li, Q.; Mao, Q.; Zou, Q. A 3D Laser Profiling System for Rail Surface Defect Detection. Sensors 2017, 17, 1791. [Google Scholar] [CrossRef]
- Aubreton, O.; Bajard, A.; Verney, B.; Truchetet, F. Infrared System for 3D Scanning of Metallic Surfaces. Mach. Vis. Appl. 2013, 24, 1513–1524. [Google Scholar] [CrossRef]
- Hong-Seok, P.; Mani, T.U. Development of an Inspection System for Defect Detection in Pressed Parts Using Laser Scanned Data. Procedia Eng. 2014, 69, 931–936. [Google Scholar] [CrossRef][Green Version]
- Zhang, D.; Zou, Q.; Lin, H.; Xu, X.; He, L.; Gui, R.; Li, Q. Automatic Pavement Defect Detection Using 3D Laser Profiling Technology. Autom. Constr. 2018, 96, 350–365. [Google Scholar] [CrossRef]
- Madrigal, C.; Branch, J.; Restrepo, A.; Mery, D. A Method for Automatic Surface Inspection Using a Model-Based 3D Descriptor. Sensors 2017, 17, 2262. [Google Scholar] [CrossRef]
- Li, J.; Su, Z.; Geng, J.; Yin, Y. Real-Time Detection of Steel Strip Surface Defects Based on Improved YOLO Detection Network. IFAC-PapersOnLine 2018, 51, 76–81. [Google Scholar] [CrossRef]
- Wang, W.; Su, C. Semi-Supervised Semantic Segmentation Network for Surface Crack Detection. Autom. Constr. 2021, 128, 103786. [Google Scholar] [CrossRef]
- Pan, G.; Zheng, Y.; Guo, S.; Lv, Y. Automatic Sewer Pipe Defect Semantic Segmentation Based on Improved U-Net. Autom. Constr. 2020, 119, 103383. [Google Scholar] [CrossRef]
- Feng, W.; Liu, H.; Zhao, D.; Xu, X. Research on Defect Detection Method for High-Reflective-Metal Surface Based on High Dynamic Range Imaging. Optik 2020, 206, 164349. [Google Scholar] [CrossRef]
- He, H.; Garcia, E.A. Learning from Imbalanced Data. IEEE Trans. Knowl. Data Eng. 2009, 21, 1263–1284. [Google Scholar] [CrossRef]
- Chawla, N.V.; Bowyer, K.W.; Hall, L.O.; Kegelmeyer, W.P. SMOTE: Synthetic Minority Over-Sampling Technique. jair 2002, 16, 321–357. [Google Scholar] [CrossRef]
- Goyal, M.; Rajpura, P.; Bojinov, H.; Hegde, R. Dataset Augmentation with Synthetic Images Improves Semantic Segmentation. In Proceedings of the Computer Vision, Pattern Recognition, Image Processing, and Graphics, Mandi, India, 16–19 December 2018; Rameshan, R., Arora, C., Dutta Roy, S., Eds.; Springer: Singapore, 2018; pp. 348–359. [Google Scholar]
- Long, J.; Shelhamer, E.; Darrell, T. Fully Convolutional Networks for Semantic Segmentation. arXiv 2015, arXiv:1411.4038. [Google Scholar]
- Ronneberger, O.; Fischer, P.; Brox, T. U-Net: Convolutional Networks for Biomedical Image Segmentation. In Proceedings of the Medical Image Computing and Computer-Assisted Intervention—MICCAI 2015, Munich, Germany, 5–9 October 2015; Navab, N., Hornegger, J., Wells, W.M., Frangi, A.F., Eds.; Springer: Cham, Switzerland, 2015; pp. 234–241. [Google Scholar]
- Xu, Y.; Li, D.; Xie, Q.; Wu, Q.; Wang, J. Automatic Defect Detection and Segmentation of Tunnel Surface Using Modified Mask R-CNN. Measurement 2021, 178, 109316. [Google Scholar] [CrossRef]
- He, K.; Gkioxari, G.; Dollár, P.; Girshick, R. Mask R-CNN. arXiv 2018, arXiv:1703.06870. [Google Scholar]
- Jadon, S. A Survey of Loss Functions for Semantic Segmentation. In Proceedings of the 2020 IEEE Conference on Computational Intelligence in Bioinformatics and Computational Biology (CIBCB), Online, 27–29 October 2020; pp. 1–7. [Google Scholar] [CrossRef]
- Fischler, M.A.; Bolles, R.C. Random Sample Consensus: A Paradigm for Model Fitting with Applications to Image Analysis and Automated Cartography. Commun. ACM 1981, 24, 381–395. [Google Scholar] [CrossRef]
- KOSHA GUIDE H-36–2011. Technical Guidelines for Safety of Installation and Use of Mobile Scaffold. 2018. Available online: https://www.kosha.or.kr/kosha/data/guidanceDetail.do (accessed on 14 September 2021). (In Korean).
Publisher’s Note: MDPI stays neutral with regard to jurisdictional claims in published maps and institutional affiliations. |
© 2022 by the authors. Licensee MDPI, Basel, Switzerland. This article is an open access article distributed under the terms and conditions of the Creative Commons Attribution (CC BY) license (https://creativecommons.org/licenses/by/4.0/).