1. Introduction
At present, there are a large number of human–machine display interfaces in industrial applications (such as mechanical instrument panels, Light-Emitting Diode display screens, Personal Computer monitors, etc.). However, these human–machine display interfaces are all “equipment-centric”, that is, these interfaces are fixed and can only be used for specific devices. With the rapid development of intelligent manufacturing and big data technology, a large amount of data information needs to be displayed in the workshop, which increases the integration complexity and cost of the traditional device-centric human–machine interface system [
1,
2]. Meanwhile, in the inspection and maintenance of complex equipment in the workshop, the relevant guidance information needs to be quickly displayed to the operator to guide the operator to perform complex operations [
3]. Therefore, a workshop auxiliary system is urgently needed to assist and guide the operator to conduct complex inspection and maintenance tasks.
Augmented reality (AR) technology can merge computer-generated virtual information with the physical world. It can display real scenes and virtual ones simultaneously and provide a type of human–computer interaction [
4]. Augmented reality technology is a human-centered human–computer interaction and display technology. One of the main application areas of augmented reality technology is visualization. Unlike traditional visualization methods, AR inserts virtual objects and information directly into digital representations of the real world, which makes these objects and data more easily to understand and interactive [
5]. Schall [
6] presented an AR-based underground visualization system for aiding field workers of utility companies in outdoor tasks such as maintenance, planning, or surveying of underground infrastructure. Ma et al. [
5] designed a method for fusing AR views and indoor maps in changing environments during AR-GIS visualization. Recently Hoang et al. [
7] proposed an AR visualization platform that can display any Robot Operating System message data type in AR. Zheng et al. [
8] proposed an AR decision support framework to support immediate decisions within a smart environment by augmenting the user’s focal objects with assemblies of semantically relevant IoT data and corresponding suggestions. Tu et al. [
9] designed a mixed reality (MR) application for digital twin-based services. Taking an industrial crane platform as a case study, the application allowed crane operators to monitor the crane status and control its movement.
With the help of augmented reality technology, virtual models can be placed in real scenes to interact with real scenes while reducing the production of real models and improving industrial production efficiency. This research intends to apply augmented reality to factory visualization, design and implement a human-centered industrial display human–machine interface, that is, the operator uses AR glasses or handheld mobile computer equipment to query and display the information of the workshop with the assistance of identification and AR registration technology, thereby reducing the system integration complexity and cost. Although augmented reality technology has been applied to the industrial field, most of the existing AR industrial display systems are developed for specific application scenarios, which have poor versatility and a long development cycle. For example, the AR-based disassembly and assembly process guidance system is only for specific dedicated products. This research proposes a quick development toolkit for augmented reality visualization of a factory (QDARV). With this tool, AR programs for different application objects can be quickly designed, and a human-centered AR display interface can be established.
The main contributions of this paper are summarized as follows. (1) A quick development toolkit called QDARV is proposed for augmented reality visualization of a factory. This tool can be used to quickly develop industrial AR applications, achieve AR registration based on quick response (QR) code and simultaneous localization and mapping (SLAM), and display information such as disassembly animations, industrial instruments, pictures, and texts in real scenes. (2) An AR registration method based on SLAM map reloading is proposed. Meanwhile, the map saving and map loading functions are extended based on ORB_SLAM2 [
10]. Through saving and reloading the map and the configuration and analysis of the SLAM-AR display content script, the reloaded display of the AR scene is achieved. (3) With ORB_SLAM2 based on the feature point method, the object is used as a landmark to assist the SLAM system in positioning, thereby establishing a SLAM system that can build object-oriented semantic maps and improve the tracking performance.
This paper is organized as follows.
Section 2 reviews the related studies.
Section 3 introduces the methods used in this study, including design of the QDARV system, AR configuration software, script parsing software, and AR display software.
Section 4 conducts experiments to prove the validity of the method proposed in this study.
Section 5 presents the discussion and future work of this study.
3. Methods
3.1. System Design
This study proposes a quick development toolkit called QDARV for augmented reality visualization of a factory. The main goal of QDARV is to assist developers in quickly developing industrial AR systems for augmented reality visualization of a factory. Developers only need to configure augmented reality display content and augmented reality registration parameters to realize assembly disassembly animation display, industrial instrument display, tracking, and AR registration for large plant scenes in real scenes, thereby reducing code writing, improving development efficiency, and quickly customizing AR visualization content.
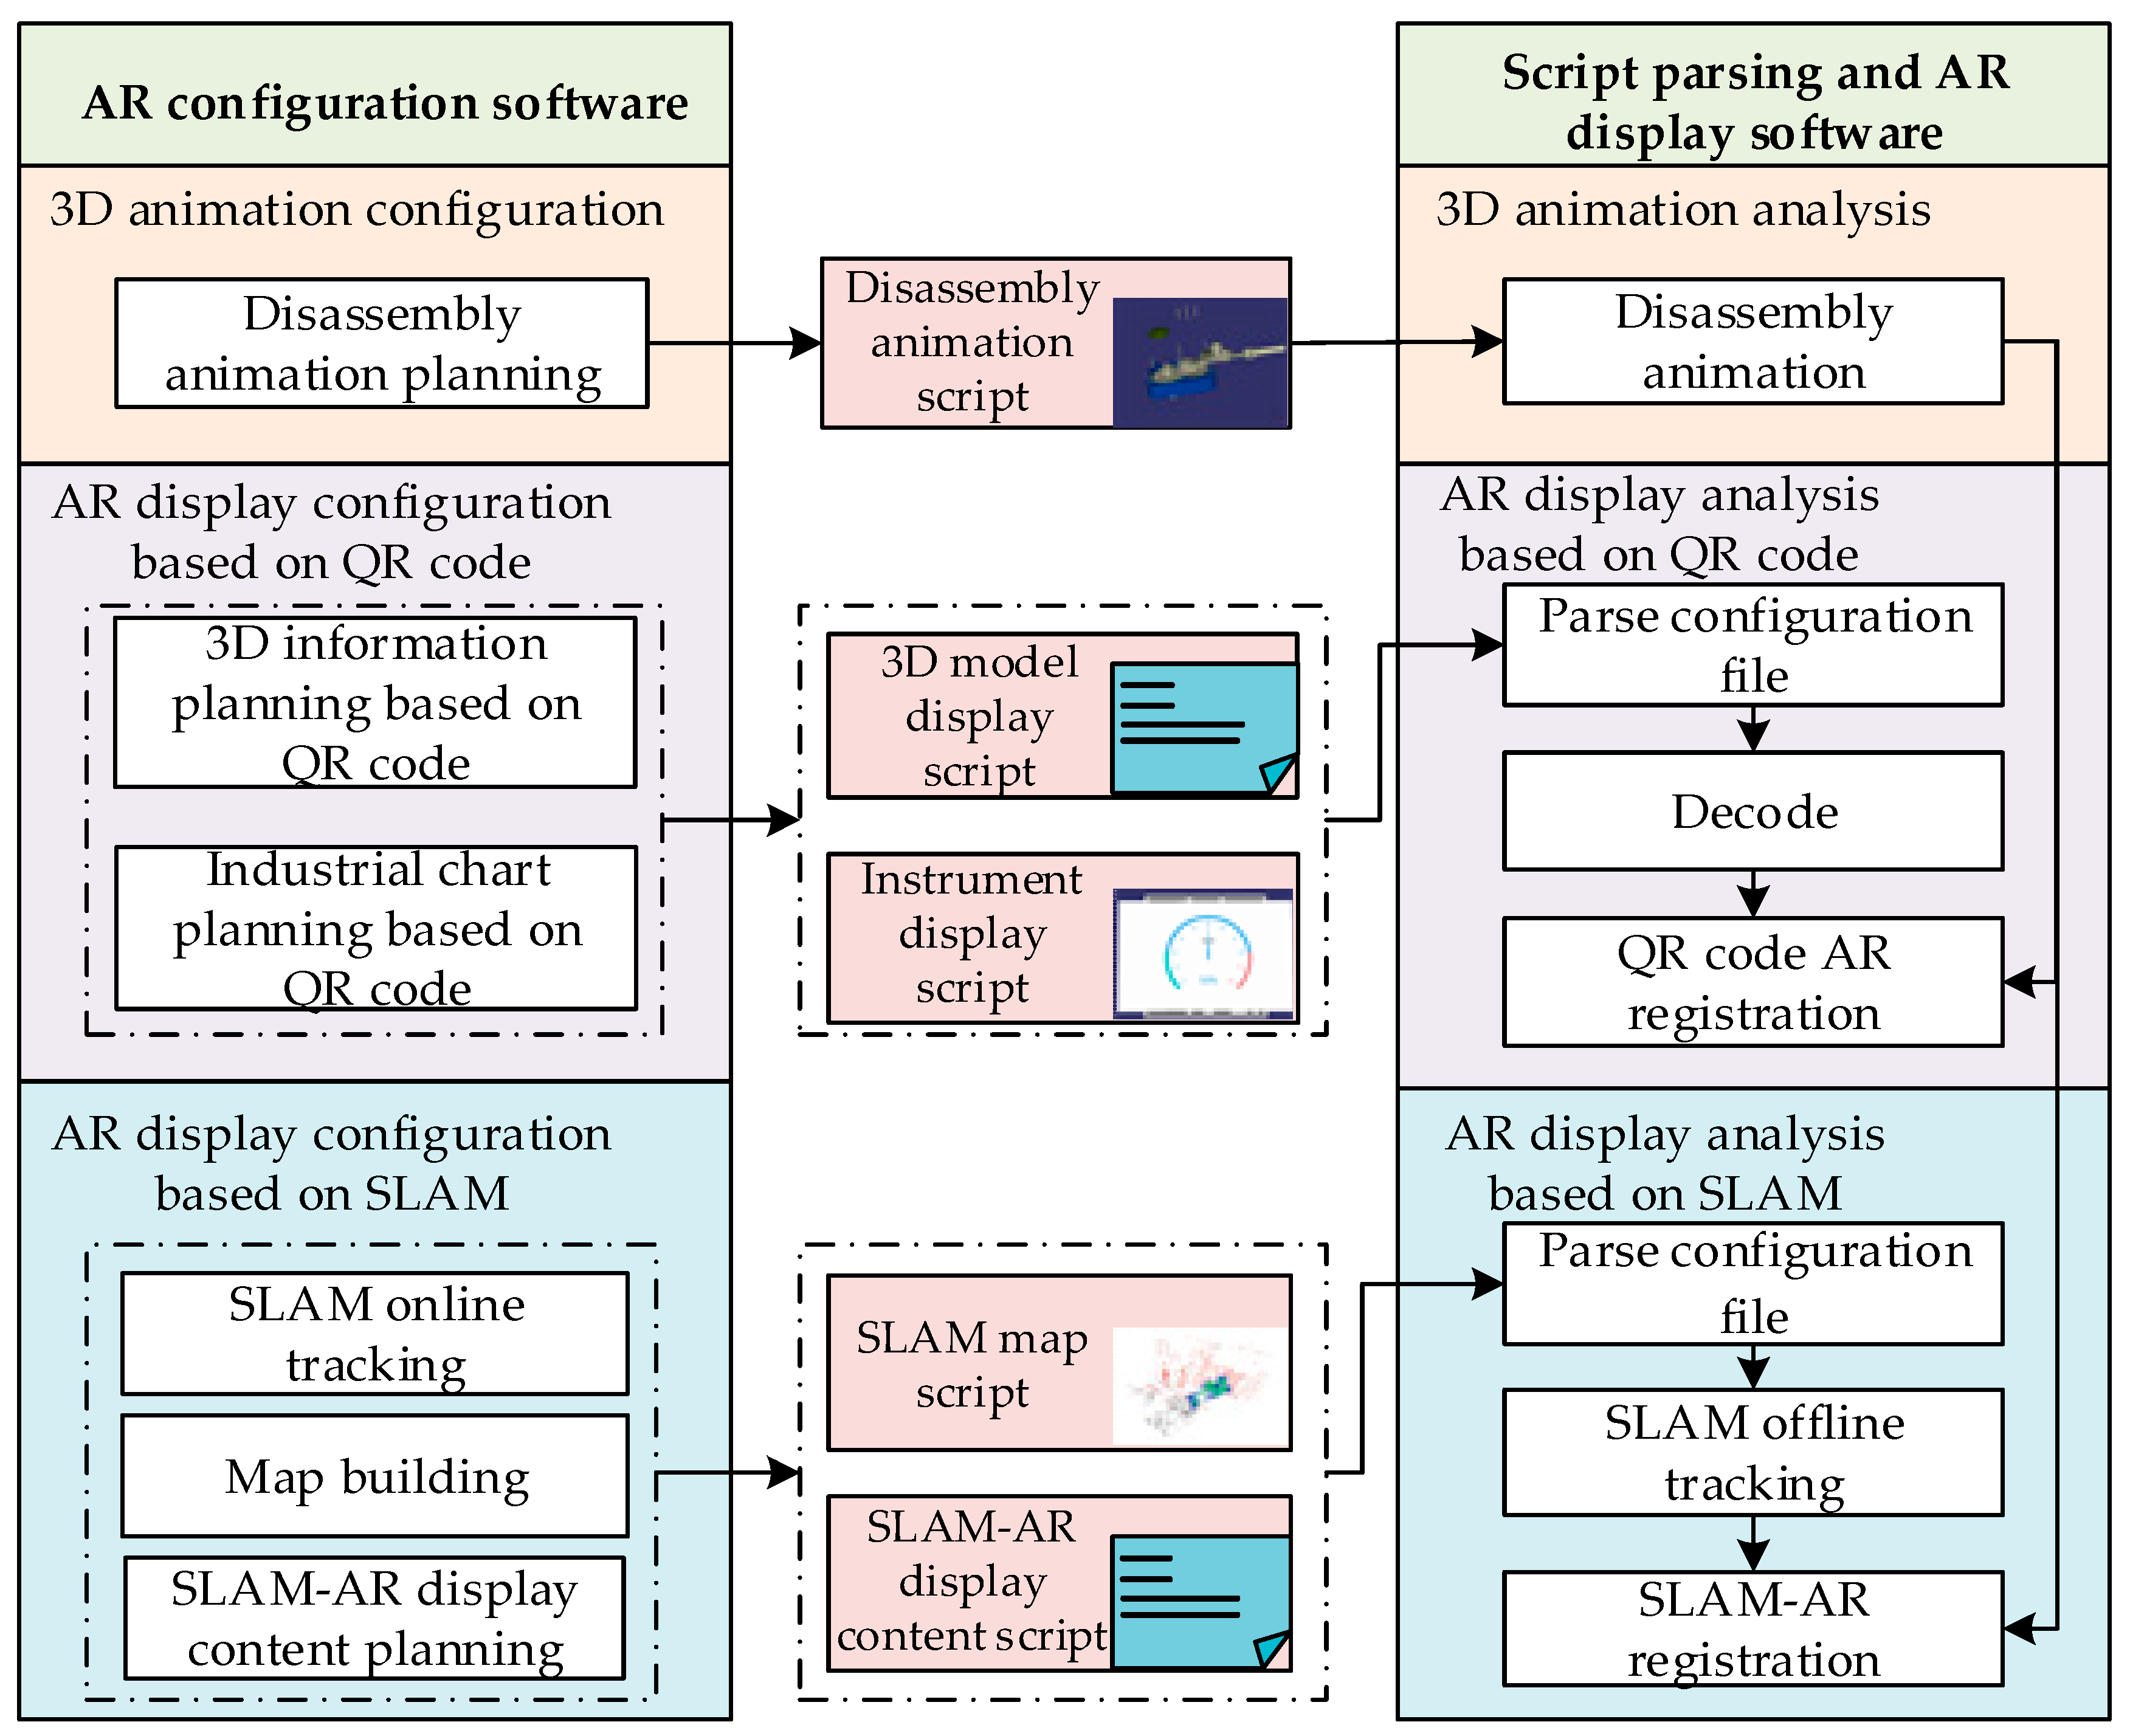
The QDARV toolkit includes AR configuration software, script parsing, and AR display software.
Figure 1 shows the overall framework of the QDARV system, in which the AR configuration software is composed of three parts: the 3D animation configuration module, the AR display configuration module based on QR code, and the AR display configuration module based on SLAM. Corresponding to the AR configuration software, the script parsing and AR display software consists of three parts: the 3D animation analysis module, the AR display analysis module based on QR code, and the AR display analysis module based on SLAM. The modules of the AR configuration software and the script parsing and the AR display software exchange data through intermediate script files. By using this toolkit, users can quickly plan the augmented reality display content of the factory and realize augmented reality display of disassembly animations, industrial instruments, pictures, and texts. Developers do not need a deep understanding of augmented reality technology or extensive programming experience. Instead, they only need to use AR configuration software to configure the augmented reality display content and augmented reality registration parameters to generate intermediate script files. Script parsing and AR display software loads and parses these intermediate script files to generate augmented reality display content to quickly design industrial AR applications and customize the display of augmented reality content.
As shown in
Figure 1, the QDARV toolkit supports two AR working modes, namely the AR display mode based on QR code and AR display mode based on SLAM. In the AR display mode, users scan the QR code in the scene by using the parsing script and AR display software, which use the AR registration technology to superimpose the content in the real scene to the display. In the AR display mode, the parsing script and AR display software can use the scene positioning function of the SLAM algorithm to accurately superimpose virtual information into the physical scene, thereby achieving AR display. This study mainly designs the workflow of each module in the AR configuration software, parsing script, and AR display software of the QDARV system, and investigates data exchange between the modules through the intermediate script file to quickly achieve augmented reality display.
3.2. AR Configuration Software
3.2.1. Three-Dimensional Animation Configuration Module Design
The 3D animation configuration module is mainly used to plan the disassembly animation of the assembly and guide workers to complete disassembly operations. This module includes two parts: the assembly structure design unit and the assembly disassembly animation planning unit.
As for configuring 3D animation, the 3D animation model needs to be lightweight to improve the rendering speed. The main goal of lightweight processing is to make the assembly CAD model lightweight and output a lightweight assembly mesh model. Generally, CAD models have the characteristics of a large amount of information, massive redundant data, and complex structural relationships, which are not conducive to achieving rapid AR display on mobile devices. Therefore, lightweight processing of CAD models is necessary. In this study, the main steps of making the assembly model lightweight are as follows:
- (1)
Model format conversion: The CAD models of mechanical assemblies are mostly established by 3D modeling software, and most of the parts are solid models. In this study, the CAD models are converted into triangular mesh files and stored in the STL format;
- (2)
Mesh model simplification: under the premise of not affecting the appearance characteristics and display accuracy of the assembly model, the mesh model in the STL format is simplified, redundant patches are eliminated, and the accuracy of relatively smooth areas is reduced, thereby reducing the number of patches in the model and improving model rendering speed.
The assembly structure design unit is to add Degree of Freedom (DOF) nodes to the assembly model for motion planning of each part in the assembly model. This study converts the mesh model in the STL format into an OpenFlight format, adds DOF nodes to each part in the assembly in this file format, and establishes a local logical coordinate system to define the motion of the DOF node and its sub-nodes in this coordinate system.
The assembly disassembly animation planning unit is used to interactively plan the disassembly steps and the disassembly motion route of each part of the assembly in the virtual scene.
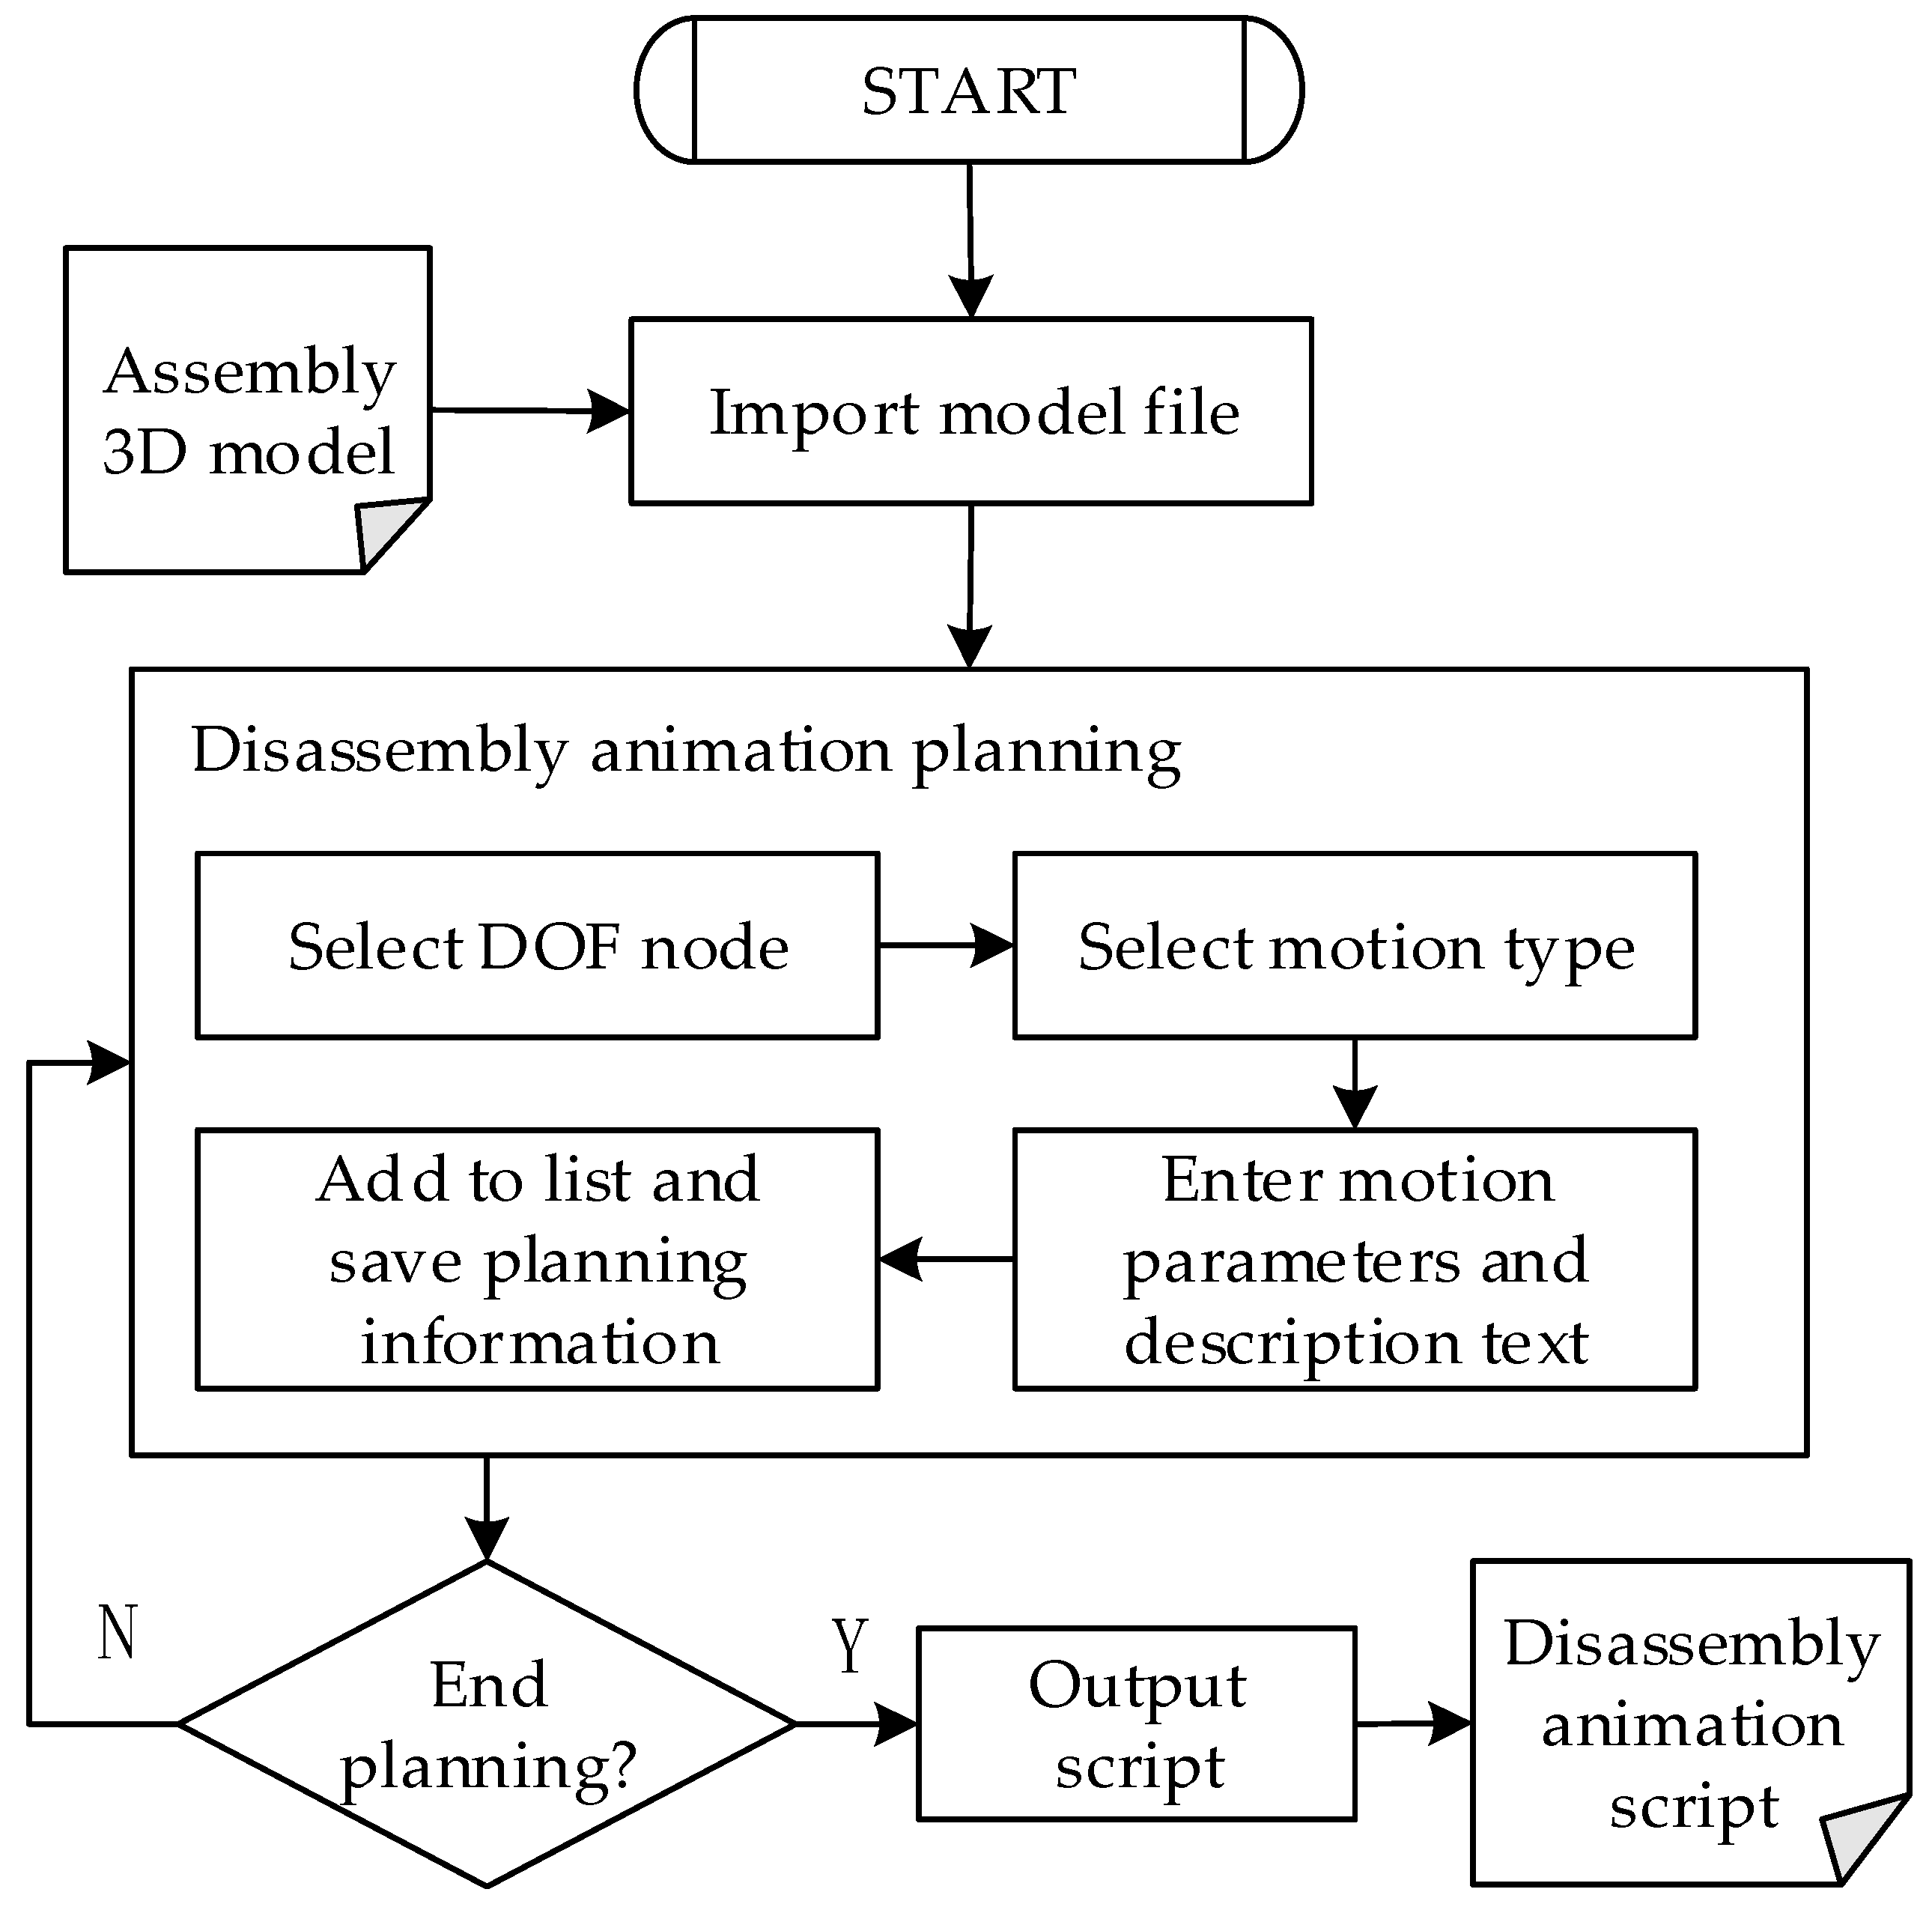
Figure 2 illustrates the assembly disassembly animation planning interface designed in this study. The assembly disassembly animation planning unit loads the assembly file in the OpenFlight format, extracts, and displays the DOF nodes in the assembly file. Each node is used as the logical coordinate system of the local motion of the model. The planning of disassembly steps can be completed by setting the motion type, motion direction, and motion speed of different nodes and their sub-nodes. Each step consists of multiple operations, and each operation involves motion planning for multiple parts.
Figure 3 shows the flow chart of the assembly disassembly animation planning unit. The planning process of specific disassembly steps can be divided into the following steps.
- (1)
The assembly model file in OpenFlight format is imported into the virtual scene for display. All DOF nodes in the assembly model are extracted and displayed;
- (2)
Planning assembly animation or planning disassembly animation is selected according to actual needs. When the former is selected, the display state of all nodes is “hidden” by default; when the latter is selected, the display state of all nodes is “displayed” by default;
- (3)
According to the disassembly steps, the corresponding DOF node is selected. This node is used as the local coordinate system. Meanwhile, the motion types, motion parameters (speed, range, etc.), and description text of the node and its sub-nodes are set. The motion types include translation, rotation, and scaling. The display state properties of nodes include highlighted display, outline display, hidden, semi-transparent display, and normal display. After a node is set up, its planning information is saved and displayed in the disassembly step planning list on the right side of the software;
- (4)
To continue to plan the disassembly animation, step (3) is repeated. When the planning ends, the above planning information is saved as an assembly disassembly animation script file.
3.2.2. AR Display Configuration Module Based on QR Code
The AR display configuration module based on the QR code is adopted to configure the parameter information of the QR code and the augmented reality display content after scanning the QR code. This module consists of two parts: the 3D information display planning unit based on QR code, and the instrument display planning unit based on QR code.
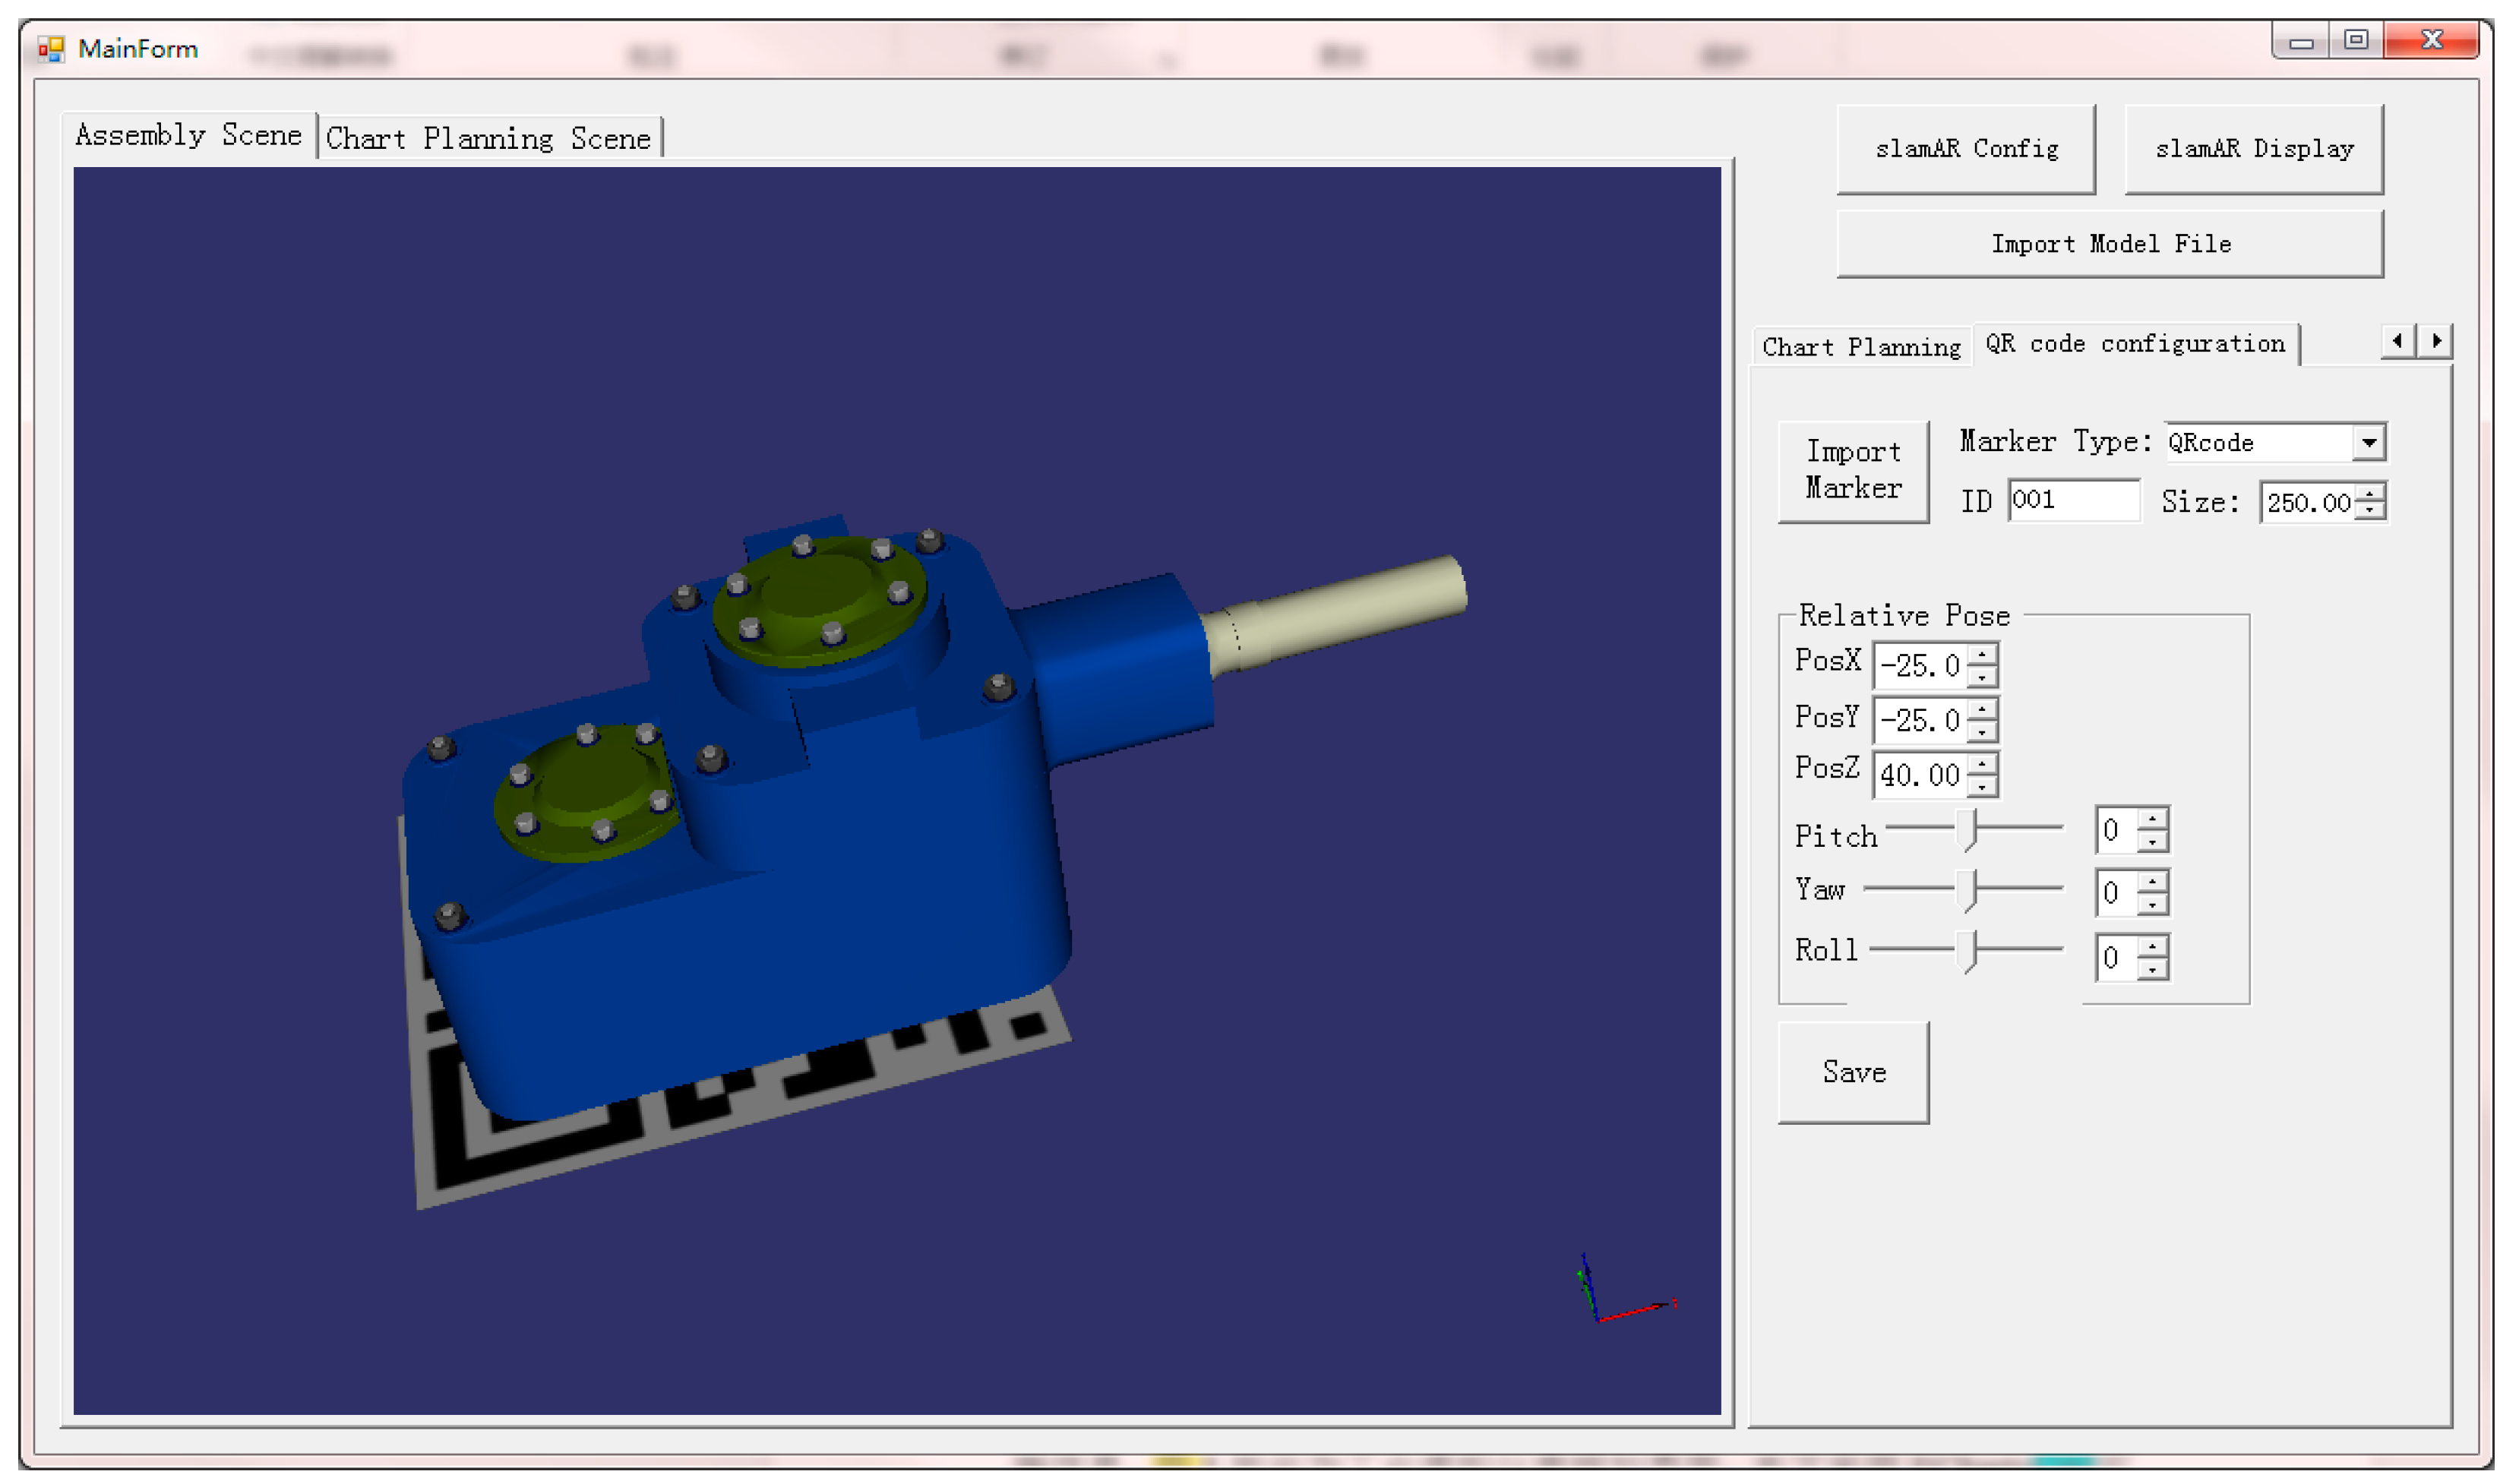
The 3D information display planning unit based on QR code is employed to bind the virtual model or animation with the QR code and set the pose relationship between the displayed content and the QR code.
Figure 4 shows the interface of the QR code information planning software; it imports the virtual model into the virtual scene. By configuring the size and number of the QR code and the relative pose with the virtual model, the configuration operation of the QR code and the virtual model is completed, thereby generating the script file for virtual model display.
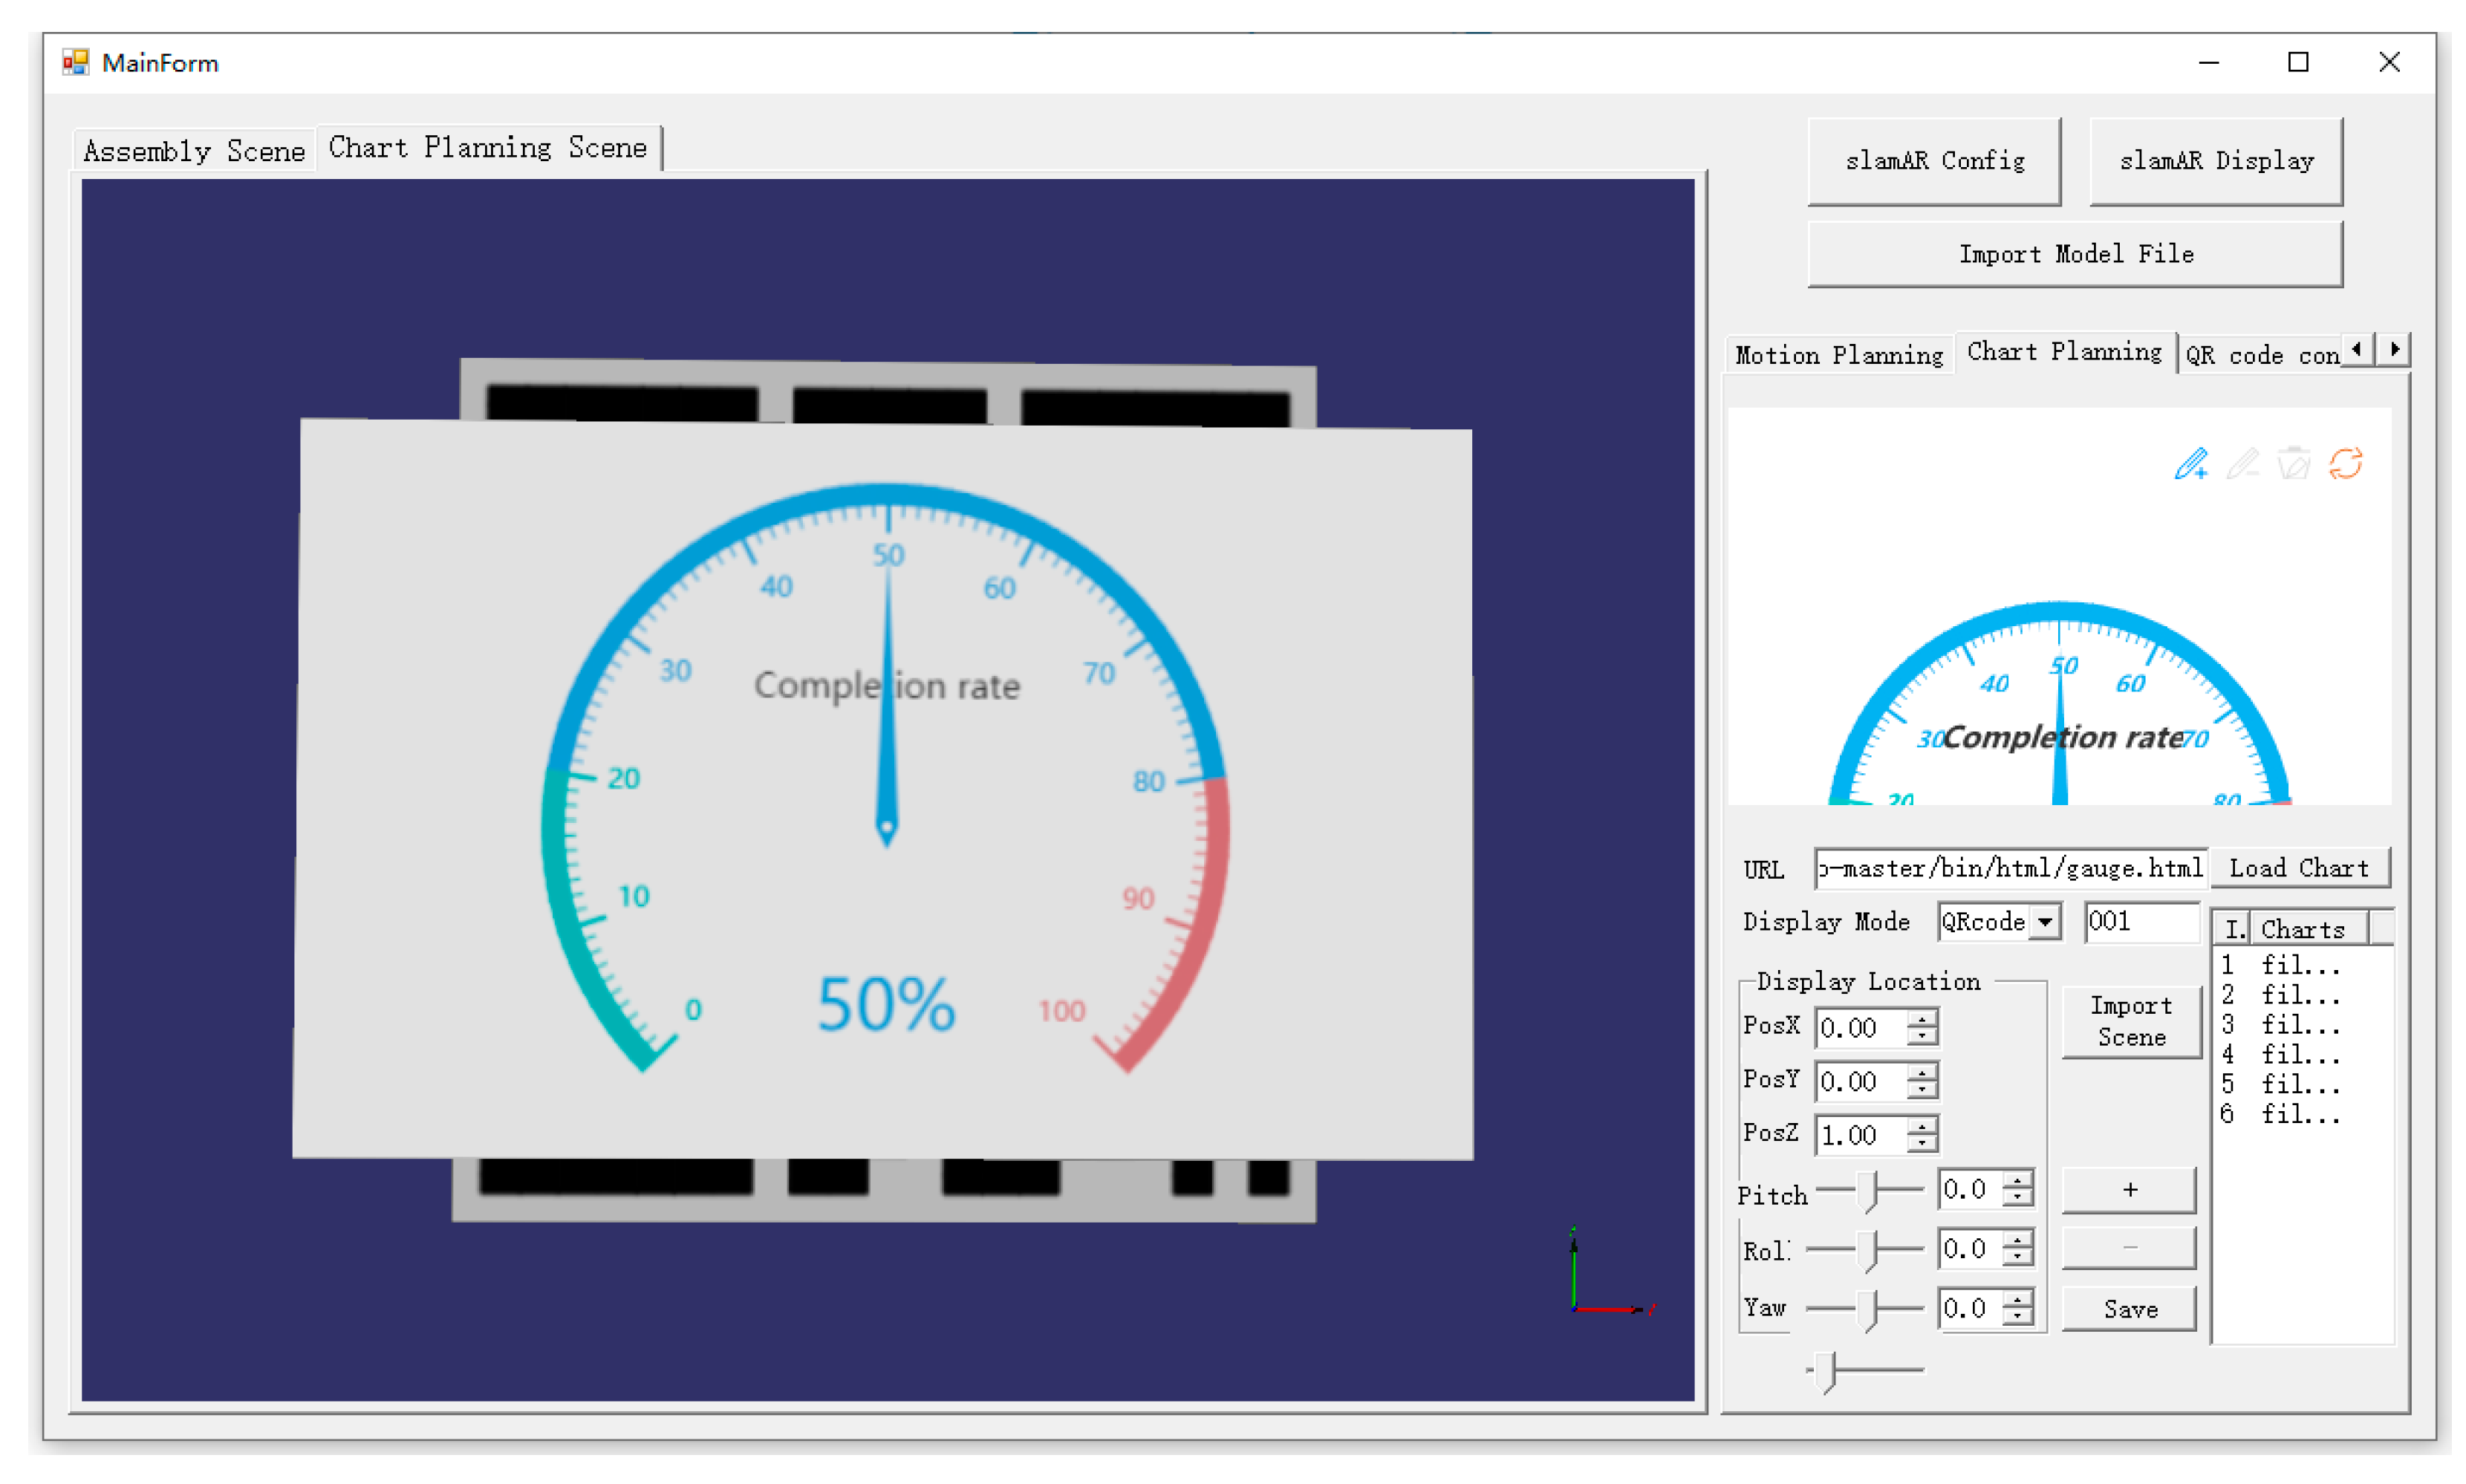
The instrument display planning unit based on QR code is used to plan information such as instrument interfaces corresponding to different QR codes, data labels, and relative display positions of the QR code and the virtual instrument in a virtual scene.
Figure 5 illustrates the industrial virtual instrument planning interface. This study adopts ECharts [
37], visualization library, and Websocket to build a virtual instrument library. Websocket is a full-duplex communication protocol based on the Transmission Control Protocol (TCP), and it can realize data exchange between script parsing and AR display software and server. By using Websocket, data can be retrieved from the data source in real-time, thus realizing real-time refresh of industrial virtual instruments.
The configuration process of the 3D information display planning unit based on QR code and the instrument display planning unit based on QR code is illustrated in
Figure 6. The planning process consists of the following steps.
- (1)
Configuration of QR code parameters: First, a QR code generator is used to generate a QR code, and each QR code corresponds to a different number. Then, in the planning interface, the number and size of the QR code are configured, and the corresponding QR code is imported into the virtual scene. Finally, the tracking plugin is configured according to the size of the QR code. The tracking plugin is employed to decode and track the position and attitude of the camera. The size information of the QR code is adopted to display the 3D animation model in a suitable size on the QR code;
- (2)
Configuration of the display content for scanning the QR code: The 3D animation model or virtual instrument file that needs to be displayed after scanning the QR code is imported. If a virtual instrument is imported, the data tags required by the instrument need to be set. Then, the instrument file requests data from the data forwarding interface through these data tags;
- (3)
Setting display parameters: The relative pose of the QR code and the 3D animation model or virtual instrument is adjusted. Meanwhile, the translation, rotation, and scaling parameters relative to the center point of the QR code are set;
- (4)
After completing the planning, the above configuration information is saved as a 3D model display script file or an instrument display script file.
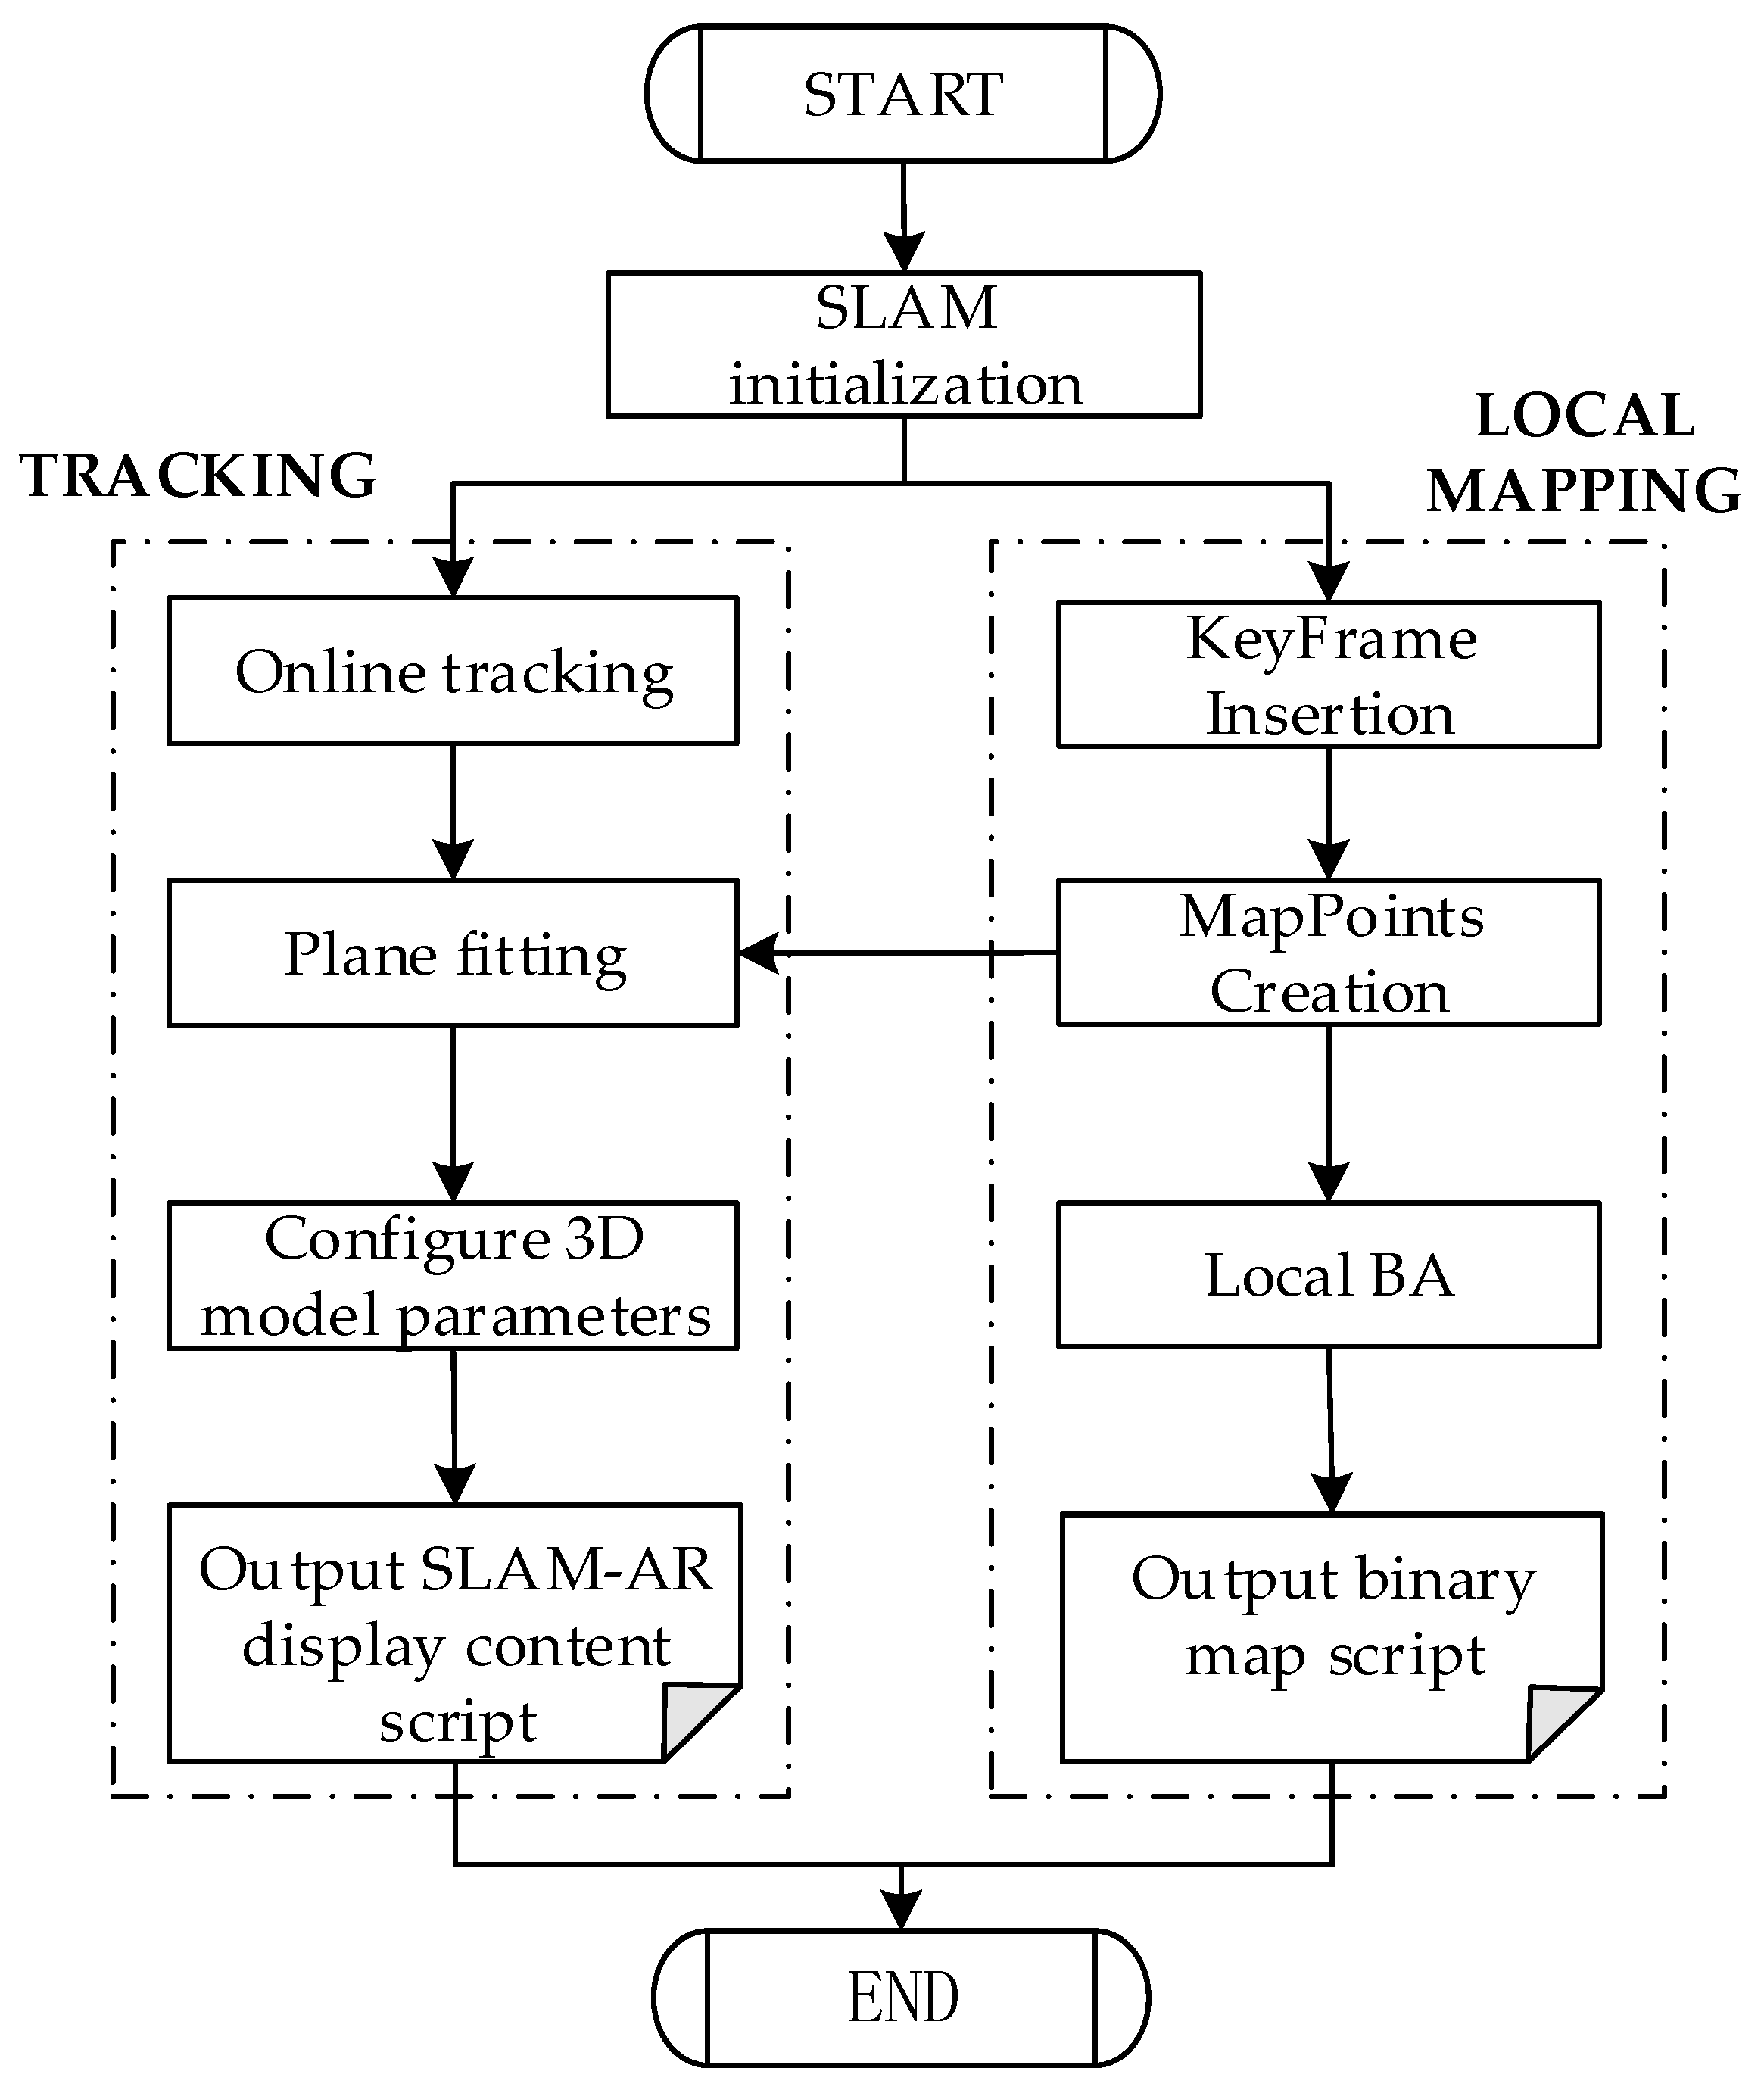
3.2.3. AR Display Configuration Module Based on SLAM
The AR display configuration module based on SLAM is used to save the SLAM map of the scene and configure the parameters of the virtual model in the scene. This module is developed based on ORB_SLAM2 and OpenSceneGraph (OSG) [
29], where the former is used for scene localization and mapping, and the latter is used for real-time rendering of 3D models in the scene. OSG has advantages of high performance, scalability, portability, and rapid development. This paper is the first to combine OSG with ORB_SLAM2 for rendering virtual models in marker-less AR.
ORB_SLAM2 can locate and map unknown scenes and realize AR registration. However, ORB_SLAM2 positioning must be run online. Once the system is shut down, the scene map built by the system and the virtual model in the scene is deleted. Thus, to save the scene map and display the virtual model in the scene when the map is loaded again, this study designed an AR display configuration module based on SLAM. This module builds a scene map under the online positioning mode of ORB_SLAM2 and places a virtual model on the map. After the mapping is completed, the system can save the scene map and the virtual model parameter configuration as binary SLAM map scripts and SLAM-AR display content scripts.
Figure 7 shows the flow chart of the AR display configuration module based on the SLAM designed in this study. In the AR configuration software, the SLAM system supports an online positioning working mode. The local mapping thread, tracking thread, and loop detection thread of the SLAM system run synchronously. Developers can initialize the SLAM system by scanning the industrial scene with a mobile camera.
In the tracking thread, the system performs feature matching with map points by finding feature points in the scene and minimizes the reprojection error of these features to the previous frame to estimate the current camera pose. Different from AR registration based on QR code, AR registration based on SLAM does not rely on prior markers. The system adopts the Random Sample Consensus (RANSAC) [
38] algorithm to fit the optimal plane from the map points in the current frame. Based on this, developers can click the graphic interaction button in the system interface to configure the 3D virtual model on the plane, and set the translation, rotation, and scaling parameters of the model. After the system is shut down, the parameter configuration of the 3D model is saved as a SLAM-AR display content script file.
In the local mapping thread, the system processes the image frame data and inserts information such as keyframes and map points into the map. Meanwhile, local Bundle Adjustment (BA) is required to optimize the entire local map. After the mapping thread ends, the keyframes, 3D map points, covisibility graph, and spanning tree in the map are saved as binary SLAM map script files.
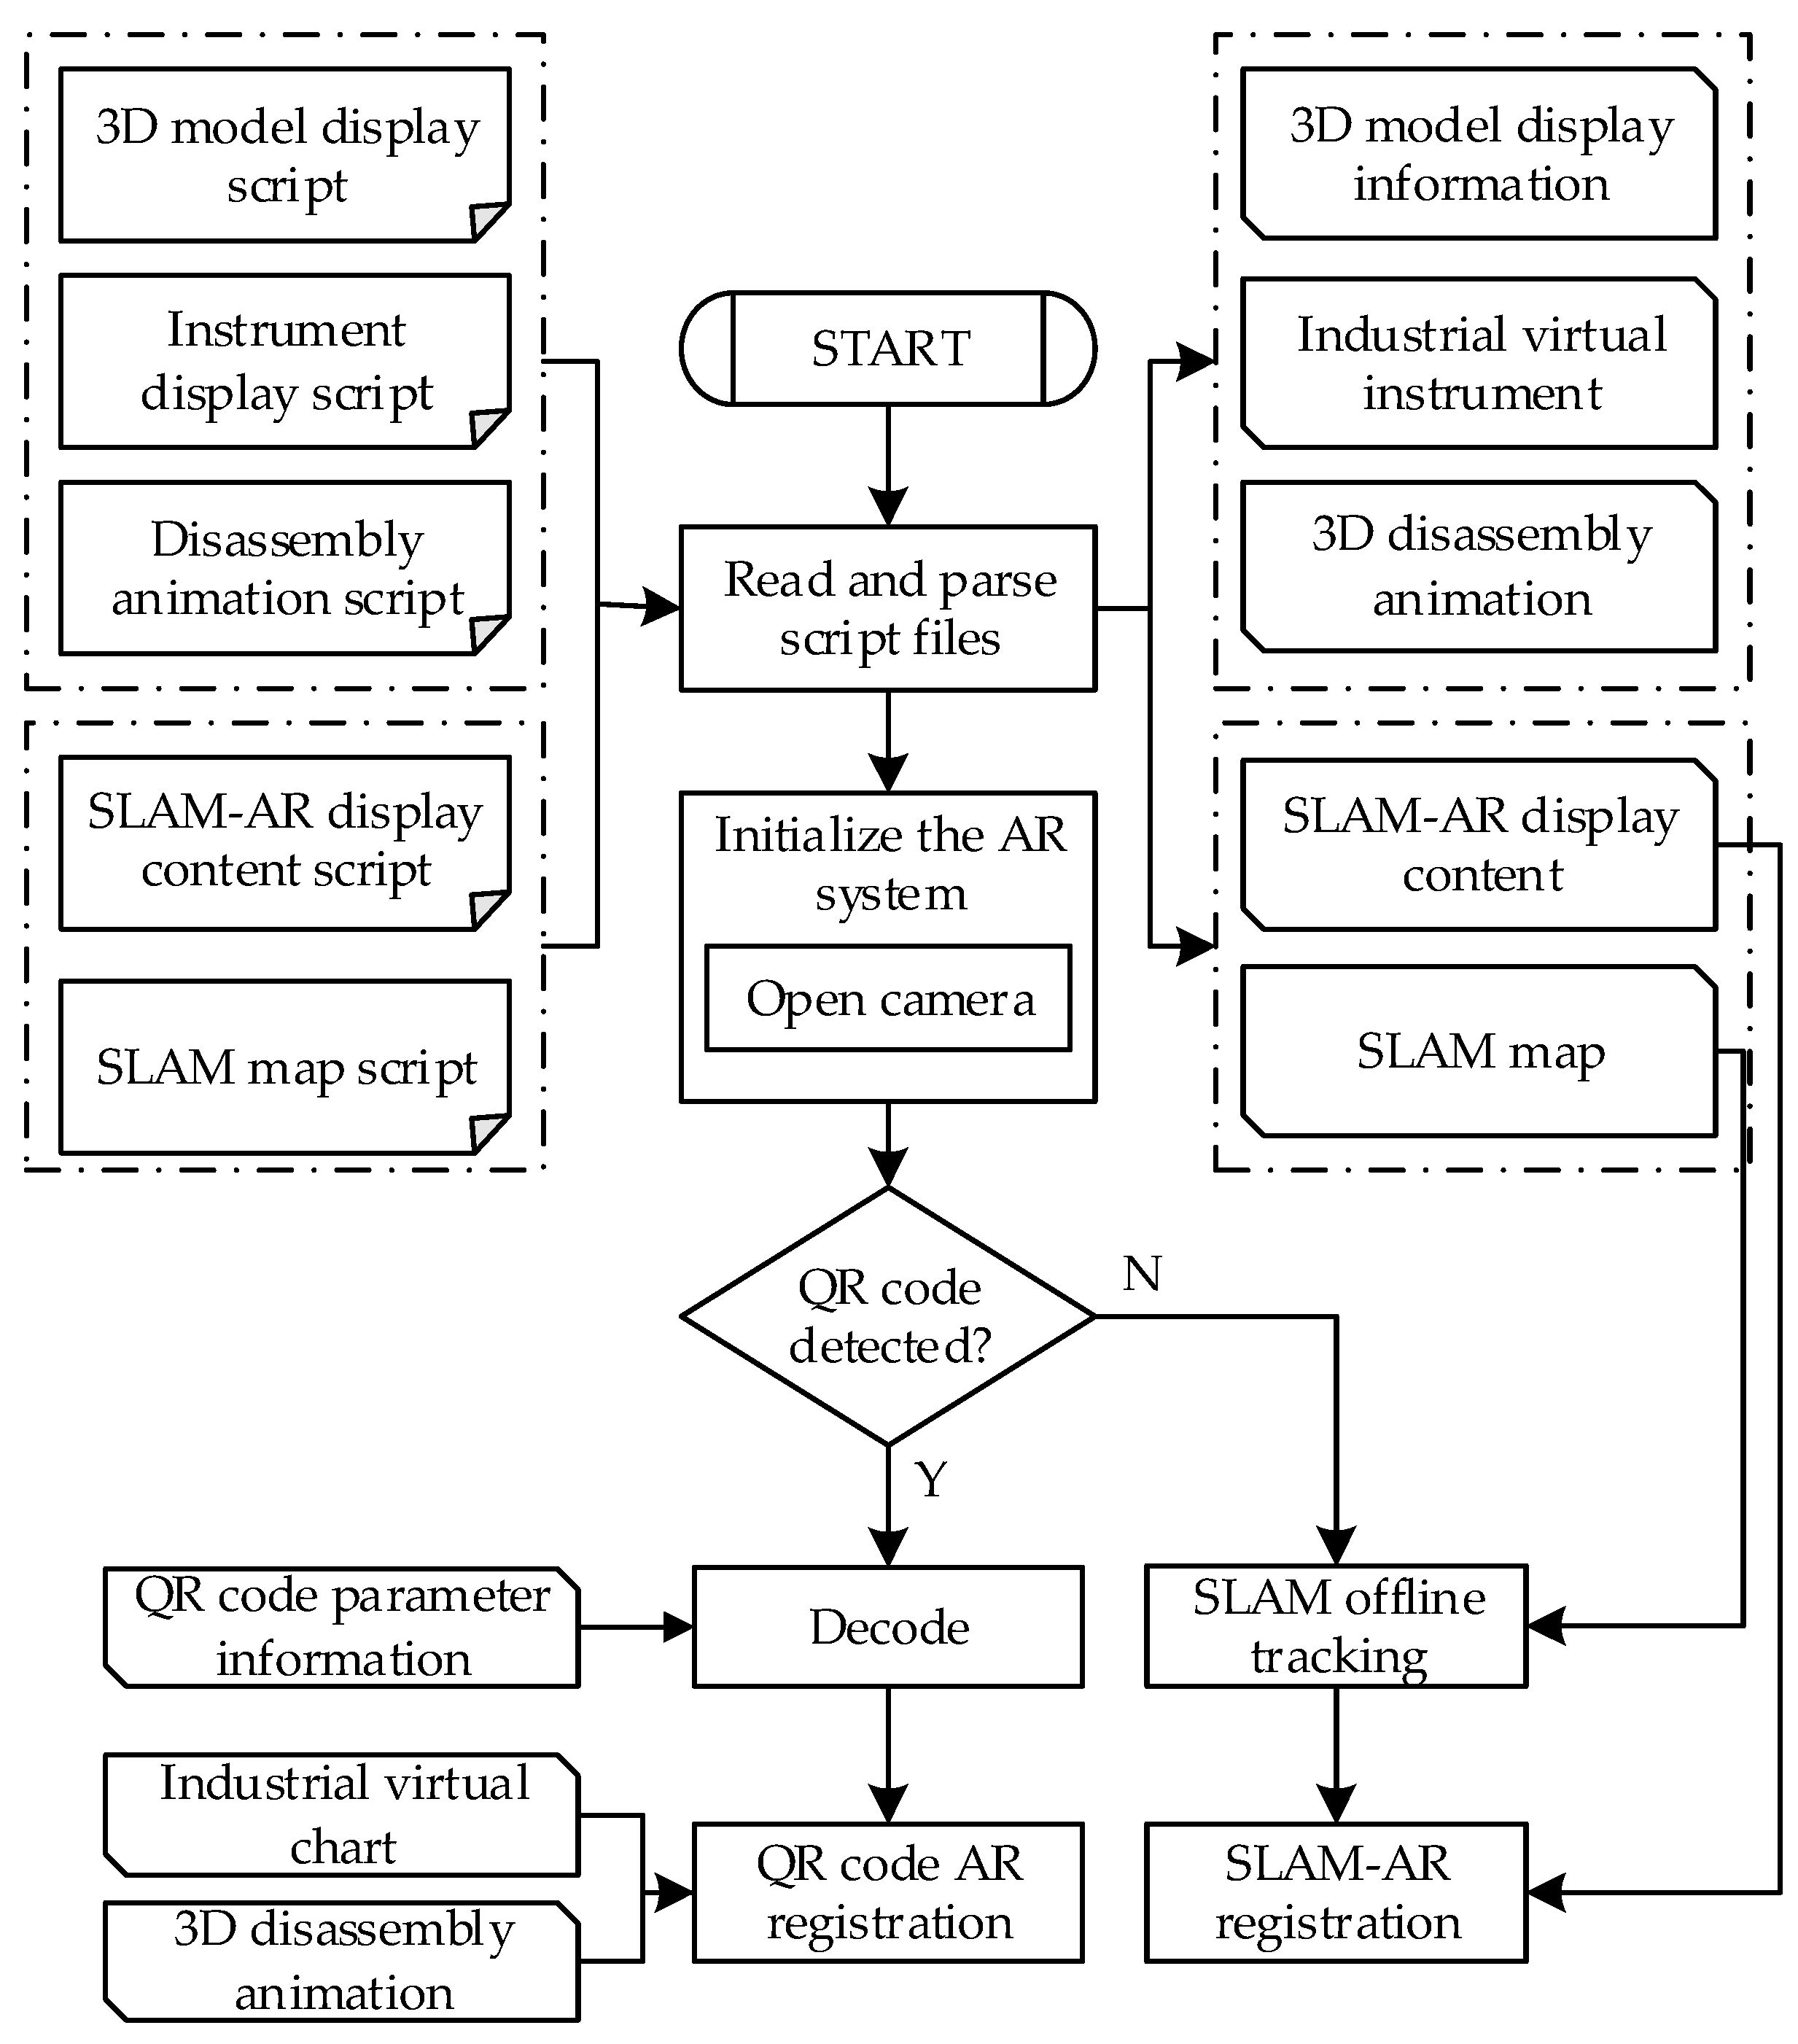
3.3. Script Parsing and AR Display Software
Three-dimensional registration is the core technology of the augmented reality system. It embeds virtual objects into the real scene according to the spatial perspective relationship by capturing the camera image frame and tracking the position and attitude of the camera. To parse the intermediate script files generated in the AR configuration software and quickly realize 3D registration, this study designed the script parsing and AR display software, whose flow chart is illustrated in
Figure 8. The system reads the 3D model display script file, instrument display script file, disassembly animation script, SLAM-AR display content script (.yaml), and SLAM map script (.bin) generated in the AR configuration software. Then, it parses the scripts and obtains 3D model display information, industrial virtual instrument, motion parameters of disassembly animation, SLAM-AR display content information, and binary SLAM map. This data information is used to initialize the AR system and realize AR registration.
By using the above-mentioned intermediate script files, the software supports two AR registration modes: AR registration based on QR code and AR registration based on SLAM map reloading. Moreover, the software integrates the two modes into the script parsing and AR display software. The two AR registration modes can switch freely in the actual scene. When the system detects that the image contains a QR code, based on the recognized QR code, it reads the number of the QR code, parses the display content (animation, instrument, etc.) corresponding to the number from the script file, and locates the pose between the QR code and the camera for AR registration based on the QR code. Otherwise, it loads the built SLAM scene map, scans the built scene, and tracks the pose of the camera through feature matching. Meanwhile, it parses the AR display content in the scene from the SLAM-AR display content script file and performs AR registration based on SLAM.
3.3.1. AR Registration Based on QR Code
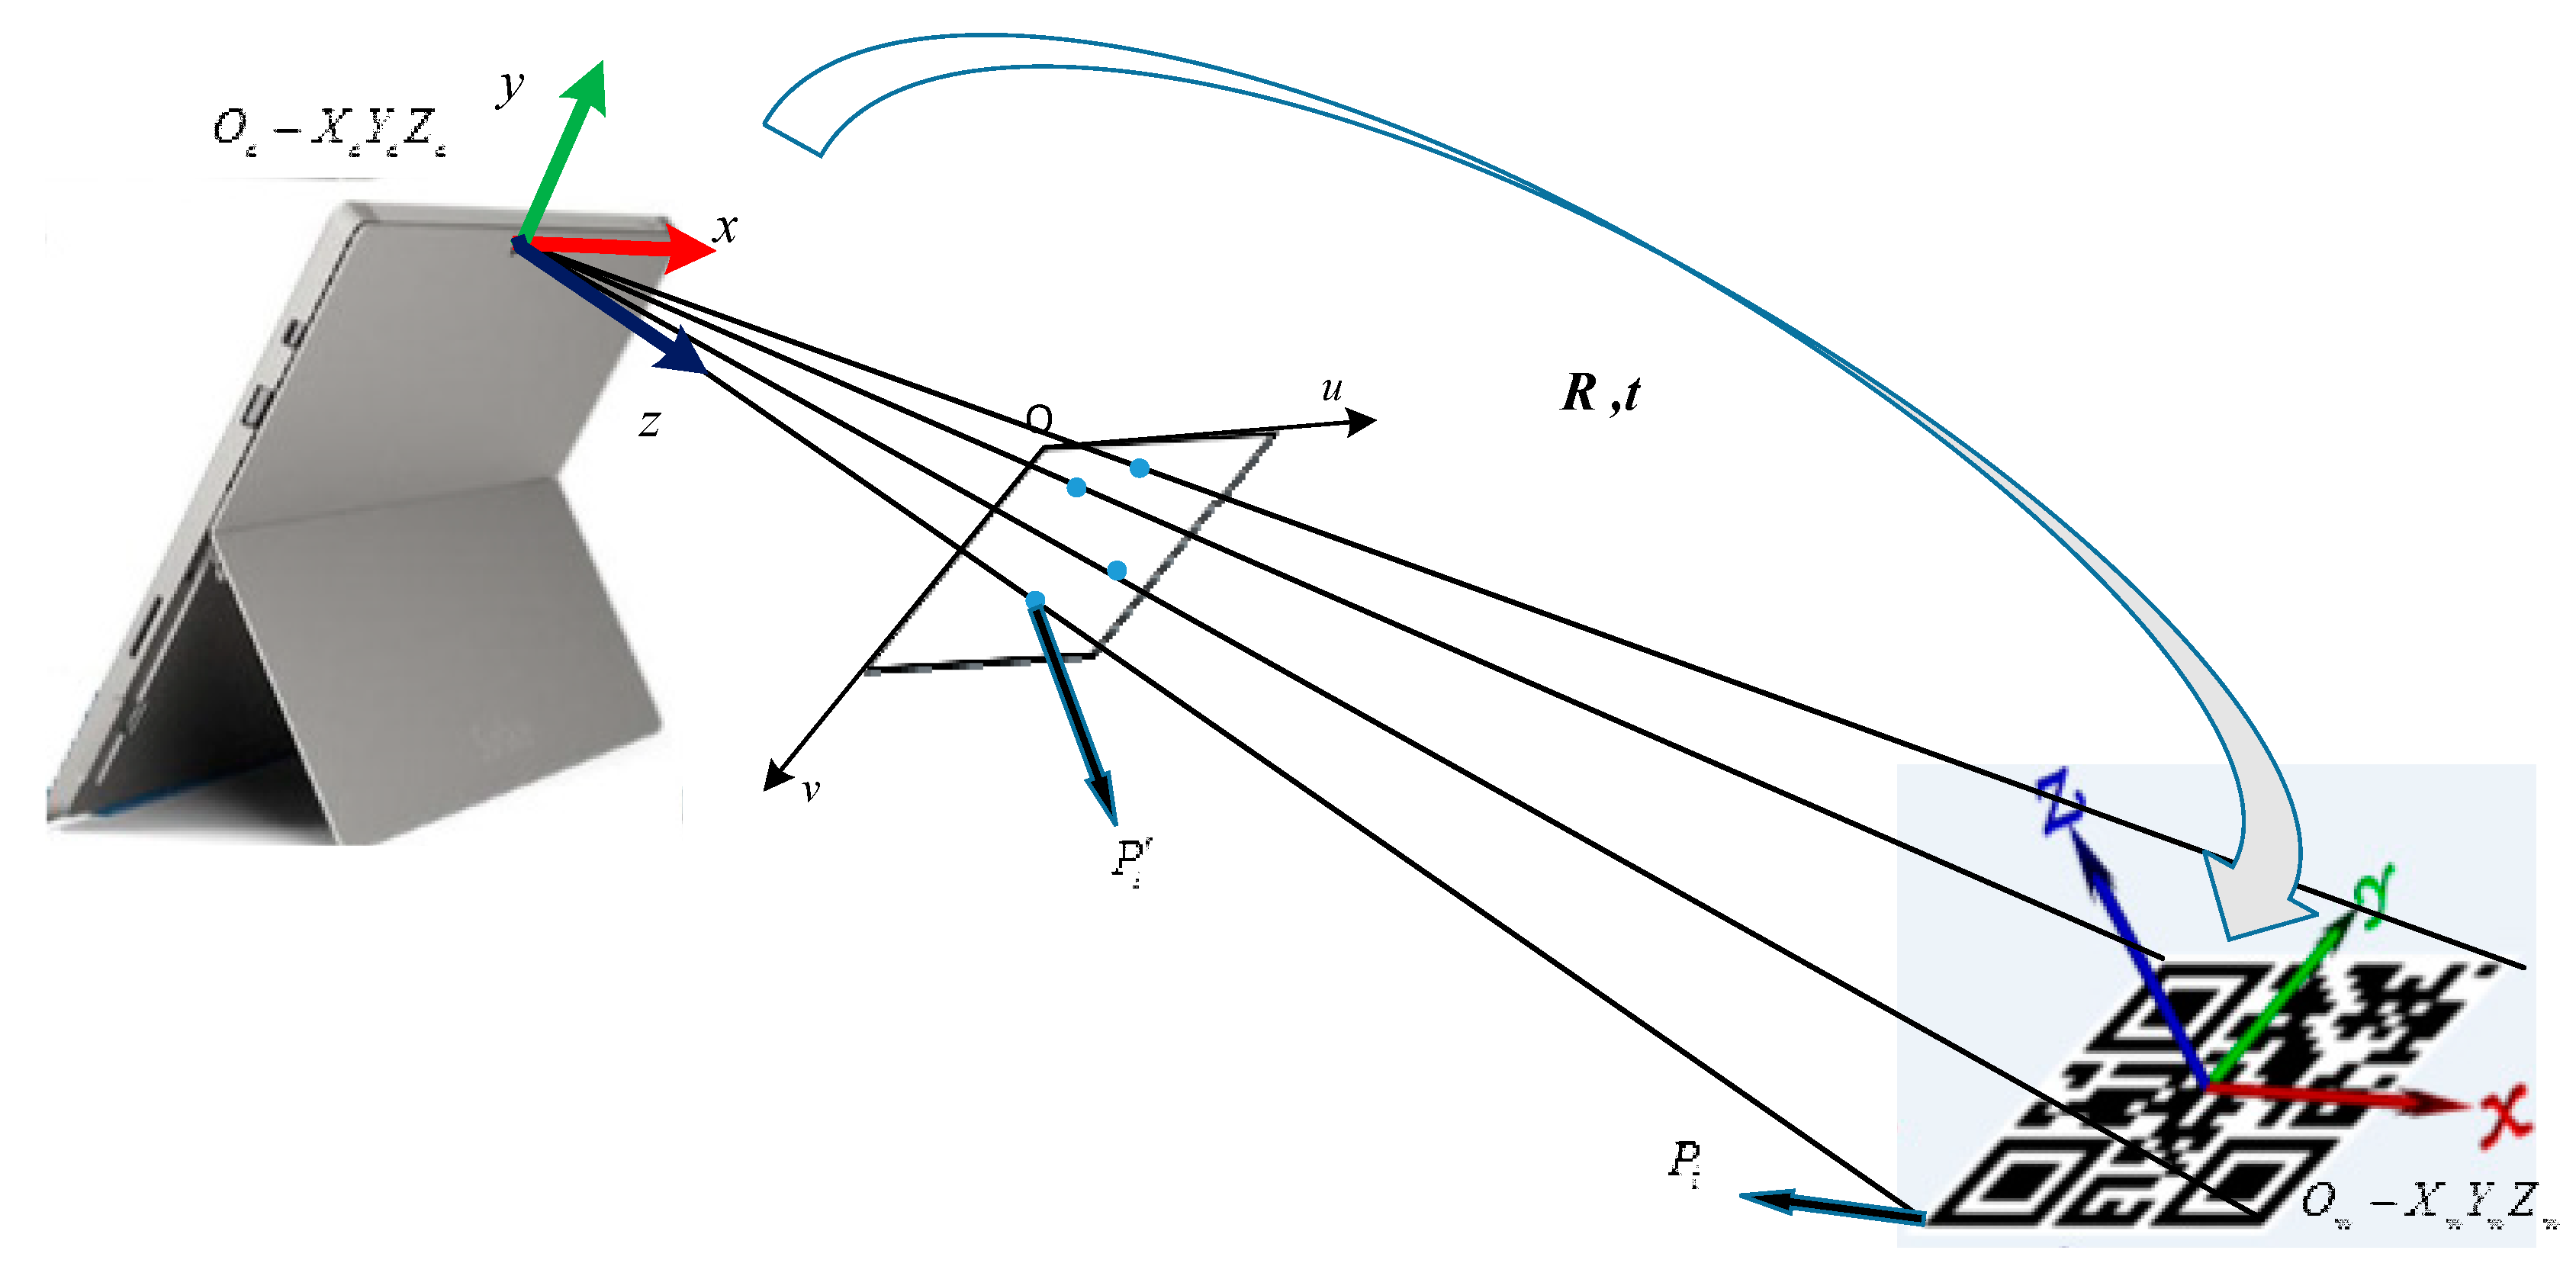
This study uses QR codes for AR registration. The image of the real scene is captured by the camera, and the QR code in the image is positioned and decoded. According to the 3D model display script generated in the AR configuration module, AR technology is employed to display the 3D animation model on the QR code.
To superimpose information content on the QR code, AR registration is required, i.e., to locate the pose relationship between the QR code and the camera. AR registration method based on QR code can be regarded as a Perspective-n-Point (PnP) problem. PnP is an algorithm for estimating camera pose by the known coordinates of several 3D feature points and their 2D projection coordinates. As shown in
Figure 9, the center point of the QR code is the origin of the world coordinate system;
is the corner point coordinates of the QR code in the world coordinate system;
is the pixel coordinates of the projection of this point in the image. According to the camera imaging model, the following formula is obtained:
where
is the point in the world coordinate system;
is the projection of
on the image plane;
is the internal parameter matrix of the camera (where
and
are the zoomed focal length;
is the optical center);
s is the scale factor of the image point;
and
are camera external parameters, i.e., the rotation and translation of the camera coordinate system relative to the world coordinate system. In this study, the PnP solution is performed on the four corner points of the QR code to obtain the 6-DOF pose of the camera in the QR code coordinate system.
In the script parsing and AR display software, the pose relationship between the QR code and the camera is determined by the camera recognizing the QR code in the real scene. Meanwhile, the 3D model to be displayed and the relative pose between the 3D model and the QR code are determined according to the 3D model display information generated by the parsing script file, thereby realizing AR display based on the QR code. If the assembly disassembly animation is displayed, the motion process between different parts of the assembly is displayed according to the disassembly animation motion parameters, and the user can click the ‘Previous’ or ‘Next’ button to realize the animation demonstration. If the industrial virtual instrument is displayed, the instrument interface file can be imported with the instrument display script, and data can be requested from the data forwarding interface through the data tag.
3.3.2. AR Registration Based on SLAM Map Reloading
In ORB_SLAM2, AR registration scans an unknown scene with a camera, estimates the camera pose following the multi-view geometry principle, identifies the plane, and places a virtual model on the plane to achieve AR display. Based on this, the QDARV system provides an AR registration method based on SLAM map reloading. This method loads the scene map, uses the camera to scan the mapped scene, applies feature matching to estimate the camera pose, parses the SLAM-AR display content script, and places the virtual model to achieve AR registration.
In the online positioning mode of ORB_SLAM2, the tracking thread, local mapping thread, loop detection thread, and AR display thread of the system are synchronized with the optimization task. The tracking thread extracts Oriented Fast and Rotated Brief (ORB) feature points from the image and estimates the camera pose between frames. The local mapping thread adopts the Bundle BA method to optimize key frames and map points. The loop detection thread detects whether the camera returns to the previously visited position and calls the g2o optimization library [
39] to eliminate accumulated errors. The AR display thread realizes the AR display by detecting the plane on which the 3D model is placed in the real scene.
After loading the map, the system runs in the offline positioning mode and retains only the tracking thread and AR display thread to achieve pose estimation and AR registration for stopping the local mapping thread, loop detection thread, and optimization tasks. The system tracks the camera pose through relocation. First, the tracking thread obtains the image frame captured by the camera and finds candidate keyframes similar to the current frame in the keyframe library. Then, Bag of Words (BoW) is used for feature matching between the current frame and the keyframe. If the number of matching points is less than 15, the current candidate frame is discarded. Finally, the number of inliers obtained after BA optimization is taken to determine whether the relocation is successful. If the number of matching points between the candidate frame and the current frame is greater than 50, the relocation is considered successful. Furthermore, the Efficient Perspective-n-Point (EPNP) [
40] algorithm is adopted to estimate the current camera pose. Meanwhile, the AR display thread obtains the model matrix and parameters of translation, rotation, and scaling of the 3D model through the parsed SLAM-AR display content information, and it renders the virtual model into the real scene through the OSG 3D rendering engine, thereby achieving augmented reality display of the planned scene.
The AR registration method based on SLAM map reloading proposed in this study can realize re-display of AR scenes. The real-time pose estimation results have a small accumulated error. Moreover, only keeping the tracking thread and AR display thread can reduce the computational resources required for pose estimation tasks, which greatly improves the work efficiency of the system.
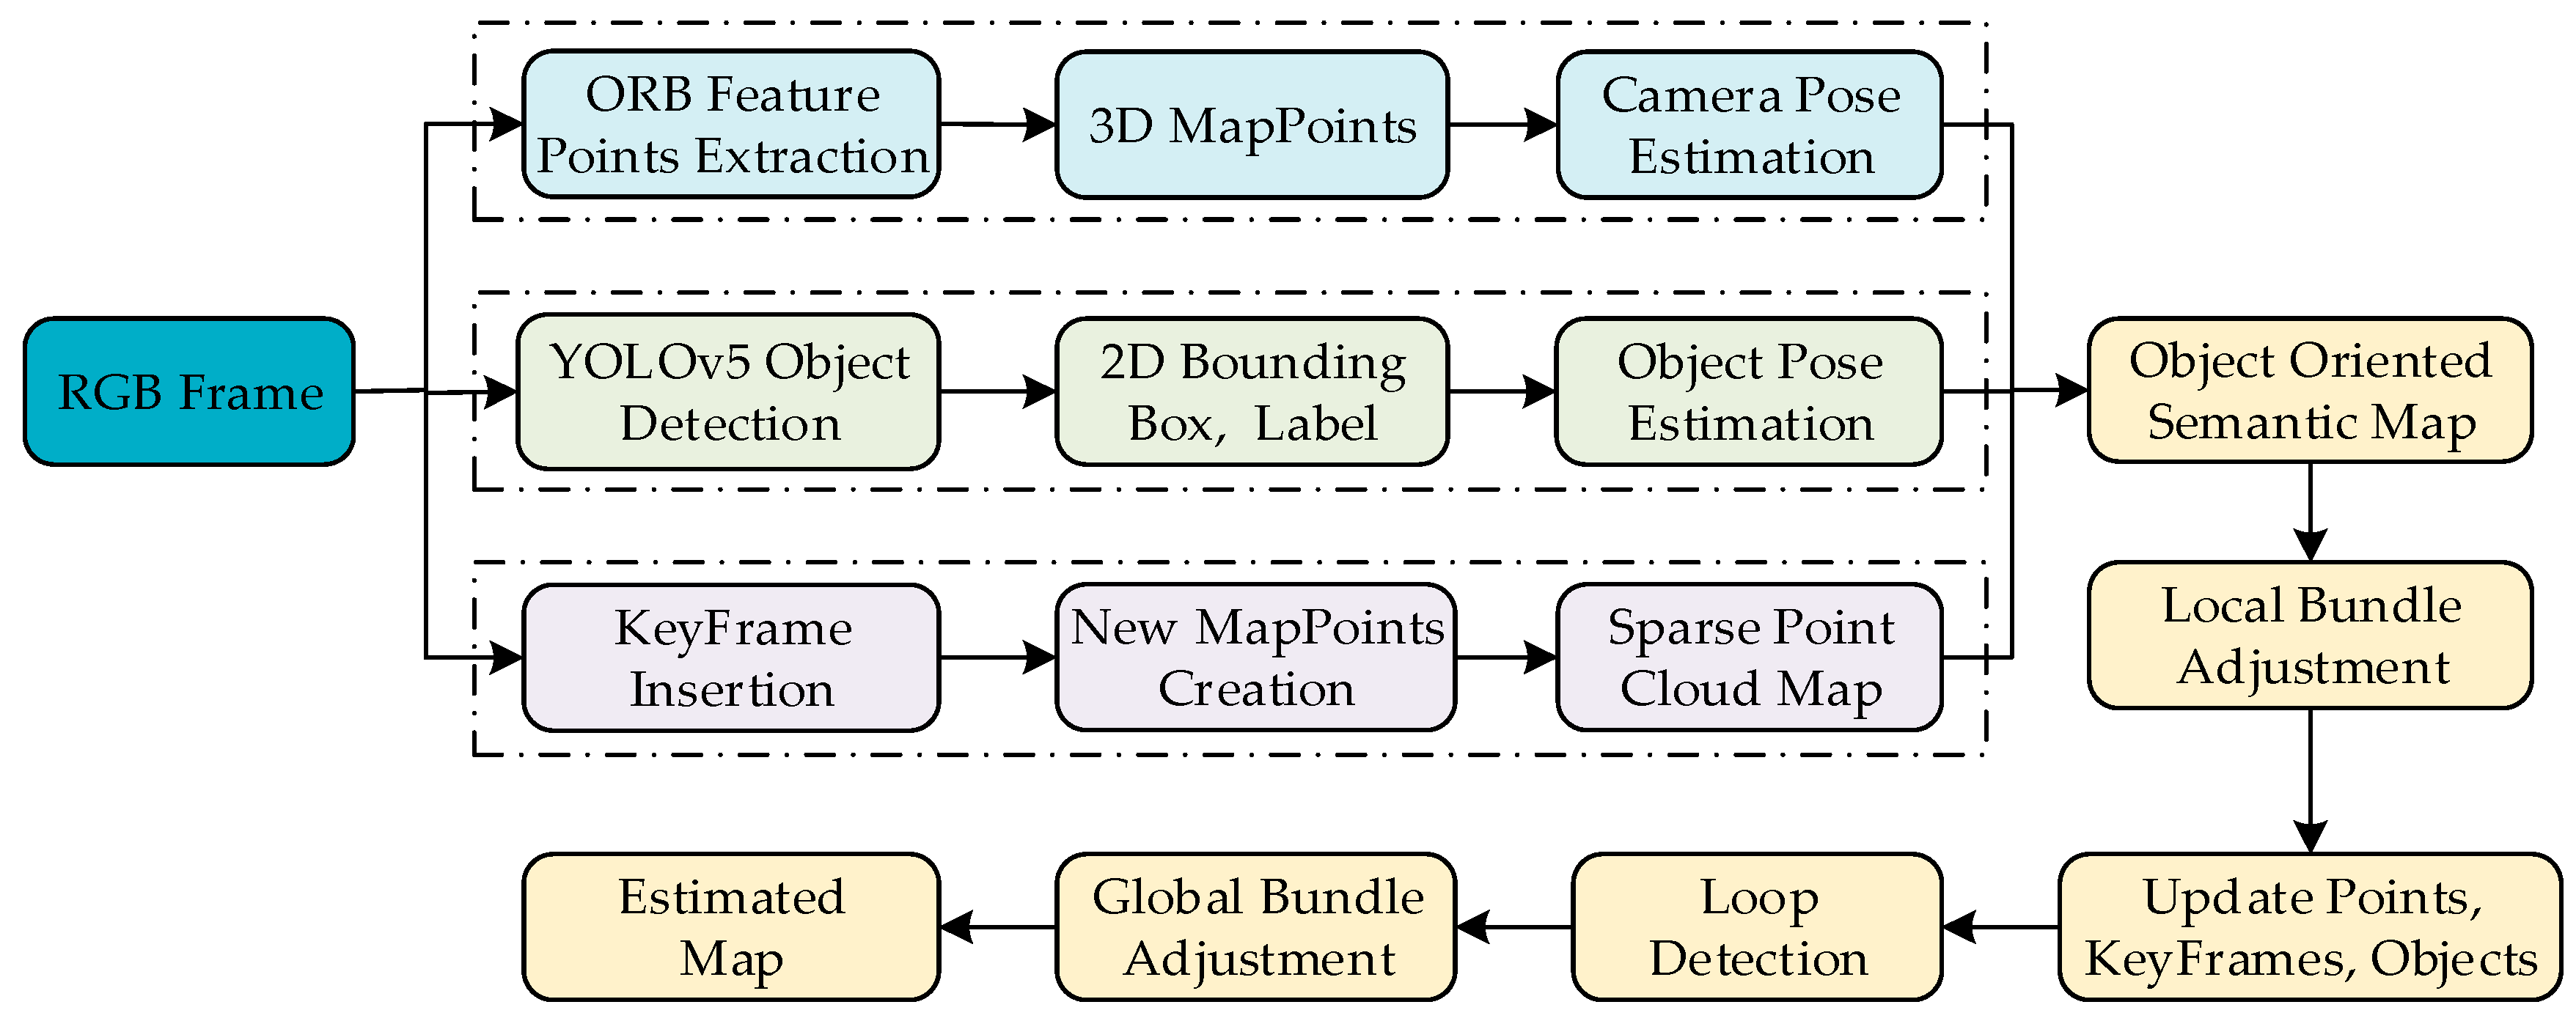
3.4. Object SLAM AR
In this paper, the AR registration based on SLAM uses ORB_SLAM2 to locate and map the scene. However, ORB_SLAM2 uses feature points as geometric features to estimate the camera pose between frames. Meanwhile, the environment map it builds is only a sparse representation of the scene, which may not work in low-texture or no-texture environments. In the real environment, the object has important semantic information in the scene. It can be used as a landmark in the SLAM system to assist system localization and improve the robustness of the system. As shown in
Figure 10, to implement an object-oriented SLAM system and build an object-oriented semantic map, this study adds semantic threads to ORB_SLAM2. The semantic thread applies the YOLOv5 object detector to perform object detection on each frame of the image in the real-time video stream, obtains the 2D bounding box and semantic labels of the object, estimates the pose of the object, and finally maps this information to a sparse point cloud map of ORB_SLAM2, thereby constructing object-oriented semantic maps.
3.4.1. Object Detection
This system uses the YOLOv5 object detector to process monocular image frames in real-time, and it uses the COCO data set [
41] as the training data set of the object detection model, which can detect 80 types of targets in the real scene. The training platform is Pytorch. The model input is RGB images with a size of 640 × 384 pixels.
Figure 11 shows the flow chart of the object detection module of the system, which has two working modes: online detection and offline detection. In the online detection mode, the object detection module is initialized after the system starts, including loading the trained YOLOv5 object detection model and setting the clipping and transformation matrix of the image. After the object detection module is successfully initialized, the monocular camera is turned on to obtain real-time image frames. After the image is clipped and transformed, the object detection model is used for 2D detection, and the detection results are transmitted to the main thread for display. In the offline detection mode, object detection is performed on the preloaded images to generate offline detection texts. After the system is launched, the offline detection images and offline detection texts are loaded. Then, 2D bounding boxes, semantic labels, and detection confidences of the objects in each image are obtained, and they are transmitted to the main thread for real-time display. The offline mode has higher real-time performance because it does not require online reasoning. However, it can only input fixed images, which also has great limitations.
3.4.2. Construction of Object-Oriented Level Semantic Maps
The local mapping thread follows the map construction strategy of ORB_SLAM2. This strategy inserts new map points and keyframes into the map and eliminates redundant map points and keyframes to construct a sparse point cloud map of the scene. Based on this, the system inserts objects into the map as new landmarks. This study combines the methods in refs. [
42,
43] to represent objects in the scene in a lightweight way of dual quadric surfaces and cubes instead of complex CAD models. In this study, irregular objects such as cups and balls are represented as dual quadric surfaces, and regular objects such as keyboards and books are represented as cubes.
The main workflow of constructing object-oriented semantic maps is as follows: First, the objects in each frame of an image are detected by the YOLOv5 object detector, and then the 2D bounding box, semantic label, and label confidence of these objects are obtained. This study only retains the objects with more than 70% detection confidence. Subsequently, the methods in refs. [
42,
43] are employed to estimate the pose of the objects, and two lightweight methods of dual quadric surfaces and cubes are used to model the objects. Finally, these objects are mapped to a sparse point cloud map to construct object-oriented semantic maps.
3.4.3. Data Association
In the ORB_SLAM2 based on the feature point method, feature matching is the most important method for data association. The system can effectively match ORB feature points in different views through ORB descriptor matching and an epipolar geometric search. Meanwhile, object SLAM needs to build the data association between objects. Based on this, this study adopts the data association method of regional semantic categories and local feature point descriptors. At the image level, the semantic labels of objects are used to realize the object detection frame area association between frames. For the ORB feature points in the detection frame, its multiple descriptors are regarded as the regional pixel descriptors of the detection frame to solve the semantic matching ambiguity caused by multiple objects of the same category.
When the system is in a low-texture or no-texture environment, ORB_SLAM2 cannot track the camera pose due to the lack of feature points, which makes the system fail to work. The object-oriented SLAM system can construct semantic data association between objects, so it achieves superior performance even in low-texture or no-texture environments.
4. Experimental Results
In this study, a QDARV toolkit is designed. Experiments are conducted to verify the validity and reliability of this toolkit. The specific experimental contents are as follows: (1) AR registration test based on QR code; the QR code is located in the real scene to achieve the assembly disassembly animation display and the industrial virtual instrument display. (2) AR registration test based on SLAM map reloading; the scene map is saved in the AR configuration software, and the SLAM-AR display content script is configured. The constructed scene map is loaded to the script parsing and AR display software for SLAM offline positioning. The SLAM-AR display content script is parsed to realize AR registration. (3) Object SLAM system test; the functions of ORB feature point extraction, YOLOv5 object detection, object pose estimation, and object-oriented level semantic map construction in the object-oriented SLAM system are tested in real scenes. (4) The QDARV tool is compared with other AR development tools. (5) The feasibility of the QDARV is analyzed by user evaluation using heuristic evaluation techniques.
4.1. AR Registration Based on QR Code
This experiment mainly takes the assembly disassembly animation and industrial virtual instrument as examples to demonstrate the function of AR registration based on QR code.
- (1)
Assembly disassembly animation demonstration
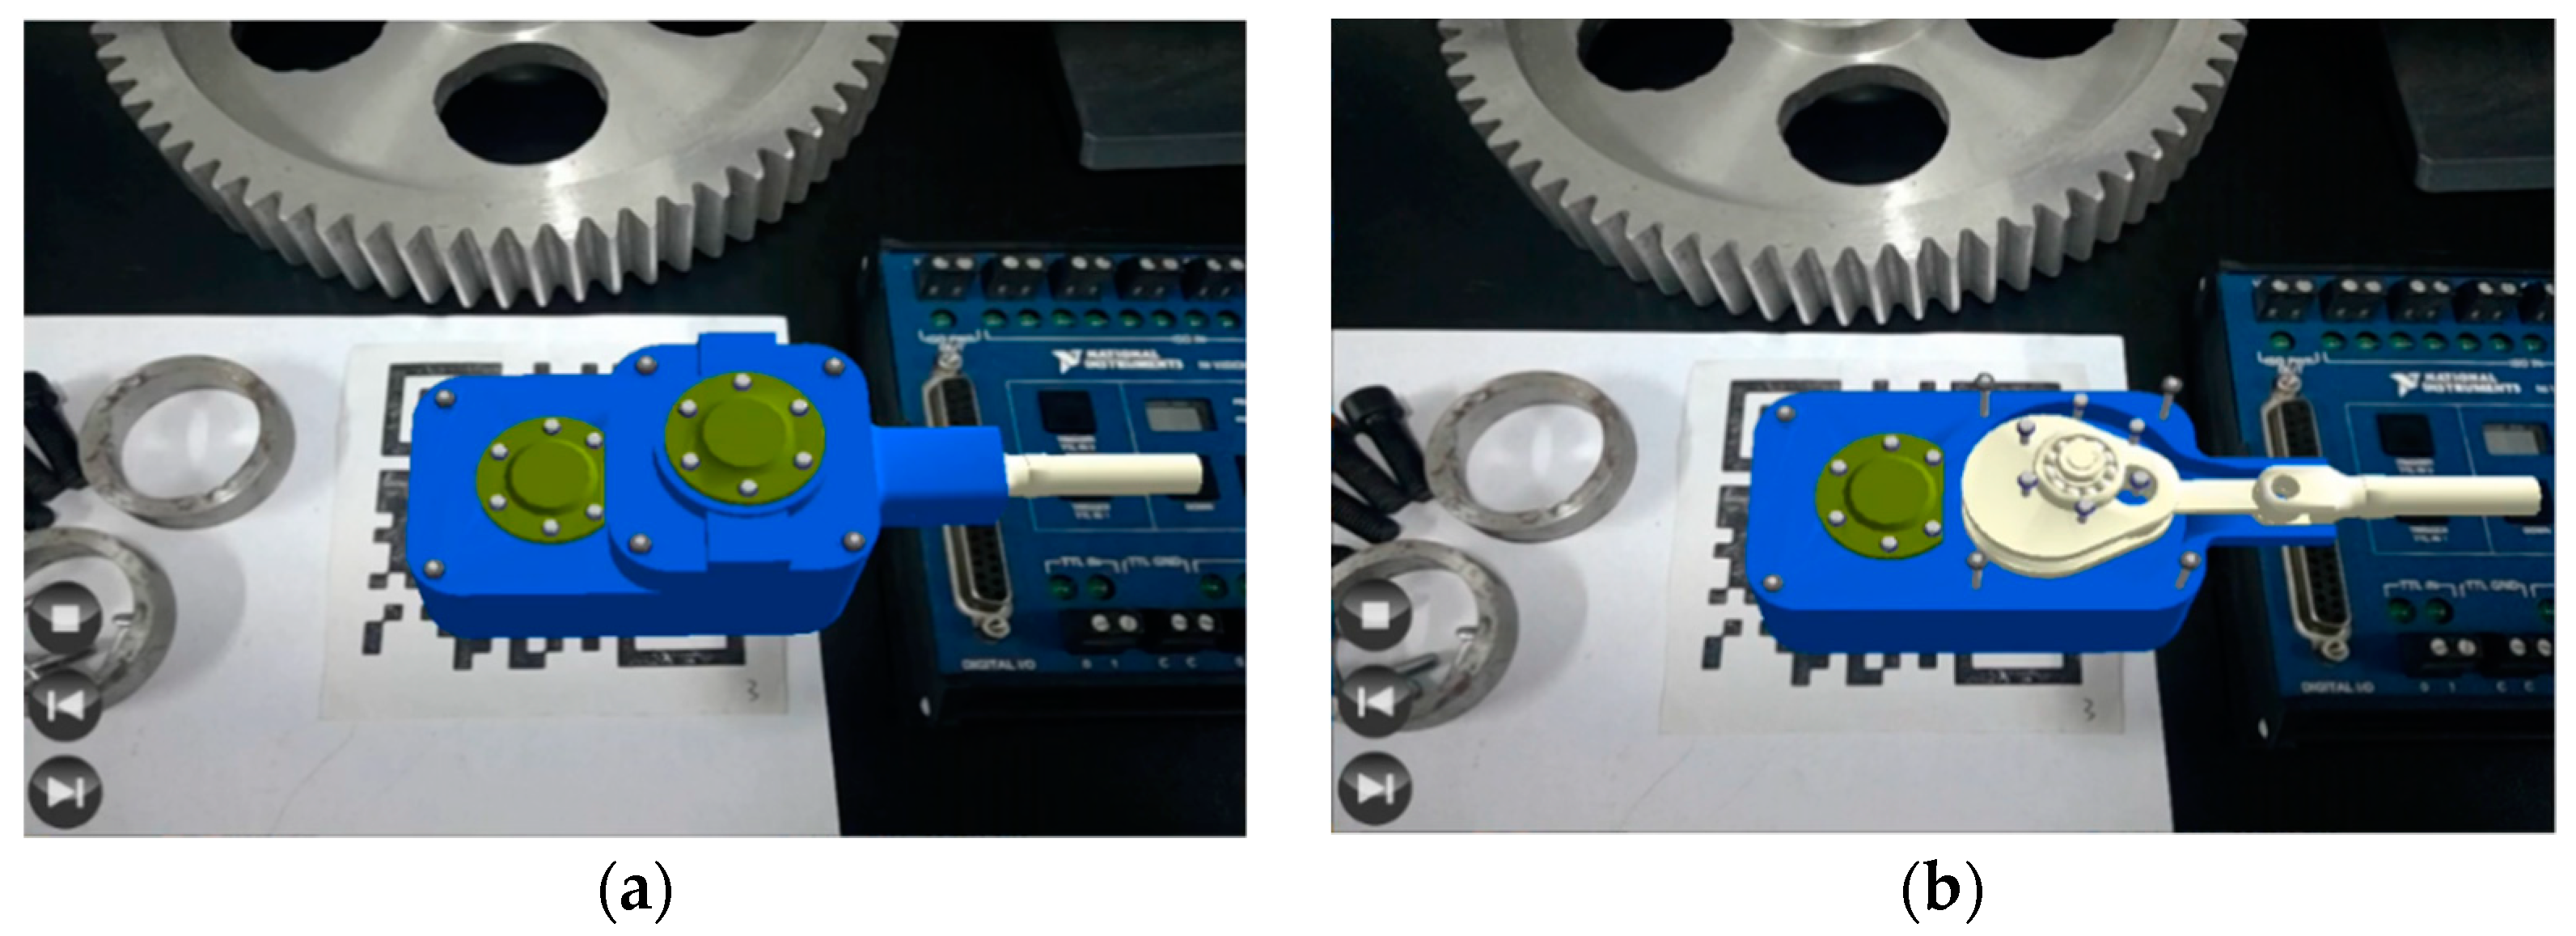
In this study, the assembly disassembly animation steps are configured in the AR configuration software. The assembly disassembly animation AR demonstration is realized by recognizing the QR code in the scene with the script parsing and AR display software.
Figure 12 illustrates the assembly disassembly animation demonstration in the real scene. To better realize AR interaction and show the assembly disassembly steps more intuitively, the system designs three graphical interaction buttons to control the demonstration of the disassembly animation, including the “next step”, the “previous step”, and the “stop” buttons. Developers can achieve the animation demonstration of the entire disassembly process by clicking these buttons.
- (2)
Industrial instrument AR Display
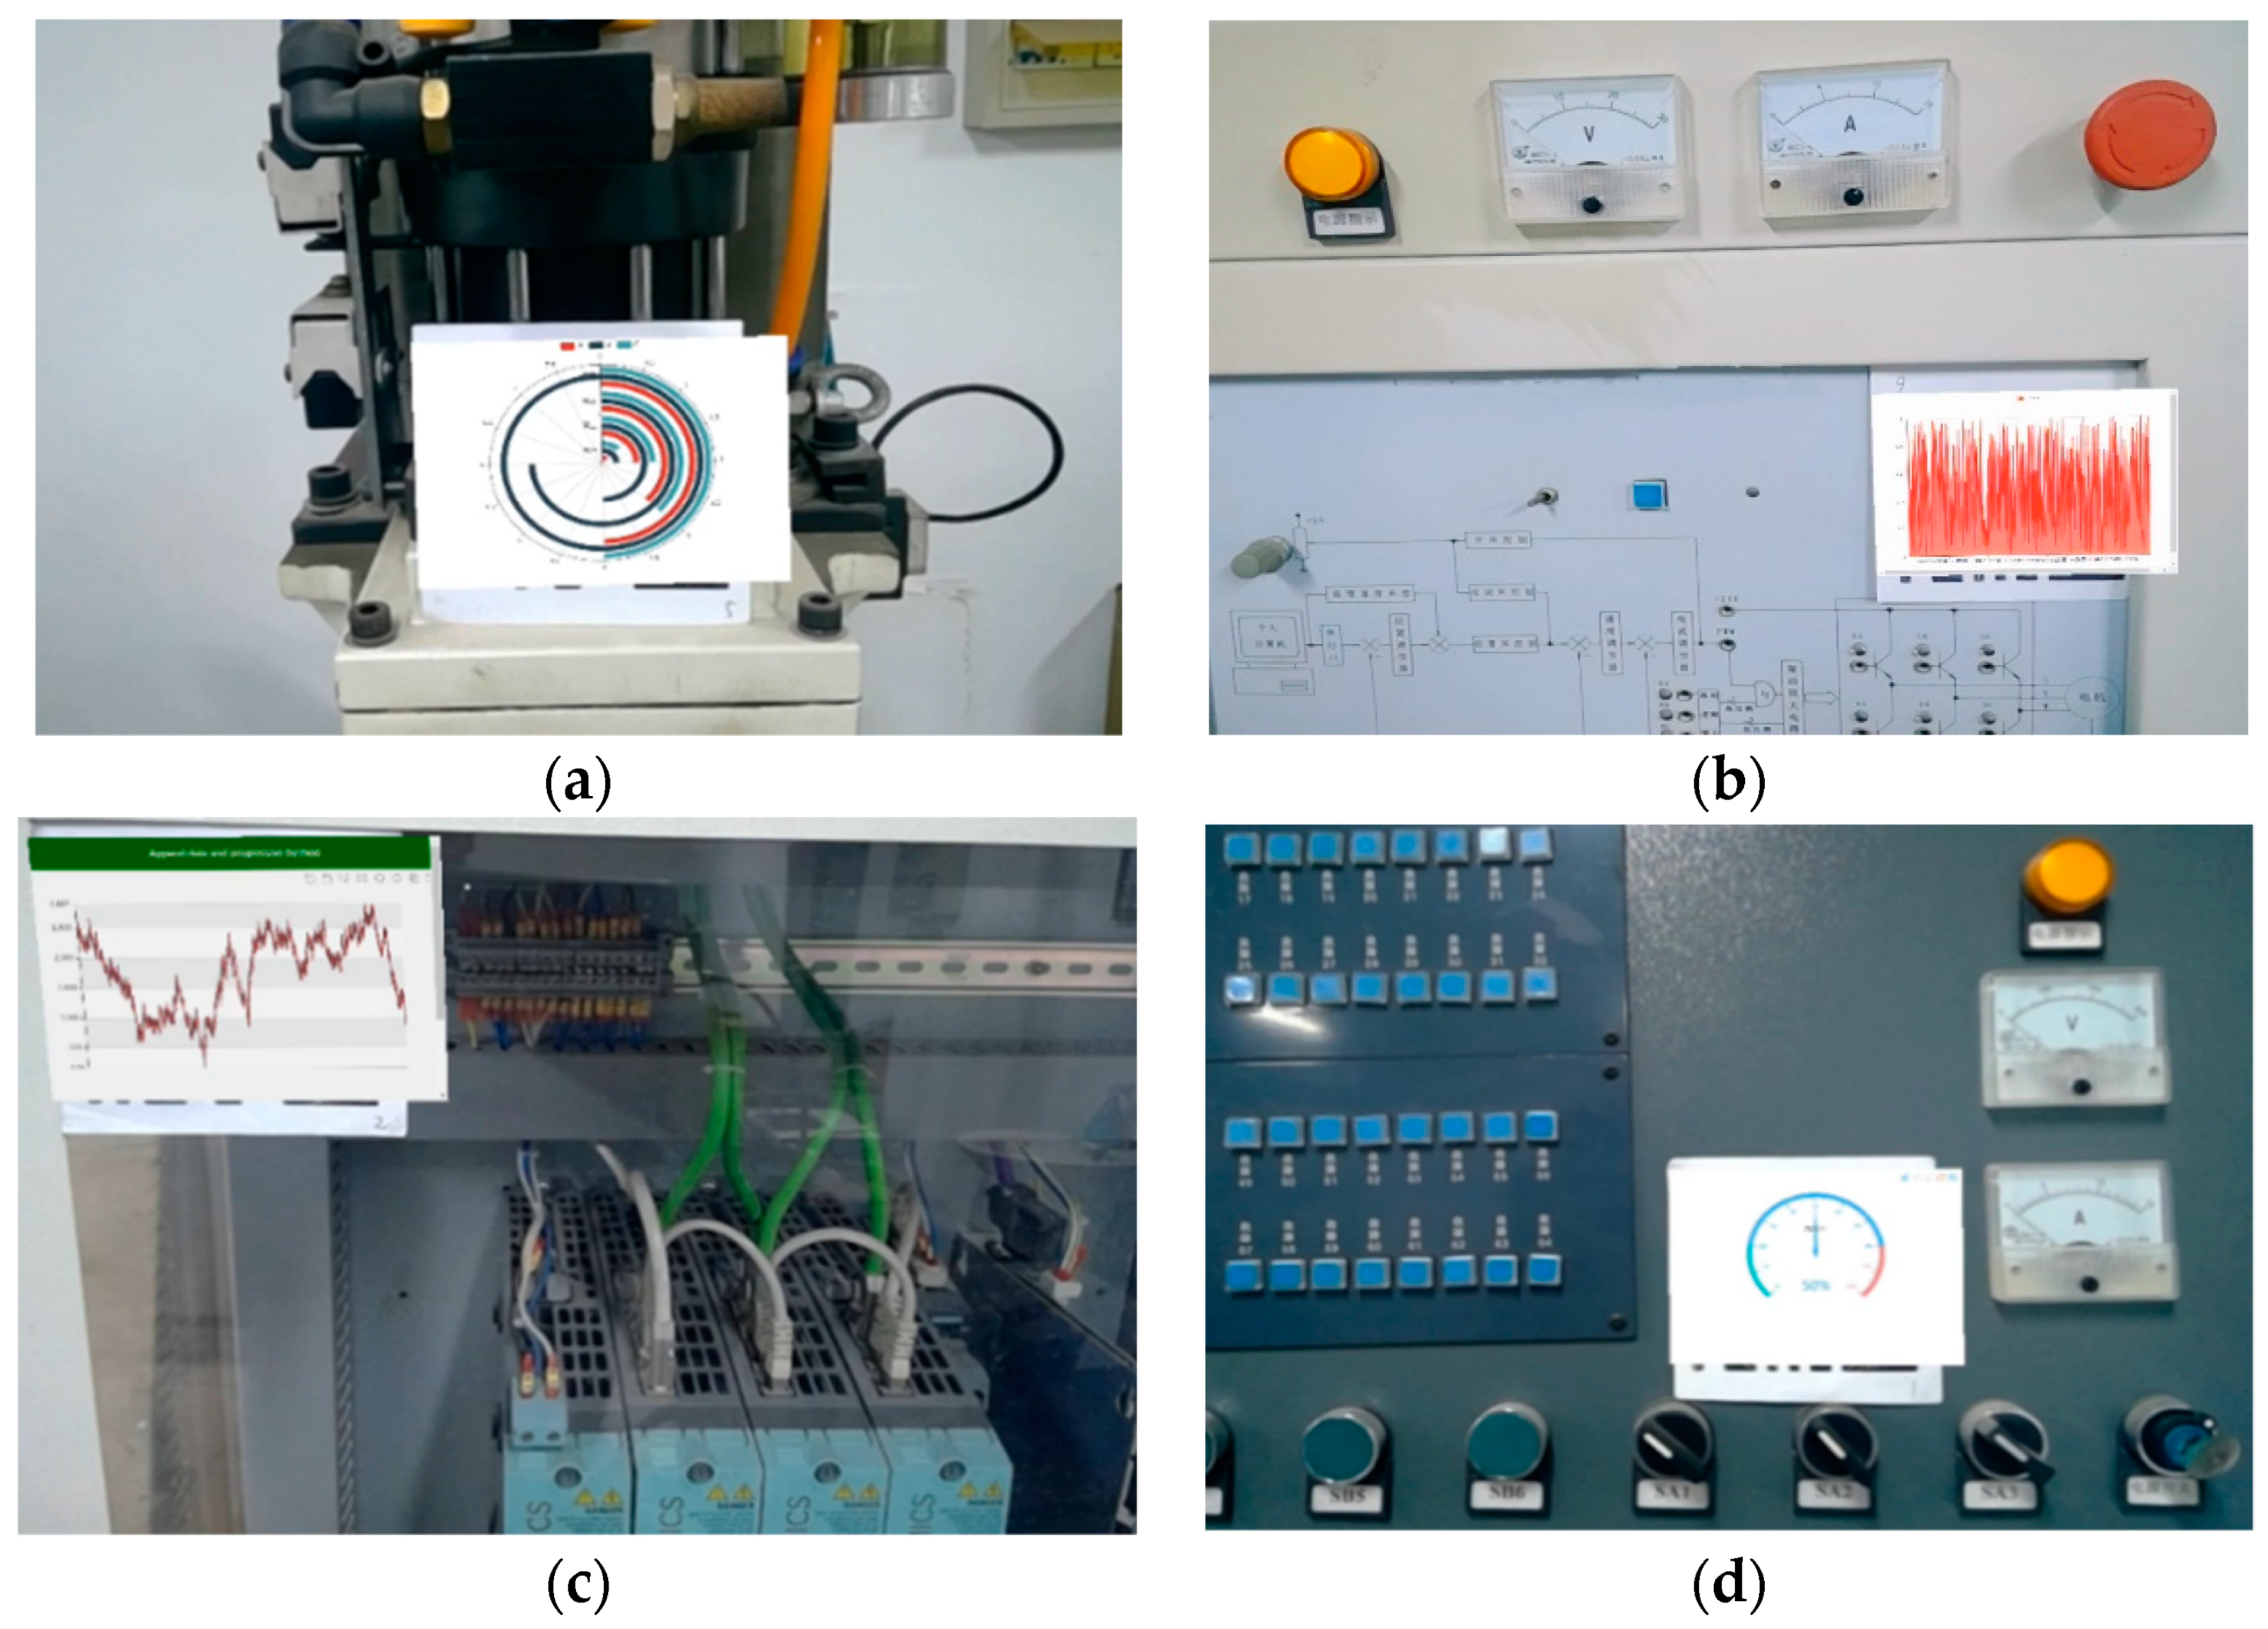
In this study, the instrument display information is configured in the AR configuration software. The AR display function of the industrial virtual instrument is realized by recognizing the QR code in the scene with the script parsing and AR display software.
Figure 13 shows the AR display interface of the industrial virtual instrument in the real scene. This interface can display data interfaces such as pie charts, bar charts, line charts, and dashboards according to actual needs. The display content of the instrument interface can be customized by the actual information of the factory equipment. Factory staff only need to be equipped with an AR glass or a mobile device to achieve real-time acquisition of factory information through virtual instruments, thus realizing human-centered industrial data visualization.
4.2. AR Registration Based on SLAM Map Reloading
Figure 14 shows a schematic diagram of AR registration based on SLAM map reloading. In the AR configuration software, the user first scans the factory scene through the camera to build a local map. The working mode of the SLAM system is online positioning, and the running frame rate is about 22 Hz. As shown in
Figure 14a, the points in the map are displayed in two colors, black and red, where the red color represents the map points observed by the camera in the current frame, and the black color represents the map points that cannot be observed in the current frame. As shown in
Figure 14b,c, by recognizing the plane to place the 3D model of the factory equipment, the user can interactively control the rotation, translation, and zoom of the 3D model through the keyboard or mouse according to the actual need. After the mapping is completed, the SLAM map and 3D model parameter configuration are saved as an intermediate script file. In the script parsing and AR display software, the system reads the above intermediate script file to initialize the AR system. As shown in
Figure 14d, the system reloads the constructed scene map. At this time, the camera does not observe any points, and all feature points on the map are shown in black. As shown in
Figure 14e, the user scans the constructed scene again. The working mode of the SLAM system is offline positioning, and the system runs at a higher frame rate of about 26 Hz. The system relocates through feature matching while parsing the SLAM-AR display script to display the constructed 3D virtual model again.
4.3. Object-Oriented Level SLAM System Test
In this study, based on a robust object pose estimation algorithm, two lightweight ways of cubes and ellipsoids are used to express objects in the scene, and an object-oriented 3D semantic map is constructed. Compared with the sparse point cloud map constructed with feature points as geometric features in ORB_SLAM2, the object-oriented semantic map constructed in this study can better express the semantic information in the scene.
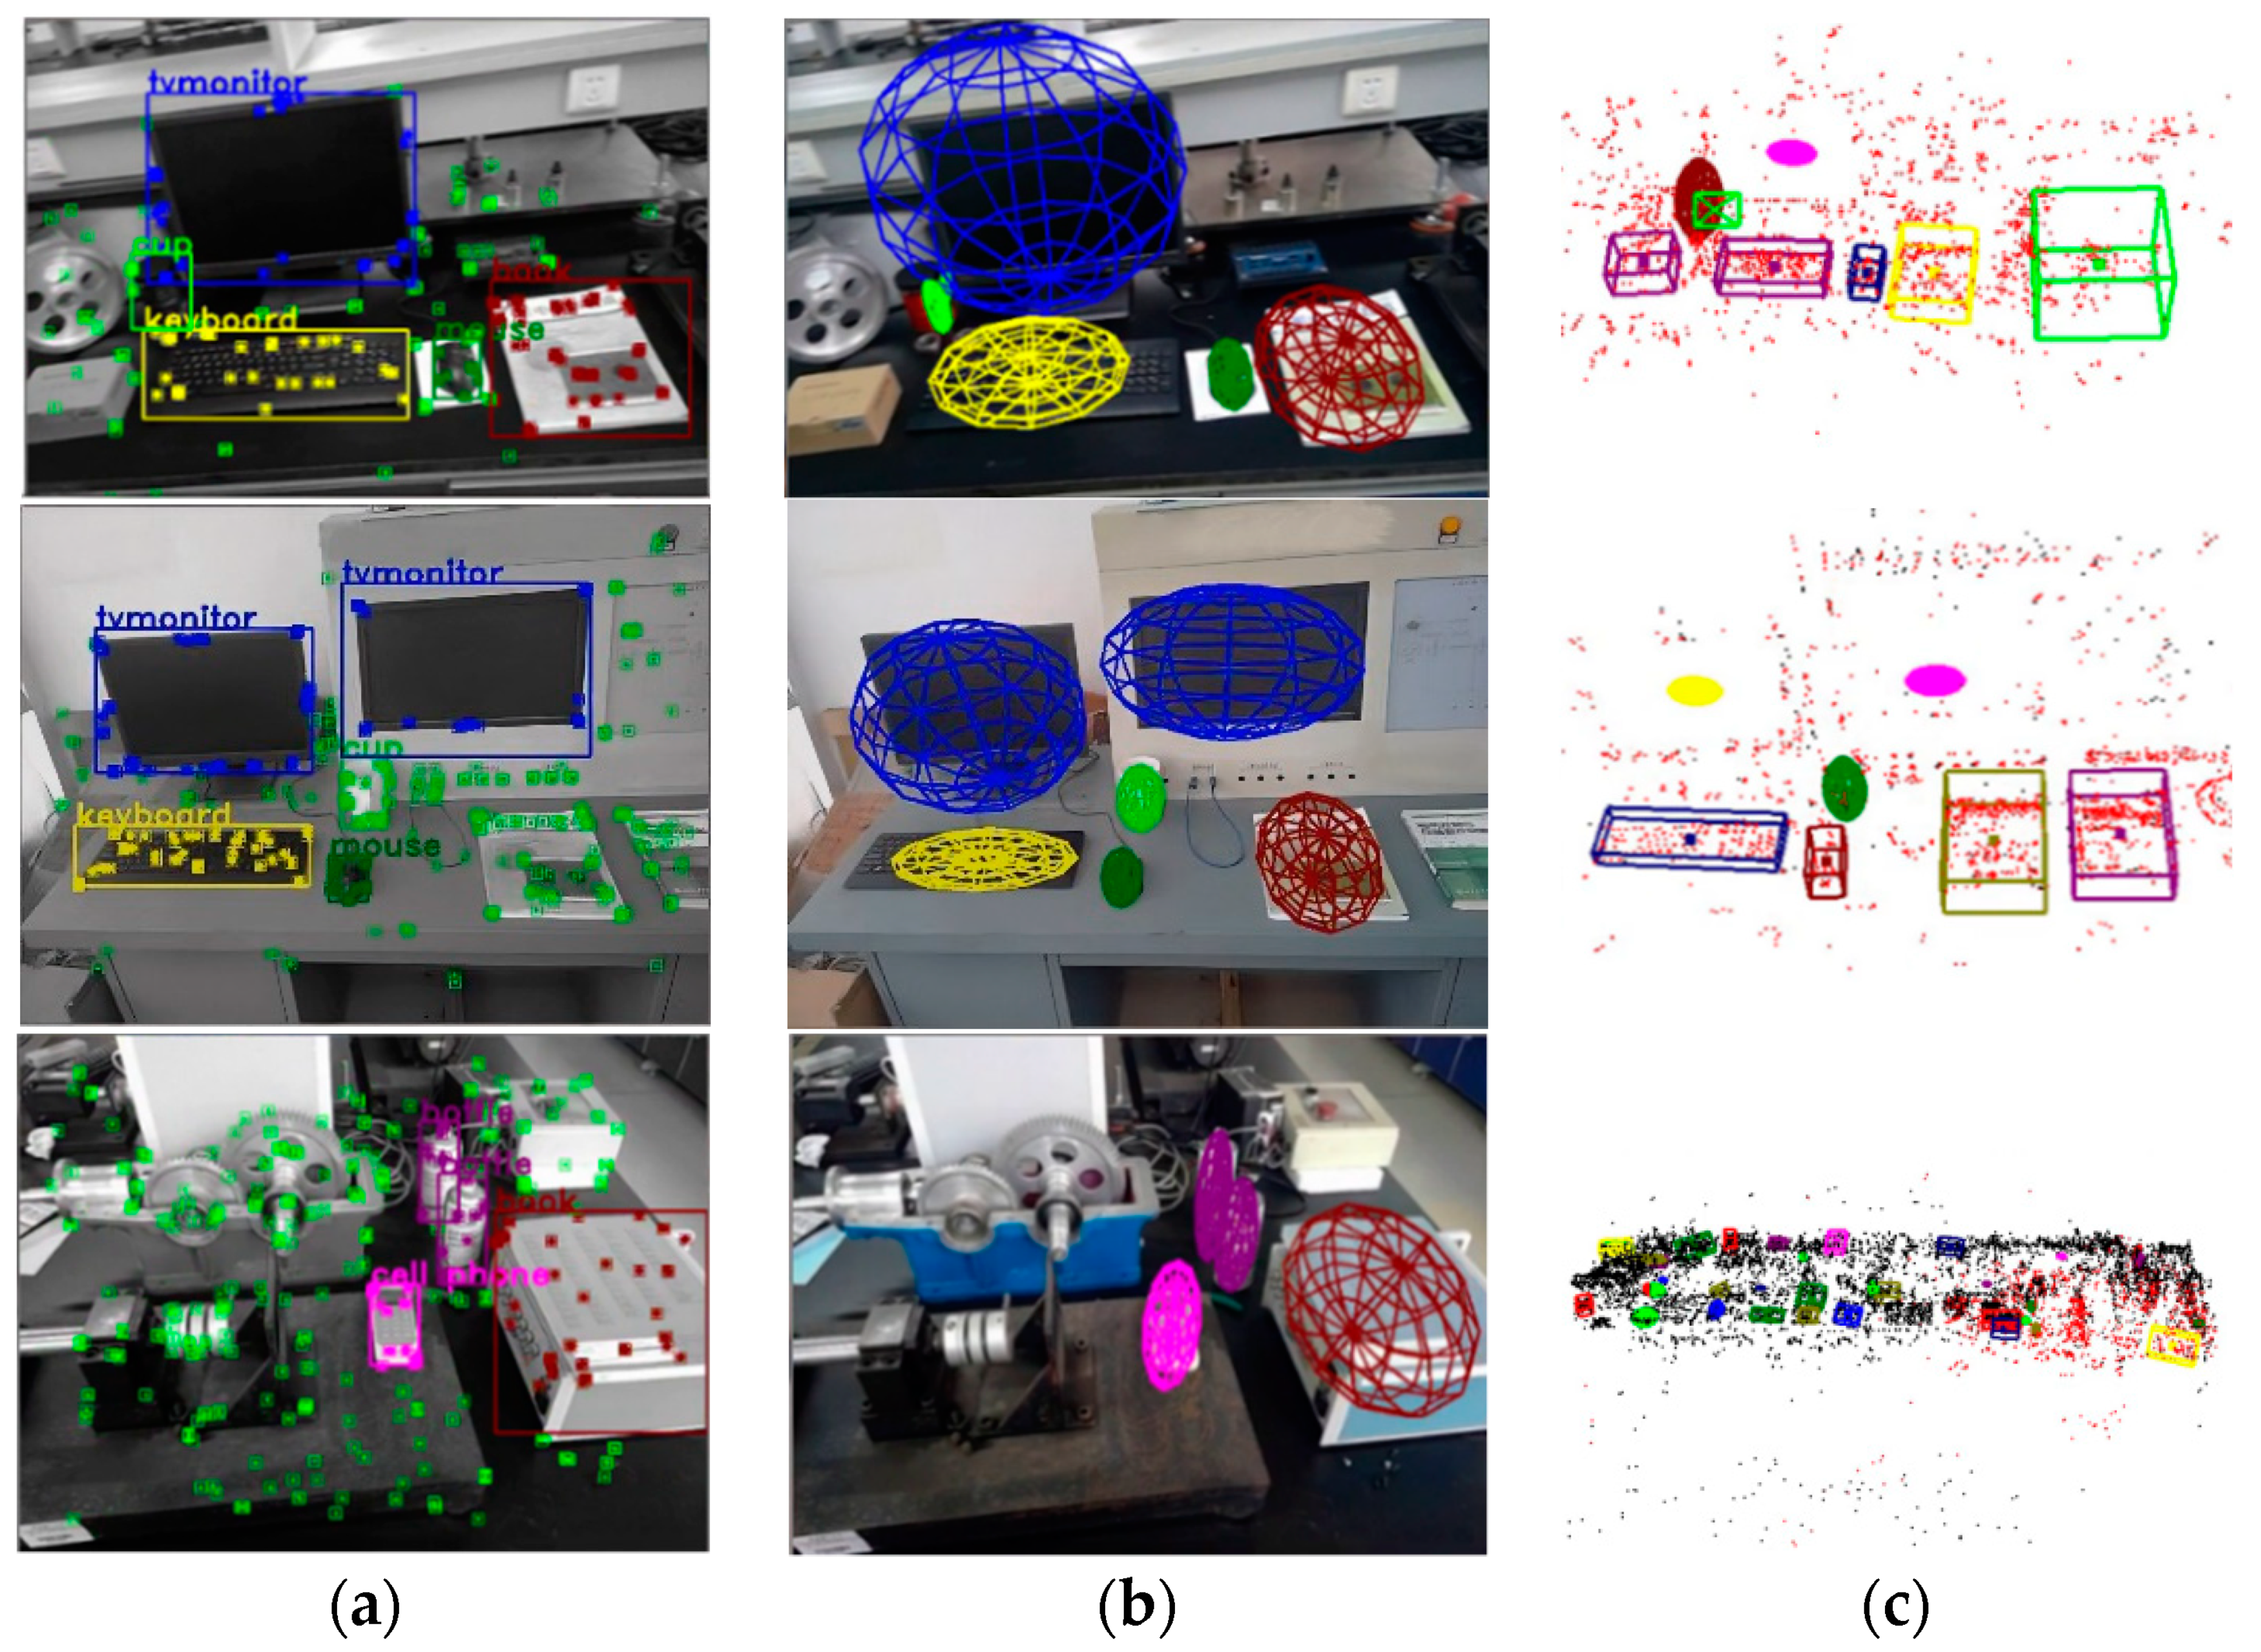
Figure 15 shows an example of the running results of the object-oriented SLAM system in a real scene. Specifically,
Figure 15a shows the ORB feature points recognized in the image, the 2D bounding boxes of objects, and the semantic labels. For the ORB feature points in the 2D bounding boxes of different types of objects, the system displays them in different colors, e.g., the feature points outside the bounding boxes of objects are displayed in green.
Figure 15b shows the pose estimation of objects in the image. In the visualization interface, the system represents the object in the form of an ellipsoid.
Figure 15c shows the object-oriented 3D semantic map constructed by the system. Based on the ORB_SLAM2 sparse point cloud map, the semantic information of the object is integrated. It can be seen that the objects in the scene can be accurately estimated, and these objects are mapped into the 3D semantic map, which verifies the accuracy and robustness of the system.
4.4. Comparison with Other AR Tools
The comparison between QDAVR and other AR development tools is presented in
Table 1. Among them, ARToolKit is an open-source AR Software Development Kit (SDK), Spark AR, ARCore, and Vuforia are commercial-grade AR development tools, which are widely used in industrial production and other fields. Compared with the above AR development tools, the QDARV development tool developed in this paper provides disassembly and assembly animation configuration and virtual instrument configuration functions. Based on these functions, developers can quickly realize disassembly and assembly animation AR display and industrial instrument AR display in real scenes. Meanwhile, this paper expands the map saving and map loading functions in ORB_SLAM2, which can save and reload world data. This function is not supported in ARToolKit and Spark AR. Although ARCore and Vuforia support this function, their saved map contains only discrete point clouds of the scene, while QDARV saves the map points and keyframes in the binary map script. These keyframe information can help the system better match the real world with the map. Moreover, this paper establishes an object-oriented SLAM system based on ORB_SLAM2, which can track the pose of 3D objects in the scene in real-time. This function is not supported by many AR development tools.
4.5. User Evaluation
User acceptance is critical for assessing usability of QDARV development tools. Therefore, user evaluation was conducted in this study. The participants were 10 graduate students majoring in mechanical engineering. They were divided into two groups according to their research backgrounds, researcher groups and operator groups. Among them, researchers have a certain programming foundation or AR technology knowledge, while the operators do not understand programming and AR technology. This study adopted heuristic evaluation [
44,
45] technology to evaluate users of QDARV development tools, which uses user satisfaction surveys to analyze the usability of the system.
Table 2 shows the evaluation questionnaire of QDARV development tool, which was used to obtain the feedback of participants.
The participants used the QDARV tool to perform AR registration based on QR code and AR registration based on SLAM map reloading, respectively. In order to verify the effectiveness and quality of the proposed development tools, qualitative and quantitative usability studies were conducted, and participants were asked to perform specific tasks as shown in
Table 3 and
Table 4.
There were five possible answers: very dissatisfied (2 points), dissatisfied (4 points), ordinary system (6 points), satisfied (8 points), and very satisfied (10 points). According to these options,
Table 5 shows the user evaluation results of the QDARV development tool. Overall, QDARV received positive feedback from participants. Participants noted that the functions designed in the toolkit are easy to understand, useful for beginners who do not know programming but want to develop AR applications, and the entire development process is efficient and flexible. Participants also provided some feedback needed to be improved, such as the design of the interface can be clearer, and hints and fixes should be given when operation errors occur.
5. Discussion and Future Work
Currently, augmented reality technology is widely used in industry. Most of the existing AR development tools rely on time-consuming and expensive recompilation steps, which are costly and lack versatility. This study proposes a quick development toolkit named QDARV for AR visualization of factories, which can help developers quickly develop AR applications for factory visualization to improve industrial production efficiency. The QDARV tool consists of AR configuration software and script parsing and AR display software. The AR configuration software generates intermediate script files through the 3D animation configuration module, the AR display configuration module based on QR code, and the AR display configuration module based on SLAM. The script parsing and AR display software reads and parses the intermediate script files to generate AR display content. On this basis, AR registration based on QR code and AR registration based on SLAM map reloading are realized. With the QDARV toolkit, developers do not need a deep understanding of AR technology or extensive programming experience. They only need to configure augmented reality display content and augmented reality registration parameters to generate an intermediate script file, thereby achieving data communication between the AR configuration software and script parsing and AR display software. This helps to design industrial AR applications, customize the display of augmented reality content, and achieve a human-centered display.
Compared with other AR tools, the QDARV tool developed in this paper does not rely on time-consuming and costly recompilation steps, and therefore AR display content and AR applications can be created quickly and efficiently. The QDARV tool provides disassembly and assembly animation configuration and virtual instrument configuration functions. With these functions, developers can quickly realize disassembly and assembly animation AR display and industrial instrument AR display in real scenes. In addition, the AR registration method is improved based on ORB_SLAM2. In this improved version, the functions of map saving and map loading are added, which can save and reload world data. Meanwhile, a semantic thread is added in this improved version to track the pose of 3D objects in the scene and establish an object-oriented semantic map, thereby improving the robustness and tracking performance of the system.
Section 4 validates the effectiveness, feasibility, and advantages of the proposed tool through experiments and analysis. Nonetheless, the QDARV tool has some limitations that need to be improved in future studies. This study only uses a monocular camera for pose estimation. The tracking of the system can be easily lost when the AR device moves or rotates rapidly. Meanwhile, the IMU sensor can estimate fast motion in a short time and estimate the scale through its inertial measurements. The fusion of the monocular camera and IMU sensor will be considered in future work to improve the robustness and localization performance of the system under fast motion. In addition, at present, the QDARV tool is only applicable to Windows development platform and has not been integrated with other industrial software. In the future work, we will continue to improve the functions of the QDARV tool to support cross platform development and integration with industrial software (SCADA, databases, cloud platforms, etc.).


 ,
, 


