Article

Evaluation of Land Subsidence during Groundwater Recovery

1
Graduate School of Engineering and Science, Shibaura Institute of Technology, 3-7-5 Toyosu, Koto-ku, Tokyo 135-8548, Japan
2
College of Engineering, Shibaura Institute of Technology, 3-7-5 Toyosu, Koto-ku, Tokyo 135-8548, Japan
3
Department of Civil Engineering, Kasetsart University, 50 Ngamwongwan Rd. Chatuchak, Bangkok 10900, Thailand
*
Author to whom correspondence should be addressed.
Appl. Sci. 2022, 12(15), 7904; https://doi.org/10.3390/app12157904
Submission received: 20 June 2022 / Revised: 19 July 2022 / Accepted: 2 August 2022 / Published: 6 August 2022

Abstract

:
The Chao Phraya River basin is located in the central area of Thailand, which experiences many land subsidence issues due to groundwater pumping. The Department of Groundwater Resources (DGR) has been recording data on the changes in the groundwater level due to water pumping since 1960 until the present time. In 1997, the DGR issued a law regulating the use of groundwater due to its effect on the changes in the groundwater level. The changing of the groundwater level was separated into two periods. The first period is the high groundwater pumping ratio that led to a rapid decrease in the groundwater level of about 27 m from the ground surface. After the DGR issued the new law in the second period, the pumping ratio decreased and the groundwater level increased. The groundwater level tends to reach the ground surface. In the past, the groundwater level decrease was affected by the land subsidence. Therefore, this study focused on calculating and learning the behavior of the soil surface displacement during groundwater level recovery to the ground surface in Bangkok, Thailand. We obtained the 3D soil profiles adopted from eight boreholes from the Department of Public Works and Town & Country Planning. The soil profile data were verified by monitoring the data from the Department of Groundwater Resources (DGR) in the same area. The soil layers of the 3D soil profile were analyzed to calculate the soil surface displacement based on the consolidation theory of Terzaghi. We also examined the displacement behavior of the clay layers during the groundwater level recovery to the ground surface by assuming that the soil layers below the groundwater level do not settle or rebound. The surface displacement results showed that the surface ends to move upward or rebound, which is a similar trend to that reported in previous research. All the considered locations showed similar soil surface displacement trends. The soil displacement ratio is 0.21 to 0.53 cm/year during the groundwater recovery.

1. Introduction

The changing groundwater level is an important factor affecting building and infrastructure design. Decreases in groundwater level also affect land subsidence due to pore-water-pressure decreases. Many researchers have summarized the problems of land subsidence in different locations such as Tokyo [1], Osaka [2], Shanghai [3], Taipei [4], Jakarta [5,6,7], Hanoi [8], and Bangkok [9,10]. For example, Jakarta City, Indonesia, is located in an area with a ground surface elevation that is lower than the sea water level. The groundwater level has rapidly decreased due to groundwater pumping, which led to continuous land subsidence.
The data collected by the Department of Groundwater Resources (DGR) before 1997 show that the groundwater level in the central part of Thailand has continuously decreased due to groundwater pumping [11]. The growth and expansion of Jakarta have directly increased the demand for groundwater pumping, which is one of the main reasons for land subsidence. To manage this issue, the Department of Groundwater Resources, Thailand, issued a law to control the amount of groundwater pumping by industries. The groundwater level tends to reach the ground surface. The soil surface displacement during the groundwater level recovery has affected civil engineering structures, leading to road and building cracks, especially in old buildings that were designed with a low groundwater level or in dry areas. Differential settlement between a building and the ground surface is also a consequence of land subsidence. Cox [12] reported evidence of damage due to land subsidence, such as ground and footpath separating from the adjoining building, buckling of pavement over footings, and differential settlement between the building and foundation in Bangkok, Thailand. Natalaya et al. [13] indicated that about 1.60 m of land subsidence occurred from 1933 to 1987, and settlement significantly increased by about 2.05 m in 2003. All settlement occurred during the groundwater pumping period. Phien-wej et al. [14] reported on groundwater pumping in the late 1980s in inner Bangkok. Land subsidence was a result of the time-dependence consolidation behavior of aquitards and the soft clay layer at the surface, induced by the groundwater drawdown in the aquifer layer. Moreover, settlement still occurred slowly as the groundwater level increased, but the rate of settlement was slower than before. After the groundwater level began to recover, Phien-wej [15] analyzed the land subsidence and groundwater pumping data of the whole Bangkok metropolitan area. Between 1994 and 1998, every 1 m3 of groundwater pumping from underneath the aquifers were related to a ground surface volume loss of about 0.05 to 0.10 m3. Additionally, the cause of land subsidence was the consolidation of both shallow soft and stiff clay layers (within 50 m of the ground surface) to about 30% to 50% of the total land subsidence. Phien-wej et al. [14] predicted subsurface settlement and compared the results with the measurements after 1995. The calculation results suggested that the compression of the soil layer is up to 25% of the total land subsidence at the surface of the shallow clay layer in the long term (within 50 m of the ground surface).
Land subsidence has also occurred in Thailand due to groundwater pumping. The Department of Groundwater Resources collects measurements of the groundwater level, pore-water pressure, and settlement. Many researchers have evaluated and predicted the characteristics of land subsidence in various areas, including Bangkok, Thailand. Finite element analysis is a suitable method of predicting land subsidence. Thepparak [16] used the finite difference code for one-dimensional coupled flow-consolidation analysis of Bangkok clay from 1960 to 1989, which was the groundwater drawdown period. A decrease in the groundwater level led to a decrease in the permeability of the clay layer with time and an increase in the degree of consolidation. After the groundwater level increased due to the law established for groundwater pumping, land subsidence still occurred after 1997 [1]. Evaluations of soil surface displacement have been conducted since groundwater pumping was prohibited. Intui et al. [17] evaluated the settlement behavior with the centrifuge test. The centrifuge test was separated into three stages of groundwater level: before groundwater level drawdown, groundwater level drawdown, and groundwater level recovery back to the ground surface. Settlement still continuously occurred even when groundwater reached the ground surface, but the rate of settlement significantly decreased in the last stage. The settlement rate in the last stage was almost constant. Soil surface displacement was calculated by using a numerical model. Phoban et al. [18] used a series of two-dimensional finite element analyses with fully coupled flow-deformation analysis in PLAXIS2D to predict soil surface displacement. The model referred to a previous centrifuge test. All soil layers were considered to simulate the groundwater rise. The results showed that the soil surface will rebound about 14 cm (about 35% of the total surface settlement) from 1997 to 2037. Saowiang and Giao [19] predicted the subsurface displacement of both the groundwater level drawdown (for years 1960 to 1997) and recovery (for years 1997 to 2016) in three locations in the Bangkok area by using FEM transient coupled pore pressure/effective stress analysis with ABAQUS software. During groundwater drawdown, land subsidence of about 51, 62, and 76 cm had occurred in each location, respectively. During groundwater level recovery, the rebound of soil of about 5, 6, and 4 cm was calculated at the three locations, respectively.
The increase in groundwater after the prohibition of groundwater pumping is very interesting. Pore-water pressure increases can lead to foundation problems and differential settlement issues. As such, in this study, we focused on calculating and predicting the soil surface displacement during groundwater level recovery by hand calculation. Finally, the soil displacement result from theoretical calculation was compared with the findings of previous research from Phoban et al. [18] and Saowiang and Giao [19].

2. Geological Conditions in Bangkok

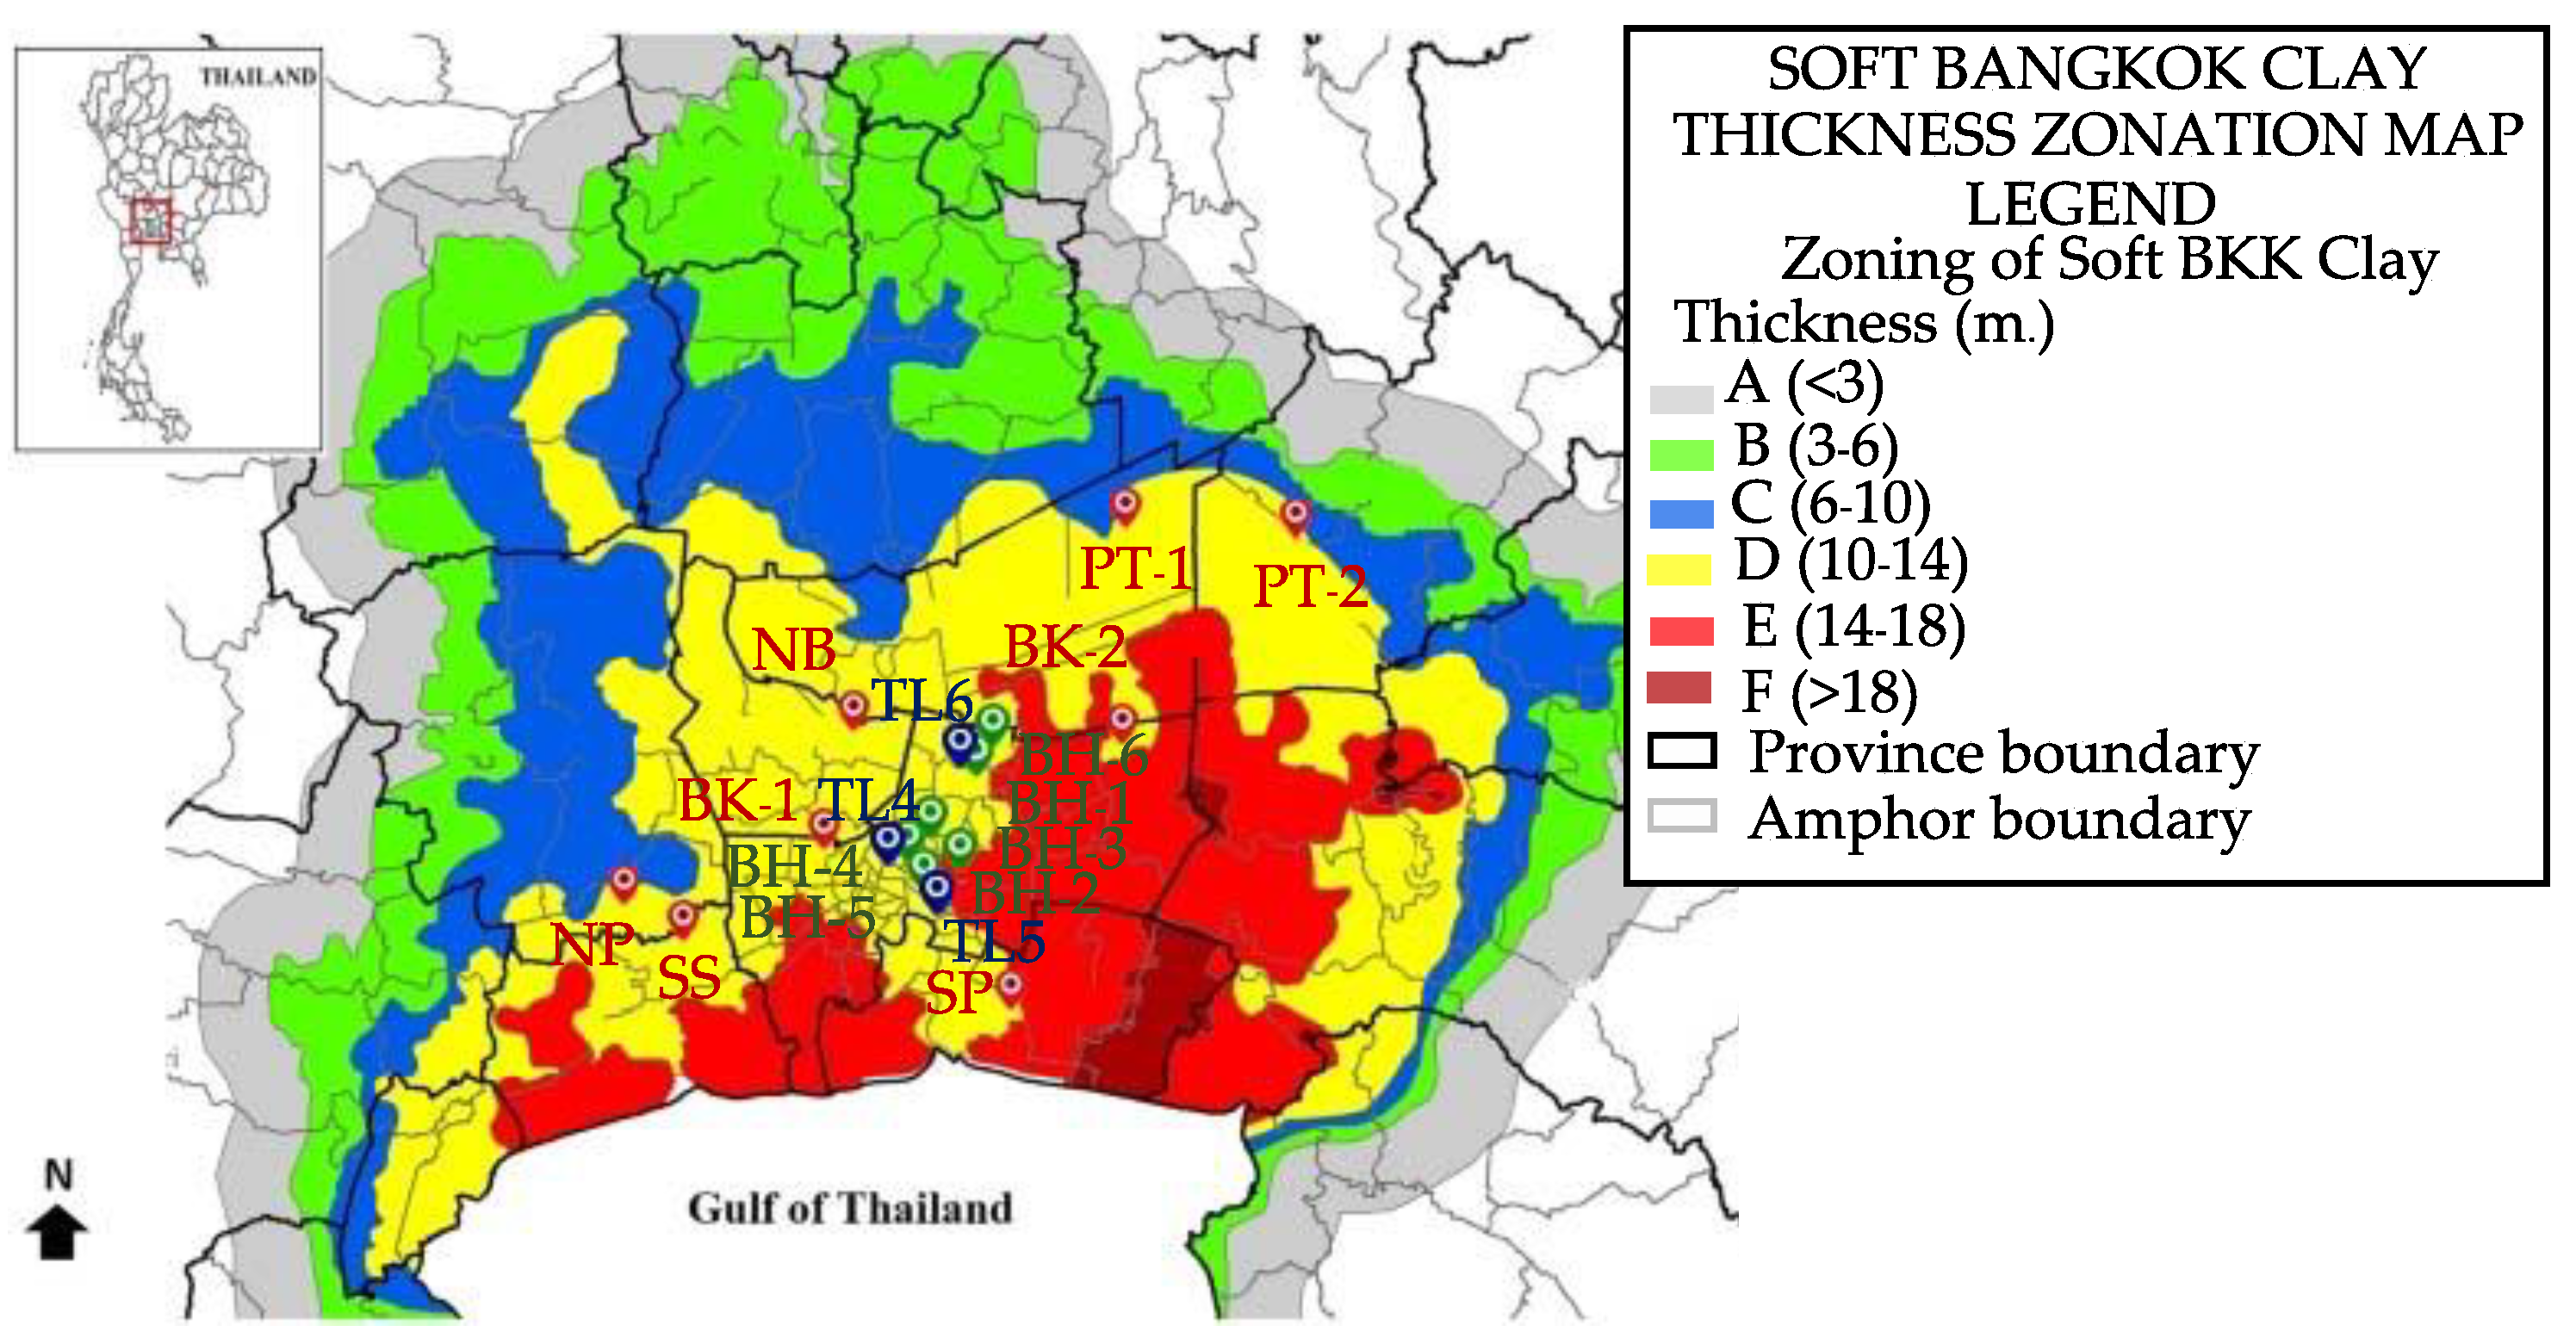
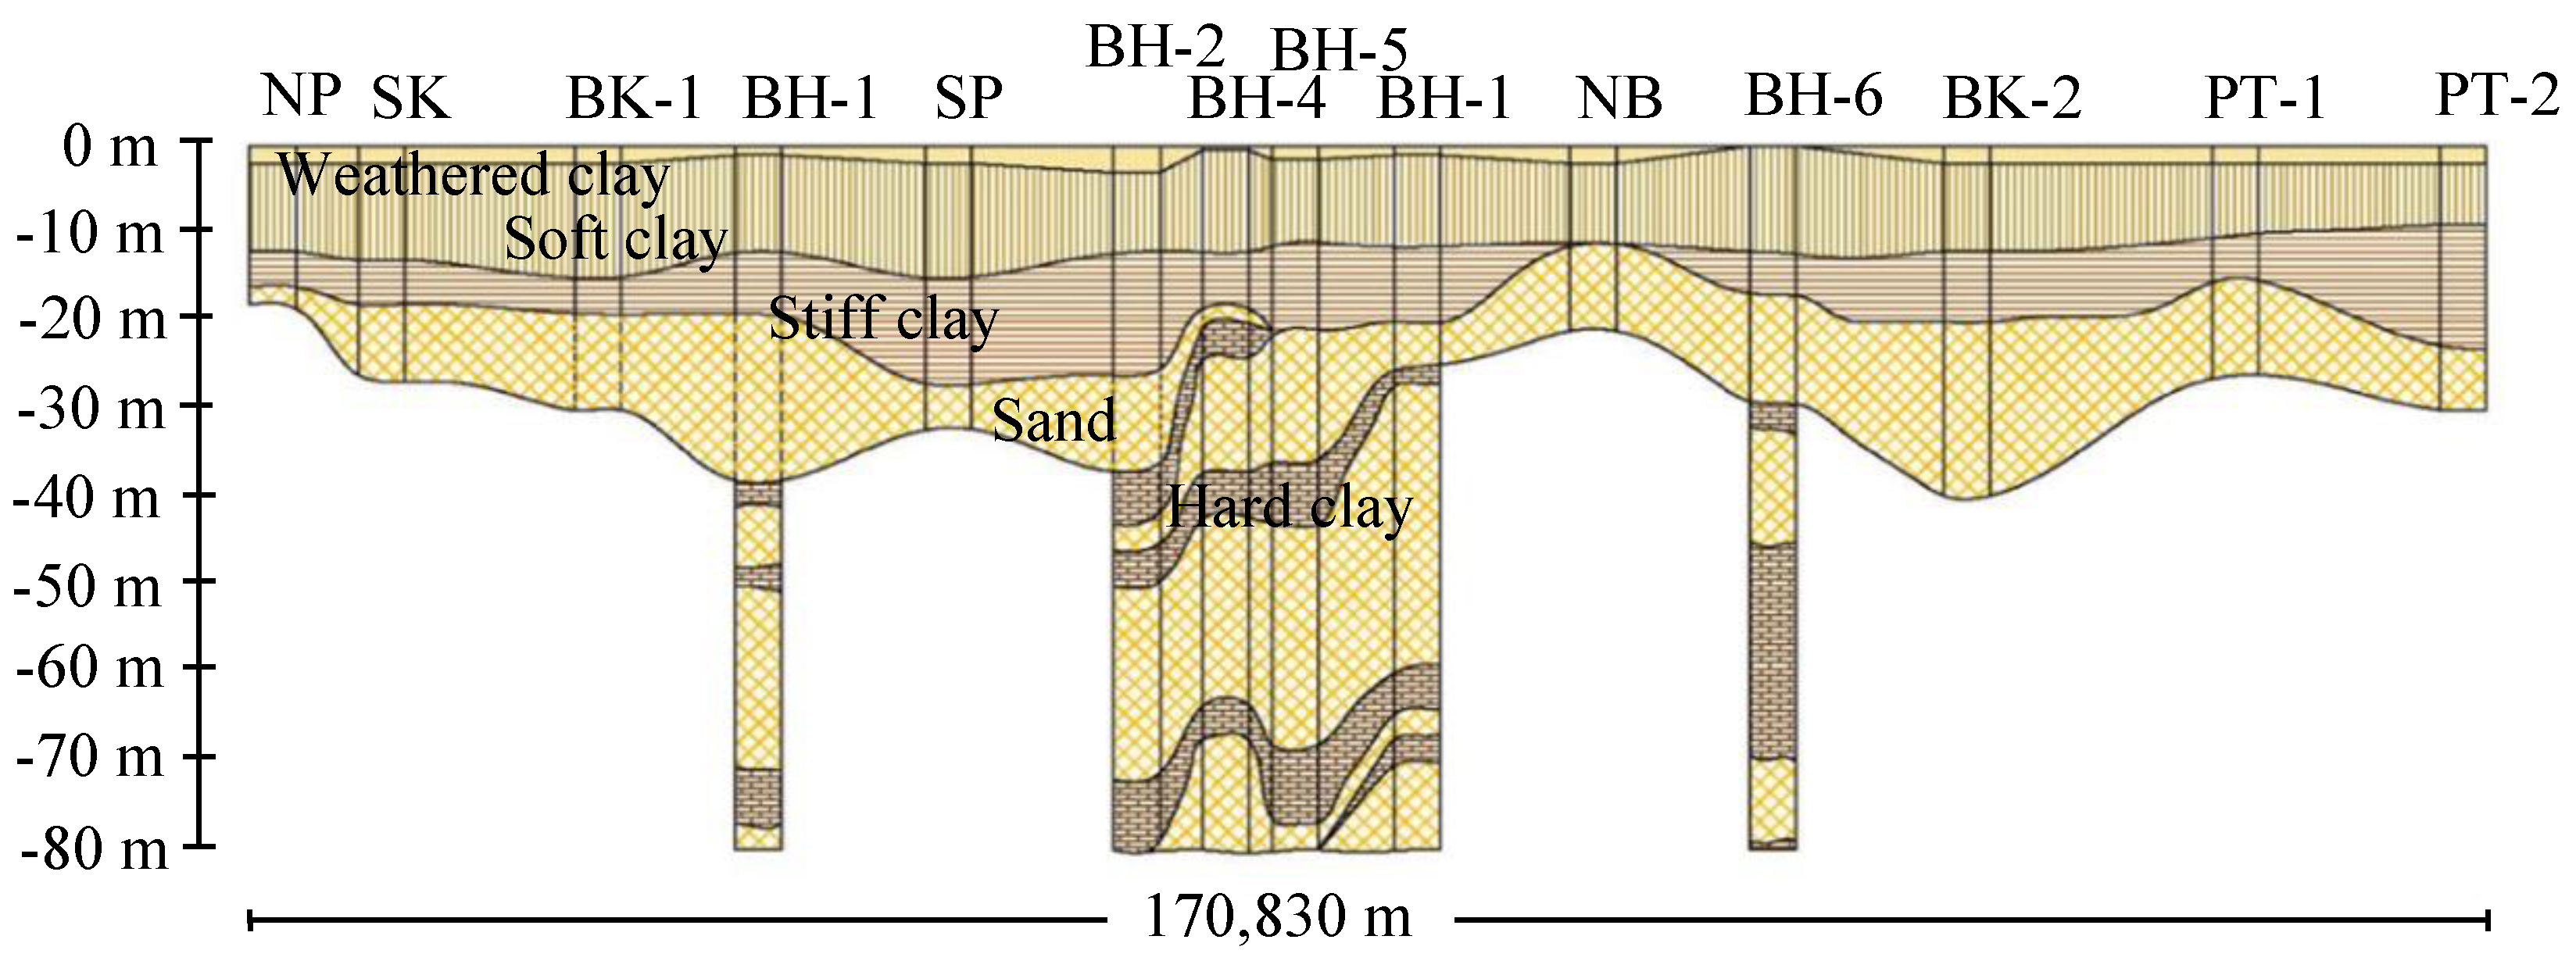
2.1. Bangkok Soft Soil Profile

The area of Bangkok soft soil is located along the Chao Phraya River basin, covering many provinces, including Bangkok and its urban area. In the past, this area was part of the sea. The soil was deposited in alternating clay and sand layers. The subsoil layers consist of very soft clay to soft clay, very stiff to stiff clay, first sand, hard clay, and second sand. The Department of Groundwater Resources (DRG), the Department of Public Works and Town & Country Planning, and many researchers have studied the characteristics of the subsoil layers in the Chao Phraya River basin area and found that the subsoil layers are variable. However, the overall soil layers still consist of alternating clay and sand layers.

2.2. Groundwater Level Situation

The characteristics of the groundwater level in the Bangkok area depend on the groundwater pumping. Since 1997, the groundwater level in the Bangkok area has tended to recover to the ground surface level after groundwater pumping started to be controlled. Figure 1 shows the changes in the groundwater level and land subsidence during the past and future (predicted) years of groundwater consumption [11]. The graph shows an increase in the groundwater level since 1997, and a trend for the level reaching the ground surface in the future. In contrast, land subsidence is still occurring but has gradually become stable since 2008.
At present, the DGR measures the groundwater level using piezometers. Table 1 shows that the groundwater level recovery rate is increasing in each province. All of the provinces located along the Chao Phraya River basin have a groundwater level recovery rate of about 0.57 to 2.74 m/year.

3. Methodology

A changing groundwater level is an important cause of land subsidence. This study focused on the evaluation of soil surface displacement during groundwater level recovery in the Bangkok area. Soil profiles and soil parameters were collected from the Department of Public Works and Town & Country Planning, then they were evaluated and verified with the data from the Department of Groundwater Resources. All verified data were used to analyze soil surface displacement through theoretical calculations.

3.1. Subsoil Profile of Zone D

The Bangkok plain in this study is an area that covers many provinces in the central part of Thailand, as shown in Figure 2. Amornkul [20] described the soft soil thickness of Bangkok clay. Bangkok clay was separated into six zones designated with different colors. The zones were divided by their soft clay thickness. The dark red (F) area has a thickness of over 18 m. The red (E) area had a thickness of 14 to 18 m. The yellow (D) area had a thickness of 10 to 14 m. The blue (C) area had a thickness of 6 to 10 m. The green (B) area had a thickness of 3 to 6 m, and the gray (A) area had a thickness of less than 3 m. Land subsidence occurred around the Bangkok plain. This study considered only Zone D because this zone is a developed area and has data available, which we used for evaluating the behavior of the soil surface displacement using Terzaghi’s equation of consolidation. Therefore, the red marks in Figure 2 were chosen for hand calculation. The red marks in Figure 2 represent the 8 borehole locations of the Department of Public Works and Town & Country Planning [21]. All the borehole locations were chosen for our theoretical calculation.
All data of each bored hole were interpreted to evaluate the soil parameters. Then, all soil parameters and soil profiles were verified with the groundwater level measurements described in the report from the Department of Groundwater Resources. Following Figure 2, the green marks show the holes investigated by the Department of Groundwater Resources. The name and location of each hole are shown in Table 2.

3.2. Soil Parameters

The soil parameters in this study were adopted from the boring log data on the eight boreholes located in Zone D. The water content, liquid limit, plastic limit, total density, undrained shear strength, and standard penetration test (SPT) results were obtained for each borehole. The initial void ratio was calculated using the phase relationship equation from the borehole parameters. The boring log data were interpreted to obtain the soil parameters to calculate the soil surface displacement based on the one-dimensional consolidation of Terzaghi’s theory. For some soil parameters, we needed to adopt the equations of other researchers to calculate the soil surface displacement. The value of Cc is related to the value of water content (Wn), liquid limit (LL), and void ratio (eo), as described by Cox [12], Tonyagate [22], Kerdsuwan [23], Adikari [24], and Sivandran [25]. The soil parameters and thickness of the soil layers were calibrated with the data from the Department of Groundwater Resources. The soil parameters of each soil layer are shown in Table 3. Some parameters could not be gathered from the boring log data. There were some parameters, such as the specific gravity of the soil (equal to 2.7 [1]), the overconsolidation ratio (OCR) [26], and the effective stress parameter as the matrix of the suction coefficient (c) [27,28], that we based on the data reported by Surasak et al. [29], which were gathered from the same area.

3.3. Theoretical Calculation

Using the data provided by the DGR in 2012, the minimum groundwater level was equal to about 27 m from the ground surface in the Bangkok area. Using the monitoring data, Saowiang and Giao calculated the changes in pore-water pressure due to groundwater drawdown and groundwater recovery, as shown in Figure 3. The relationship between pore-water pressure and elevation was not linear in the first 20 m in both groundwater drawdown and recovery. The soil surface zone affected the groundwater level change [19]. Therefore, we focused on calculating the soil surface displacement by considering only 2 soil layers: the soft and stiff clay layers. Other soil layers were assumed to not have soil displacement during groundwater recovery. The calculation of the soil surface displacements related to the changing in the groundwater level by following the timing and groundwater level based on the monitoring data of the DGR, as evaluated by Phien-wej et al. [14]. The consolidation settlement equation, Equation (1), was used for the calculation in the case of overconsolidated clay because the maximum vertical effective stress was larger than the final vertical effective stress. Many parameters were calculated, such as the recompression index ( C r ), initial void ratio ( e 0 ), maximum vertical effective stress ( σ v m ), final vertical effective stress ( σ v f ), and thickness of the soil or drainage path. The surface displacement of the saturated soil, located below the groundwater level, was calculated with Equation (2) based on Terzaghi’s equation [30], while the surface displacement of the unsaturated soil, located above the groundwater level, was calculated with Equation (3), following Bishop’s equation [31]. The suction (S), pore air pressure ( u a ), and pore water pressure ( u w ) are the parameters in Equation (4). The parameters for the 8 boreholes were calculated by using the same equation.
Δ H = C r 1 + e 0 log σ v f σ v m H 0
σ = σ u
σ = [ ( σ u a ) + χ ( u a u w ) ]         ( 1 > χ > 0 )
S = u a u w

4. Results and Discussions

This section describes the results of the soil surface displacement after the estimation and interpretation of the soil parameters, soil profile, and groundwater level recovery.

4.1. D Soil Profile

The eight boreholes were located in Zone D, which is called the yellow area. After verifying the soil parameters and the soil layer, all data of Zone D are presented in Figure 4, which we generated using 2D AutoCAD software. The eight boreholes were compared with the soil profile of the DGR data (BH-1 to BH-6). The soil profiles from the two different organizations have the same characteristics. Figure 4 presents the variations in the soil layer arrangement and thickness because the distance between each borehole was quite far. Figure 5 shows the top view of the 3D soil profile to present the variation in the soil layers, which depended on the length between each borehole; Figure 6 and Figure 7 show the 3D layouts, which we created using 3ds Max software. The borehole layout covers an area of about 1334 m2. However, this study focused on evaluating the soil surface displacement of each borehole to represent each location.

4.2. Soil Surface Displacement

Only the upper soil layer, about 30 m from the ground surface, was affected by land subsidence because the minimum groundwater level was 27 m from the ground surface. Both soft clay and stiff clay were considered to evaluate soil surface displacement. We calculated the soil surface displacement by determining the period and characteristics of the groundwater level recovery to the ground surface level using the measurements by the DGR [11]. The soil surface displacement was calculated based on the one-dimensional consolidation of Terzaghi’s theory. The soil layer above the groundwater level was considered as unsaturated soil, and the soil layer below the groundwater level was considered as saturated soil. We estimated the total displacement based on the relationship between the groundwater level and the time period described by Giao et al. [26]. Following a previous study, groundwater level and time are linearly related; therefore, we calculated the soil displacement for every 5 m of groundwater level change from 2001 until 2032 when the groundwater level reaches the ground surface. In conclusion, the groundwater level was 25 m below ground surface in 2001. According to our groundwater level evaluation and prediction, the groundwater level will reach the ground surface level by 2032. The eight boreholes show similar total displacement trends and displacement rates from 2001 to 2032, as shown in Table 4. Figure 8 shows the relationship between the total displacement and time of the surface displacement predictions of all the boreholes in Zone D. There is a tendency for rebound displacement due to groundwater recovery.
As shown in Figure 9, in the same study area, Our results show soil surface behavior similar to other results, such as the results of the PLAXIS2D evaluation, which showed that soil displacement rates are equal to 0.35 cm/year from 1997 to 2037 [18]. The results of ABAQUS software produced rebound rates equal to 0.26 to 0.32 cm/year from 1997 to 2016 [19]. However, the soil displacement monitoring data have been almost constant since 2007 at the Chulalongkorn University station, Pathum Wan [11]. It should be noted that the results of this study were evaluated using predictions of groundwater levels from previous studies. At present, no one knows when the groundwater level will reach the ground surface or how the soil surface displacement will rise during increases in the groundwater level. Thus, we tried to simplify the calculation method. The results from the simplified theoretical calculation can be applied to evaluate or predict soil surface displacement due to groundwater recovery in the future.

5. Conclusions

In this study, we summarized the characteristics and soil properties of subsoil layers in the Chao Phraya River basin area of central Thailand in order to evaluate the soil surface displacement due to the changing groundwater level. The results were calculated based on Terzaghi’s equation of consolidation. We attempted to simplify the soil layer characteristics and other data obtained from the Department of Public Works, Town & Country Planning, and the Department of Groundwater Resources (DGR). Soil layers in Zone D were simplified and verified with the subsoil data measured by the DGR. The variation in the soil layers depends on the distance between each borehole. This study focused on a large area. Therefore, this variation in soil layers was not a concern in this study. An evaluation of soil surface displacement during groundwater level recovery was performed using theoretical calculations based on the one-dimensional consolidation theory of Terzaghi. The rebound of the soil surface displacement to the ground surface was considered for every borehole. Finally, theoretical calculation was one of the methods used to evaluate soil surface displacement during groundwater recovery. Soil surface displacement was based on Terzaghi’s and Bishop’s equations, which produced the same results as ABAQUS and PLAXSIS2D software in previous studies. Following this methodology, we analyzed a soil surface displacement by hand calculation. There are many methodologies and equations to evaluate soil surface displacement, except Bishop’s equation. This study only provides a simple calculation to evaluate and understand the behavior of soil surface displacement during groundwater change.

Author Contributions

Conceptualization, S.I. (Sutasinee Intui) and S.S.; methodology, S.I. (Sutasinee Intui) and S.I. (Shinya Inazumi); validation, S.I. (Sutasinee Intui) and S.S.; formal analysis, S.I. (Sutasinee Intui); investigation, S.I. (Sutasinee Intui), S.S., and S.I. (Sutasinee Intui); resources, S.I. (Sutasinee Intui) and S.I. (Shinya Inazumi); data curation, S.I. (Sutasinee Intui); writing—original draft preparation, S.I. (Sutasinee Intui); writing—review and editing, S.I. (Shinya Inazumi); visualization, S.I. (Sutasinee Intui) and S.I. (Shinya Inazumi); supervision, S.I. (Shinya Inazumi); project administration, S.I. (Shinya Inazumi). All authors have read and agreed to the published version of the manuscript.

Funding

This research received no external funding.

Institutional Review Board Statement

Not applicable.

Informed Consent Statement

Not applicable.

Data Availability Statement

Not applicable.

Acknowledgments

All the authors would like to thank the Department of Groundwater Resources for providing the instrument data and the Department of Public Works and Town & Country Planning for providing the soil boring log data by online website. The data they provided were vital to this research and to obtaining the results for evaluating the soil surface displacement.

Conflicts of Interest

The authors declare no conflict of interest.

References

  1. Sato, C.; Haga, M.; Nishino, J. Land subsidence and groundwater management in Tokyo. Int. Rev. Environ. Strateg. 2006, 6, 403–424. [Google Scholar]
  2. Institute for Global Environmental Strategies (IGES). Sustainable Groundwater Management in Asian Cities. In A Final Report of Research on Sustainable Water Management Policy; Institute for Global Environmental Strategies: Hayama, Japan, 2007; pp. 137–148. [Google Scholar]
  3. Wu, C.-J.; Ye, G.-L.; Zhang, L.-L.; Bishop, D.; Wang, J.-H. Depositional environment and geotechnical properties of Shanghai clay: A comparison with Ariake and Bangkok clays. Bull. Eng. Geol. Environ. 2015, 74, 717–732. [Google Scholar] [CrossRef]
  4. Chen, C.-T.; Hu, J.-C.; Lu, C.-Y.; Lee, J.-C.; Chan, Y.-C. Thirty-year land elevation change from subsidence to uplift following the termination of groundwater pumping and its geological implications in the Metropolitan Taipei Basin, Northern Taiwan. Eng. Geol. 2007, 95, 30–47. [Google Scholar] [CrossRef]
  5. Abidin, H.Z.; Andreas, H.; Gumilar, I.; Pohan, Y.E.; Deguchi, T. Land subsidence of Jakarta (Indonesia) and its relation with urban development. Nat. Hazards 2011, 59, 1753. [Google Scholar] [CrossRef]
  6. Abidin, H.Z.; Andreas, H.; Djaja, R.; Darmawan, D.; Gamal, M. Land subsidence characteristics of Jakarta between 1997 and 2005, as estimated using GPS surveys. GPS Solut. 2008, 12, 23–32. [Google Scholar] [CrossRef]
  7. Djaja, R.; Rais, J.; Abidin, H.Z.; Wedyanto, K. Land subsidence of Jakarta metropolitan area. In Proceedings of the 3rd FIG Regional Conference, Jakarta, Indonesia, 3–7 October 2004. [Google Scholar]
  8. Duong, T.T. Initial Study on Hanoi Land Subsidence. Master’s Thesis, Asian Institute of Technology, Bangkok, Thailand, 2005. [Google Scholar]
  9. Asian Institute of Technology (AIT). Investigation of land subsidence caused by deep well pumping in the Bangkok area. In Research Report; Asian Institute of Technology: Bangkok, Thailand, 1981; p. 91. [Google Scholar]
  10. Bergado, D. Structural damage and pavement failure due to subsidence at AIT campus. In Proceedings of the Third National Convention on Structural Engineering, Manila, Philippines, 5–6 August 1983. [Google Scholar]
  11. Department of Groundwater Resources. The Study of the Effect of Underground Structures Due to the Recovery of Water Press-sure in the Groundwater Layer in Bangkok and Its Vicinity; Ministry of Natural Resources and Environment: Bangkok, Thailand, 2012; pp. 17–62.
  12. Cox, J.B. A Review of the Engineering Characteristics of the Recent Marine Clay in Southeast Asia; Research Report; Asian Institute of Technology: Bangkok, Thailand, 1968; Volume 6. [Google Scholar]
  13. Natalaya, P.; Yong, R.N.; Chumnankit, T.; Buapeng, S. Land subsidence in Bangkok during 1978–1988. In Sea-Level Rise and Coastal Subsidence; Springer: Dordrecht, The Netherlands, 1996; pp. 105–130. [Google Scholar] [CrossRef]
  14. Phien-wej, N.; Giao, P.H.; Nutalaya, P. Land subsidence in Bangkok, Thailand. Eng. Geol. 2006, 82, 187–201. [Google Scholar] [CrossRef]
  15. Phien-wej, N. Bangkok land subsidence and its problems in foundation engineering. In Proceedings of the Seminar of the Engineering Institute of Thailand, Bangkok, Thailand, July 1999; pp. 1–66. [Google Scholar]
  16. Thepparak, S. Analysis of Settlement and Compression of Shallow Soil Strata Due to Drawdown of Groundwater in an Underlying Aquifer from Well Pumping in BANGKOK Area. Master’s Thesis, No. GE-00-01. Asian Institute of Technology, Bangkok, Thailand, 2001. [Google Scholar]
  17. Intui, S.; Soralump, S.; Inazumi, S.; Shishido, K. Application of centrifuge model tests to settlement behavior under groundwater recovery. Int. J. GEOMATE 2021, 21, 34–40. [Google Scholar] [CrossRef]
  18. Phoban, H.; Seeboonruang, U.; Lueprasert, P. Numerical modeling of single pile behaviors due to groundwater level rising. Appl. Sci. 2021, 11, 5782. [Google Scholar] [CrossRef]
  19. Saowiang, K.; Giao, P.H. Numerical analysis of subsurface deformation induced by groundwater level changes in the Bangkok aquifer system. Acta Geotech. 2021, 16, 1265–1279. [Google Scholar] [CrossRef]
  20. Amornkul, C. Engineering Subsoil Database of Lower Central Plain. Master’s Thesis, Kasetsart University, Bangkok, Thailand, 2010. [Google Scholar]
  21. Department of Public Works and Town & Country Planning. Soil GIS DPT [Online]. 2020. Available online: http://soilgis.dpt.go.th/login.php (accessed on 25 March 2022).
  22. Tonyagate, W. Geotechnical Properties of Bangkok Subsoils for Subsidence Analysis. Master’s Thesis, Asian Institute of Technology, Bangkok, Thailand, 1978. [Google Scholar]
  23. Kerdsuwan, T. Basic Properties and Compressibility Characteristics of First and Second Layers of Bangkok Subsoils. Master’s Thesis, Asian Institute of Technology, Bangkok, Thailand, 1984. [Google Scholar]
  24. Adikari, G.S.N. Statistical Evaluations of Strength and Deformation Characteristics of Bangkok Clays. Master’s Thesis, Asian Institute of Technology, Bangkok, Thailand, 1977. [Google Scholar]
  25. Sivandran, C. Probabilistic Analysis of Stability and Settlement on Soft Bangkok Clay. Ph.D. Thesis, No. GT-79-1. Asian Institute of Technology, Bangkok, Thailand, 1979. [Google Scholar]
  26. Giao, P.H.; Paveechana, T.; Saowiang, K. Consolidation Settlement Analysis with Reference to Groundwater Recovery in the Bangkok Multi-Aquifer System. Advances in Geotechnical Infrastructure; Society of Singapore: Singapore, 2013; pp. 567–573. [Google Scholar] [CrossRef]
  27. Zhou, A.N.; Sheng, D.; Sloan, S.W.; Gens, A. Interpretation of unsaturated soil behaviour in the stress—Saturation space, I: Volume change and water retention behaviour. Comput. Geotech. 2012, 43, 178–187. [Google Scholar] [CrossRef]
  28. Zhou, A.N.; Sheng, D.; Sloan, S.W.; Gens, A. Interpretation of unsaturated soil behaviour in the stress—Saturation space, II: Constitutive relationships and validations. Comput. Geotech. 2012, 43, 111–123. [Google Scholar] [CrossRef]
  29. Surarak, C.; Likitlersuang, S.; Wanatowski, D.; Balasubramaniam, A.; Oh, E.; Guan, H. Stiffness and strength parameters for hardening soil model of soft and stiff Bangkok clays. Soils Found. 2012, 52, 682–697. [Google Scholar] [CrossRef] [Green Version]
  30. Terzaghi, K. The shearing resistance of saturated soils and the angle between the planes of shear. In Proceedings of the First International Conference on Soil Mechanics and Foundation Engineering, Cambridge, UK, 22–26 June 1936; pp. 54–56. [Google Scholar]
  31. Bishop, A.W. The principle of effective stress. Tek. Ukebl. 1959, 39, 859–863. [Google Scholar]
Figure 1. Changes in groundwater level and land subsidence due to groundwater pumping.
Applsci 12 07904 g001
Figure 2. Locations of the studied holes.
Applsci 12 07904 g002
Figure 3. Pore-water pressure changes at SBTA site.
Applsci 12 07904 g003
Figure 4. Soil profile layout of Zone D.
Applsci 12 07904 g004
Figure 5. Top view layout of study area.
Applsci 12 07904 g005
Figure 6. A 3D schematic of View A.
Applsci 12 07904 g006
Figure 7. A 3D schematic of View B.
Applsci 12 07904 g007
Figure 8. Displacement at each borehole.
Applsci 12 07904 g008
Figure 9. Comparison of the evaluation of soil surface displacement in various studies. [Modified Ref [11,18,19].
Applsci 12 07904 g009
Table 1. Groundwater level situation at each borehole.
ProvinceGroundwater Level Recovery Rate (2009)
Elevation (m)Minimum Rate (m/year)Maximum Rate (m/year)
Bangkok32.860.572.74
Samutprakan29.471.072.45
Pathumthani19.30.482.41
Nonthaburi12.70.271.06
Ayutthaya16.30.611.23
Nakhonpathom19.180.601.59
Samutsakhon32.751.942.34
Table 2. Name and location of each bored hole on the map.
NameDescription
NPNahonPathom
SSSamutSakhon
BK-1Bangkok (Taling Chan)
BK-2Bangkok (Khlong Sam Wa)
NBNonthaburi
SPSamutPrakon
PT-1PathumThani (KhlongLuang)
PT-2PathumThani (Thanya)
BH-1Chatuchak Park
BH-2Lumphini Park
BH-3Suea Pa Park
BH-4Rommaninath Park
BH-5Rajamangala University
BH-6Kasetsart University
Table 3. Soil parameters for calculation.
Soil LayersSoil
Parameters
Boreholes
NPSSNBBK-1BK-2SPPT-1PT-2
Very soft to
medium clay
(2 to 13 m)
wn (%)52388869726278 65
wL (%)4143876448465038
wP (%)2325672725372520
gt (t/m3)1.701.841.501.591.581.641.551.62
e01.401.032.371.861.941.672.101.75
Stiff to
very stiff clay
(13 to 25 m)
wn (%)1917-2237342525
wL (%)3135-5150516040
wP (%)1817-2.061.851.882.012.01
gt (t/m3)2.122.16-2.061.851.882.012.01
eo0.510.4-0.590.990.920.680.68
Table 4. Total displacement and displacement rate.
BoreholeTotal Displacement (cm)Displacement Rate
(cm/year)
In 2001In 2032
NP−9.07−17.68−0.28
SS−7.29−13.64−0.20
BK1−12.30−23.50−0.36
BK2−17.41−33.31−0.51
NB−18.92−35.03−0.52
SP−17.05−28.52−0.37
PT1−12.63−25.90−0.43
PT2−11.48−20.44−0.29
Publisher’s Note: MDPI stays neutral with regard to jurisdictional claims in published maps and institutional affiliations.

