Article

A Study of a Ride Comfort Control System for Ultra-Compact Vehicles Using Biometric Information

1
Department of Mechanical Engineering, Hokkaido University of Science, Sapporo 006-8585, Japan
2
Course of Mechanical Engineering, Tokai University, Tokyo 259-1292, Japan
3
Course of Science and Technology, Tokai University, Tokyo 259-1292, Japan
4
Electrical Engineering, Fukuoka Institute of Technology, Fukuoka 811-0295, Japan
5
Department of Mechanical Engineering, Tokyo University of Technology, Tokyo 192-0982, Japan
6
Department of Mechanical Systems Engineering, Tokai University, Tokyo 151-8677, Japan
*
Author to whom correspondence should be addressed.
Appl. Sci. 2022, 12(15), 7425; https://doi.org/10.3390/app12157425
Submission received: 28 June 2022 / Revised: 20 July 2022 / Accepted: 21 July 2022 / Published: 24 July 2022
(This article belongs to the Section Transportation and Future Mobility)

Abstract

:
We investigated whether there is a correlation between the comfort felt by occupants and the comfort estimated from biological information obtained by experiments to improve the ride quality of an ultra-compact vehicle. A single frequency in the vertical direction can help to estimate occupant comfort. However, we hypothesized that the study of a single frequency was insufficient. We oscillated the occupants with vibrations containing multiple vibration frequencies and obtained biometric information. The vibration frequency was set based on the difference in ride quality felt by humans. Biometric information was obtained using a cerebral hemodynamic meter and electrocardiogram. Acquiring multiple types of biometric information helps to more accurately estimate the psychological state. After the experiment, we obtained a subjective evaluation of comfort against vibrations using the visual analog scale (VAS). The biometric information obtained by the experiment was cluster-analyzed, and experimental participants with similar characteristics of the biometric information were grouped. Multiple regression analysis was performed based on the values of the typical biometric information of the cluster. Comfort was estimated from biometric information using multiple regression analysis. A correlation was confirmed between measured and estimated VAS scores.

1. Introduction

In recent years, ultra-compact mobility has been used in car-sharing services at tourist destinations and for short-distance home delivery services, and the demand has increased as a new means of transportation [1]. Ultra-compact mobility has a remarkably simple miniaturized structure, and even at low speeds, unevenness and steps can deteriorate riding comfort. Therefore, our research group proposed a system in which the actuator is equipped with an active seat suspension that uses a voice coil motor which exhibits high responsiveness, and the input vertical vibration is reduced by active control [2]. To date, the improvement of ride quality by vibration-damping control has been evaluated based on the myoelectric potential of the neck. As a result, it has been confirmed through biological information that the physical burden is reduced by damping control. However, the ride quality tended to differ depending on the occupant’s heart rate variability, which indicates the psychological state [3]. From this result, it was confirmed that damping does not always produce the best ride quality. It is essential to construction a new ride control system. Additionally, the occupant’s sense of ride comfort depends on an ever-changing physical condition and mood on the day. Furthermore, it is constantly changing due to the ever-changing driving environment. Therefore, the occupant’s comfort level must be taken into account based on the ever-changing driving environment. Until now, it has been common to evaluate the level of ride comfort quantitatively by subjective evaluation. However, road surface conditions are constantly changing, it is not possible to evaluate ride comfort in real time through subjective evaluation. Therefore, the occupant calculates the comfort level (while driving) from the biometric information of the occupant in real time, and applies it to optimize vibration control. Although there are technologies such as vibration control [4,5] that are actively performed based on the road surface condition and suspension adjustment according to the driver’s preference, the comfort level is calculated from the occupant’s biological information [6,7,8,9,10,11,12,13,14,15]. Although many studies have been conducted to evaluate ride comfort using biometric information [16,17,18,19,20], the current state of the art remains limited to evaluation. There are no studies that predict occupant psychological state from occupant biometric information. Therefore, the authors aim to clarify the relationship between vibration and biological information and the relationship between biological information and psychological state and to construct a method for estimating the psychological state from biological information as a preliminary step to system construction. In addition, the authors have clarified that the vibration frequency affects the human vibration sensation using heart rate variability, biological information that reflects the activity of the autonomic nervous system; this finding is consistent with the results of previous studies [21]. However, as the autonomic nervous system responds to factors other than the psychological state, such as respiration and movement, it cannot be generalized that it is affected by vibration. Therefore, it is difficult to accurately estimate the psychological state of an occupant using only heart rate variability. Therefore, we evaluated the mental stress of the occupants using cerebral blood flow, an index that reflects the activity of the human central nervous system [22]. As a result, we have confirmed that the activities of the occupant’s autonomic nerves and central nervous system become active when vibrations are applied. Furthermore, focusing on the difference in ride quality reported by Takei et al. [23], we conducted a vibration experiment assuming actual driving conditions. The occupant is vibrated at multiple frequency components to clarify the relationship between the biological information and the psychological state by subjective evaluation. However, subjective evaluation cannot evaluate ride comfort in real time. In addition, the occupant’s biometric information obtained from the vibration experiment was acquired, and the psychological state of the occupant during driving was estimated from the biometric information using statistical methods, such as cluster analysis, principal component analysis, and multiple regression analysis. Using the results of these studies, we hope to construct a system (Figure 1) that provides a pleasant driving environment by estimating the comfort level of the driver from the biometric information while driving, without having to evaluate the riding comfort of the occupants.

2. Biometric Information

2.1. Evaluation Method and Acquisition Method of Heart Rate Variability

In this study, we obtained an electrocardiogram (ECG) that can measure data easily and continuously to evaluate psychological state. Figure 2 shows the electrocardiograph (ADInstruments Co., Ltd. Dunedin, New Zealand). The R wave that appeared periodically was detected from the acquired ECG, and the RRI, which is the interval between the R wave and the next R wave, was calculated. The frequency characteristics of RRI changed depending on the state of the autonomic nervous system activity. The calculated RRI was summarized as a time history, and the power spectrum was calculated using fast Fourier transform. In this power spectrum, the integrated value of the LF component of 0.04 to 0.15 Hz and the integrated value of the HF component of 0.15 to 0.4 Hz were calculated, and the ratio of these was called LF/HF. If the value of LF/HF is high, the sympathetic nervous system is predominant and stressed; if the value is low, the parasympathetic nervous system is predominant and can be evaluated as relaxed.

2.2. Evaluation Method and Acquisition Method of Cerebral Blood Flow

A portable brain activity measuring device, HOT-1000 (NeU Corporation, Tokyo, Japan), was used to measure cerebral blood flow. Figure 3 shows the state in which the device was attached. The cerebral blood flow meter had one sensor unit on; and Figure 4 shows the principle of cerebral blood flow measurement. Each side consists of an LED that emits near-infrared light with a wavelength of 810 nm and two photodiodes. Near-infrared light was irradiated to the prefrontal cortex of the cerebral cortex by an LED, and the amount of light was measured by a photodiode. When the brain becomes active, the amount of hemoglobin in the blood increases. Hemoglobin absorbs light and with more active brain activity less light is detected by the photodiode. When the brain is stressed, the activity of the right brain becomes active, and when a person feels relaxed, the activity of the left brain becomes active. Therefore, when estimating the psychological state, the stress brain index laterality index at rest (LIR), which indicates the relationship between left and right brain activity, is effective. The LIR was calculated using Equation (1), where Rt is the cerebral blood flow in the right brain, Lt is the cerebral blood flow in the left brain, Rmin is the minimum value of the right brain activity in the measurement section, and Lmin is the minimum value of the left-brain activity.
LIR = Σ R t R m i n L t L m i n Σ R t R m i n + L t L m i n

3. Subjective Evaluation and Acquisition Methods

In this study, the experimental participants were subjective with respect to the input vibration. The visual analog scale (VAS) was used to evaluate ride comfort. Figure 5 shows an example of a questionnaire that was used. In the VAS questionnaire, a straight line of 10 cm was prepared for each question, and the answer of the positive state was shown at the left end, while the answer of the negative state was shown at the right end. In this study, we asked questions about the feeling of comfort after the experiment with respect to the state before the experiment. The cases where the left end was comfortable, and the right end was unpleasant were set. We taught the collaborators that the center line was the same as before the experiment and asked them to freely draw a line of intersection at the position indicating the state at that time. Subsequently, the distance from the left end of the straight line to the mark was measured and used as subjective evaluation values. If it is smaller than the center of the straight line, it can be evaluated as a relaxed state; if it is larger, it can be evaluated as a stress state.

4. A Method for Evaluating Psychological States Using Biological Information

4.1. Psychological State Estimation Using Multiple Regression Analysis

In this study, subjective evaluation was used as the objective variable. A multiple regression analysis was performed using multiple biometric information as the explanatory variable. Using sample data as an example, the subjective evaluation was set as the objective variable y and the biological information was set as the explanatory variable x. Regression analysis is shown in Equation (2). Here, b0: intercept, b = {b1, b2, bn}, x = {x1, x2, xn}: coefficient vector for each explanatory variable. In this study, the VAS value under each condition was set as the objective variable; and, the intercept b0 and the partial regression coefficient b for the explanatory variable x under each vibration condition were obtained. Table 1 lists the values of b0 to b17 for each vibration condition.
y = b 0 + b x

4.2. Experimental Condition

Figure 6 shows an ultra-compact mobility system equipped with an active seat suspension. The experiment was conducted with a car body jacked to prevent resonance. The state of the experiment is shown in Figure 7 and the flow of the experiment is shown in Figure 8. First, to keep the psychological state of the experimental collaborators constant, biometric information was obtained when the eyes were closed at rest for 180 s. Next, considering the road surface condition, we created filters focusing on three different vibration frequency bands with different ride quality reported by Takei et al. and applied the filters to signals output with white noise. The frequency bands with different ride comfort values are shown below.
(1)
0.2–3 Hz (fluffy feeling)
(2)
4–8 Hz (ISO2631 indicates that this frequency band makes people uncomfortable [6])
(3)
8–20 Hz (feeling of fluttering)
Biometric information was obtained by vibrating the sheet under these conditions. Before the vibration, mental arithmetic was performed to calculate a two-digit number for 60 s to keep the psychological state of the experimental collaborators constant and then vibration was performed for 180 s. After each experiment, the subjective evaluation described later was performed to extract the subjective ride-quality evaluation of the collaborators. The experiment was conducted with 25 healthy male university students in their 20 s, who held a normal driver’s license. This experiment was approved by the Institutional Review Board of Tokai University’s “Research on Humans”, and the contents of the experiment were explained in advance to the collaborators. The collaborators who agreed to cooperate with the experiment signed and stamped a consent form approved by the committee.

4.3. Predicted Results of Subjective Evaluation of Occupants

Figure 9 shows the results of multiple regression analysis using the biometric information of all 25 subjects obtained in this experiment. Under each vibration condition, even in the same frequency band, those who showed comfortable and unpleasant evaluations were scattered overall. The R value represents the correlation coefficient. If it was close to 1, it indicated a high correlation. The p-value indicated significance, and when p = 0.05, the significance of the multiple regression equation is shown. The correlation between the comfort rating obtained from the VAS method at 0.2–3 Hz and the predicted comfort R was 0.886; the correlation between the comfort rating obtained from the VAS method at 4–8 Hz and the predicted comfort R was 0.734 at 8–20 Hz, and the correlation R between the comfort evaluation value obtained from the VAS method and the predicted comfort was 0.930. However, the high significance of the p-value for each condition could not be confirmed. The correlation was ≥0.5; however, it was an insufficient value when the control was considered.

5. Grouping from Biological Information

In Section 4.3, multiple regression analysis was performed on 25 participants, and the correlation between the comfort evaluation value obtained from the VAS method and obtained from biological information was high, but it was applicable to the control. However, this was not a high value. Furthermore, the p-value could not be confirmed to be highly significant. Therefore, based on the biological information at rest, the experimental collaborators showing the same stress tendency were classified using cluster analysis. Statistical software SPSS was used for cluster analysis. Cluster analysis can be broadly divided into hierarchical and nonhierarchical methods. In this study, we calculated the dendrogram created by cluster analysis during multiple regression analysis, using Ward’s method, which is classified as a hierarchical method. Ward’s method is a grouping method that uses the sum of squared deviations. A cluster analysis was performed on the biological information of 25 collaborators at rest and with their eyes closed using Ward’s method, and a dendrogram was created. Arbitrary grouping was performed from the dendrogram, and the multiple regression equation for each group was calculated. Figure 10 shows the dendrogram of the cluster analysis results. The calculated dendrogram was divided into three groups, according to the broken lines in the figure. Figure 11 shows the LF/HF and LIR values in each group when the eyes were closed at rest. From the figure, the characteristics of Group A are LF/HF of 0.8 or less when the eyes are closed at rest, the characteristics of Group B are LF/HF of 0.9 or more when the eyes are closed at rest, and the characteristics of Group C are LF/HF of 1 or more when the eyes are closed at rest. Therefore, we compared the three groups.

6. A Method for Calculating the Influence of Biometric Information

To determine the influence of biological information on vibration of the groups divided by cluster analysis, we focus on Group A, which had the largest number of people. Principal component analysis, a statistical method, was performed with the aim of capturing the characteristics of the biometric information when it was vibrated. By performing principal component analysis, it is possible to extract multiple evaluation factors for biological information and to capture the characteristics of biological reactions to vibrations of experimental collaborators belonging to that group. In this study, principal component analysis was performed using SPSS statistical software and the principal components (1–6) were calculated. Table 2 shows the results of principal component analysis of the biometric information obtained under each experimental condition, focusing on Group A, which was grouped from Section 5. The results show that the biometric information affecting ride comfort is composed of six principal components. The first principal component, which has the highest contribution rate, has a high LF/HF factor loading that reflects the autonomic nervous system activity, which is the occupant’s biological information, and thus the autonomic nervous system activity is considered to have an effect on the vertical vibration. The second and the third principal components indicate that LIR and right cerebral blood flow, which reflect central nervous system activity, have an effect on the vertical vibration. The fourth principal component shows the cerebral blood flow activity when the subject was vibrated at 0.2–3 Hz. The fifth and sixth principal components show the LIR values at rest, except for the vibration condition. These results indicate that there are six evaluation factors in the evaluation of ride comfort for vertical vibration. Figure 12 shows the results of multiple regression analysis based on the calculated principal components. As a result of multiple regression analysis, the correlation R was 0.997 at 0.2–3 Hz, the correlation R was 0.952 at 4–8 Hz, and the correlation R was 0.891 at 8–20 Hz. However, it is not possible to control biometric information in real time because it is not known which biometric information becomes the coefficient.

7. Psychological State Prediction in Real Time

In Section 6, a multiple regression analysis was performed based on the evaluation factors calculated using principal component analysis. However, in this multiple regression equation, because it is not known which biometric information becomes the coefficient, real-time control cannot be performed using the biometric information, and it cannot be used in the system proposed by the authors. Therefore, multiple regression analysis was performed using the highest biometric information among the first principal components with the highest contribution rate. Table 3 lists the biometric information used. Figure 13 shows the relationship between the evaluation value of the comfort level obtained from the VAS method and the predicted comfort level determined via multiple regression analysis. The correlation between the comfort rating obtained from the VAS method at 0.2–3 Hz and the predicted comfort R was 0.981, and the correlation between the comfort rating obtained from the VAS method at 4–8 Hz and the predicted comfort R was 0.983. At 8–20 Hz, the correlation R between the comfort evaluation value obtained from the VAS method and the predicted comfort was 0.911. p-values of conditions were p = 0.037 at 0.2–3 Hz, p = 0.033 at 4–8 Hz, and p = 0.292 at 8–20 Hz. Compared to the results obtained in Section 4 (Figure 9), where no principal component analysis was conducted, Figure 12 shows a higher correlation between the predicted subjective evaluation calculated by multiple regression analysis using the biometric information obtained from the principal component analysis and the measured subjective evaluation obtained from the experiment. In addition, significant differences that could not be confirmed in Section 4 were also confirmed. These results indicate that the use of biometric information obtained from the principal component analysis after grouping the subjects using their biometric information prior to the experiment can confirm high predictions and significant differences.

8. Results and Discussion

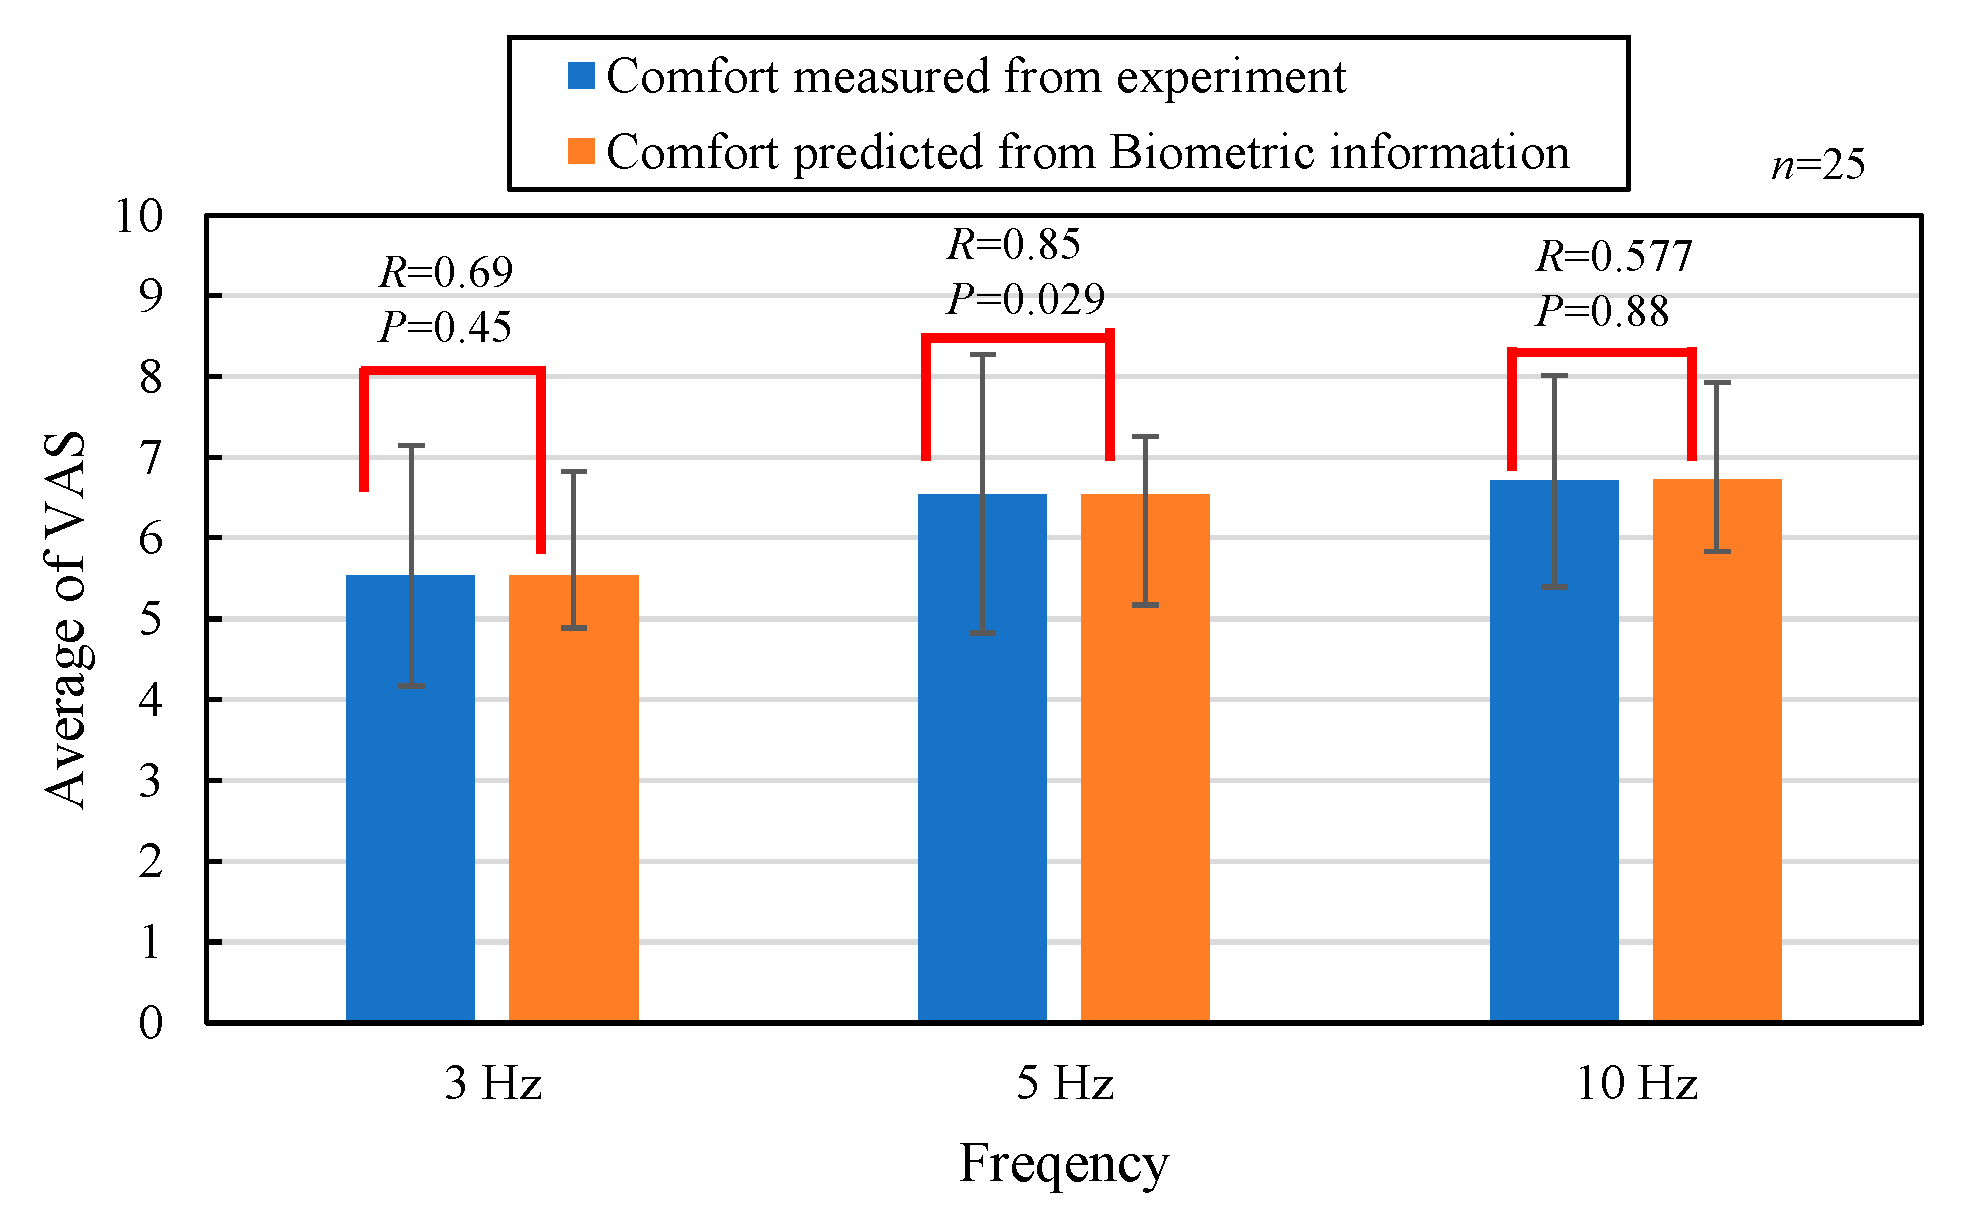
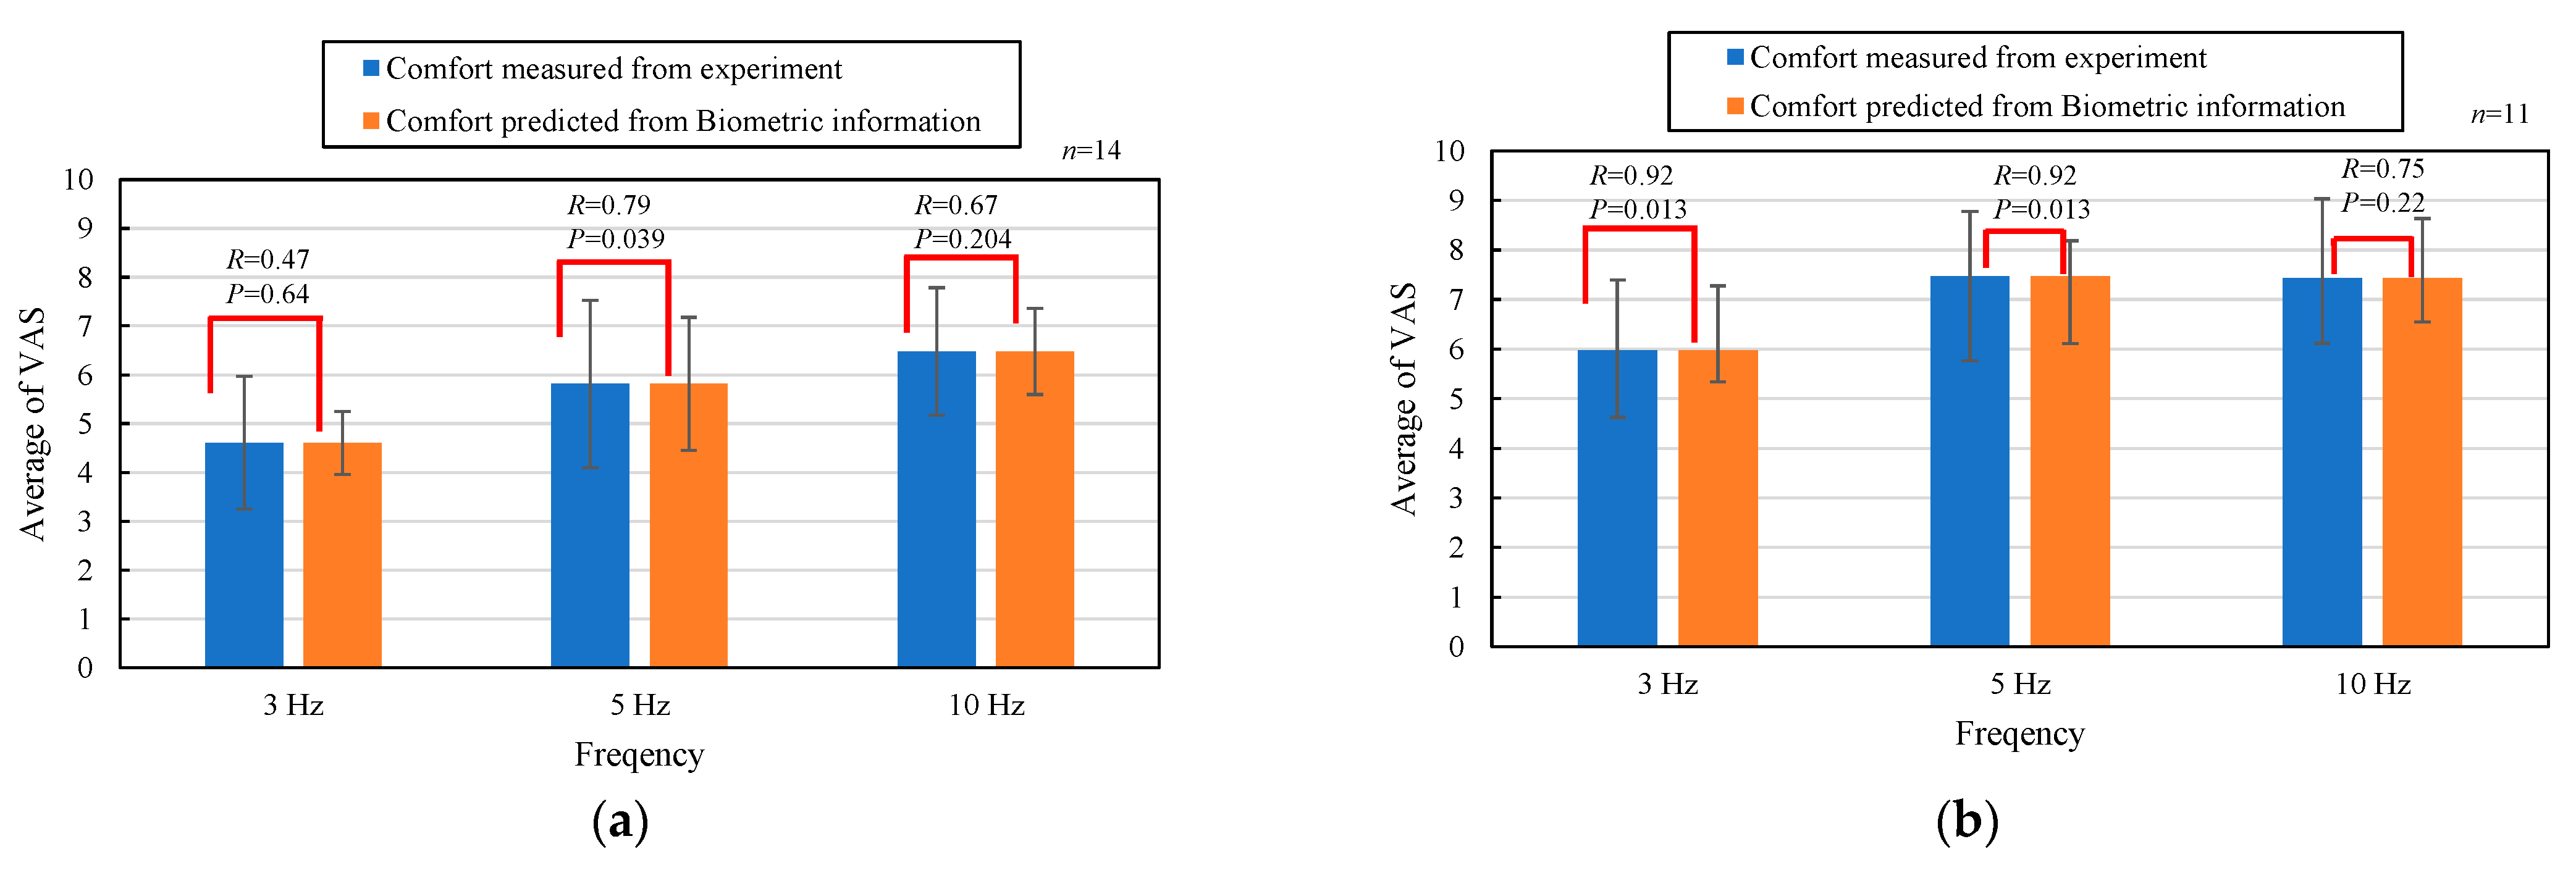
8.1. Prediction of Ride Quality by Composite Frequencies

In Section 4, the comfort level was calculated using a multiple regression analysis of the biometric information of 25 experimental collaborators. However, the significance of the p-value could not be confirmed under each condition. In Section 5, the group was divided by experimental collaborators who showed similar characteristics of biometric information when their eyes were closed at rest. In Section 6, after grouping, we focused on a group with many people, performed principal component analysis, and extracted multiple evaluation factors for the biometric information. We performed a multiple regression analysis based on the calculated principal components, but when we tried to predict the psychological state based on the multiple regression equation, we could not control it in real time because we did not know which biometric information would be the coefficient. In Section 7, to solve the problems in Section 6, multiple regression analysis was performed using the biometric information of the first principal component, which has a high contribution rate. A high correlation was confirmed for each condition. However, in the high-frequency band of 8–20 Hz, a value higher than the p-value, which is considered significant, was confirmed. Under the vibration conditions of 0.2–3 Hz and 4–8 Hz, the correlation is high, and it can be evaluated as a superior formula from the p-value; and, it is considered that the psychological state can be accurately estimated in the corresponding frequency band. At 8–20 Hz, the correlation was high, but the p-value was not a dominant equation. The reason the p-value was high and the equation was not dominant at 8–20 Hz is that the experimental collaborators concentrated on the answers they evaluated as unpleasant at that frequency. Therefore, it is conceivable to control high-frequency components, such as 8–20 Hz, from the beginning so that they are not input to the occupants.

8.2. Study on Estimation of Ride Quality by Single Frequency

Here, we describe an experiment in which the vibration input to the occupant is experimentally subdivided, and vibration is performed at a single frequency with a different ride comfort feeling. The collaborators experienced vibration at 3, 5, and 10 Hz. Figure 14 shows the evaluation values of comfort obtained by the VAS method for each frequency of 25 people and the average and standard error of the estimated comfort. As shown in the figure, the correlation between each vibration condition increased. However, because the significance probability is high, this result can be considered to have occurred by chance. Therefore, grouping was performed as described in Section 5. Two arbitrary groups can be divided, and Figure 15 shows the evaluation value of the comfort level acquired by the VAS method for each group and the average and standard error of the estimated comfort level. As shown in the figure, the error was smaller than the standard error before grouping, and the correlation was high. In addition, the p-value was also low, which is probably not accidental; thus, the comfort level can be estimated. From these results, it was confirmed that the comfort level of the occupants can be estimated even in a vibration environment that is different from that of actual driving. This result indicates that only specific frequency components can predict ride comfort, and it is expected to be applied to control to remove only frequencies that occupants find unpleasant.

9. Conclusions

The purpose of this study was to estimate the psychological state of an occupant based on biometric information. The comfort levels of the 25 experimental collaborators differed significantly, even within the same frequency band. As a result of estimating the comfort level of all collaborators from the biological information, the correlation was high, but the multiple regression equation was not significant. Therefore, using cluster analysis and principal component analysis, we gathered experimental collaborators with similar stress tendencies. It has become possible to estimate ride quality using a single multiple regression equation, even for those who have different subjective evaluations of comfort with respect to vibration. Based on the above finding, we believe that the ride-quality estimation method used in this study can be applied to a system that optimizes the ride quality of occupants while driving. In future studies, we will construct a control using the results of vibrations that include multiple frequencies. Moreover, the biometric response will be checked under different excitation conditions in order to construct a more accurate prediction equation. In addition, we plan to study the control of reducing specific frequencies that occupants find uncomfortable by applying the biometric information of the occupants.

Author Contributions

K.I., summarized this study and wrote the manuscript. J.K., D.U. and K.O., carried out the experiment. A.E., T.K., H.K. and T.N. were experimental advisors for this experiment. All authors have read and agreed to the published version of the manuscript.

Funding

This work was supported by JSPS KAKENHI Grant Number 18K04058.

Institutional Review Board Statement

This experiment was approved by the Ethics Committee of Tokai University’s “Research targeted humans”.

Informed Consent Statement

Informed consent was obtained from all subjects involved in the study.

Data Availability Statement

Not applicable.

Conflicts of Interest

The authors declare no conflict of interest.

References

  1. Infrastructure and Transport Urban Bureau/Automotive Bureau. Guidelines for Introducing Ultra-Small Mobility-Toward the Realization of a New Social Life by Developing and Utilizing New Mobility; Ministry of Land, Infrastructure, Transport and Tourism: Tokyo, Japan, 2012. [Google Scholar]
  2. Abe, Y.; Arai, S.; Oshinoya, Y.; Ishibashi, K. Ride quality improvement by active seat suspension (basic study using small electric vehicle). Proc. Annu. Meet. Japan Soc. Mech. Eng. 2002, 7, 175–176. [Google Scholar]
  3. Ikeda, K.; Endo, A.; Minowa, R.; Narita, T.; Kato, H. Ride Comfort Control System Considering Physiological and Psychological Characteristics: Effect of Masking on Vertical Vibration on Passengers. Actuators 2018, 7, 42. [Google Scholar] [CrossRef] [Green Version]
  4. Huang, K.; Yu, F.; Zhang, Y. Active controller design for an electromagnetic energy-regenerative suspension. Int. J. Automot. Technol. 2011, 12, 877–885. [Google Scholar] [CrossRef]
  5. Kawakita, Y.; Kotake, S. Active sampled-data controlled suspension in automobile with vibration manipulation functions—Intermittent desired elongation control of actuator. Int. J. Automot. Eng. 2016, 7, 77–84. [Google Scholar] [CrossRef] [Green Version]
  6. Wang, J.; Wilson, D.A.; Xu, W.; Crolla, D.A. Active suspension control to improve vehicle ride and steady-state handling. In Proceedings of the IEEE Conference on Decision and Control, the European Control Conference, Seville, Spain, 15 December 2005. [Google Scholar]
  7. Shukla, P.; Ghodki, D.; Manjarekar, N.S.; Singru, P.M. A study of H infinity and H2 synthesis for active vibration control. IFAC-PapersOnLine 2016, 49, 623–628. [Google Scholar] [CrossRef]
  8. Weichao, S.; Jinfu, L.; Huijun, G. Vibration control for active seat suspension systems via dynamic output feedback with limited frequency characteristic. Mechatronics 2011, 21, 250–260. [Google Scholar]
  9. Cheok, C.K.; Hu, X.H.; Loh, L.K. Discrete-time frequency-shaping parametric LQ control with application to active seat suspension control. IEEE Trans. Ind. Electron. 1989, 36, 383–390. [Google Scholar] [CrossRef]
  10. Miaomiao, M.; Hong, C.; Xiangjie, L. Robust H-infinity control for constrained uncertain systems and its application to active suspension. J. Control Theory Appl. 2012, 10, 470–476. [Google Scholar]
  11. Yanqiu, C.; Pengyun, S.; Jiye, Z.; Keyue, Z. Robust controller design for active suspension based on µ-synthesis. In Proceedings of the International Conference on Electronic & Mechanical Engineering and Information Technology, Harbin, China, 12–14 August 2011; pp. 3229–3233. [Google Scholar]
  12. Iljoong, Y.; Ejaz, A. Anti-jerk optimal preview control strategy to enhance performance of active and semi-active suspension systems. Electronics 2022, 11, 1657. [Google Scholar] [CrossRef]
  13. Niana, Z.; Yang, H.; Yang, W.; Jieshu, W. Active suspension control based on multi-agent predictive algorithm. In Proceedings of the 2022 4th CAA International Conference on Vehicular Control, Hangzhou, China, 18–20 December 2022. [Google Scholar]
  14. Jian, W.; Hongliang, Z.; Zhiyuan, L.; Mingqin, G. Ride comfort optimization vai speed planning and preview semi-active suspension control for autonomous vehicle on uneven roads. IEEE Trans. Veh. Technol. 2020, 69, 8343–8355. [Google Scholar]
  15. Vidya, V.; Dharmana, M.M. Model reference based intelligent control of an active suspension system for vehicles. In Proceedings of the 2017 International Conference on Circuits Power and Computing Technologies, Kollam, India, 20–21 April 2017. [Google Scholar]
  16. Johnson, M.J.; Chahal, T.; Stinchcombe, A.; Mullen, N. Physiological responses to simulated and on-road driving. Int. J. Psychophysiol. 2011, 81, 203–208. [Google Scholar] [CrossRef] [PubMed]
  17. Beggiato, M.; Hartwich, F.; Krems, J. Physiological correlates of discomfort in automated driving. Transp. Res. Part F 2019, 66, 445–458. [Google Scholar] [CrossRef]
  18. Dillen, N.; Ilievski, M.; Law, E.; Nacke, L.E.; Czarnecki, K.; Schneider, O. Keep clam and ride along: Passenger comfort and anxiety as physiological responses to autonomous driving styles. In Proceedings of the CHI Conference on Human Factors in Computing Systems (CHI’ 20), Honolulu, HI, USA, 25–30 April 2020; ACM: New York, NY, USA, 2020. [Google Scholar]
  19. Sekiguchi, E.; Kubota, K.; Nakamura, S.; Makita, K.; Tanaka, T. Toward Estimation of abnormal brake in autonomous vehicles from electroencephalogram and heart rate interval. In Proceedings of the APSIPA Annual Summit and Conference 2021, Tokyo, Japan, 14–17 December 2021. [Google Scholar]
  20. Perello-March, J.R.; Burns, C.G.; Birrell, S.A.; Woodman, R.; Elliott, M. Physiological measures of risk perception in highly automated driving. IEEE Trans. Intell. Transp. Syst. 2022, 22, 4811–4822. [Google Scholar] [CrossRef]
  21. Kato, H.; Ishida, K.; Masuno, M.; Narita, M. Proposal of Ride Comfort Control System by Estimating the Psychological State of Crew. Proc. Jpn. Soc. Mech. Eng. 2015, 81, 832. [Google Scholar]
  22. Tanida, M.; Katsuyama, M.; Sakatani, K. Effects of fragrance administration on stress-induced prefrontal cortex activity and sebum secretion in the facial skin. Neurosci. Lett. 2008, 432, 157–161. [Google Scholar] [CrossRef] [PubMed]
  23. Takei, K.; Ishiguro, R. Ride quality evaluation based on sensory evaluation of occupants. RD Rev. Toyota CRDL 1995, 30, 47–56. [Google Scholar]
Figure 1. Proposed ride control system.
Applsci 12 07425 g001
Figure 2. Electrocardiogram-based measurement.
Applsci 12 07425 g002
Figure 3. Cerebral blood flow measuring device. (a) Installation drawing; (b) Backside.
Applsci 12 07425 g003
Figure 4. Principle of cerebral blood flow meter measurement.
Applsci 12 07425 g004
Figure 5. Questionnaire of experiment.
Applsci 12 07425 g005
Figure 6. Ultra-compact vehicle and active seat suspension. (a) Ultra-compact vehicle; (b) Active seat suspension.
Applsci 12 07425 g006
Figure 7. Experimental setup.
Applsci 12 07425 g007
Figure 8. Experimental procedure.
Applsci 12 07425 g008
Figure 9. Results of multiple regression analysis. (a) 0.2–3 Hz; (b) 4–8 Hz; (c) 8–20 Hz.
Applsci 12 07425 g009
Figure 10. Grouping based on the characteristics of biological information.
Applsci 12 07425 g010
Figure 11. Cluster division based on biological information when the eyes are closed at rest. (a) Group A; (b) Group B; (c) Group C.
Applsci 12 07425 g011
Figure 12. Results of multiple regression analyses. (a) 0.2–3 Hz; (b) 4–8 Hz; (c) 8–20 Hz.
Applsci 12 07425 g012
Figure 13. Results of multiple regression analysis. (a) 0.2–3 Hz; (b) 4–8 Hz; (c) 8–20 Hz.
Applsci 12 07425 g013
Figure 14. Average and standard deviation of VAS for 25 participants.
Applsci 12 07425 g014
Figure 15. Average and standard deviation of VAS for each group. (a) Group A; (b) Group B.
Applsci 12 07425 g015
Table 1. Explanatory variables and their values.
iExplanatory VariableVibration Condition
0.2–3 Hz4–8 Hz8–20 Hz
bi
0Constant2.6924.36.005
1LF/HF (0.2–3 Hz)−0.0040.8011.872
2LF/HF (4–8 Hz)2.614−3.156−1.822
3LF/HF (8–20 Hz)−1.8942.0371.29
4LIR (0.2–3 Hz)−1.0560.322−2.244
5LIR (4–8 Hz)04620.2350.148
6LIR (8–20 Hz)0.504−0.3321.531
7Right cerebral blood flow (0.2–3 Hz)0.665−0.1481.838
8Right cerebral blood flow (4–8 Hz)6.441−3.841−2.617
9Right cerebral blood flow (8–20 Hz)−3.6953.061−1.958
10LF/HF normalization on eyes closed state at resting time (0.2–3 Hz)1.423−0.0522.297
11LF/HF normalization on eyes closed state at resting time (4–8 Hz)−0.5520.082−0.162
12LF/HF normalization on eyes closed state at resting time (8–20 Hz)−0.3250.081−1.396
13LIR normalization on eyes closed state at resting time (0.2–3 Hz)0.2120.0310.045
14LIR normalization on eyes closed state at resting time (4–8 Hz)−0.4980.1050.012
15LIR normalization on eyes closed state at resting time (8–20 Hz)0.475−0.1062.247
16LF/HF (Rest time)2.93−0.749−1.606
17LIR (Rest time)1.055−0.006−0.348
Table 2. Results of principal component analysis.
Biological InformationFactor
1st2nd3rd4th5th6th
LF/HF (0.2–3 Hz)0.9370.12−0.266−0.11−0.0740.089
LF/HF normalization on eyes closed state at resting time (0.2–3 Hz)0.932−0.034−0.251−0.069−0.0380.136
LF/HF (4–8 Hz)0.912−0.1750.115−0.237−0.093−0.193
LF/HF normalization on eyes closed state at resting time (4–8 Hz)0.807−0.5160.181−0.1250.0770.006
LF/HF (8–20 Hz)0.725−0.4040.4580.0880.197−0.209
LF/HF (Rest time)0.7140.5790.036−0.040.264−0.071
Right cerebral blood flow (4–8 Hz)−0.6810.0150.446−0.2890.3720.14
LF/HF normalization on eyes closed state at resting time (8–20 Hz)0.397−0.7450.3670.2230.198−0.073
LIR (4–8 Hz)0.5280.678−0.2380.087−0.1890.111
LIR (Rest time)0.4610.6380.2850.172−0.398−0.129
LIR normalization on eyes closed state at resting time (0.2–3 Hz)−0.2240.596−0.0370.4860.444−0.134
LIR normalization on eyes closed state at resting time (8–20 Hz)−0.094−0.4810.2490.279−0.4350.172
Right cerebral blood flow (8–20 Hz)0.0790.5120.712−0.140.104−0.168
Right cerebral blood flow (0.2–3 Hz)−0.2510.1550.642−0.094−0.3410.494
LIR (8–20 Hz)0.4450.3280.6110.2470.1170.243
LIR (0.2–3 Hz)−0.016−0.199−0.0210.878−0.09−0.069
LIR normalization on eyes closed state at resting time (4–8 Hz)0.447−0.07−0.280.1460.4040.678
Accumulated34.7%53.9%67.4%76.0%83.2%89.1%
Table 3. Explanatory variables and their values.
iExplanatory VariableVibration Condition
0.2–3 Hz4–8 Hz8–20 Hz
bi
0Constant12.00.36713.3
1LF/HF (0.2–3 Hz)−0.123−0.2110.640
2LF/HF normalization on eyes closed state at resting time (0.2–3 Hz)1.949−1.735−2.341
3LF/HF (4–8 Hz)1.775−1.2603.869
4LF/HF normalization on eyes closed state at resting time (4–8 Hz)−0.388−3.845−5.852
5LF/HF (8–20 Hz)−11.3425.260−12.701
6LF/HF (Rest time)−1.6200.8711.145
7Right cerebral blood flow (4–8 Hz)0.945−0.201−2.249
Publisher’s Note: MDPI stays neutral with regard to jurisdictional claims in published maps and institutional affiliations.

