
Measurements of the Magnetic Field Variations Related with the Size of V-Shaped Notches in Steel Pipes

 , ,
, ,  , and
, and 
Abstract
1. Introduction
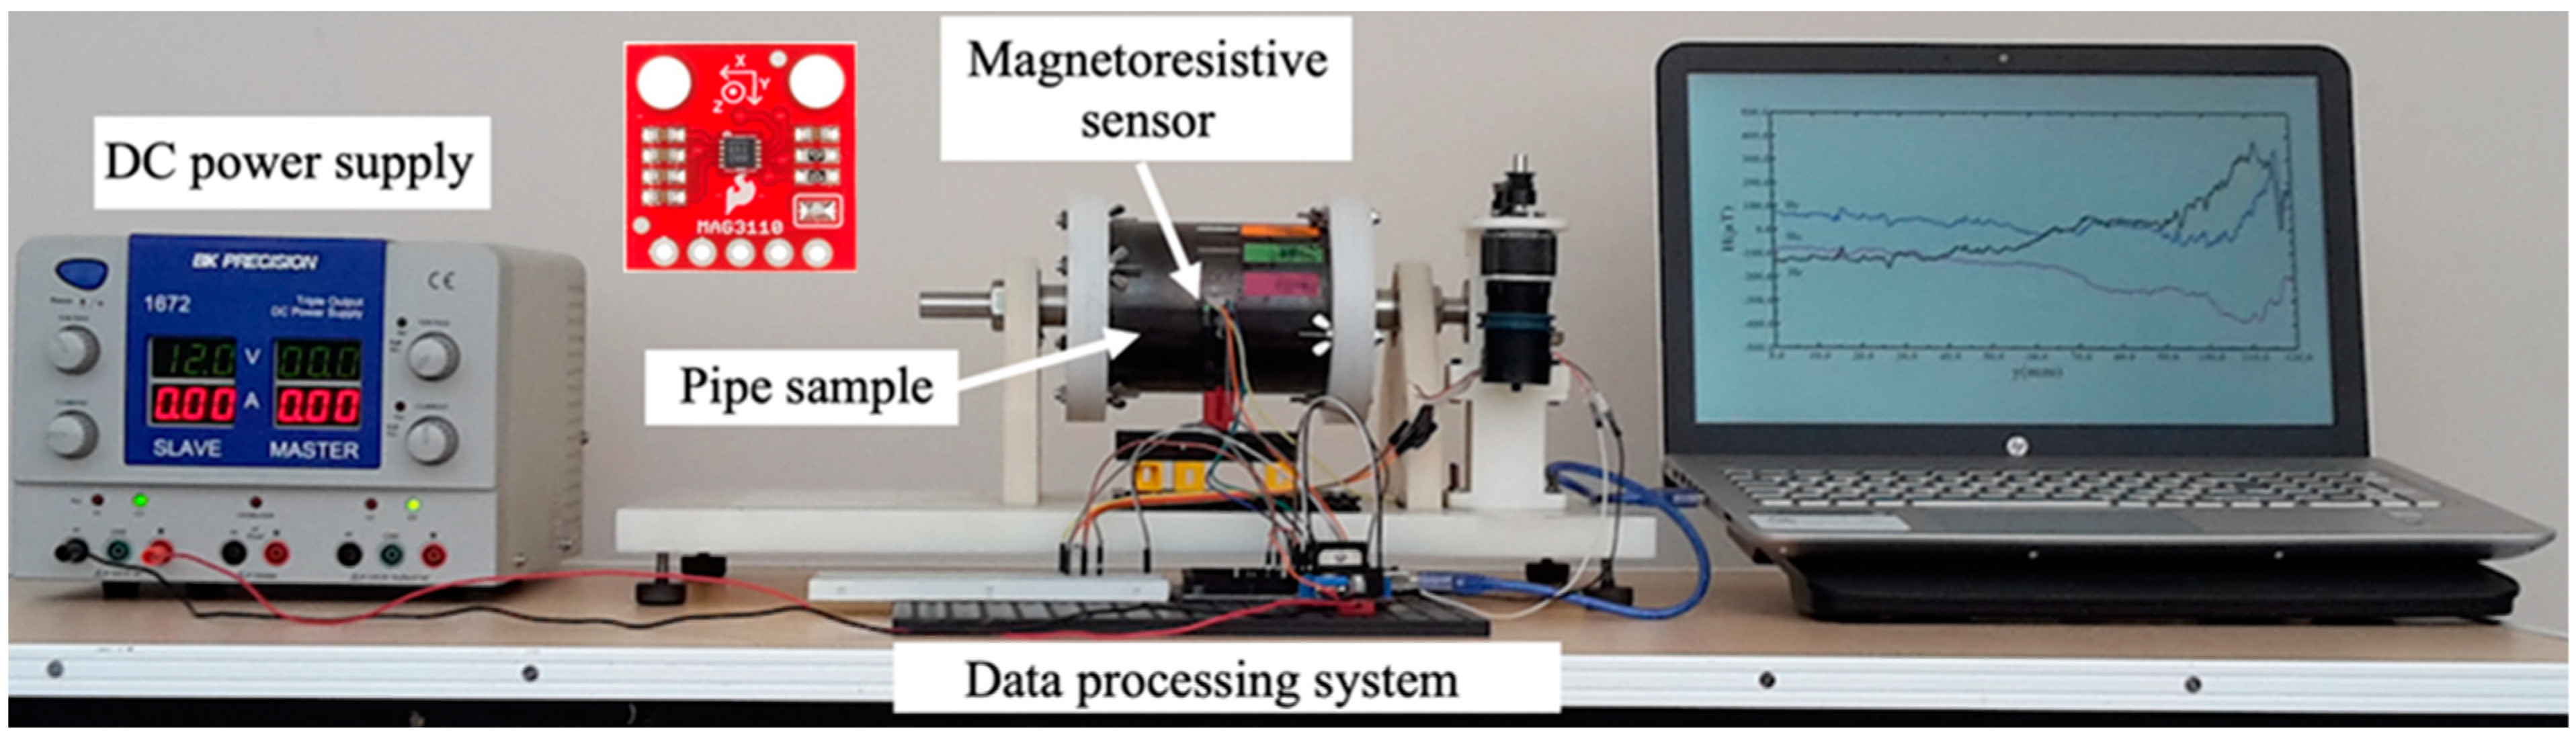
2. Materials and Methods
3. Results and Discussion
4. Conclusions
Author Contributions
Funding
Institutional Review Board Statement
Informed Consent Statement
Data Availability Statement
Acknowledgments
Conflicts of Interest
References
- Mudugamuwa, A.; Jayasundara, C.; Baokun, H.; Amarasinghe, R. Development of a Robotic System with Stand-Alone Monocular Vision System for Eco-friendly Defect Detection in Oil Transportation Pipelines. In Sustainable Design and Manufacturing; Smart Innovation, Systems and Technologies; Scholz, S.G., Howlett, R.J., Setchi, R., Eds.; Springer: Singapore, 2021; Volume 200. [Google Scholar] [CrossRef]
- Dai, L.S.; Feng, Q.S.; Xiang, X.Q.; Sutherland, J.; Wang, T.; Wang, D.P.; Wang, Z.J. Application of USCCD on girth weld defect detection of oil pipelines. Appl. Sci. 2020, 10, 2736. [Google Scholar] [CrossRef]
- Mevissen, F.; Meo, M. A Review of NDT/Structural Health Monitoring Techniques for Hot Gas Components in Gas Turbines. Sensors 2019, 19, 711. [Google Scholar] [CrossRef] [PubMed]
- Masri, Y.E.; Rakha, T. A scoping review of non-destructive testing (NDT) techniques in building performance diagnostic inspections. Constr. Build. Mater. 2020, 265, 120542. [Google Scholar] [CrossRef]
- Piri, B.; Amini, R.; Asadinia, E.; Vardak, S.; Mehdilouee, R.; Mojarrad, A. Investigation of failure mechanisms and remaining life prediction of firewater pipelines used in industrial applications. Eng. Fail. Anal. 2021, 124, 105301. [Google Scholar] [CrossRef]
- Lorenzo, C.; Janko, S.; Gianluca, R.; Miha, B. Thermoelasticity-based modal damage identification. Inter. J. Fatigue 2020, 137, 105661. [Google Scholar] [CrossRef]
- Yan, W.-J.; Chronopoulos, D.; Papadimitriou, C.; Cantero-Chinchilla, S.; Zhu, G.-S. Bayesian inference for damage identification based on analytical probabilistic model of scattering coefficient estimators and ultrafast wave scattering simulation scheme. J. Sound Vib. 2020, 468, 115083. [Google Scholar] [CrossRef]
- Dehui, W.; Zhitian, L.; Xiaohong, W.; Lingxin, S. Composite magnetic flux leakage detection method for pipelines using alternating magnetic field excitation. NDT E Inter. 2017, 91, 148–155. [Google Scholar] [CrossRef]
- Gholizadeh, S. A review of non-destructive testing methods of composite materials. Procedia Struct. Integr. 2016, 1, 50–57. [Google Scholar] [CrossRef]
- Liu, J.; Xu, G.; Gu, X.; Zhou, G. Ultrasonic test of resistance spot welds based on wavelet package analysis. Ultrasonics 2015, 56, 557–565. [Google Scholar] [CrossRef] [PubMed]
- Purna-Chandra-Rao, B. Non-destructive Testing and Damage Detection. In Aerospace Materials and Material Technologies; Prasad, N., Wanhill, R., Eds.; Indian Institute of Metals Series; Springer: Singapore, 2017; Volume 2, pp. 209–218. ISBN 978-981-10-2143-5. [Google Scholar] [CrossRef]
- García-Martín, J.; Gómez-Gil, J.; Vázquez-Sánchez, E. Non-destructive techniques based on Eddy current testing. Sensors 2011, 11, 2525–2565. [Google Scholar] [CrossRef] [PubMed]
- Zhang, W.; Shi, Y.; Li, Y.; Luo, Q. A study of quantifying thickness of ferromagnetic pipes based on remote field Eddy current testing. Sensors 2018, 18, 2769. [Google Scholar] [CrossRef] [PubMed]
- Abdalla, A.; Alo, K.; Paw, J.K.S.; Rifai, D.; Faraj, M.A. A novel Eddy current testing error compensation technique based on Mamdani-type fuzzy coupled differential and absolute probes. Sensors 2018, 18, 2108. [Google Scholar] [CrossRef] [PubMed]
- Senck, S.; Scheerer, M.; Revol, V.; Plank, B.; Hannesschläger, C.; Usenbauer, C.; Kastner, J. Microcrack characterization in loaded CFRP laminates using quantitative two- and three-dimensional X-ray dark-field imaging. Compos. Part A Appl. Sci. Manuf. 2018, 115, 206–214. [Google Scholar] [CrossRef]
- Yang, R.; He, Y.; Zhang, H. Progress and trends in nondestructive testing and evaluation for wind turbine composite blade. Renew. Sust. Energ. Rev. 2016, 60, 1225–1250. [Google Scholar] [CrossRef]
- Lu, Q.Y.; Wong, C.H. Applications of non-destructive testing techniques for post-process control of additively manufactured parts. Virtual Phys. Prototyp. 2017, 12, 301–321. [Google Scholar] [CrossRef]
- Antipov, A.G.; Markov, A.A. 3D simulation and experiment on high speed rail MFL inspection. NDT E Int. 2018, 98, 177–185. [Google Scholar] [CrossRef]
- Witek, M. Validation of in-line inspection data quality and impact on steel pipeline diagnostic intervals. J. Nat. Gas Sci. Eng. 2018, 56, 121–133. [Google Scholar] [CrossRef]
- Xu, K.; Qiu, X.; Tian, X. Theoretical investigation of metal magnetic memory testing technique for detection of magnetic flux leakage signals from buried defect. Nondestruct. Test. Eval. 2018, 33, 45–55. [Google Scholar] [CrossRef]
- Dubov, A.; Kolokolnikov, S. Assessment of the material state of oil and gas pipeline based on the metal magnetic memory method. Welding World 2012, 56, 11–19. [Google Scholar] [CrossRef]
- Li, Y.; Zeng, X.; Wei, L.; Wan, Q. Characterizations of damage induced magnetization for X80 pipeline steel by metal magnetic memory testing. Inter. J. Appl. Electromagn. Mech. 2017, 1, 23–35. [Google Scholar] [CrossRef]
- Pengpeng, S.; Ke, J.; Xiaojing, Z. A magnetomechanical model for the magnetic memory method. Int. J. Mech. Sci. 2017, 124–125, 229–241. [Google Scholar] [CrossRef]
- Liu, B.; Fu, P.; Li, R.; He, P.; Dong, S. Influence of crack size on stress evaluation of ferromagnetic low alloy steel with metal Magnetic Memory Technology. Materials 2019, 12, 4028. [Google Scholar] [CrossRef] [PubMed]
- Su, S.; Zhao, X.; Wang, W.; Zhang, X. Metal magnetic memory inspection of Q345 steel specimens with butt weld in tensile and bending test. J. Nondestruct. Eval. 2019, 38, 64. [Google Scholar] [CrossRef]
- Shi, P.; Su, S.; Chen, Z. Overview of researches on the nondestructive testing method of metal magnetic memory: Status and challenges. J. Nondest. Eval. 2020, 39, 43. [Google Scholar] [CrossRef]
- Villegas-Saucillo, J.J. Detección de Defectos Geométricos en Tubos Ferromagnéticos Mediante Procesamiento Digital de Señales con el Método de memoria Magnética. Ph.D. Thesis, Instituto Tecnológico de Celaya, Guanajuato, Mexico, 2019. [Google Scholar]


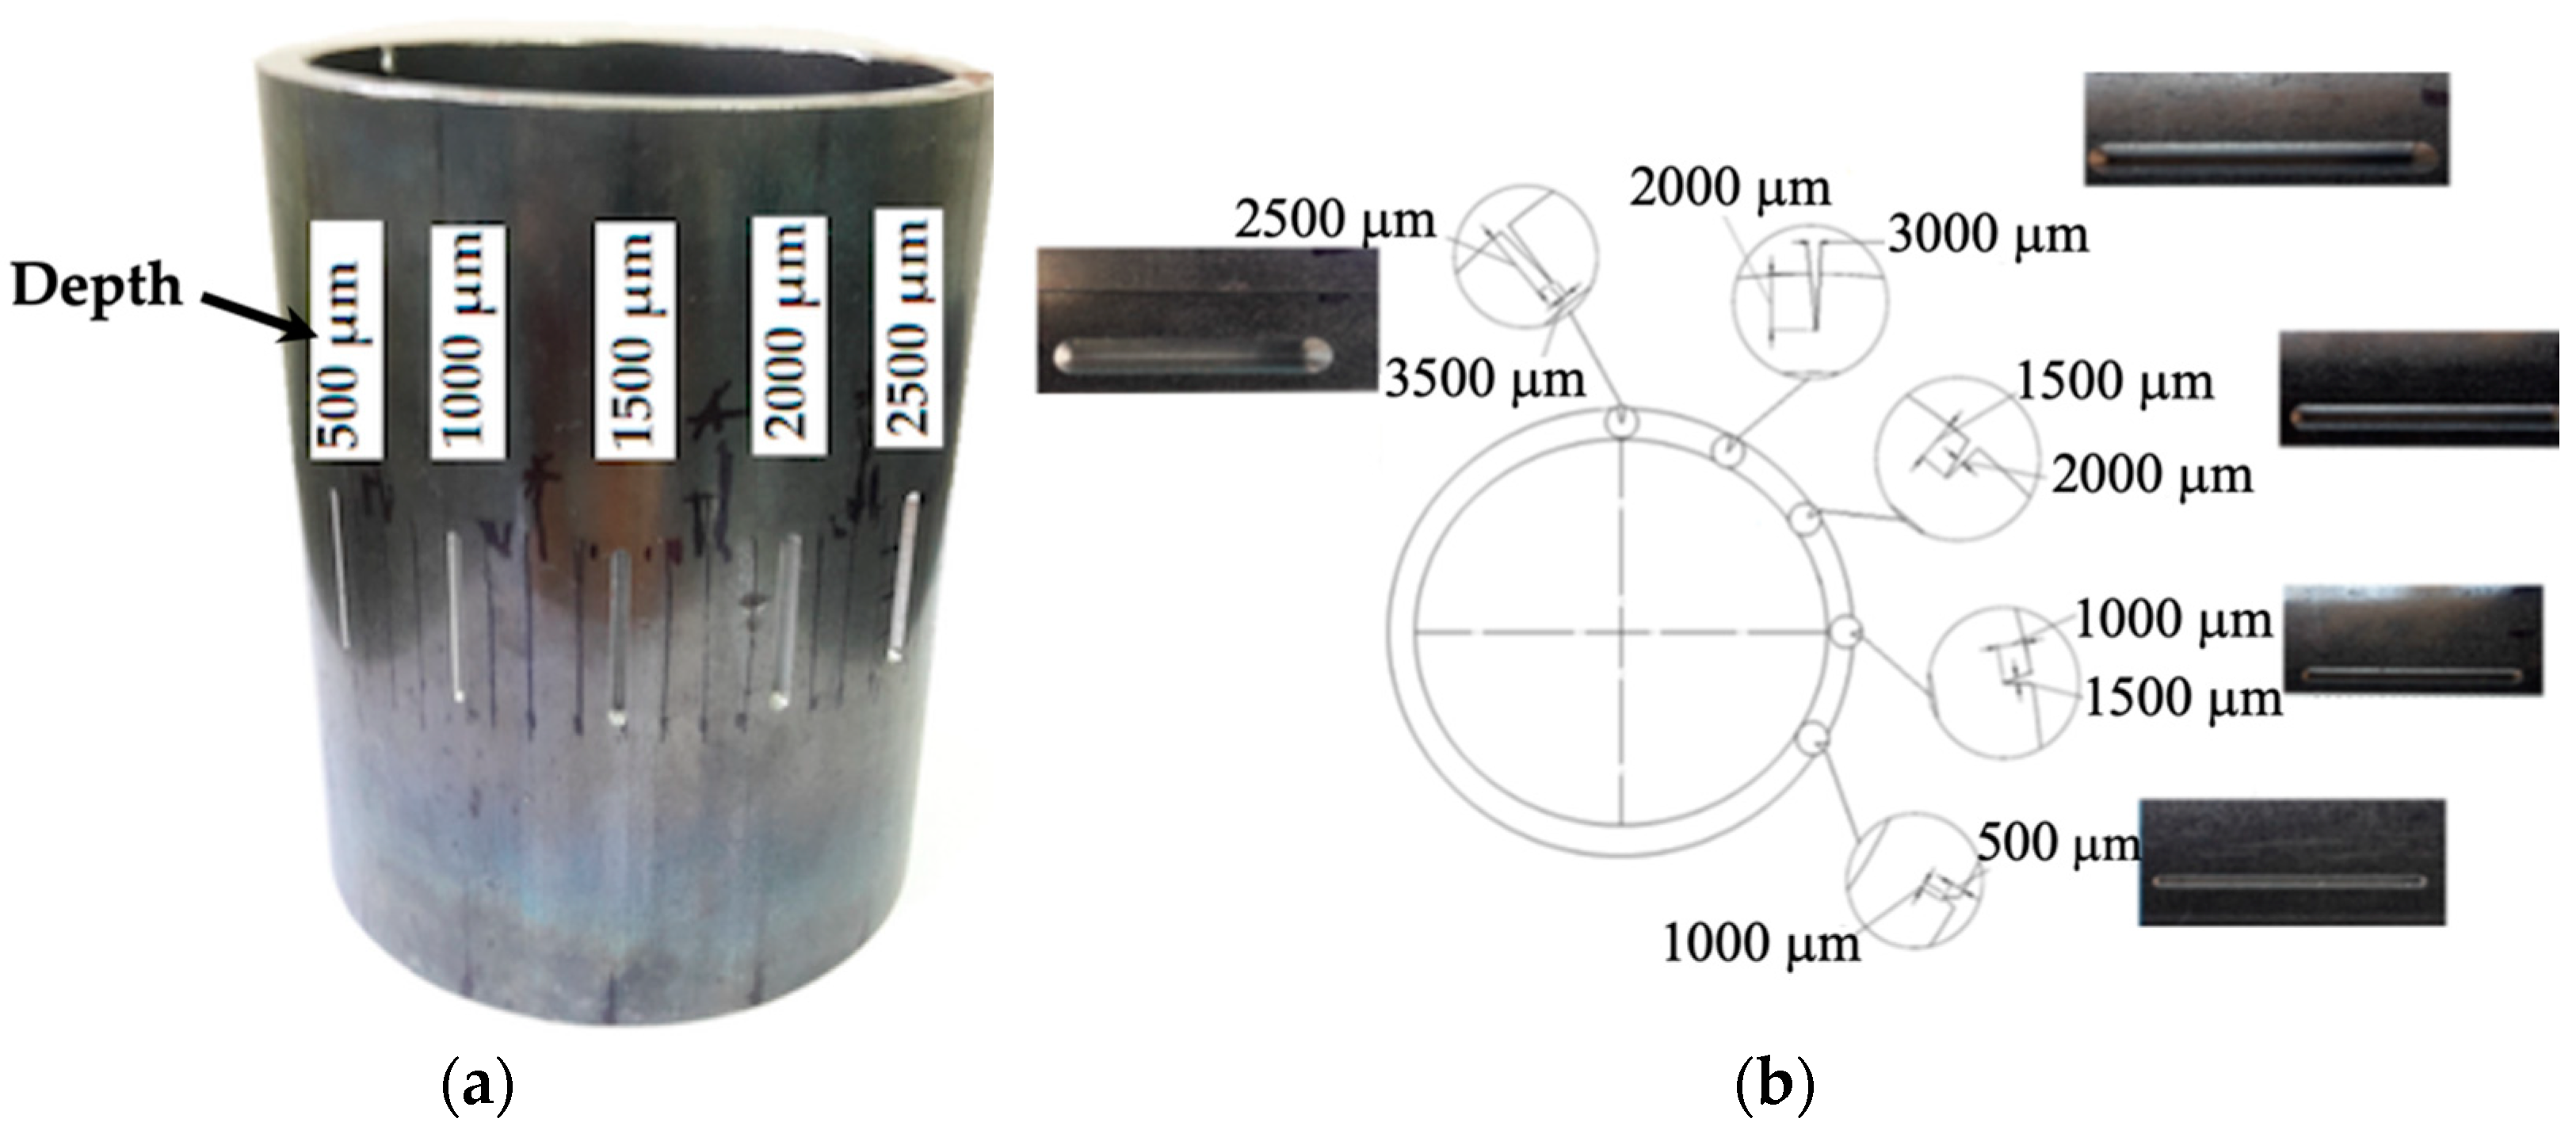
| V-Notch Defect | Width (µm) | Depth (µm) |
|---|---|---|
| S1 | 1000.0 | 500.0 |
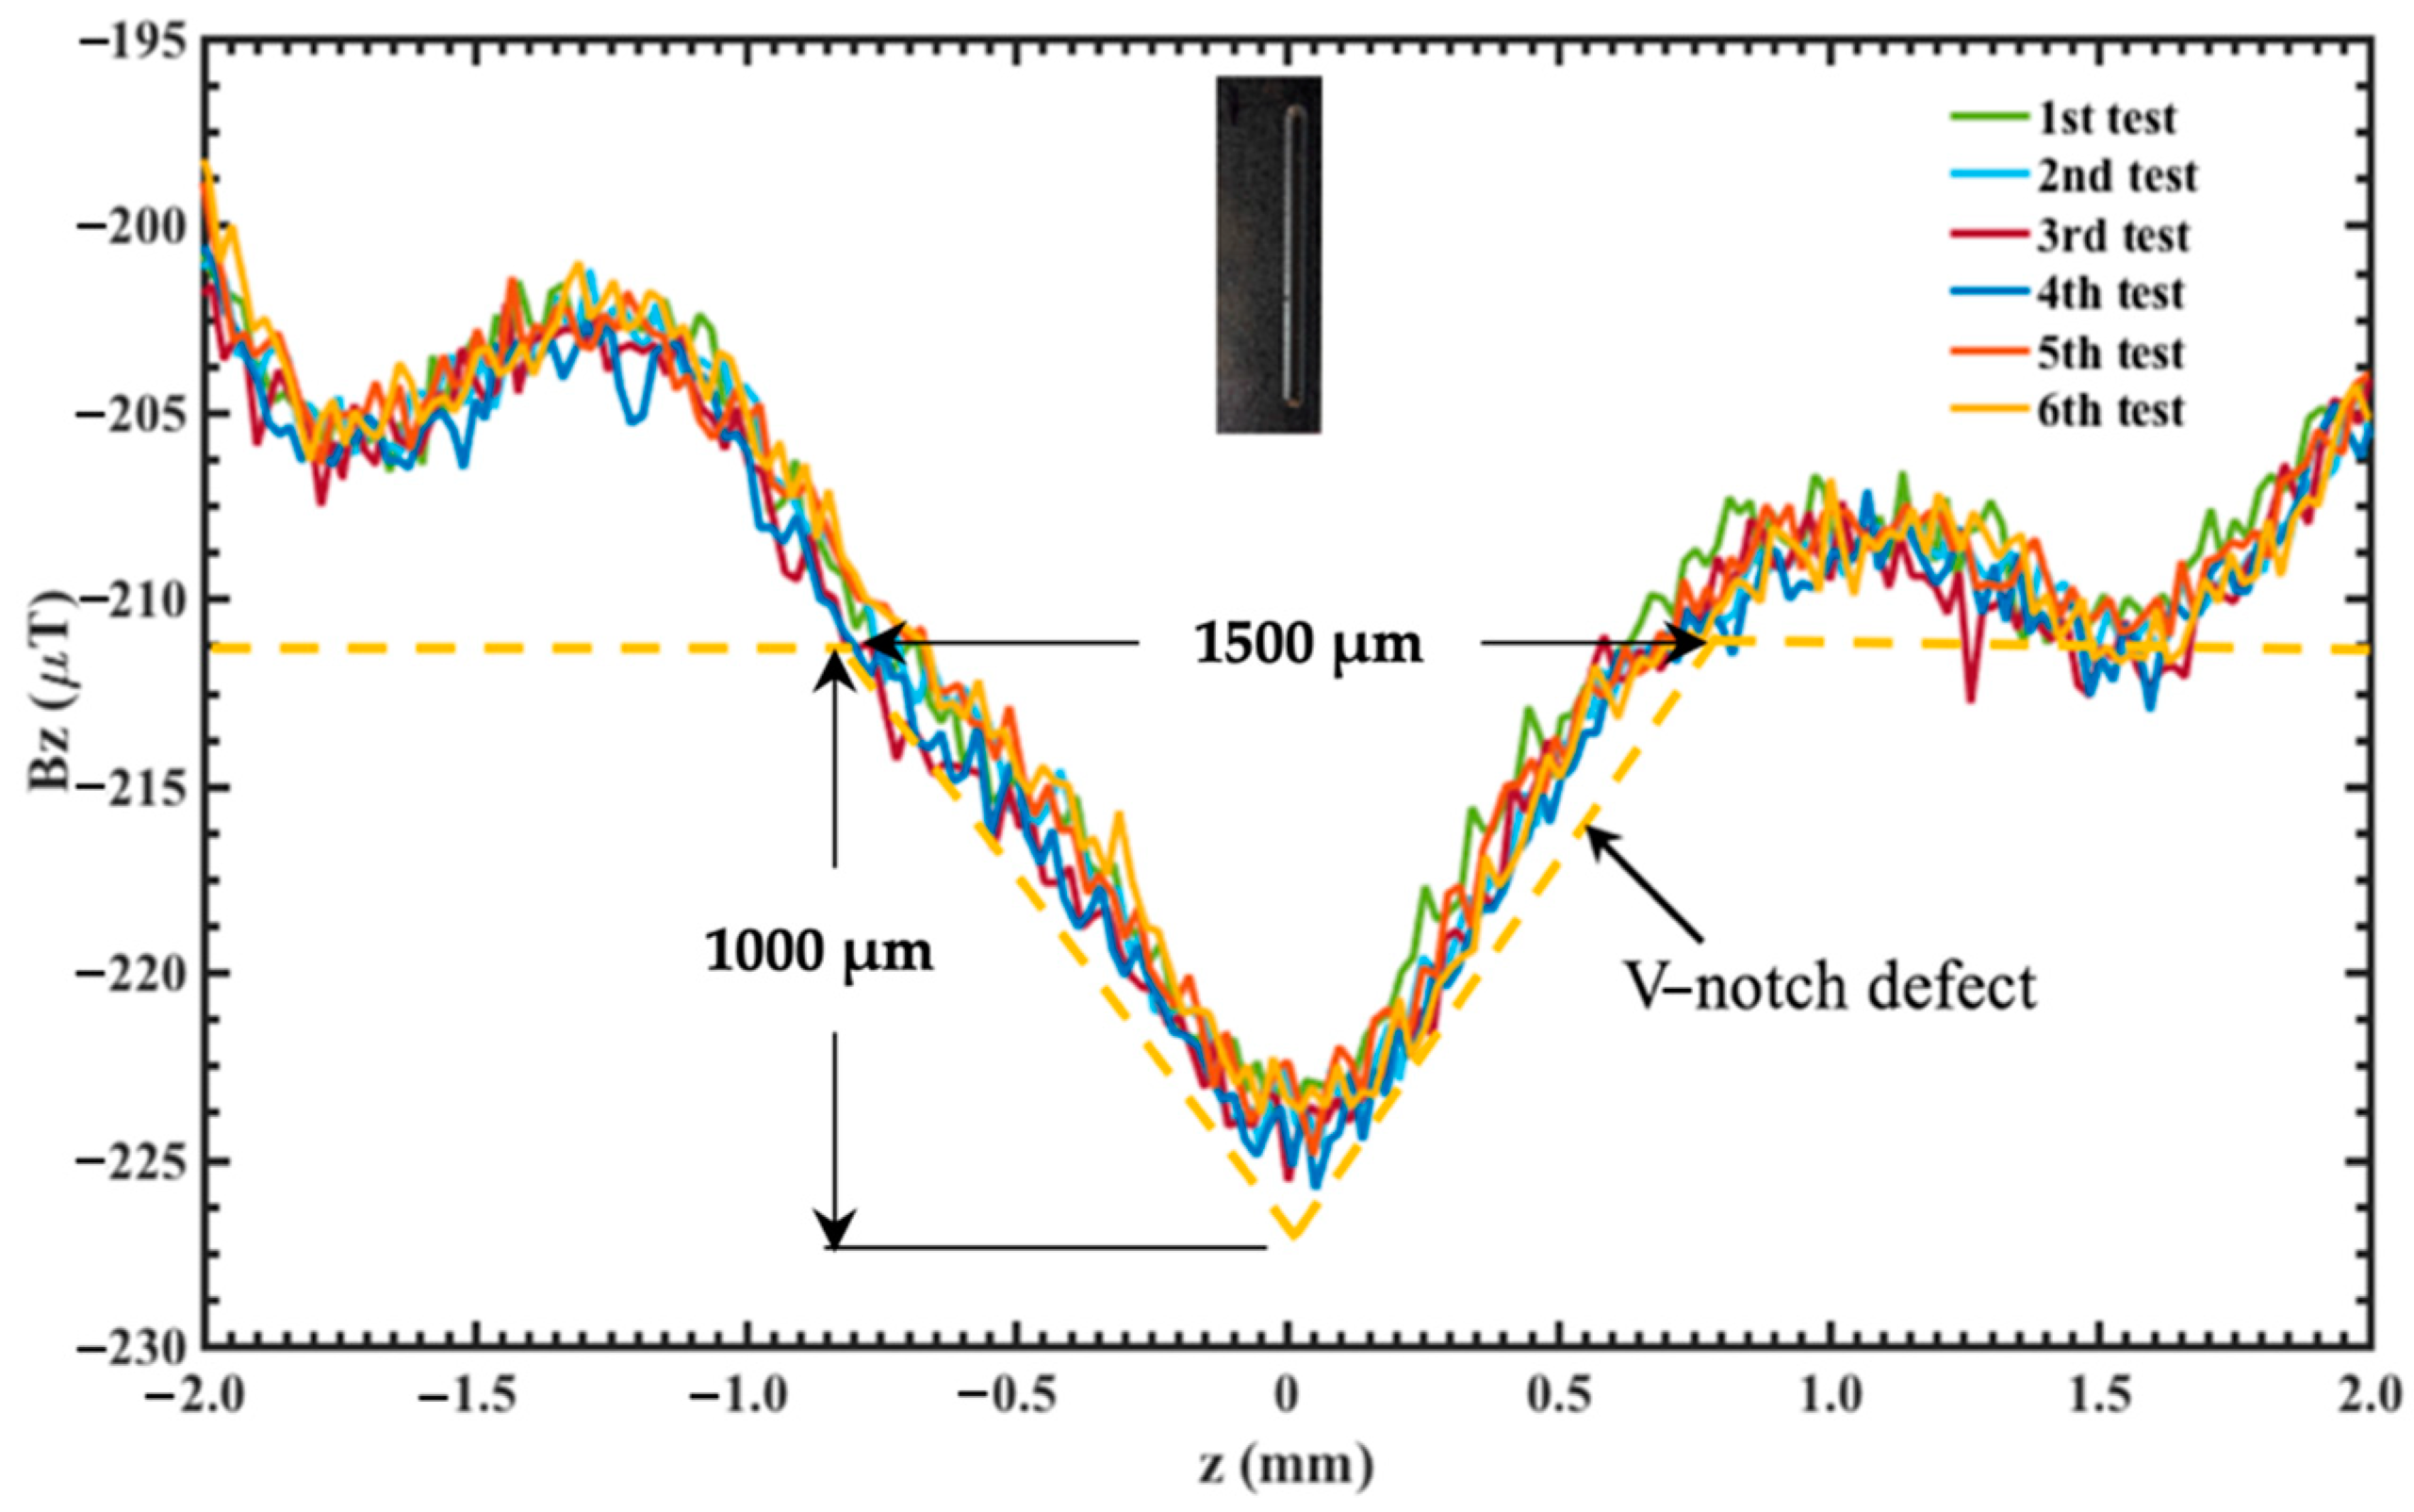
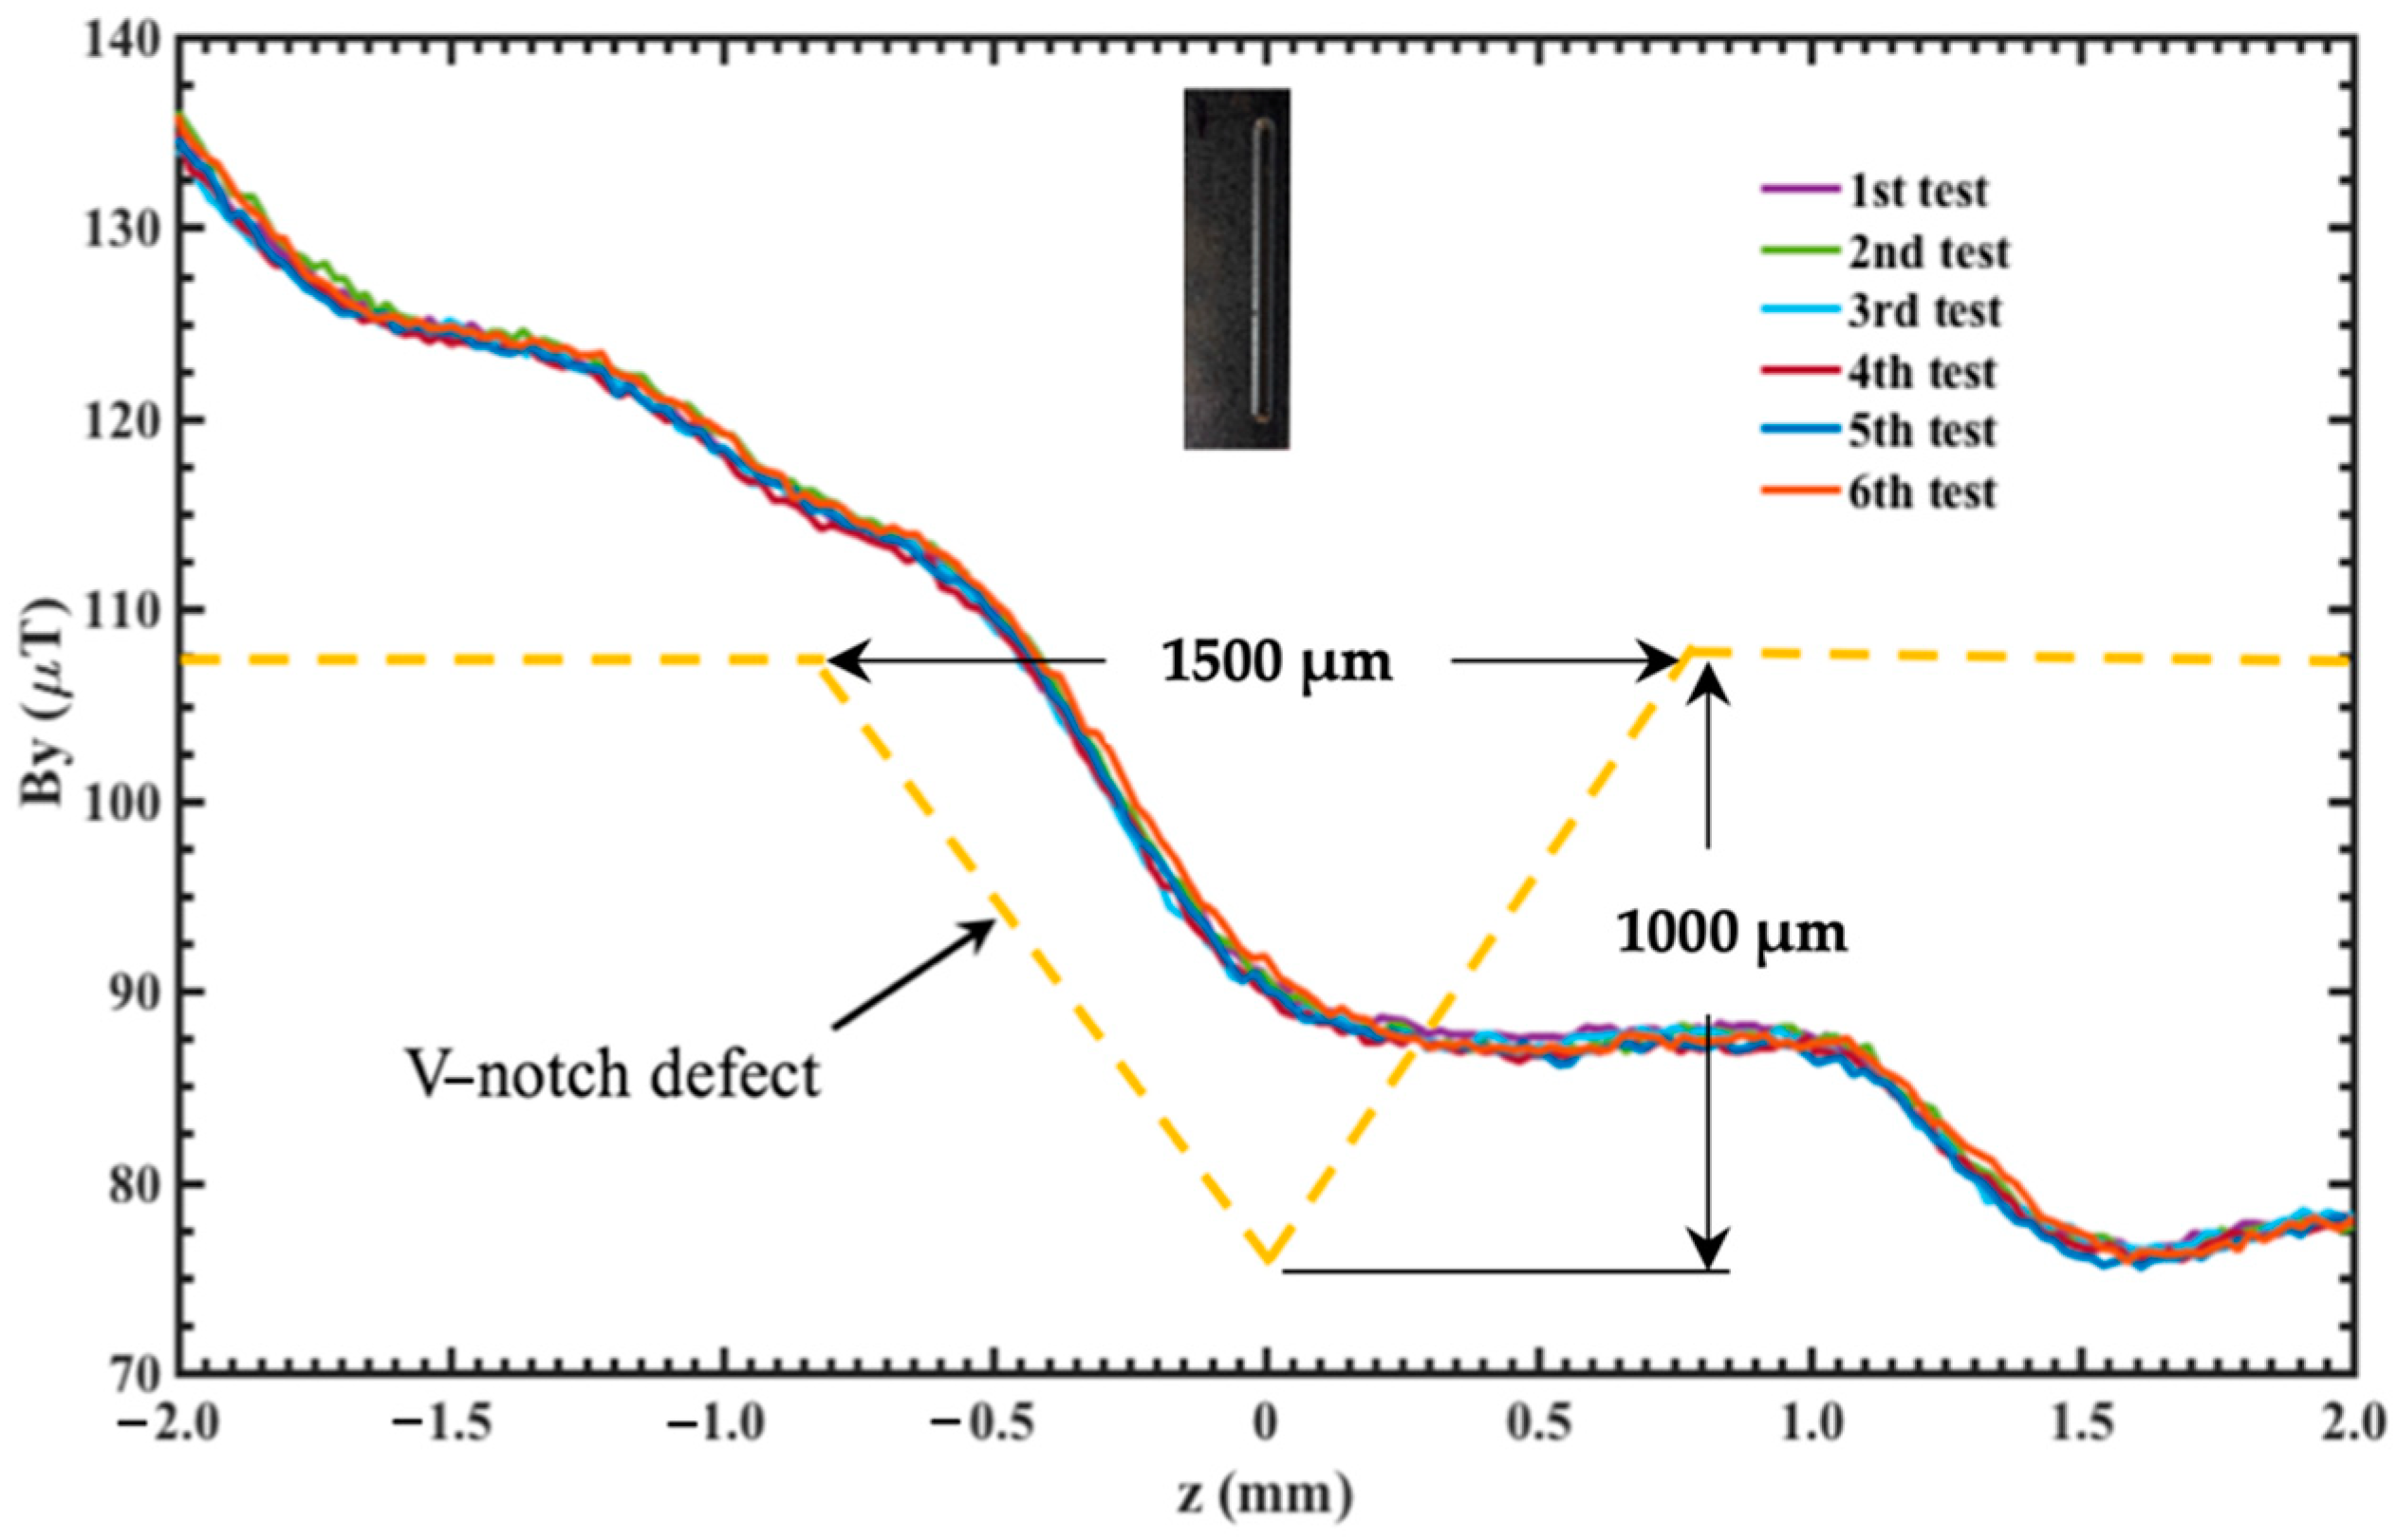
| S2 | 1500.0 | 1000.0 |
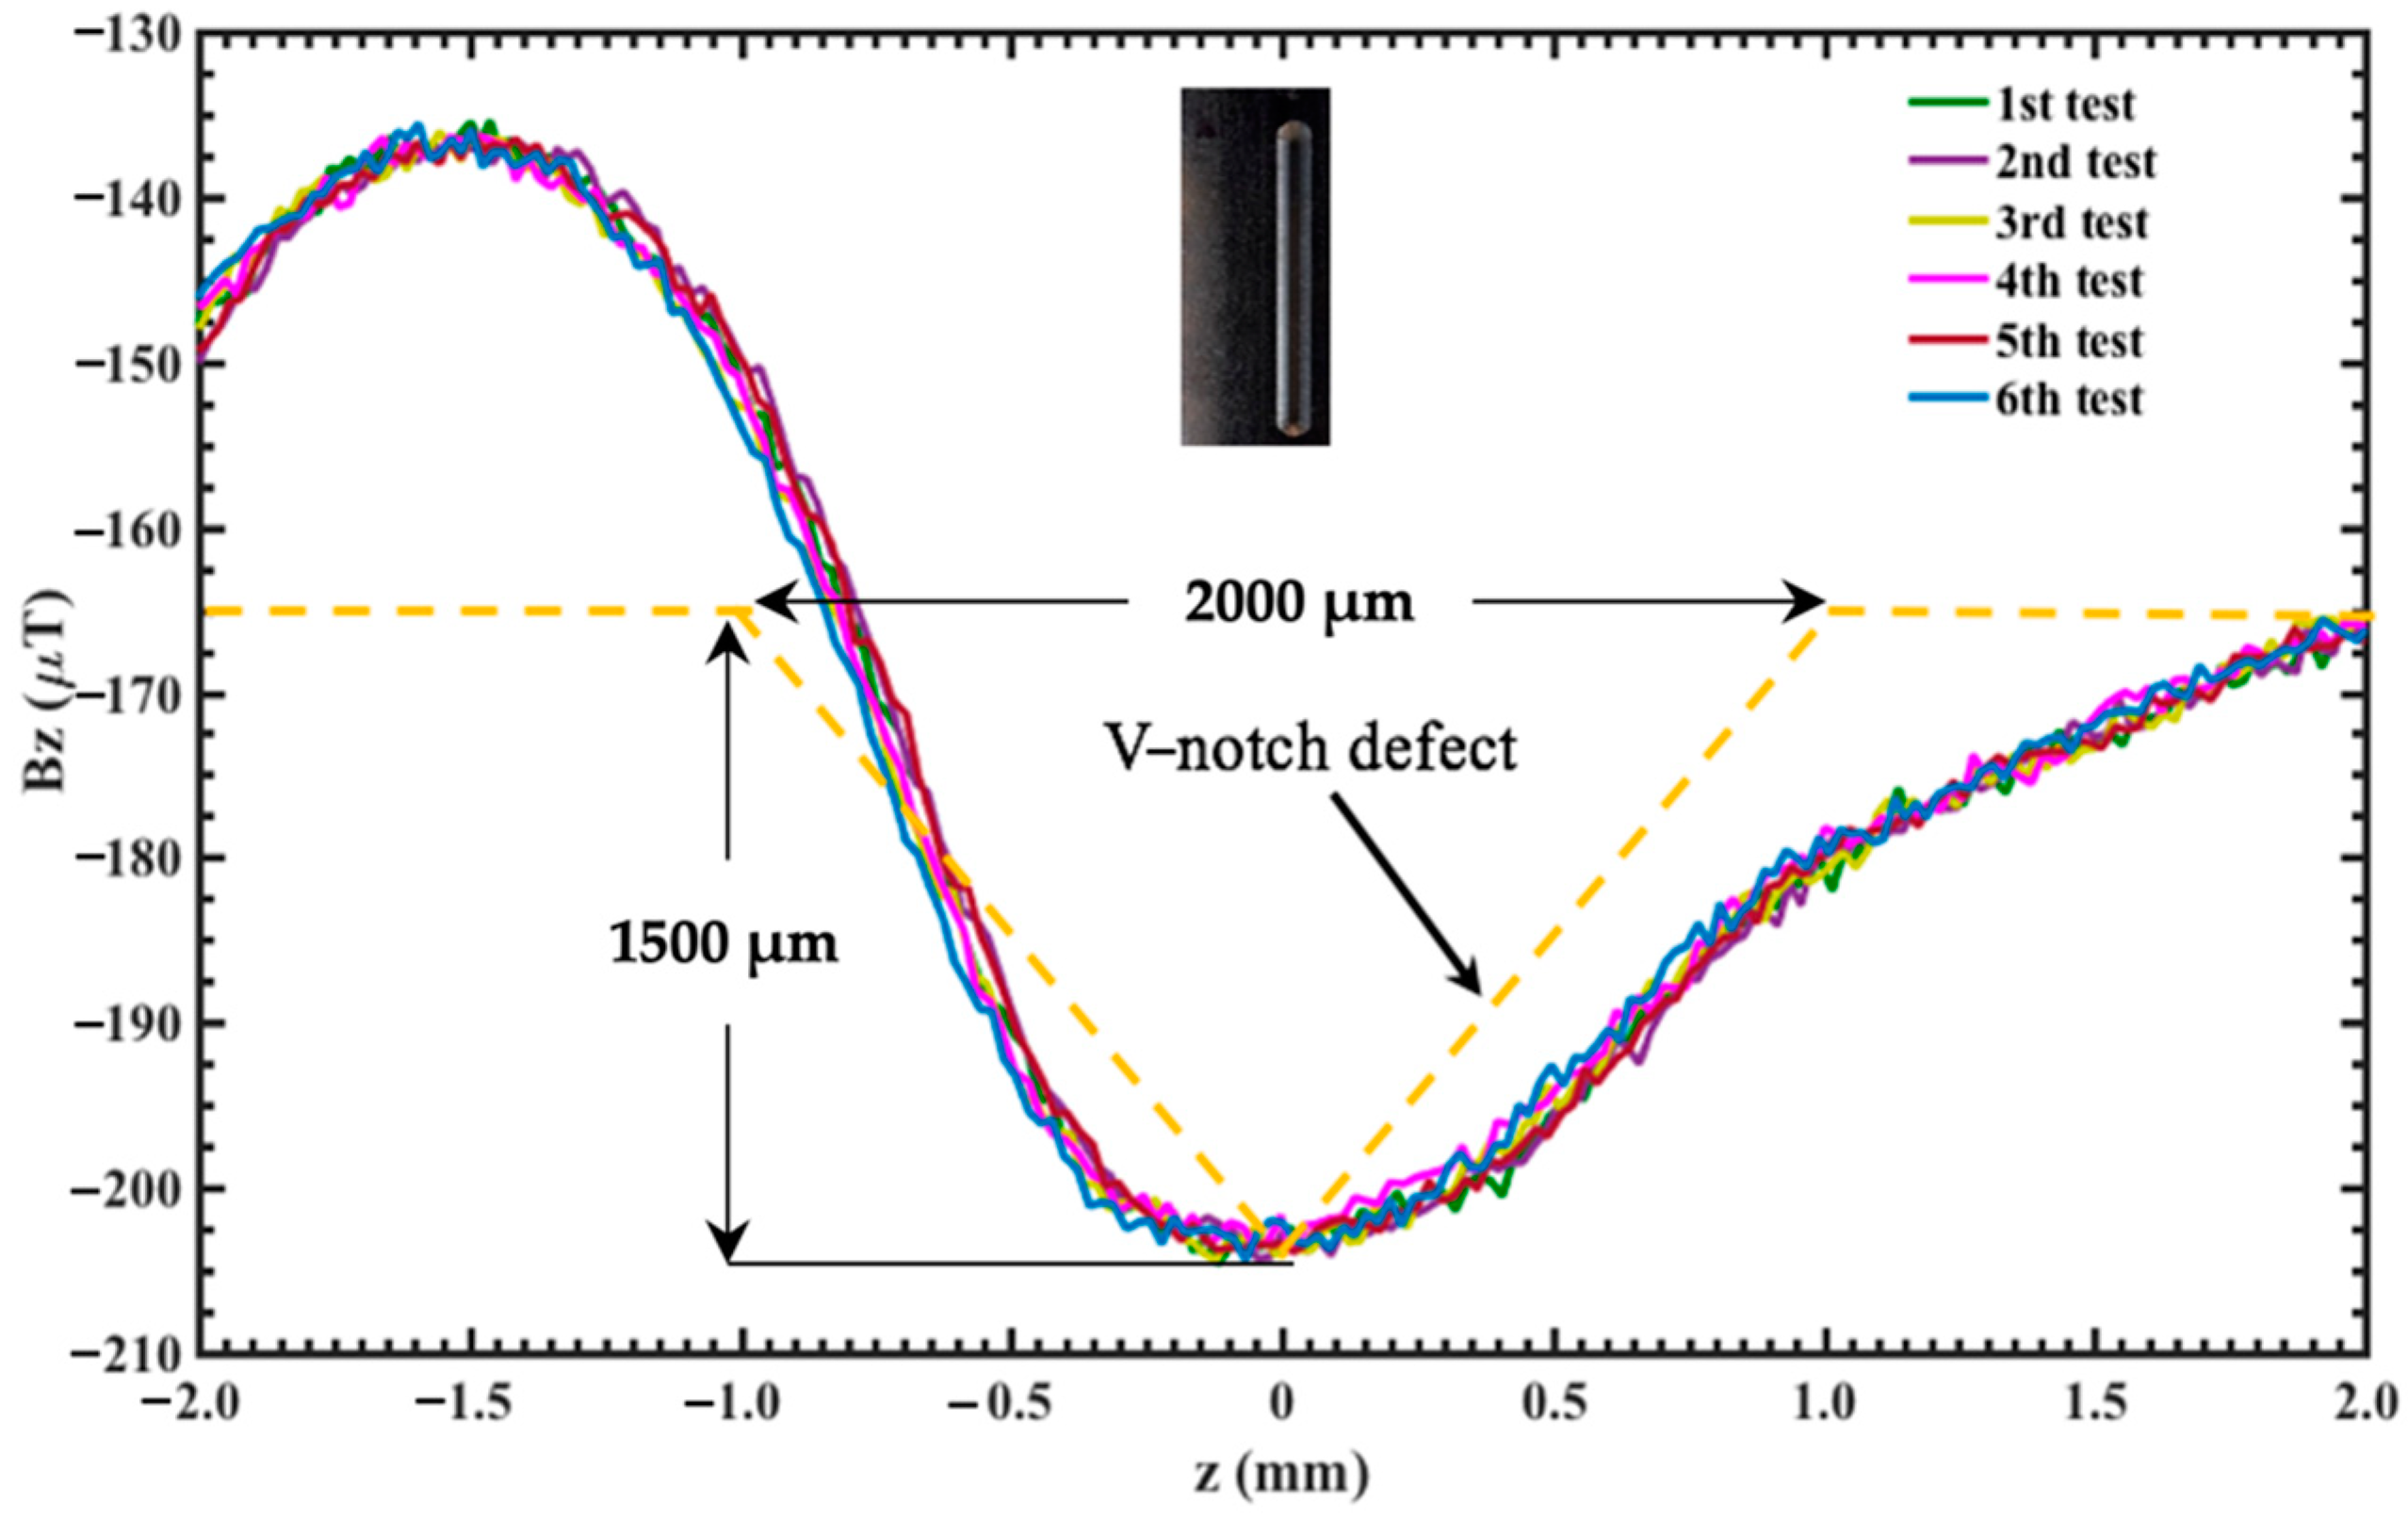
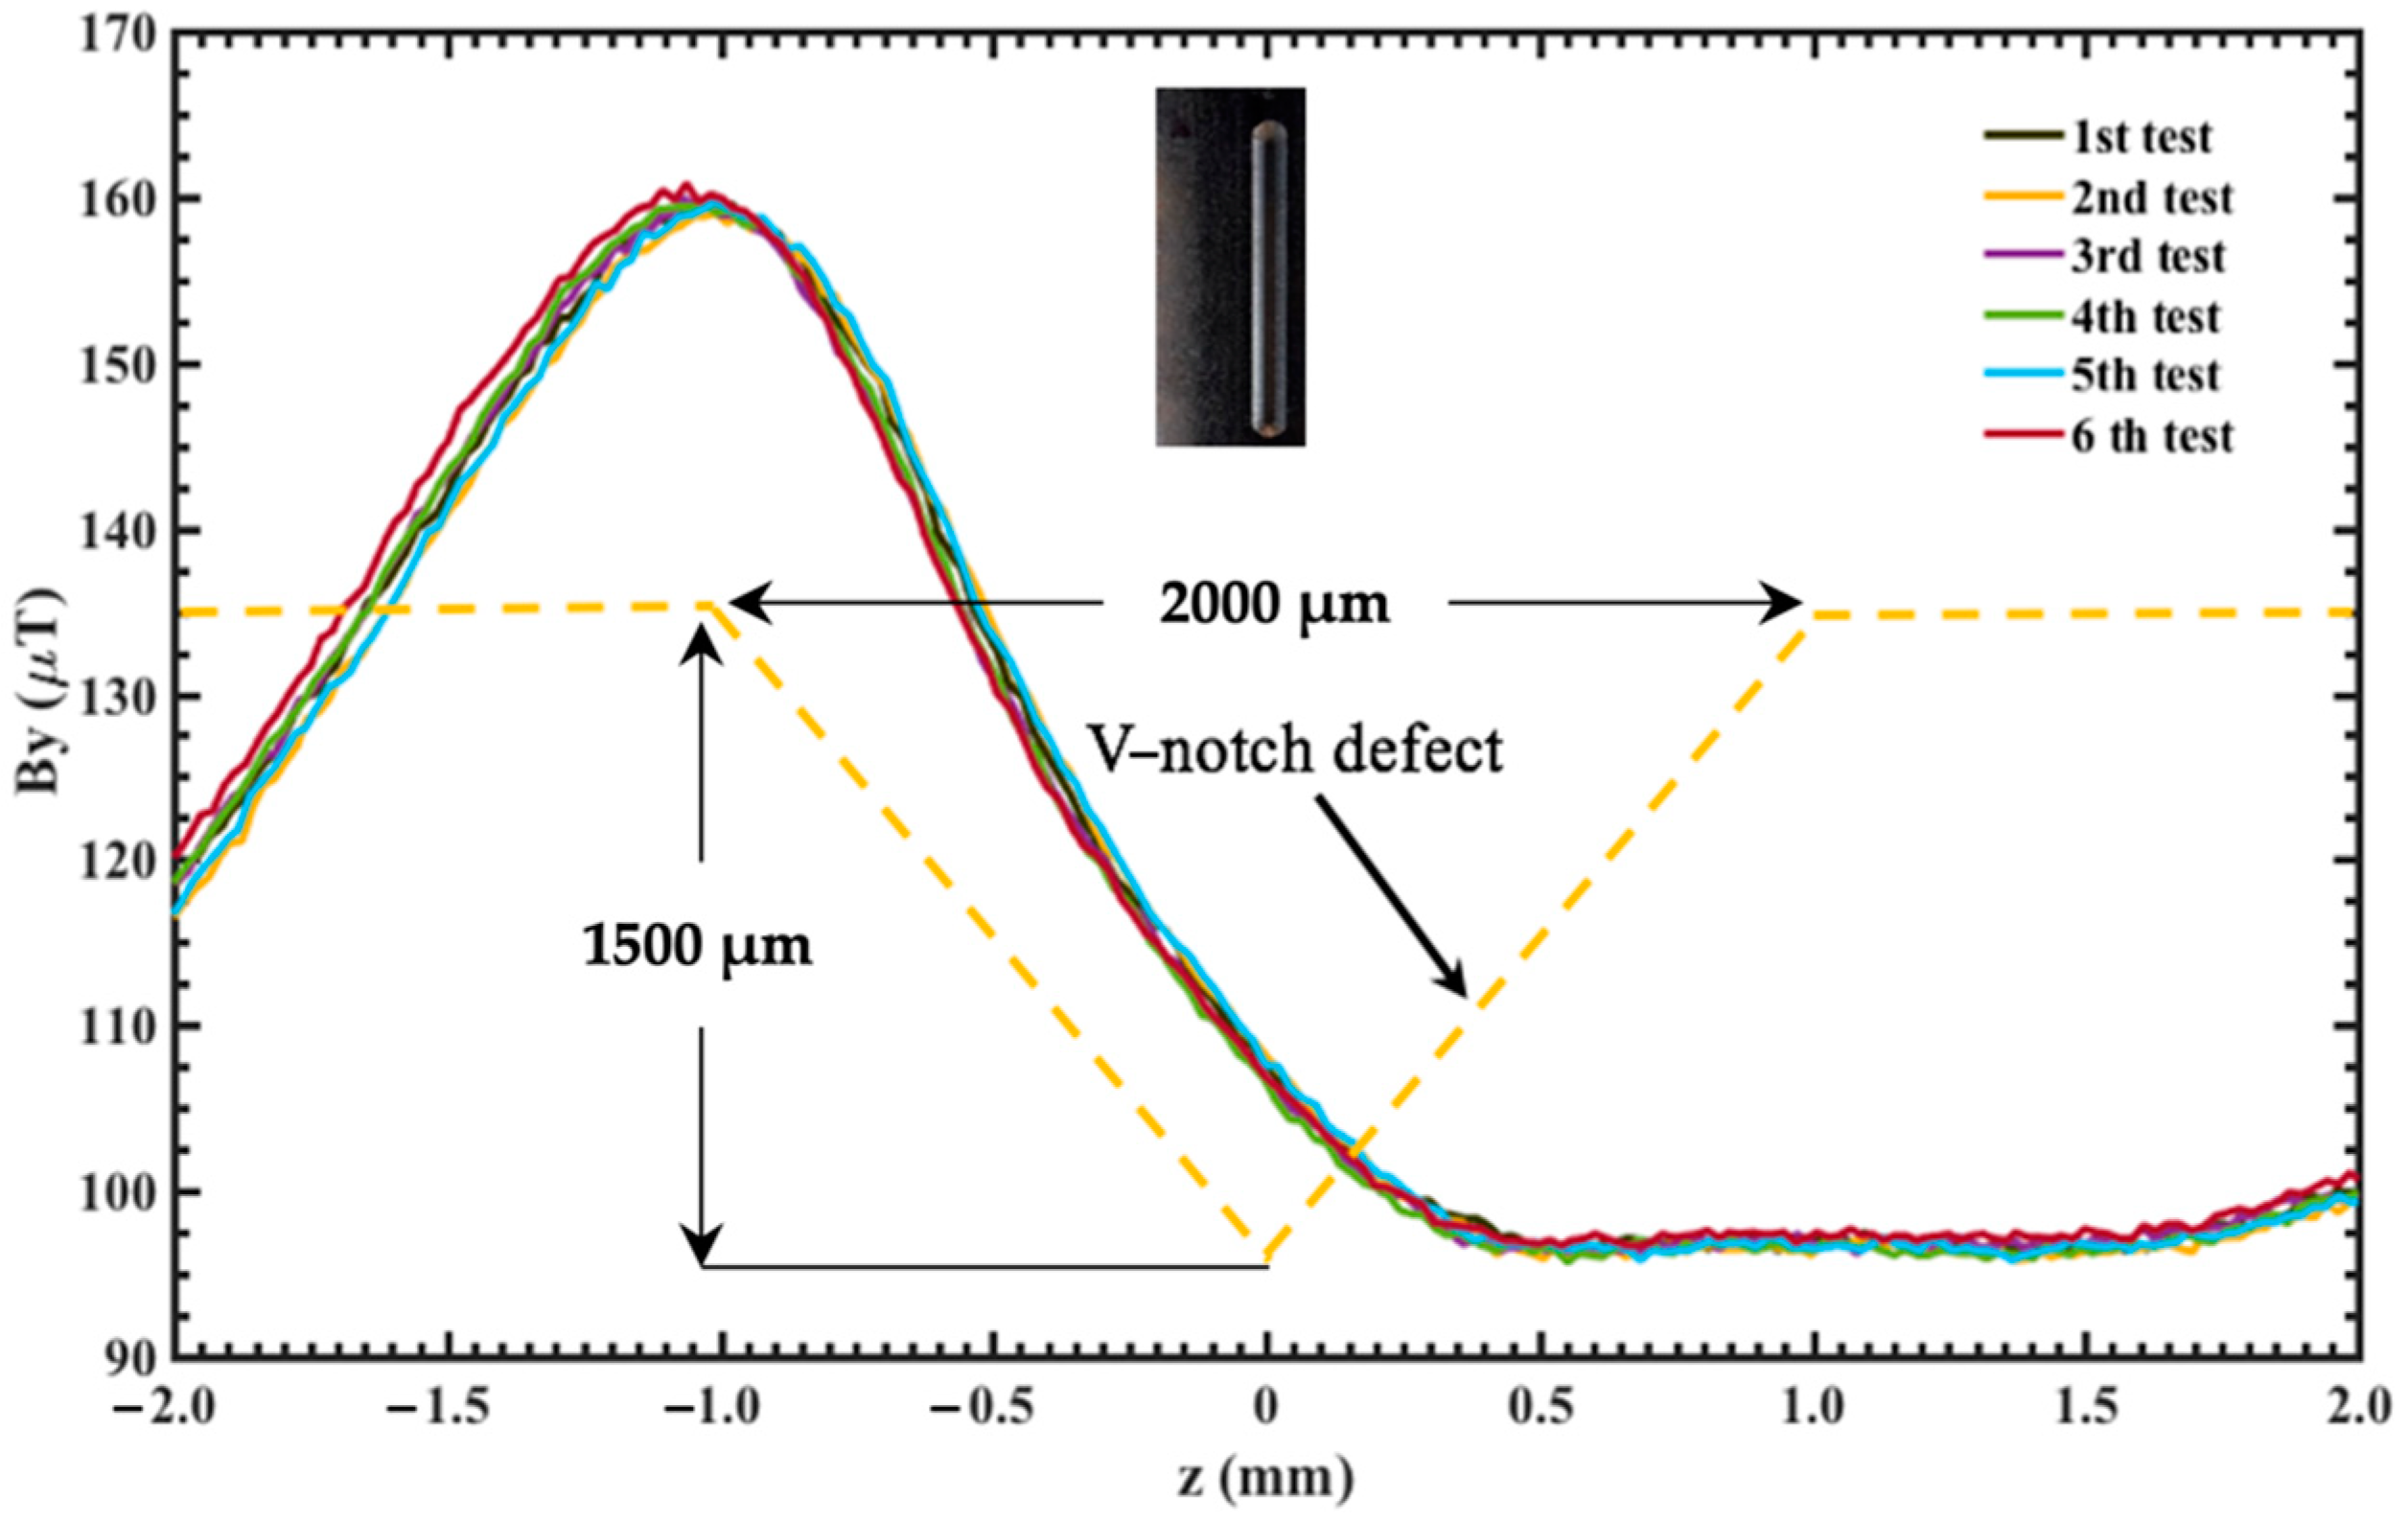
| S3 | 2000.0 | 1500.0 |
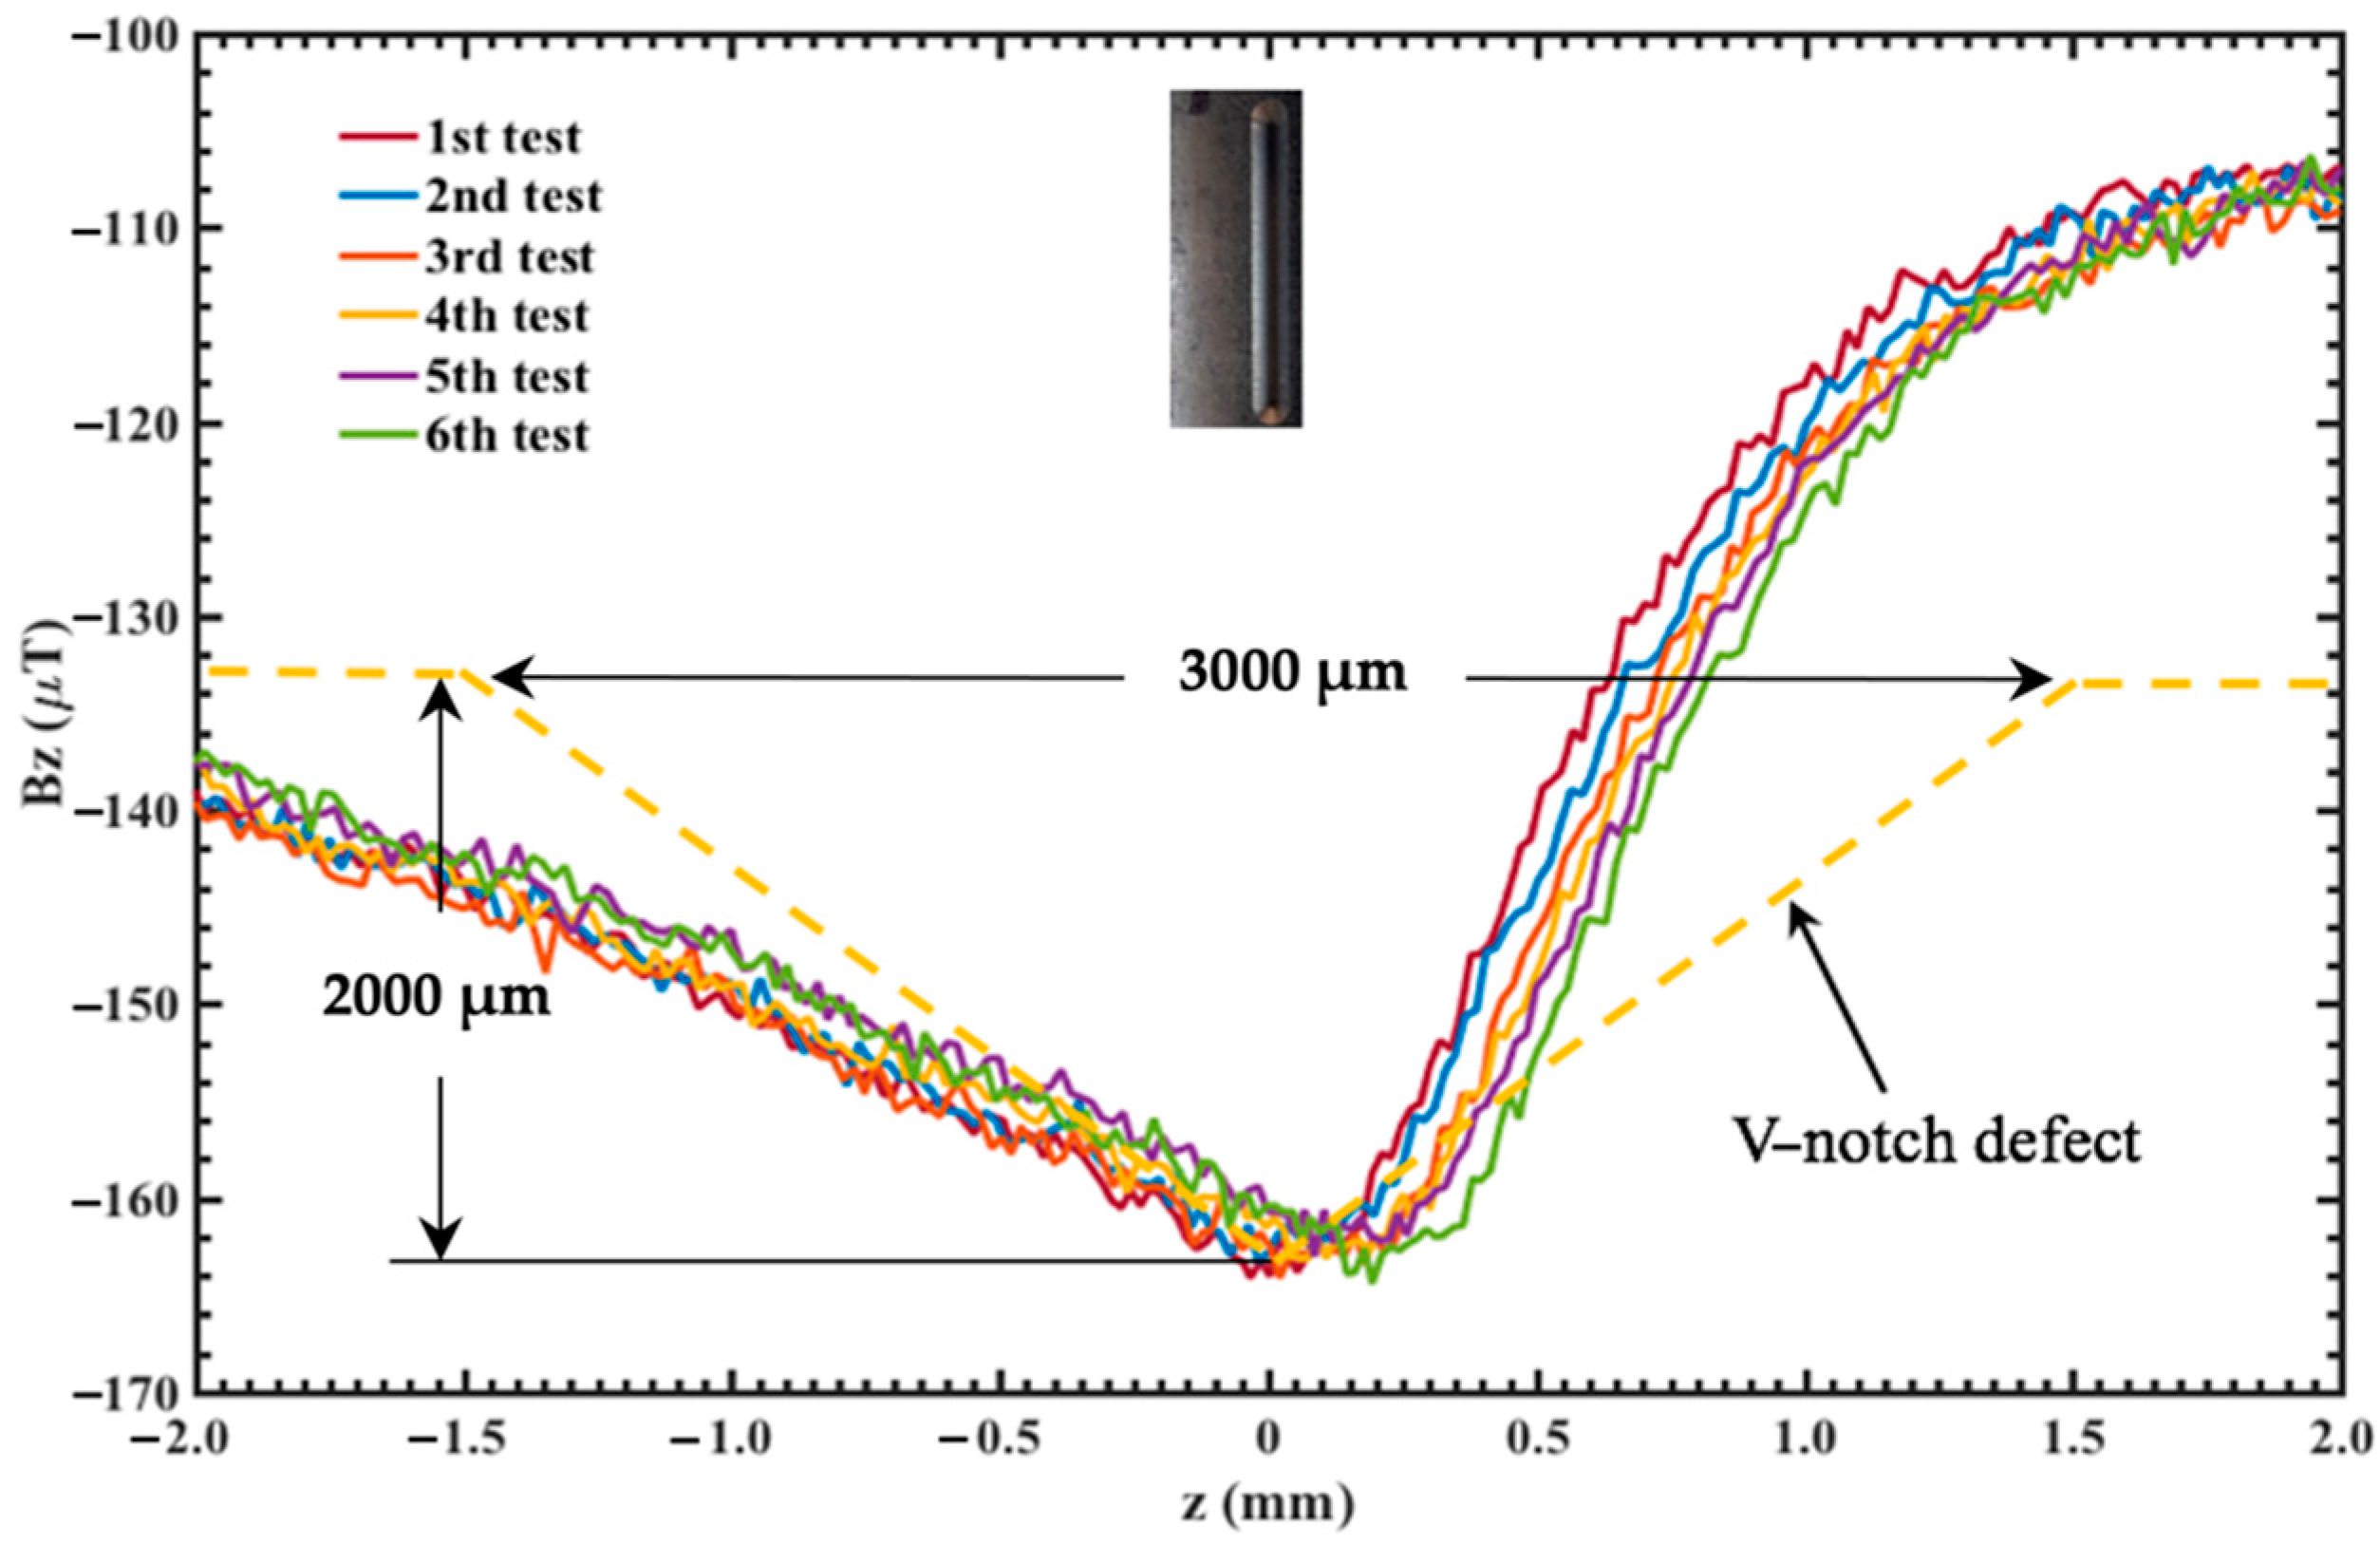
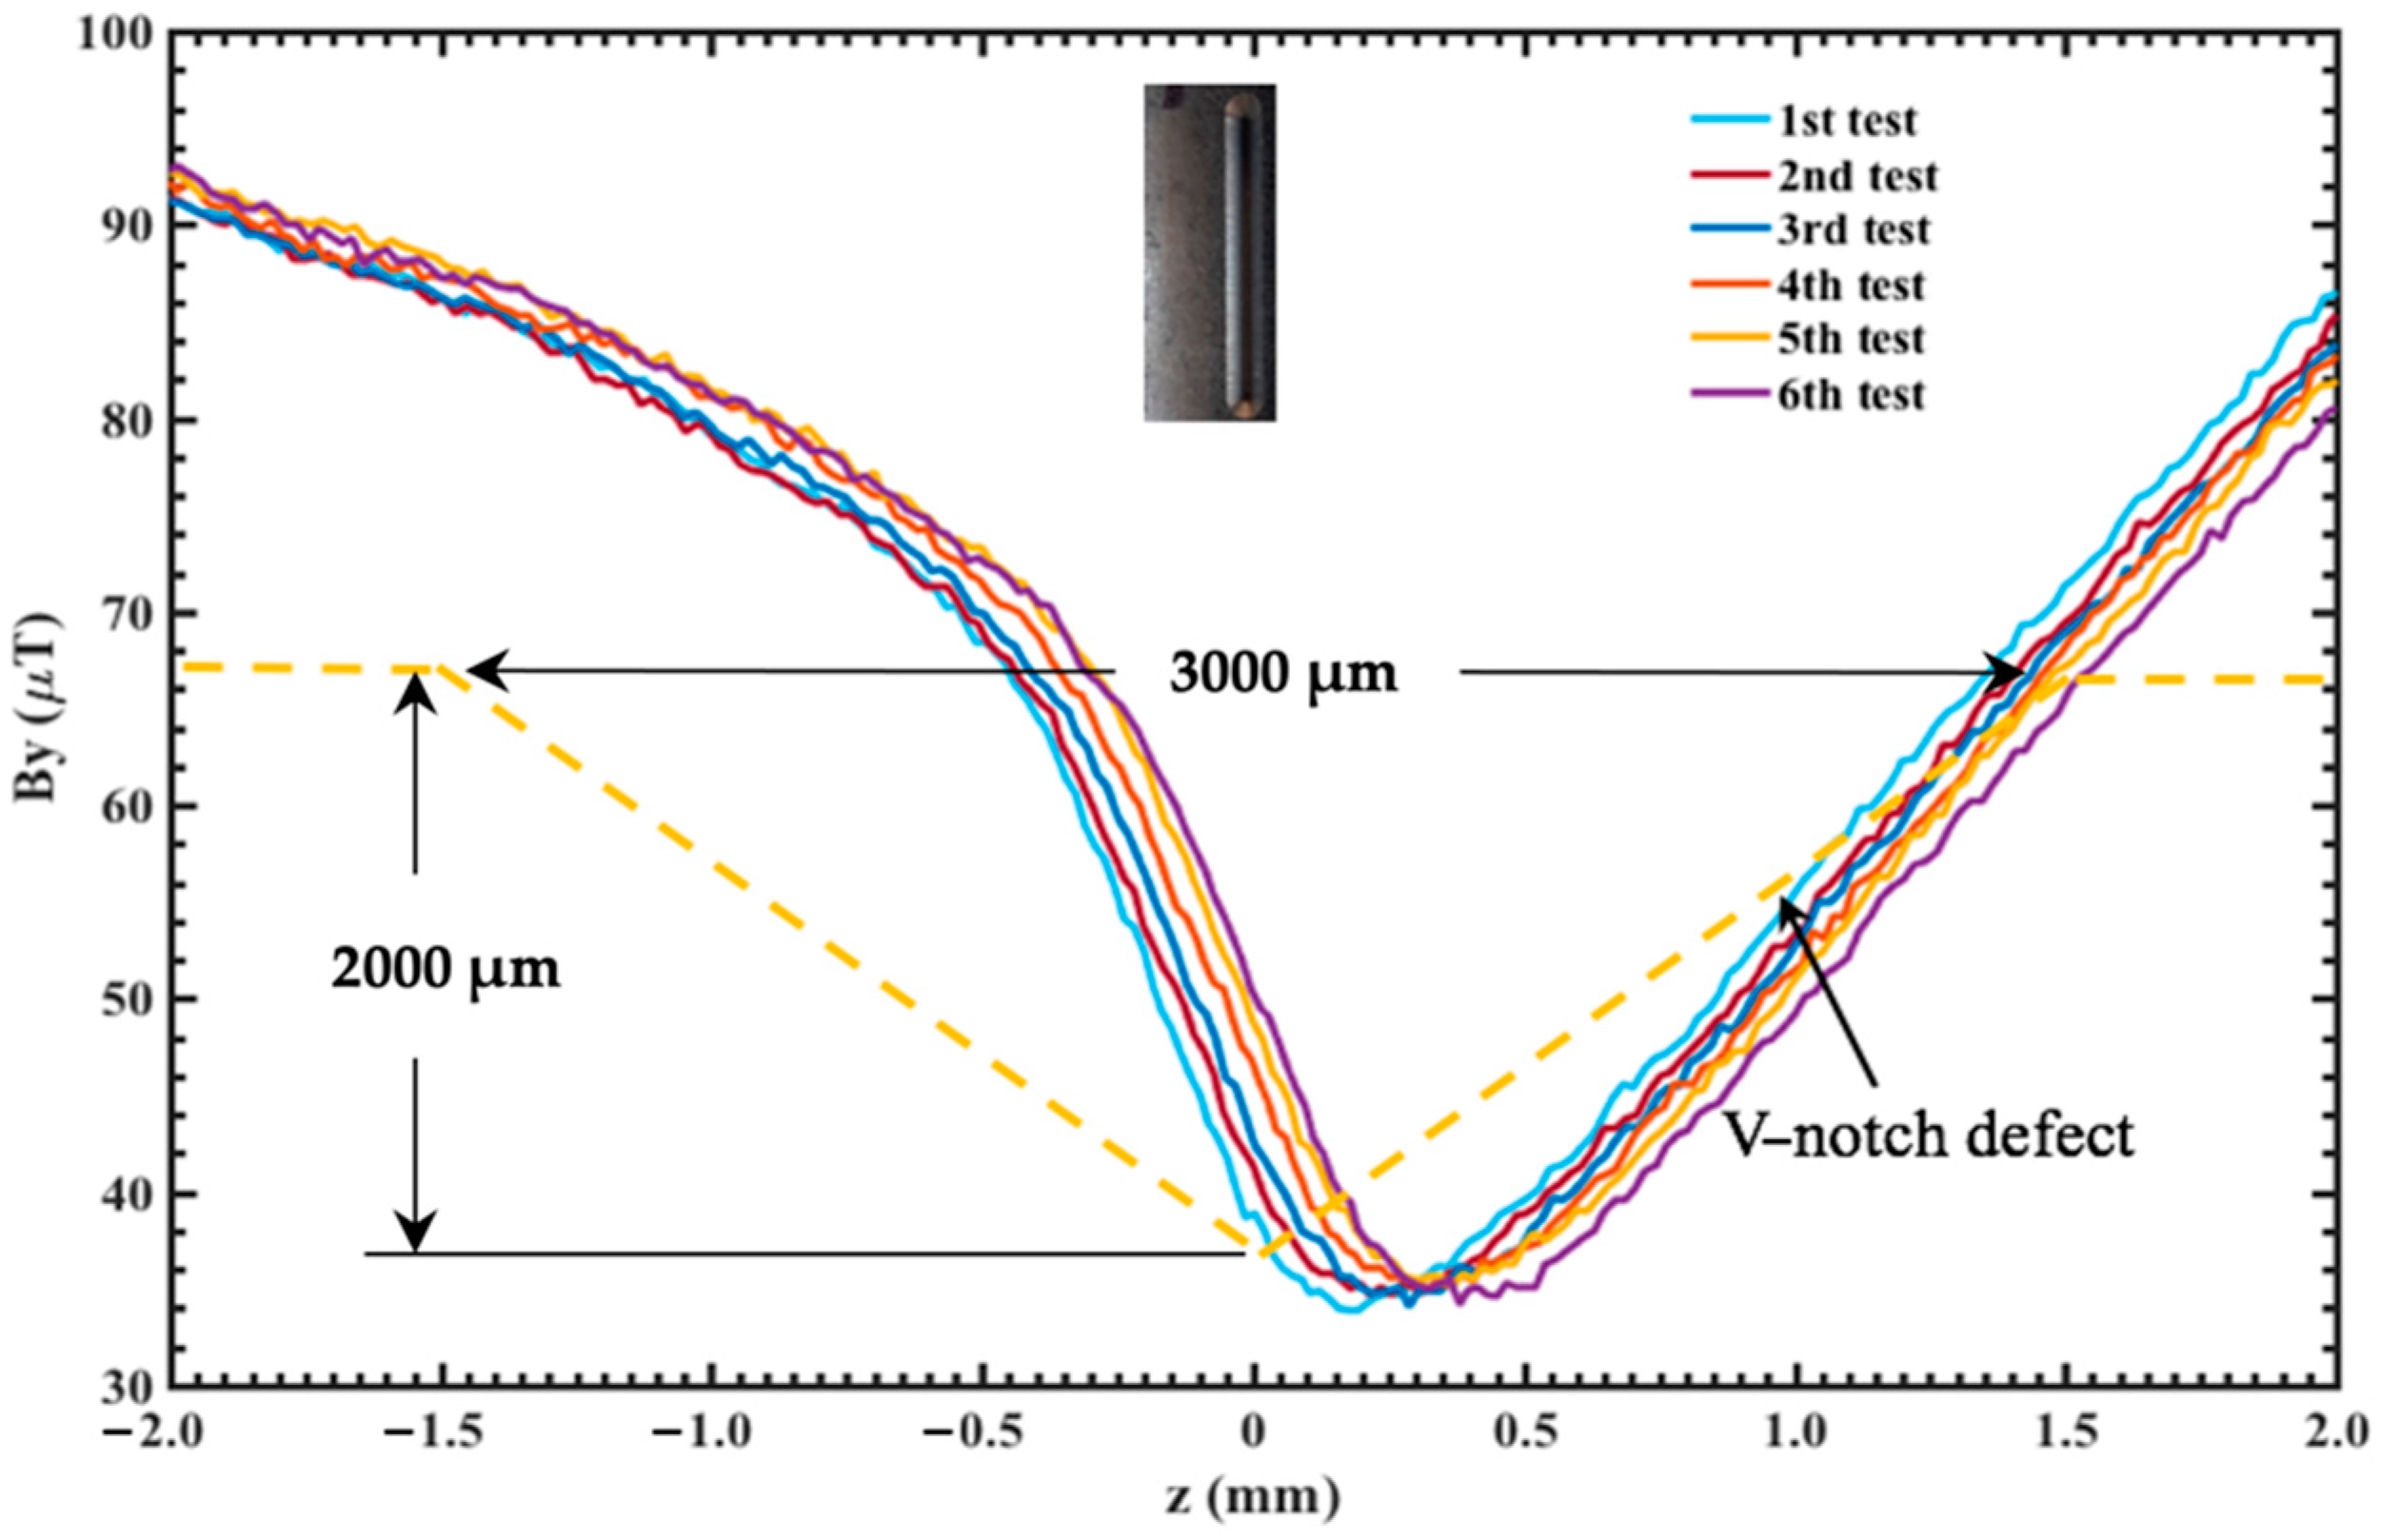
| S4 | 3000.0 | 2000.0 |
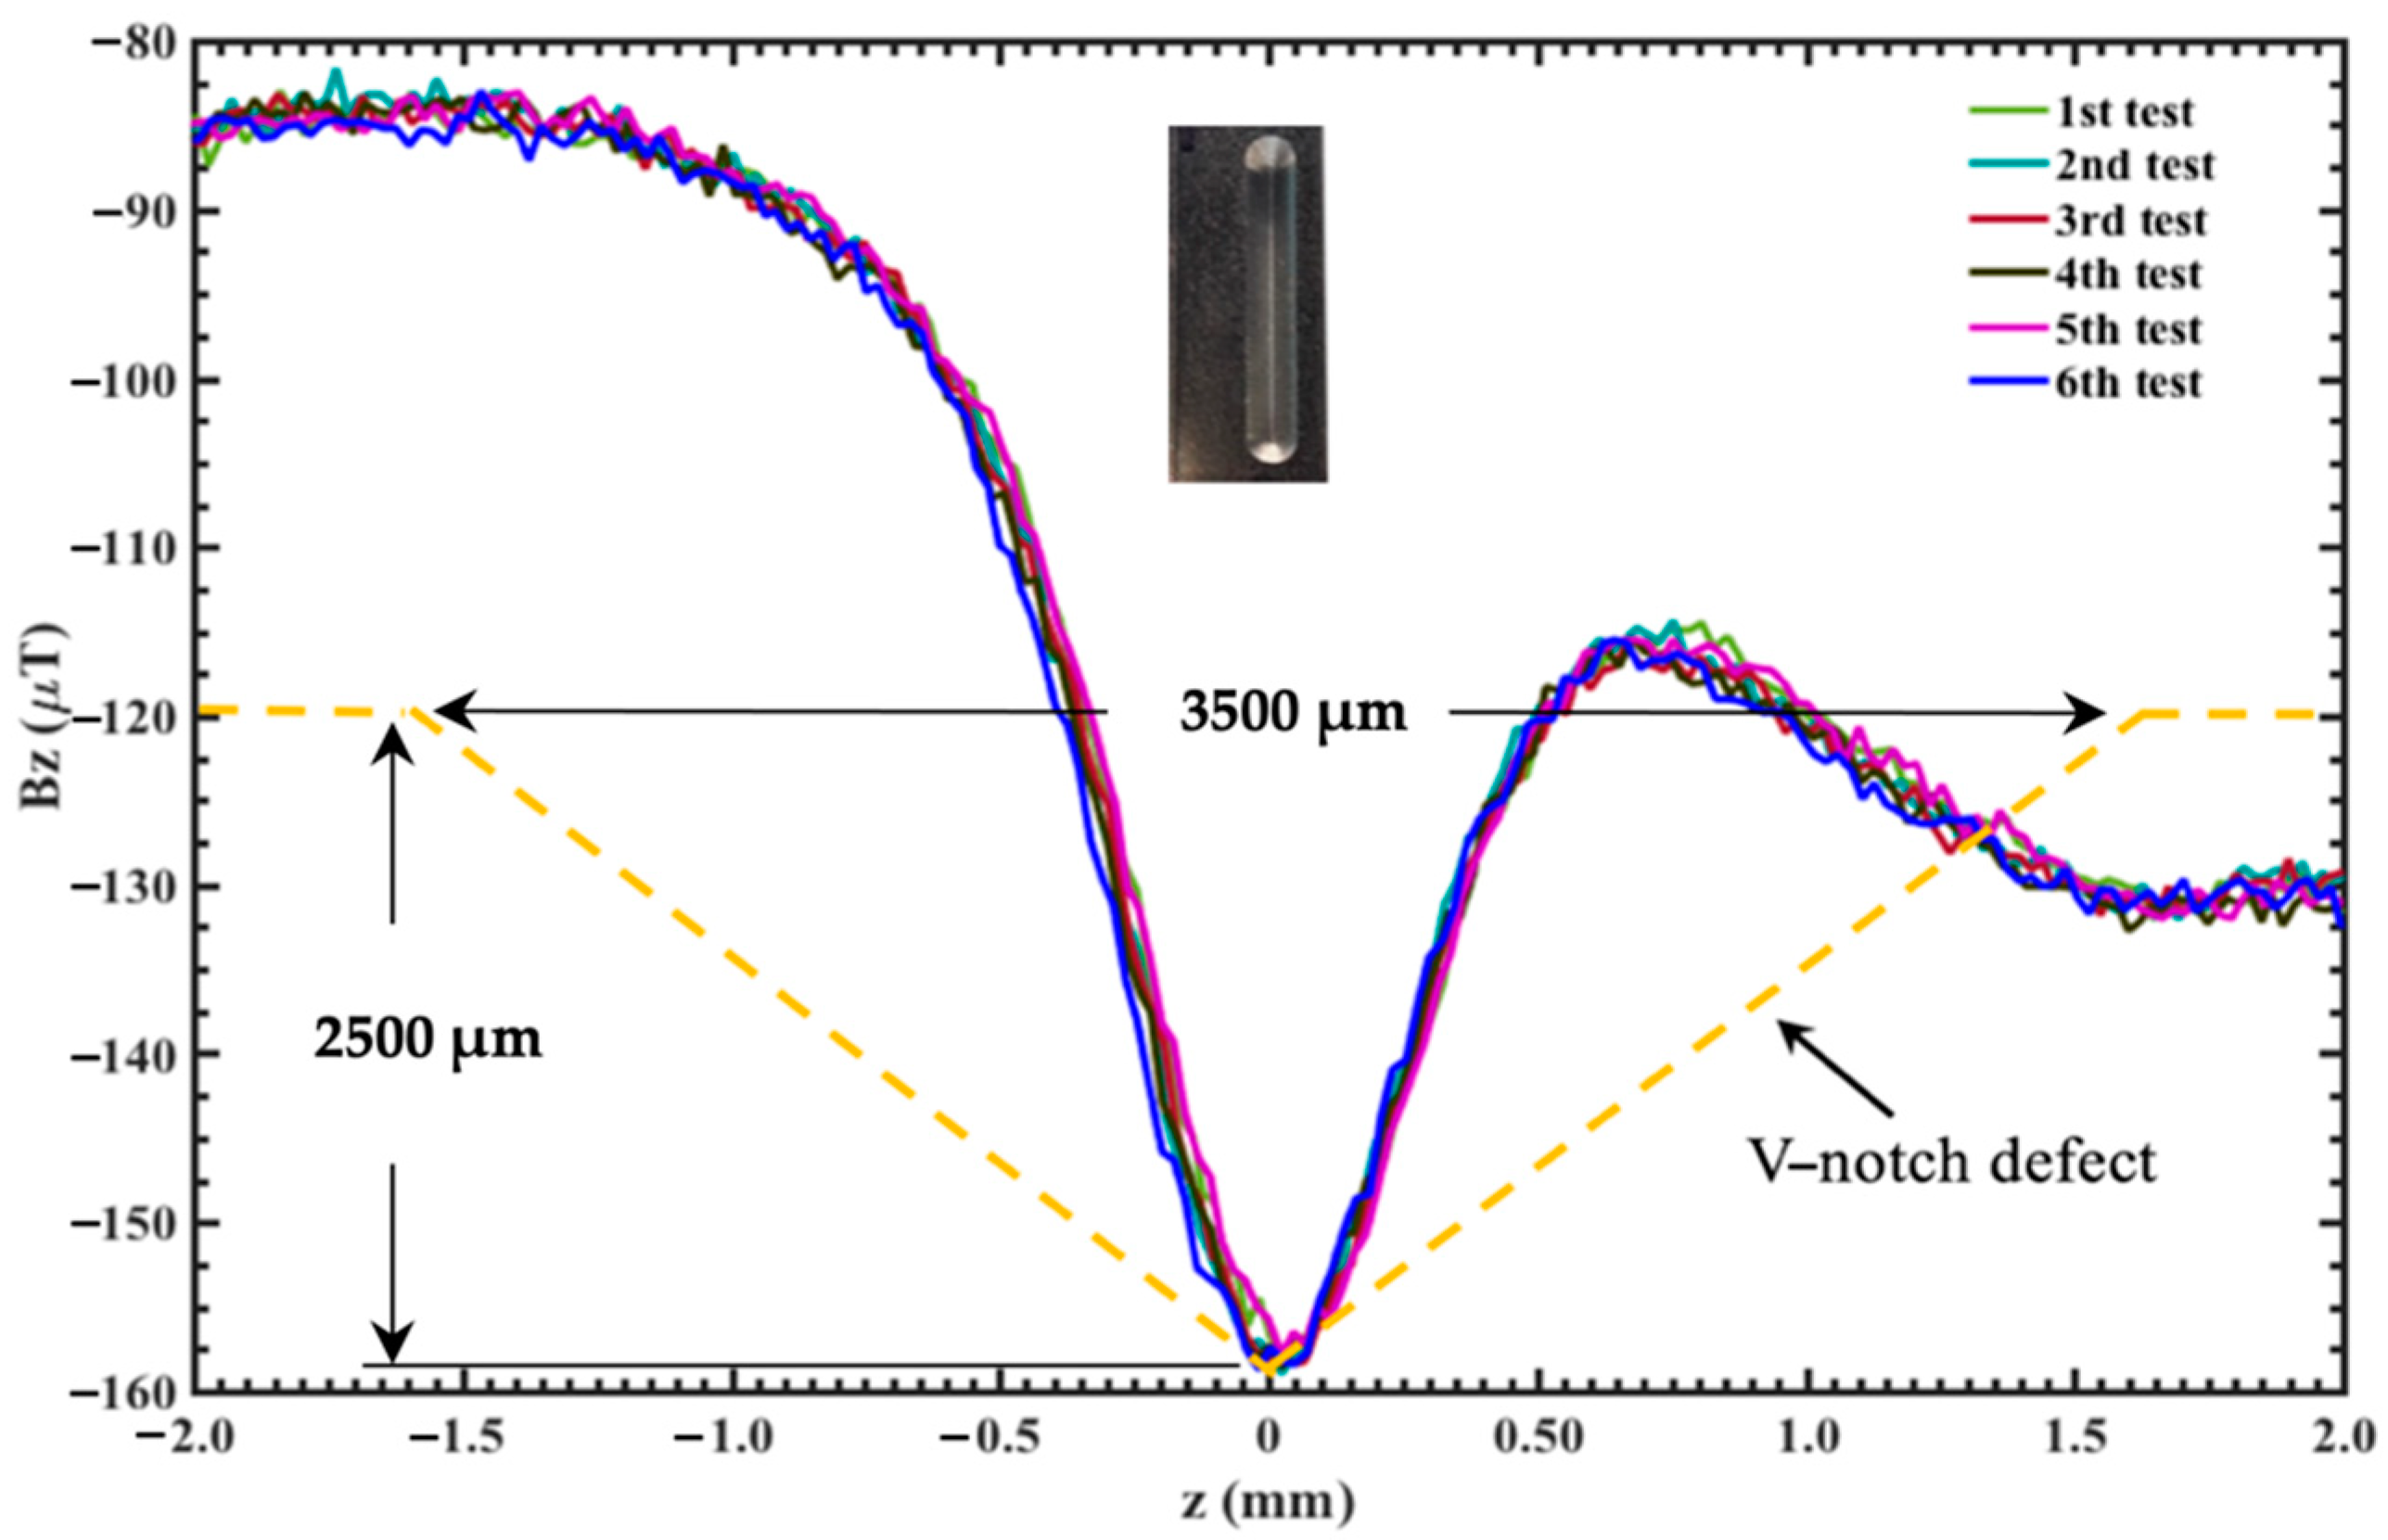
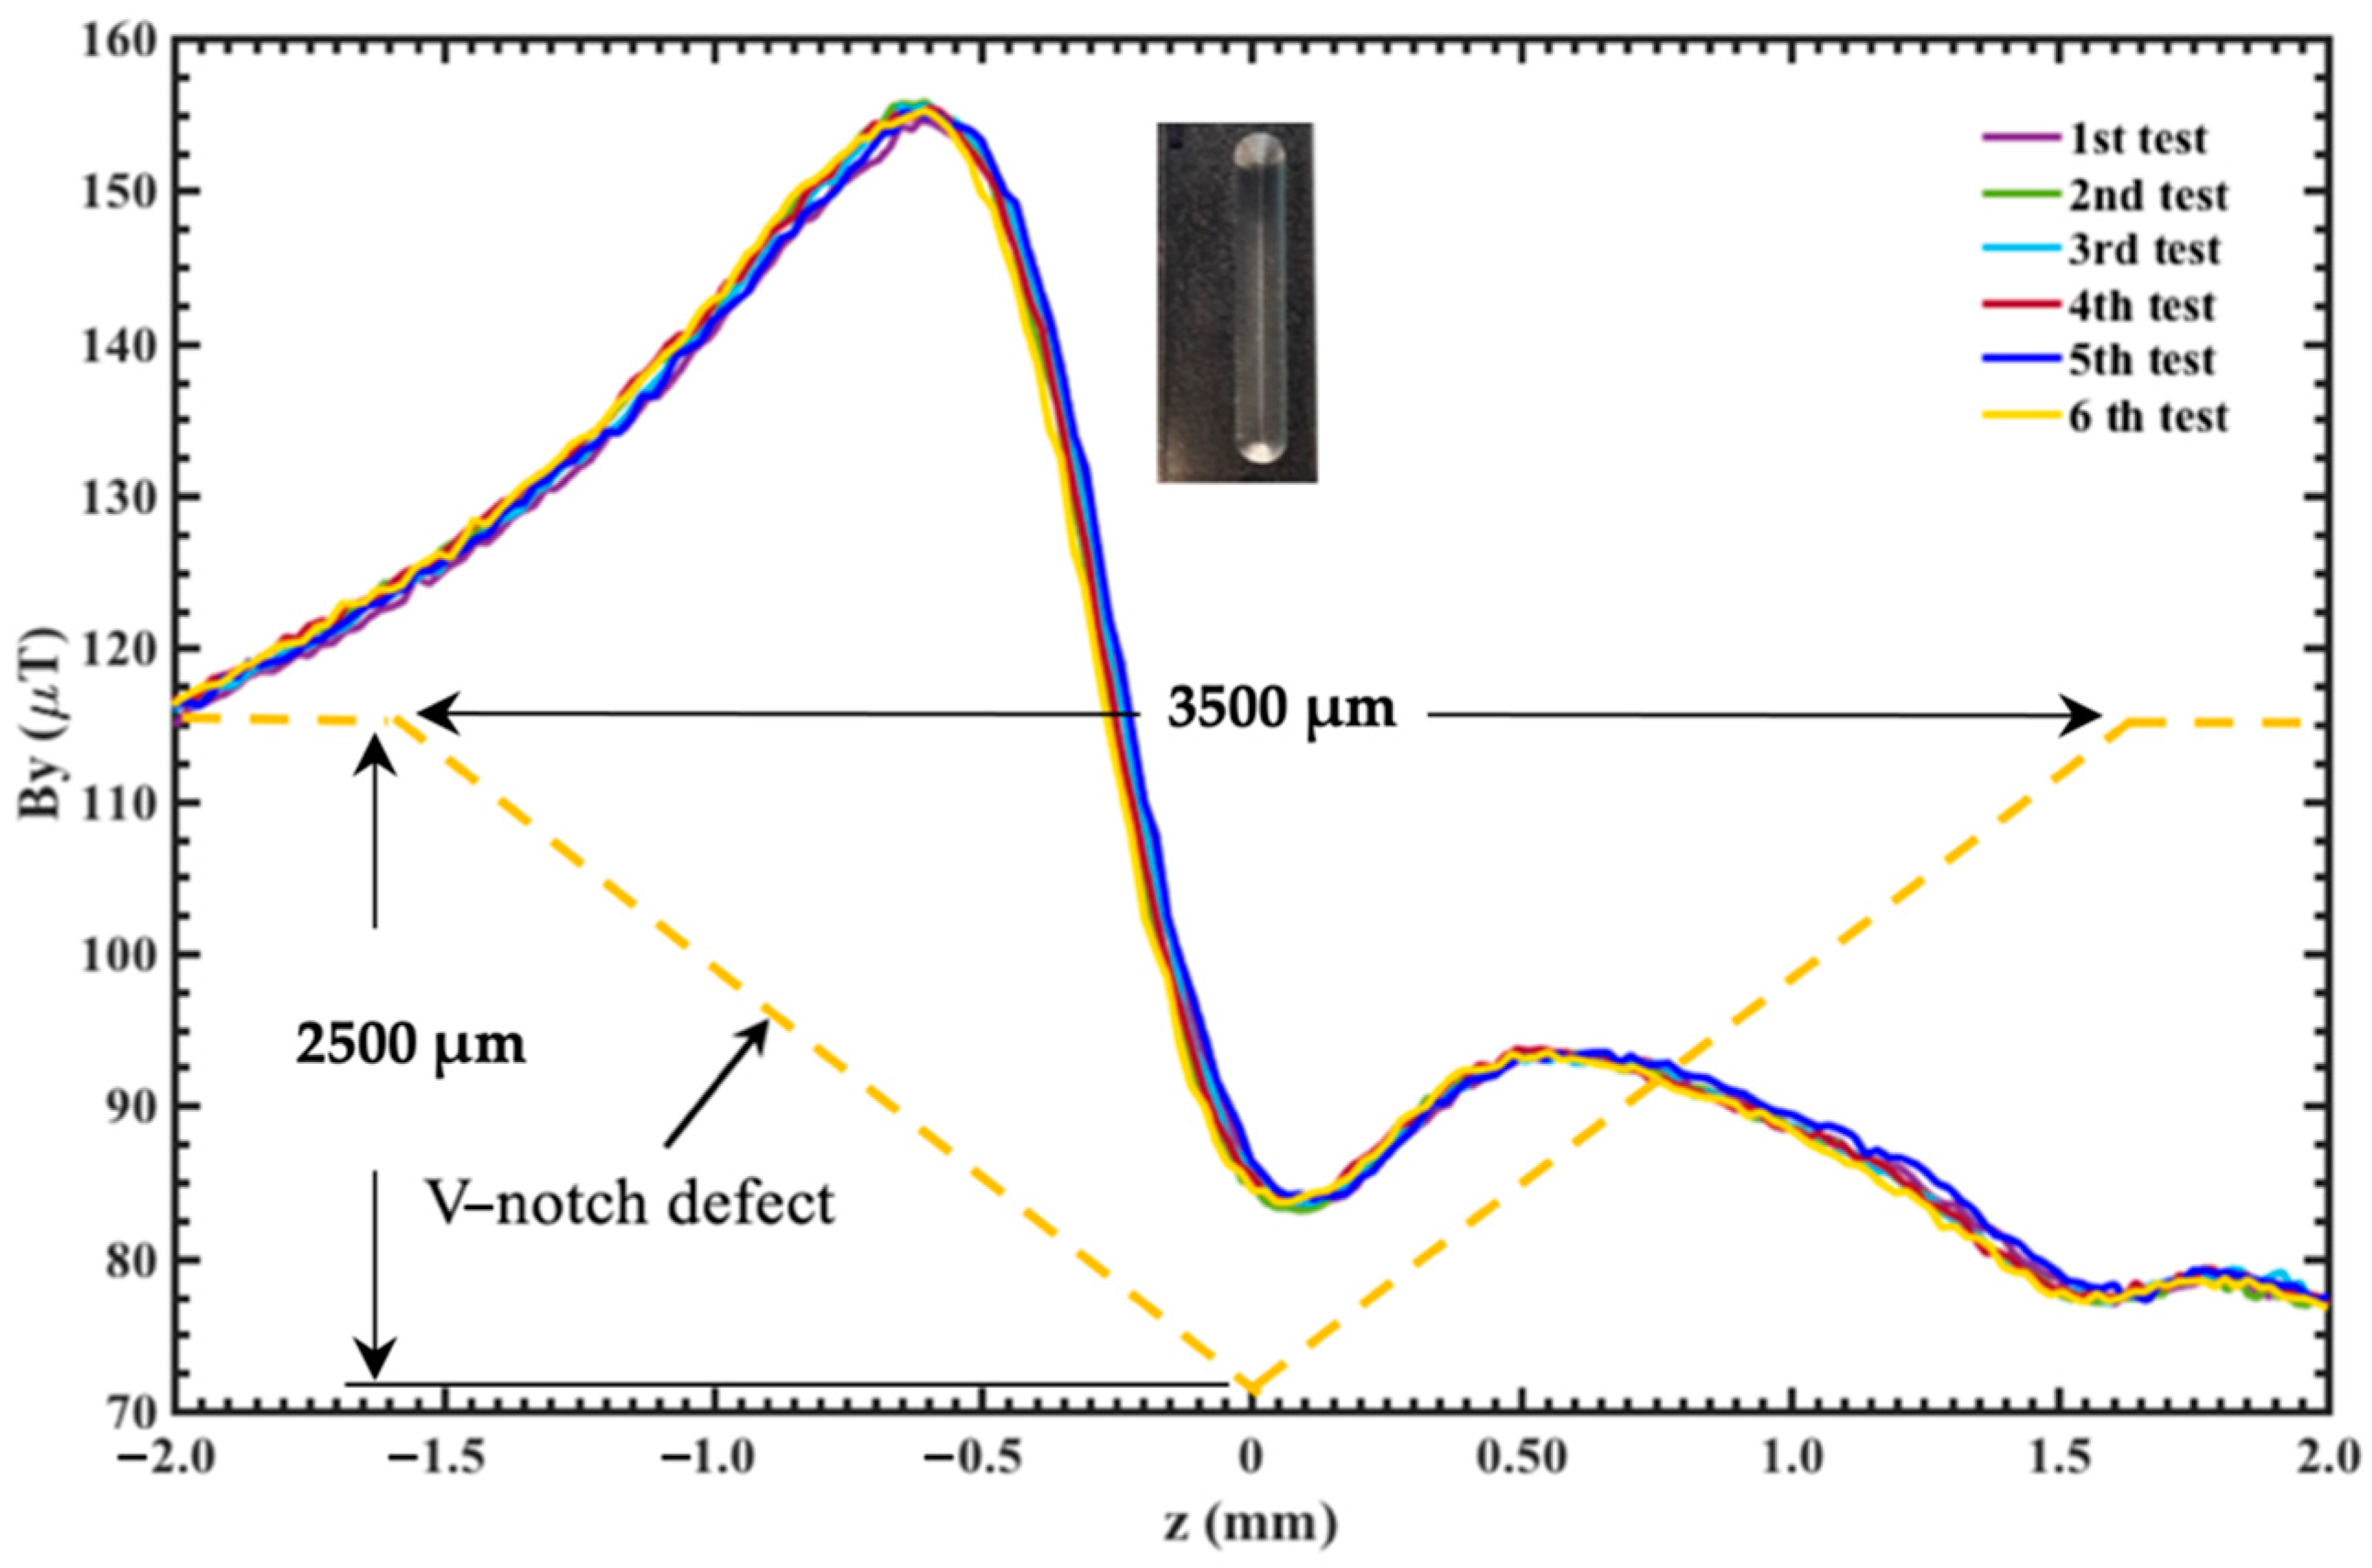
| S5 | 3500.0 | 2500.0 |
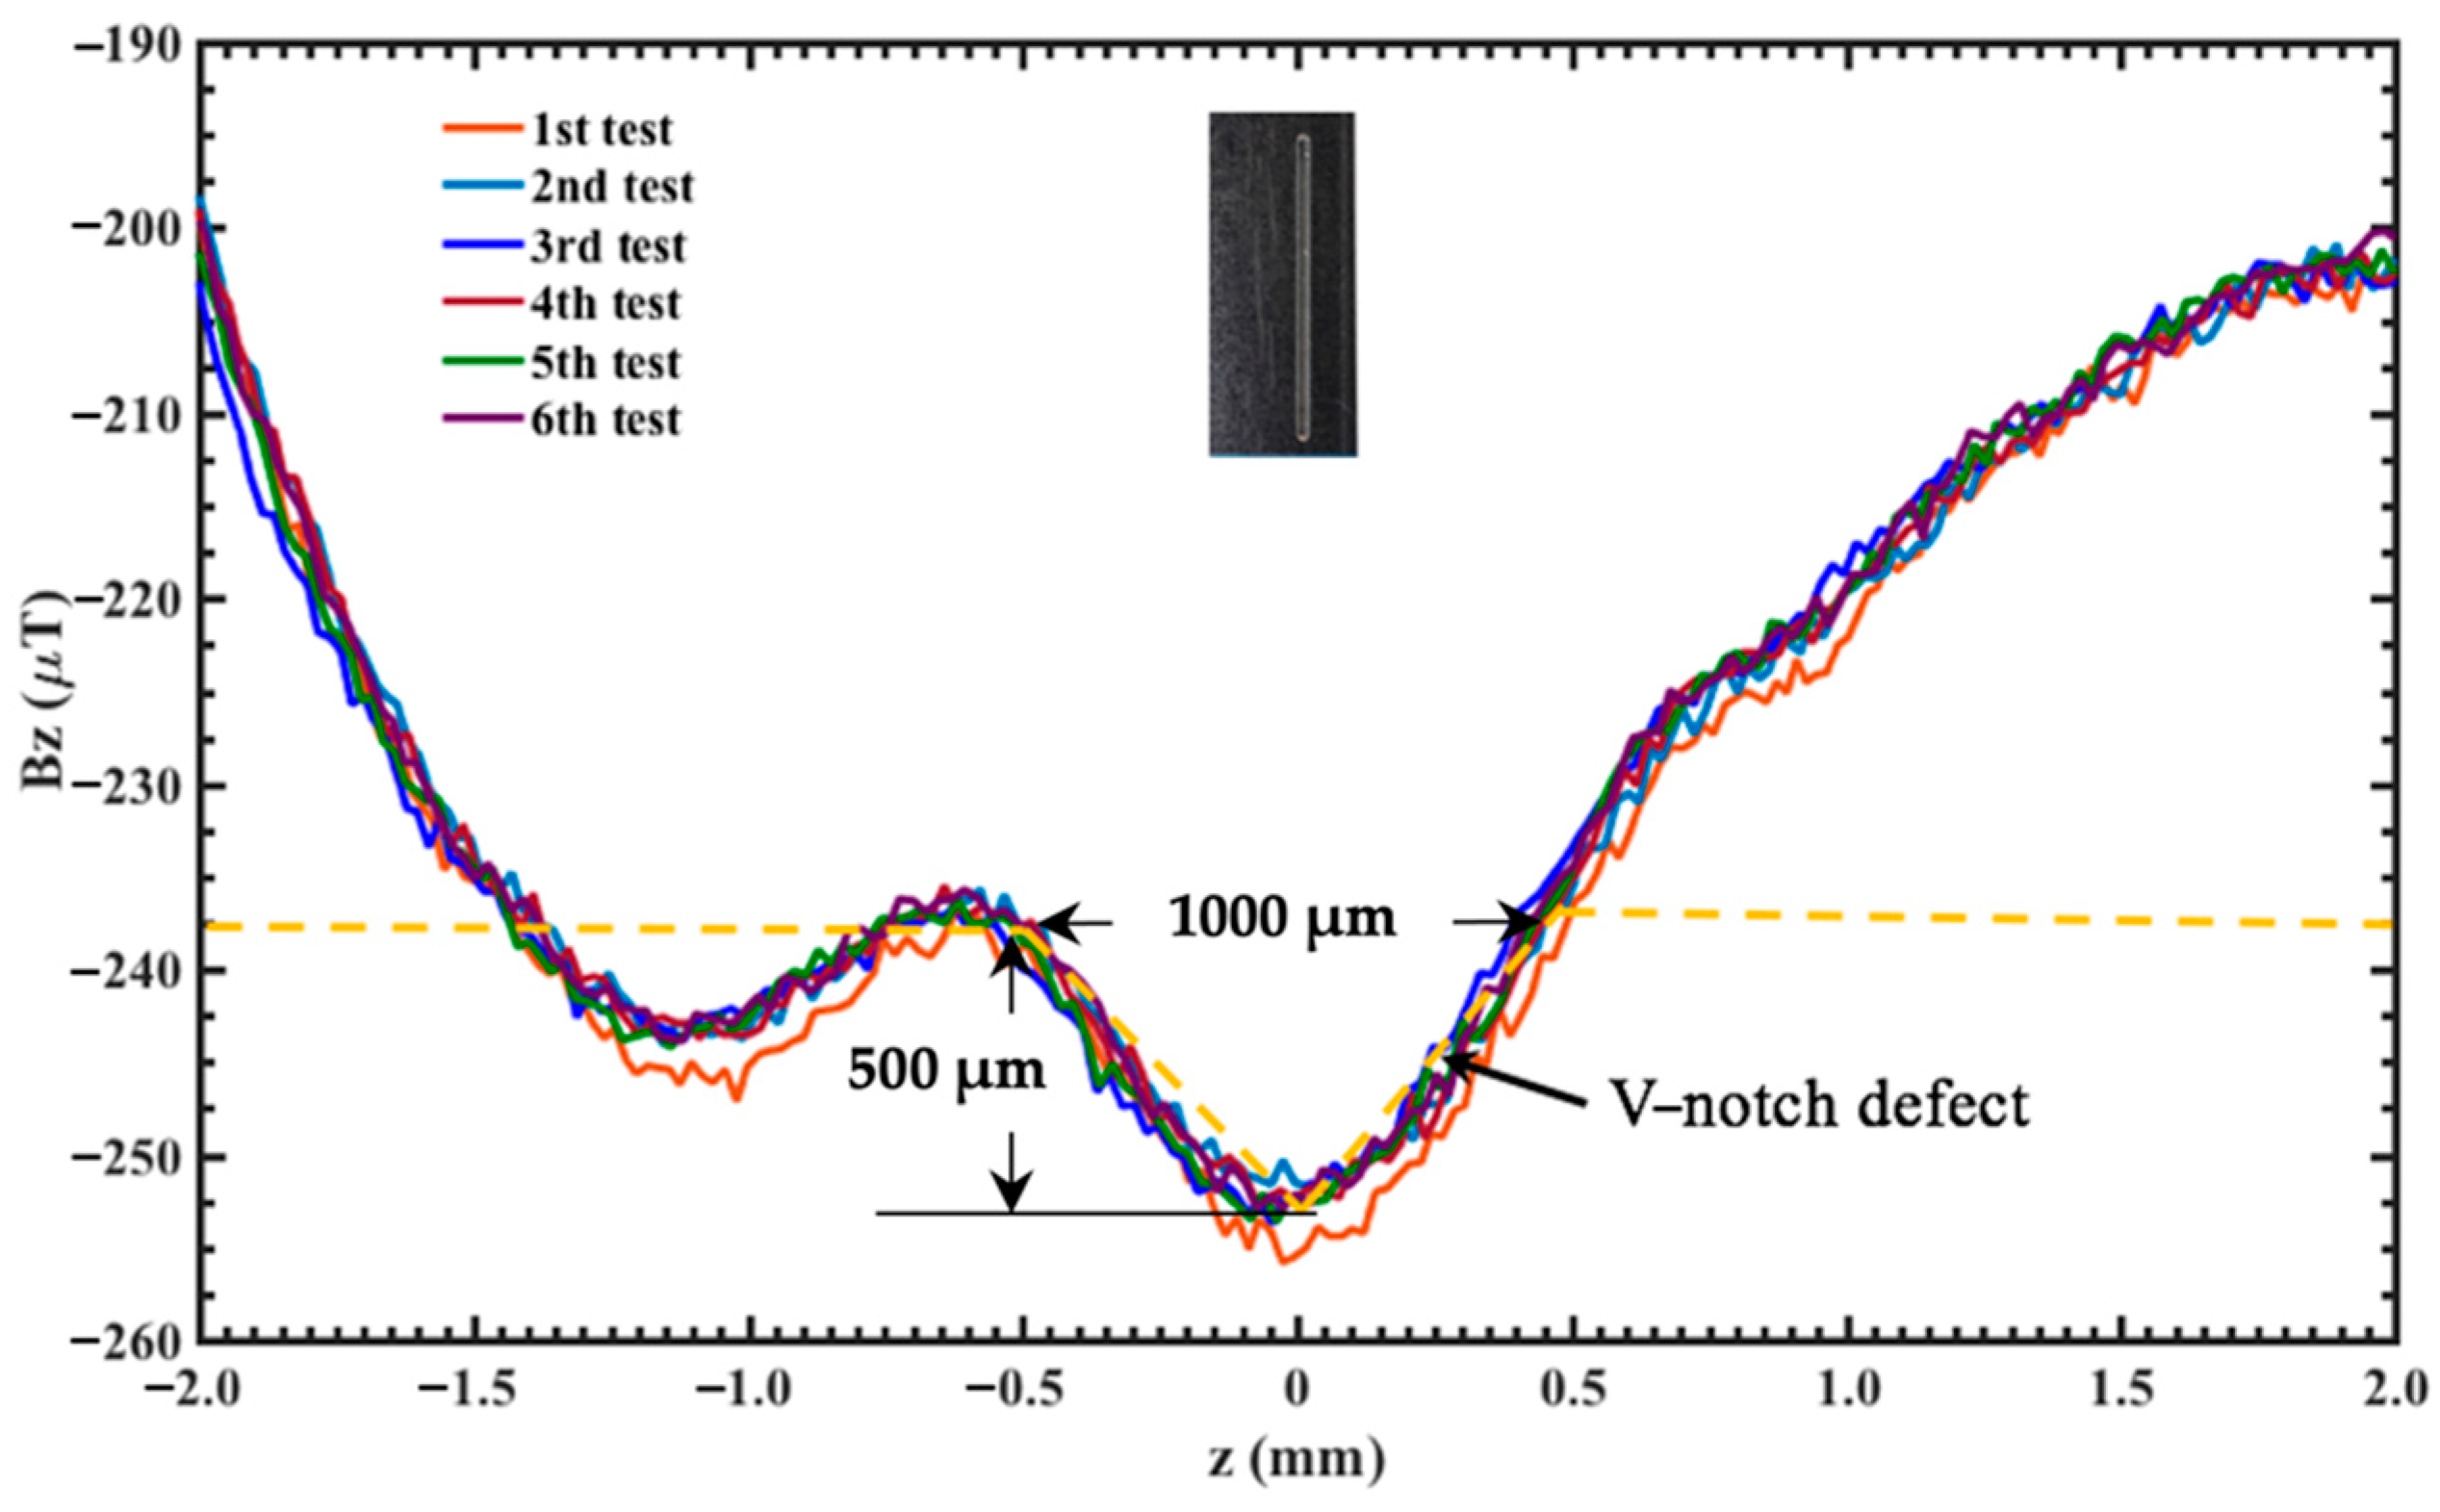
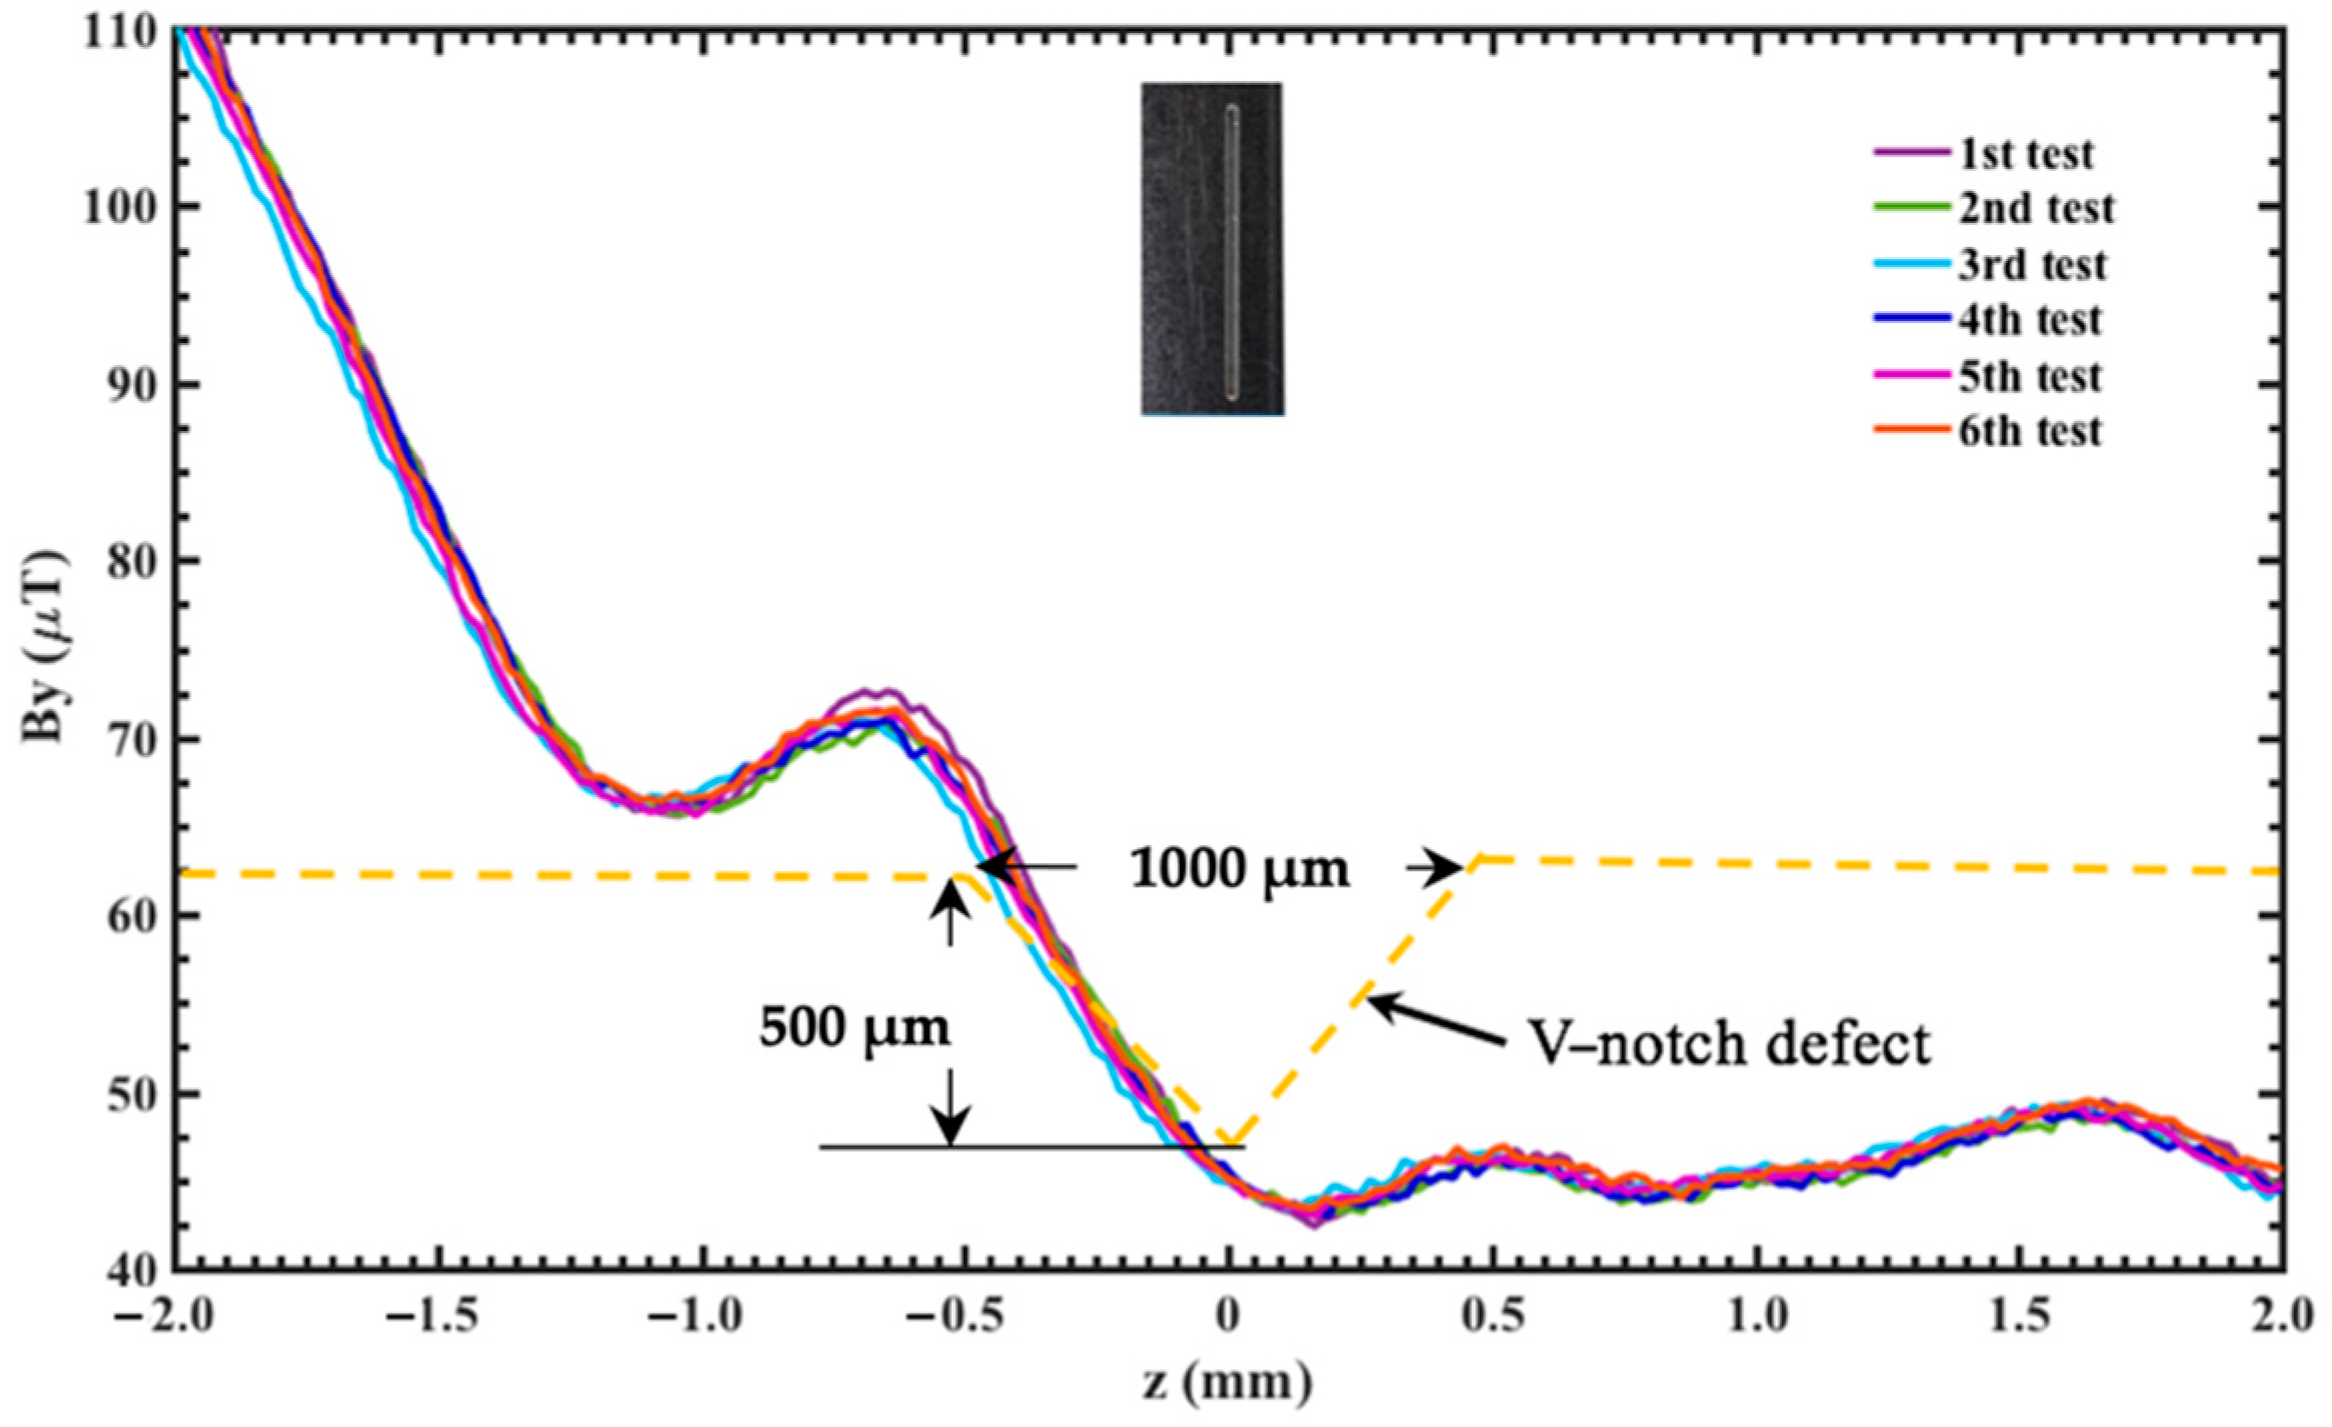
| V-Notch Defect | Minimum Tangential (Bz) MMM Signal around Notch Center (μT) | Maximum Normal (By) MMM Signal around Notch Edge (μT) | Minimum Normal (By) MMM Signal around Notch Edge (μT) |
|---|---|---|---|
| S1 | −252.8 ± 1.39 | 71.2 ± 0.66 | 43.3 ± 0.52 |
| S2 | −224.4 ± 1.31 | 113.8 ± 0.28 | 87.4 ± 0.40 |
| S3 | −202.9 ± 0.90 | 159.3 ± 0.48 | 96.7 ± 0.26 |
| S4 | −162.4 ± 1.33 | 87.1 ± 0.86 | 35.1 ± 0.30 |
| S5 | −157.3 ± 0.94 | 155.2 ± 0.43 | 83.8 ± 0.41 |
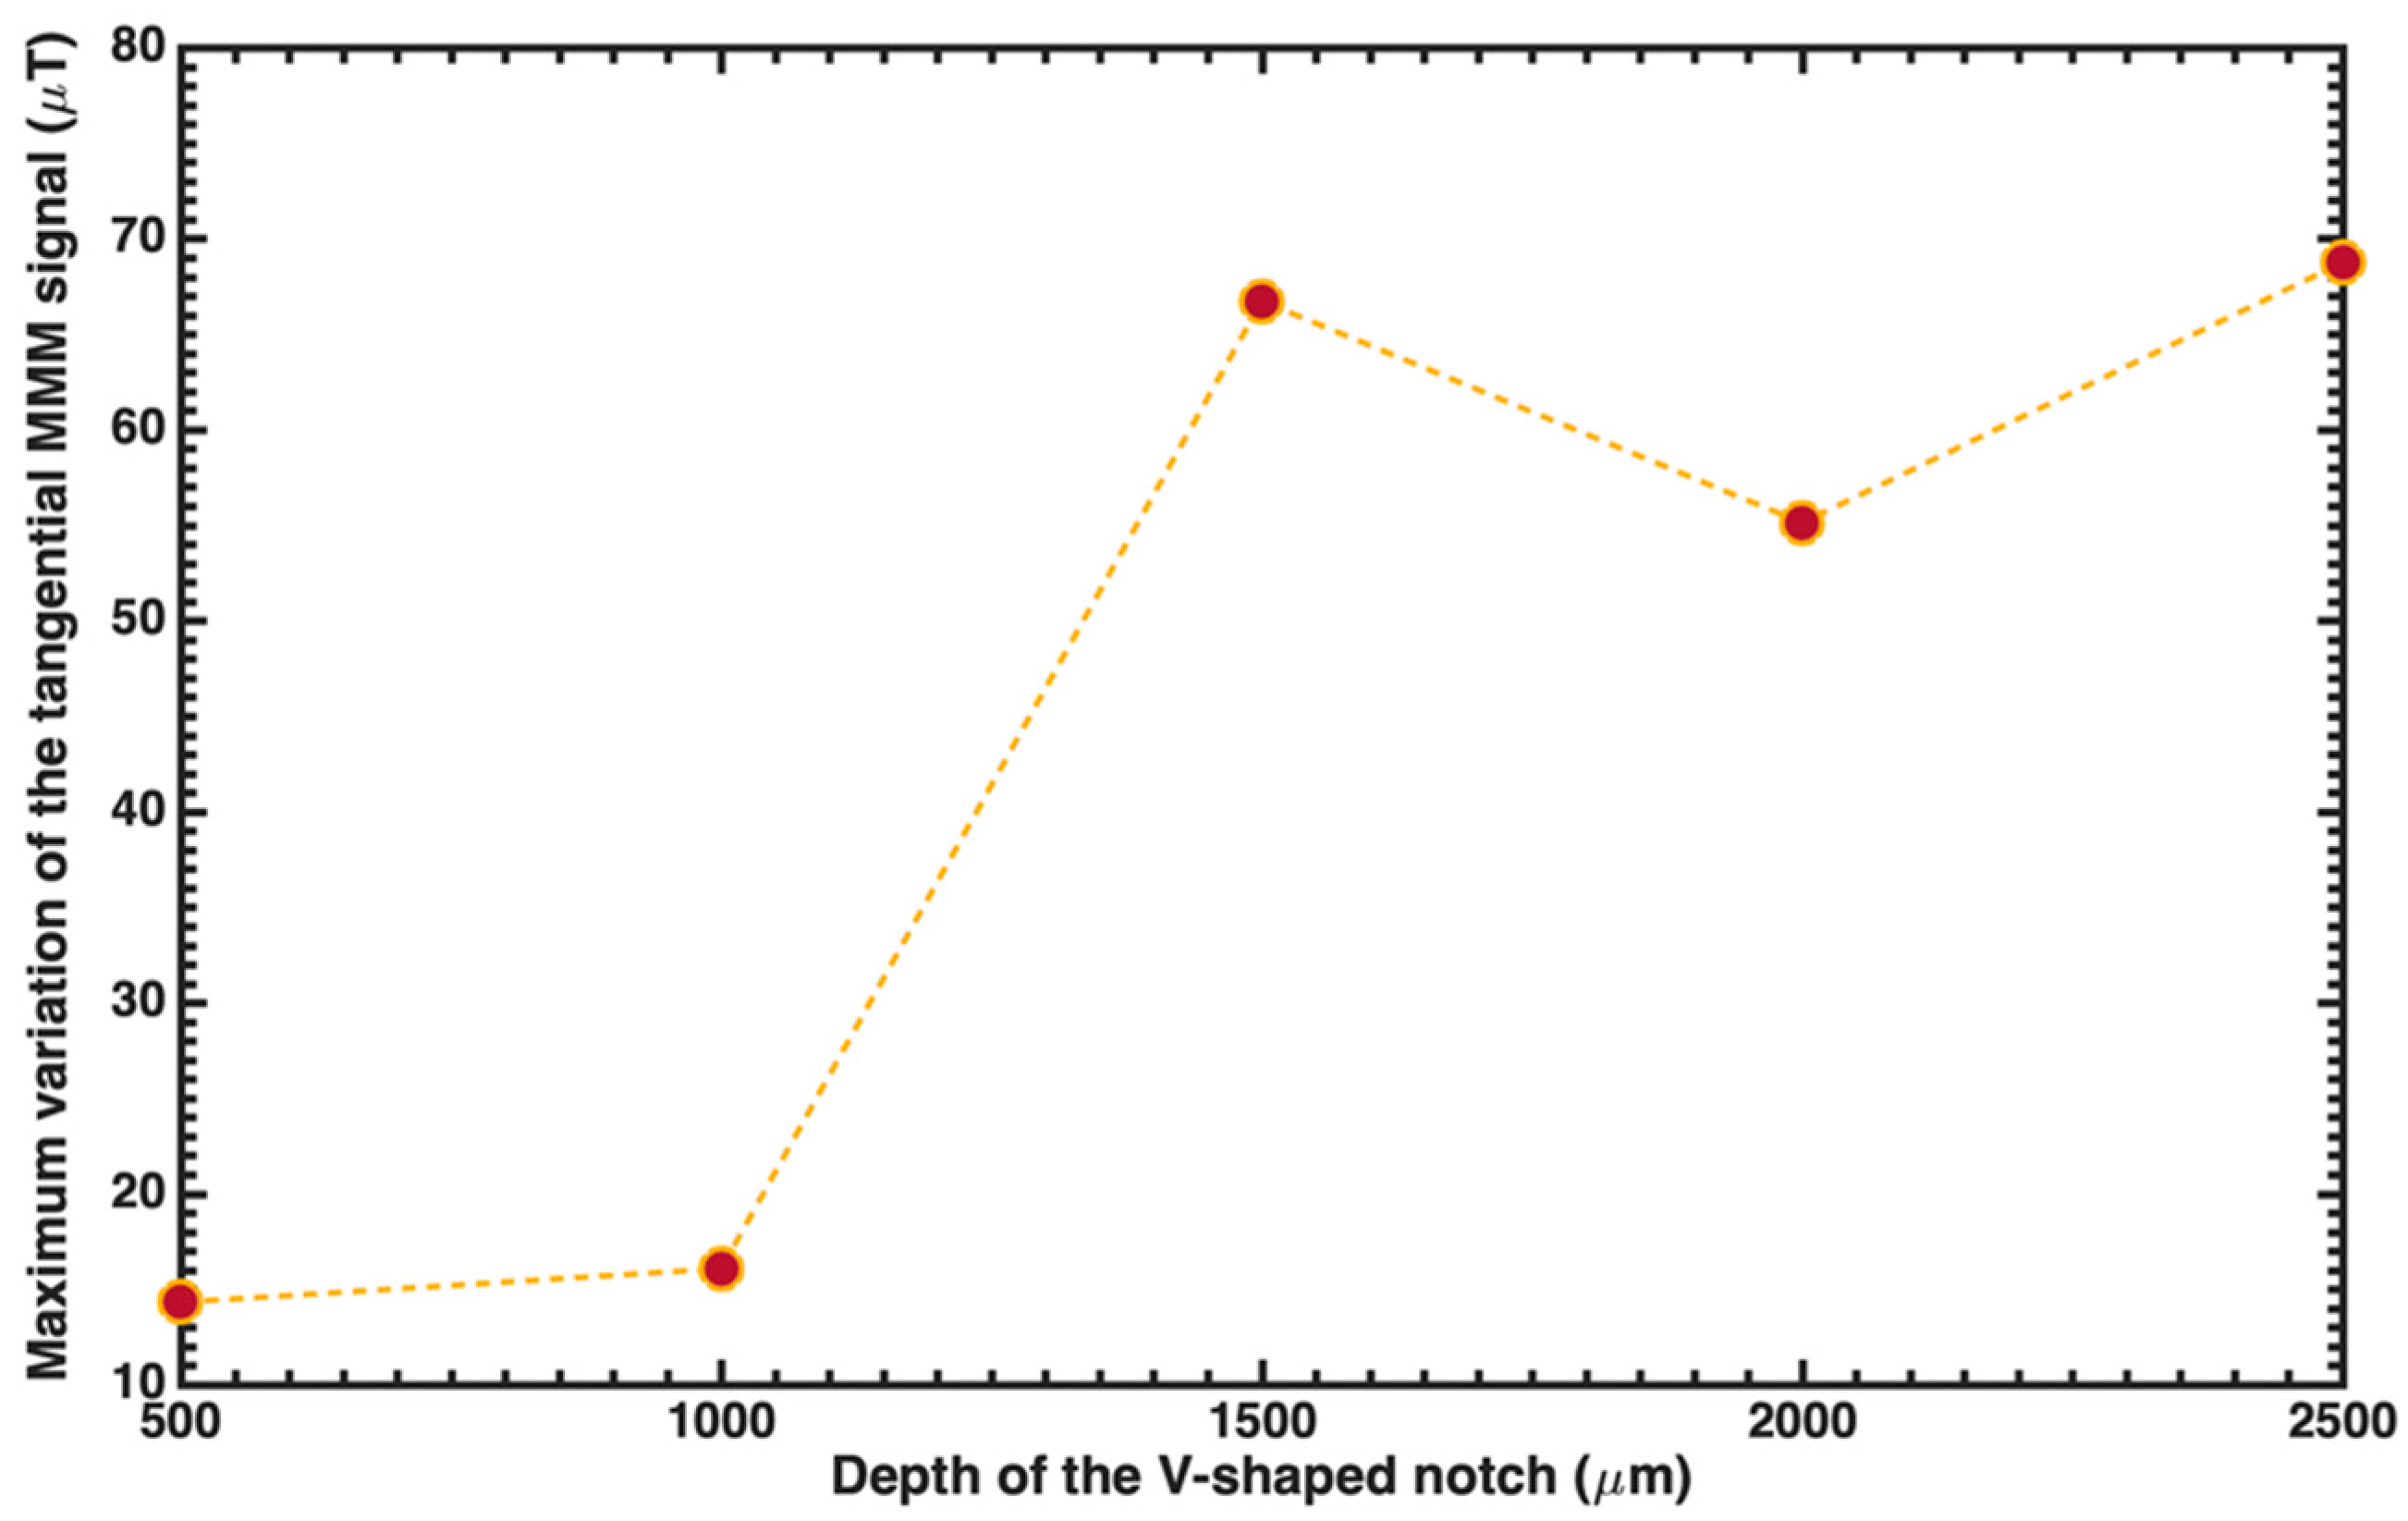
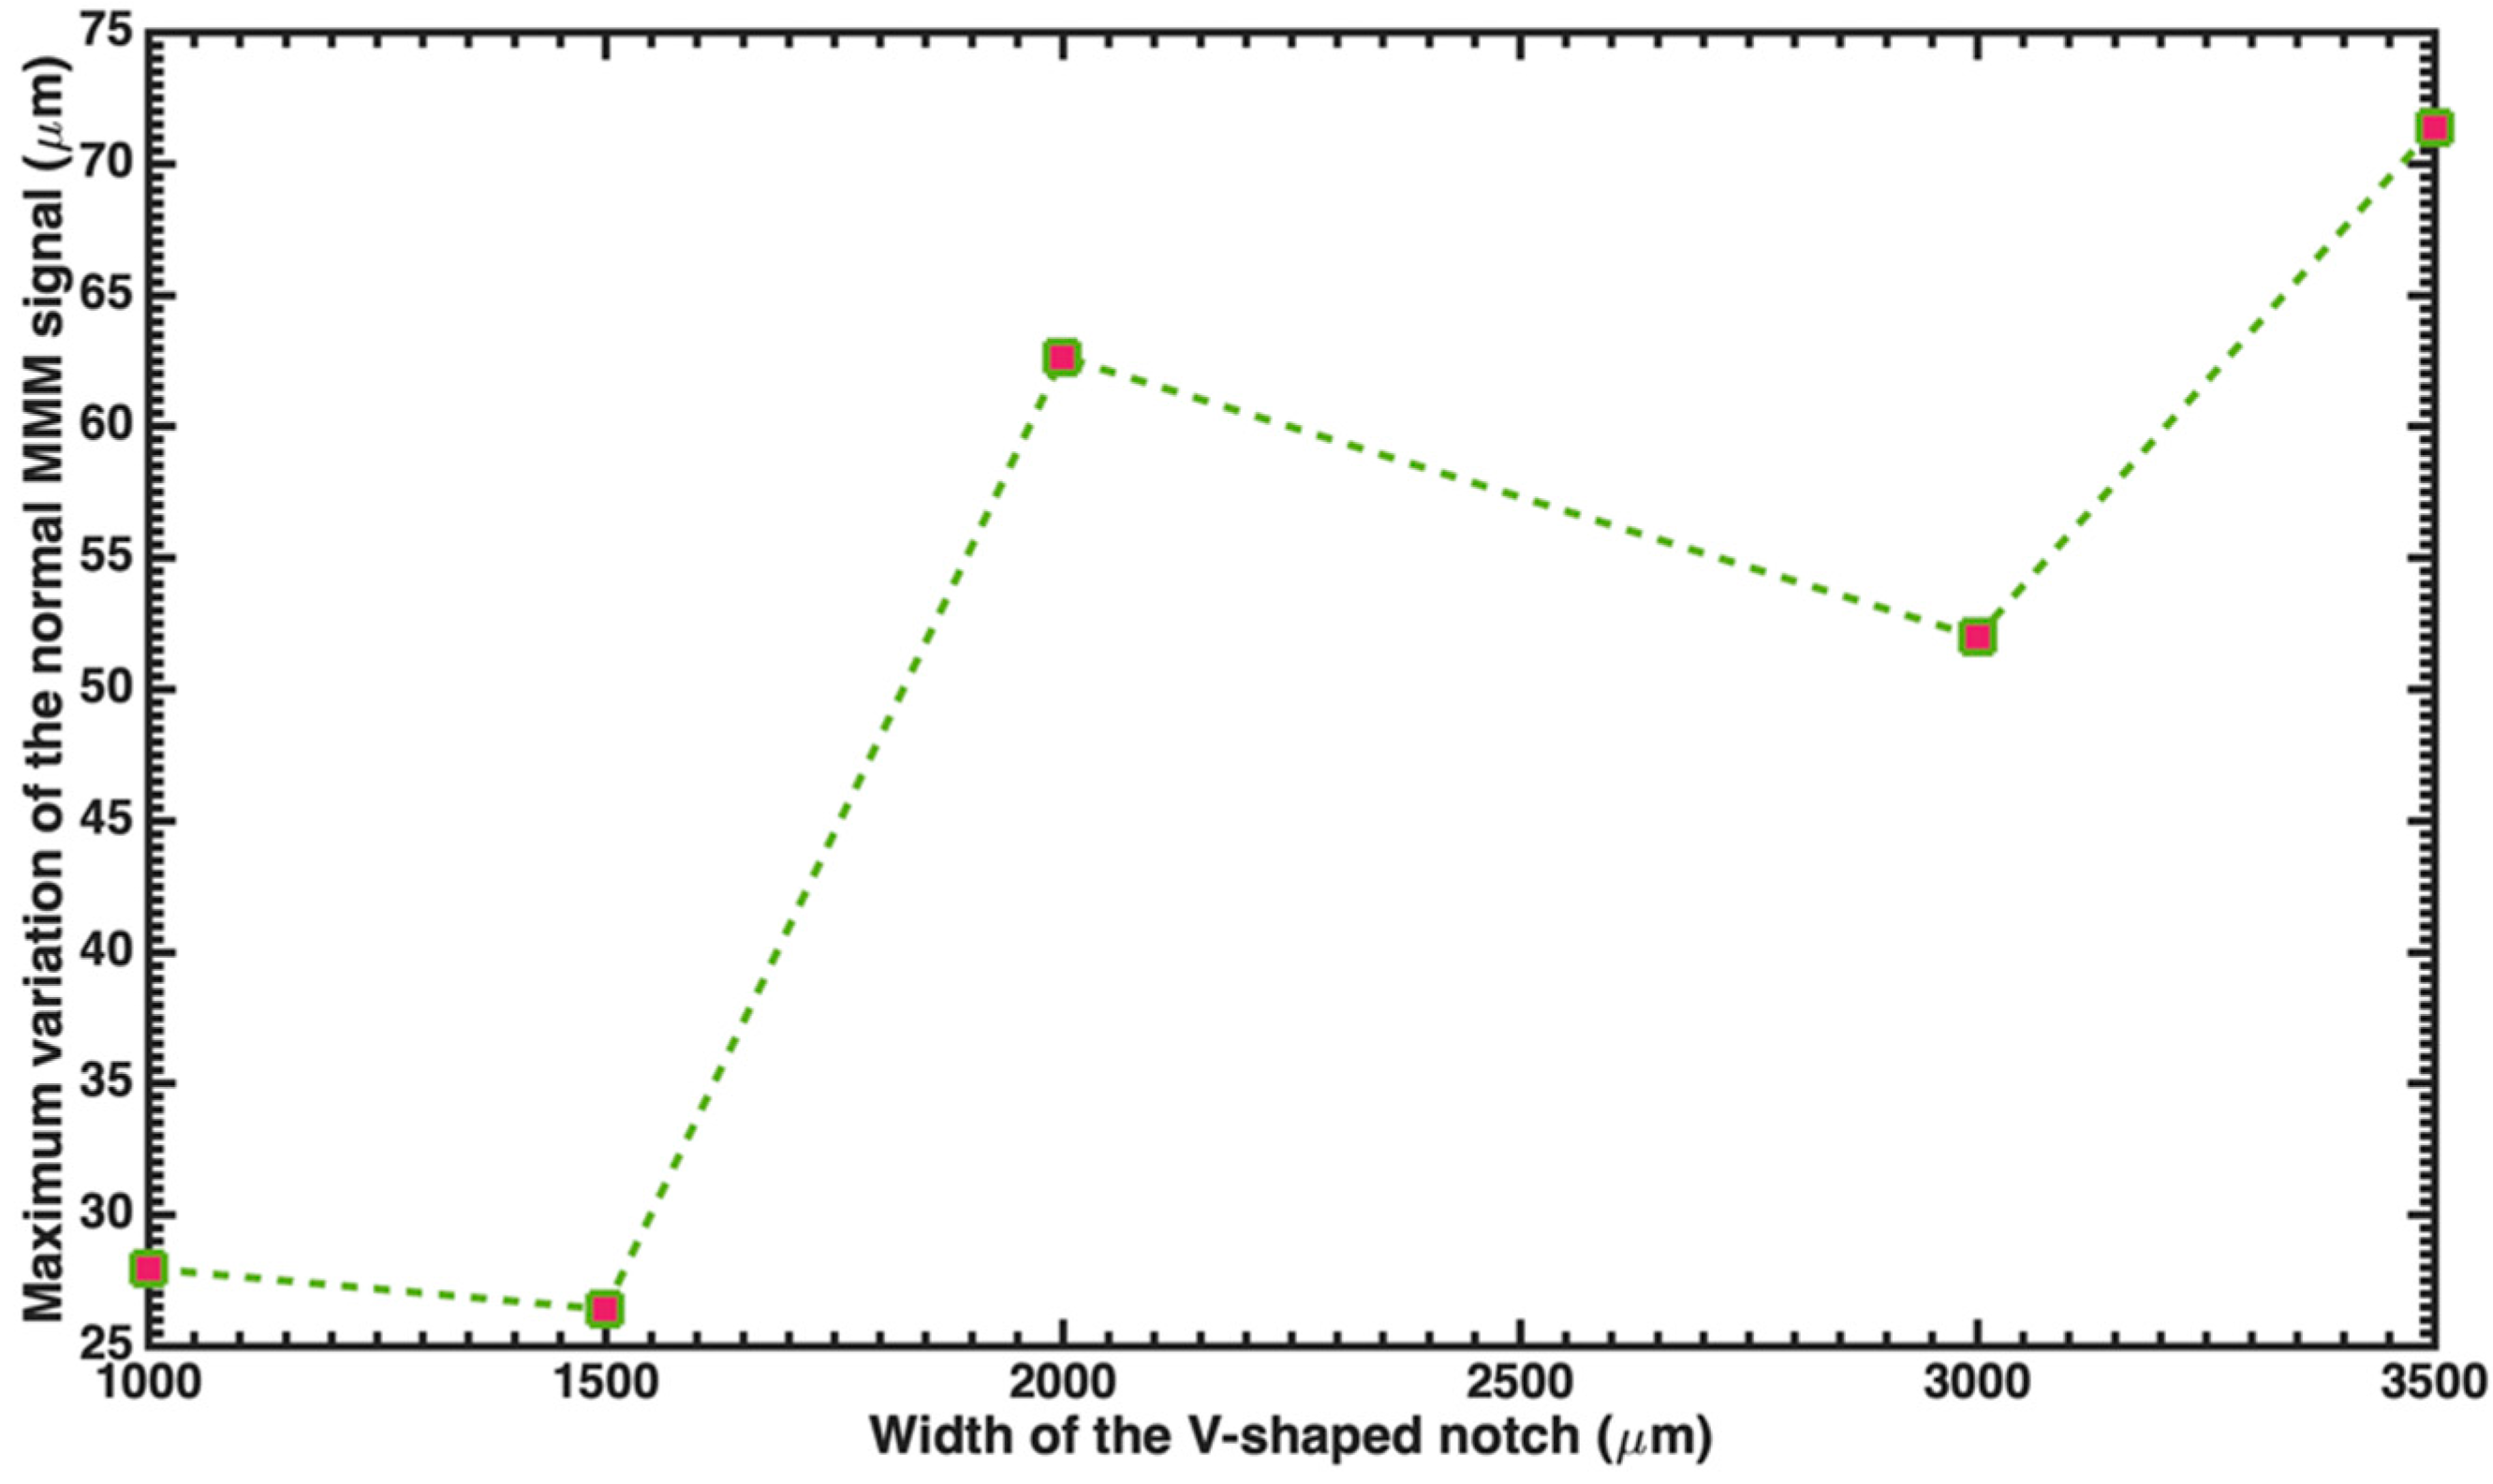
| V-Notch Defect | Maximum Variation (ΔBz) of the Tangential MMM Signal around Notch Center (μT) | Maximum Variation (ΔBy) of the Normal MMM Signal between the Edges of Notch (μT) |
|---|---|---|
| S1 | 14.32 ± 1.62 | 27.95 ± 1.14 |
| S2 | 16.08 ± 1.86 | 26.4 ± 0.54 |
| S3 | 66.73 ± 1.13 | 62.63 ± 0.50 |
| S4 | 55.13 ± 1.33 | 51.98 ± 0.64 |
| S5 | 68.75 ± 1.10 | 71.37 ± 0.72 |
Publisher’s Note: MDPI stays neutral with regard to jurisdictional claims in published maps and institutional affiliations. |
© 2021 by the authors. Licensee MDPI, Basel, Switzerland. This article is an open access article distributed under the terms and conditions of the Creative Commons Attribution (CC BY) license (https://creativecommons.org/licenses/by/4.0/).
Share and Cite
Villegas-Saucillo, J.J.; Díaz-Carmona, J.J.; Escarola-Rosas, M.A.; Vázquez-Leal, H.; Martínez-Castillo, J.; Herrera-May, A.L. Measurements of the Magnetic Field Variations Related with the Size of V-Shaped Notches in Steel Pipes. Appl. Sci. 2021, 11, 3940. https://doi.org/10.3390/app11093940
Villegas-Saucillo JJ, Díaz-Carmona JJ, Escarola-Rosas MA, Vázquez-Leal H, Martínez-Castillo J, Herrera-May AL. Measurements of the Magnetic Field Variations Related with the Size of V-Shaped Notches in Steel Pipes. Applied Sciences. 2021; 11(9):3940. https://doi.org/10.3390/app11093940
Chicago/Turabian StyleVillegas-Saucillo, J. Jesús, José Javier Díaz-Carmona, Marco A. Escarola-Rosas, Héctor Vázquez-Leal, Jaime Martínez-Castillo, and Agustín L. Herrera-May. 2021. "Measurements of the Magnetic Field Variations Related with the Size of V-Shaped Notches in Steel Pipes" Applied Sciences 11, no. 9: 3940. https://doi.org/10.3390/app11093940
APA StyleVillegas-Saucillo, J. J., Díaz-Carmona, J. J., Escarola-Rosas, M. A., Vázquez-Leal, H., Martínez-Castillo, J., & Herrera-May, A. L. (2021). Measurements of the Magnetic Field Variations Related with the Size of V-Shaped Notches in Steel Pipes. Applied Sciences, 11(9), 3940. https://doi.org/10.3390/app11093940