Abstract
An increase in inverter-based resources (IBRs) can lower the inertia of a power system, which may adversely affect the power system by causing changes such as a frequency nadir reduction or an increased initial rate of change of frequency (RoCoF). To prevent this, an ancillary service called fast frequency response (FFR) helps the inertia response by using IBRs. The main resources used in FFR are variable-speed wind turbine generators (VSWTGs) or energy storage systems (ESSs), which can respond quickly through converter control. The control is applied to the frequency regulation service faster than the primary frequency response, so the second frequency nadir may fall below the first frequency nadir. This study proposed a novel coordinated control strategy to efficiently utilize energy to improve the frequency nadir through coordinated control of wind turbines based on permanent magnetic synchronous generators (PMSGs) and battery energy storage systems (BESSs). The simulation results confirmed that the two-bus test system was composed of PSCAD/EMTDC, and the frequency nadir increased by utilizing the same amount of energy as in traditional control systems.
1. Introduction
An increase in the proportion of renewable energy in power systems is planned and expected. Among the types of renewable energy, solar and wind power have the highest proportions of use and potential for renewable energy generation. These are inverter-based resources (IBRs) and have a low contribution to the inertia of power systems. Increasing the number of IBRs will result in the replacement of traditional synchronous generators in power systems, leading to low system inertia [1]. In a low-inertia system, insufficient system inertia increases the rate of change of frequency (RoCoF). This is mainly because photovoltaic devices do not have inertia. Although the variable-speed wind turbine generator (VSWTG) has rotational inertia, it does not affect the system’s inertia because it is decoupled from the system through a converter.
In a traditional power system, a disturbance leads to a frequency decrease, and synchronous generators immediately respond. This generator action prevents further decreases in frequency. Initially, the missing infeed is provided by inertia, and after a few seconds, the generator’s governor response is activated by droop control. However, in a high-IBR system, low inertia leads to a large initial RoCoF, which results in a small margin for the traditional generator governor. In the event of a missing large power supply, the frequency will drop below the reliability standard and a wide-area power failure may occur owing to the operation of the under-frequency relay. To prevent this issue, fast frequency response, which improves the lower frequency and the initial RoCoF through the inertial contribution of IBRs, has been introduced as a new auxiliary service. FFR can improve frequency stability during events with a large initial RoCoF.
VSWTGs and energy storage systems (ESSs) are representative IBRs that can be used as FFR resources [2]. Research has been conducted on the ability of the IBR control of VSWTGs to contribute to system inertia. In some studies, the use of the rotational kinetic energy of a wind turbine using the rotational kinetic energy of a drivetrain through converter control has been introduced [3,4,5]. This control method requires frequency or RoCoF measurements. The electrostatic inertia method uses the capacitor potential energy as inertia by regulating the voltage on the DC-link capacitor in the converter [6]. Suboptimal power point tracking (SPPT) is also a method of mitigation, which generates additional output by changing the operating point from the operating point on the maximum power point tracking (MPPT) curve to a suboptimal point [2,7,8]. Torque limit control, one type of SPPT control, is a control method that instantly maximizes the electrical torque through converter control [9]. Therefore, it is suitable for use in the case of frequency-drop events. The synchronverter method, which provides control similar to that of a synchronous generator, has the advantage that it does not rely on frequency or RoCoF measurements [10].
However, FFR does not always improve system stability. Because FFR reacts as quickly as possible after a frequency drop, the resource may not be used efficiently. In particular, the FFR of a VSWTG sometimes occurs at a second frequency nadir owing to the reduced power to restore the normal operating point of the wind turbine. This study proposed a novel coordinated control strategy for FFR using ESS and permanent magnetic synchronous generator (PMSG)-type wind turbine in order to solve the disadvantage that the second frequency nadir is lower than that of the first frequency nadir. The proposed control strategy utilizes resources efficiently to improve the frequency bottom point rather than responding to the frequency drop as quickly as possible. To verify the effectiveness of the proposed control method, a two-bus system was configured, and a generator dropout accident was simulated based on power systems computer-aided design/electromagnetic transients for DC (PSCAD/EMTDC), which is a time-domain transient simulation tool for power systems. The main contributions of this study are summarized as follows.
- The conventional FFR control does not use energy efficiently from the viewpoint of the frequency nadir because various energy sources are activated simultaneously. In addition, a second frequency nadir may occur, which may reduce the frequency stability. Thus, a novel coordinated control strategy was proposed to improve the nadir frequency by using energy more efficiently than the conventional FFR control.
- FFR has a very fast response; even a small delay will affect the results. Therefore, IBR activation delay, frequency detection delay, and communication delay were applied to the simulation to reflect the actual characteristics of the IBRs.
The remainder of this article is organized as follows. PMSG modeling is demonstrated for the simulation, which is introduced in Section 2. In Section 3, a novel coordinated control strategy for PMSGs and battery energy storage systems (BESSs) with fast frequency response is proposed. Finally, the simulation results and discussions are presented in Section 4 and Section 5.
2. Modeling of PMSG
A dynamic model of a 7 MW wind turbine based on a PMSG was designed. Figure 1 shows the configuration of a PMSG-type wind turbine system.
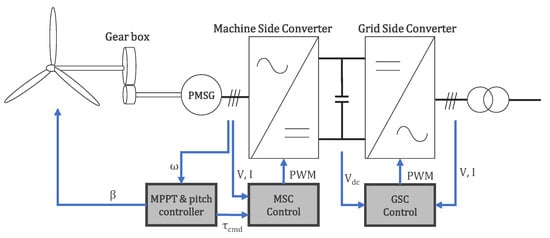
Figure 1.
Configuration of the PMSG-type wind turbine.
2.1. Wind Turbine Model
The mechanical power from wind captured by the wind turbine is given by
where ρ, R, , , λ, and β are the air density, rotor radius of the wind turbine, wind speed, power coefficient, tip speed ratio, and pitch angle, respectively. The tip speed ratio λ is the ratio of the blade tip speed to the wind speed. As in [11], the power coefficient , which is a function of the pitch angle and tip speed ratio, can be expressed as
with
The mechanical drivetrain of the wind turbine is represented as a two-mass shaft model, as shown in Figure 2. The wind turbine side torque, , which is the aerodynamic torque from the wind turbine rotor, and the generator side torque, , from the permanent magnetic synchronous generator act in opposition to each other. The torque equations of the mechanical drivetrain are:
where , , , , , , , , and N are the moments of inertia of the wind turbine rotor and generator, wind turbine rotor and generator speed, angular position of rotor and generator, equivalent damping and stiffness of the two-mass model, and gear ratio, respectively.
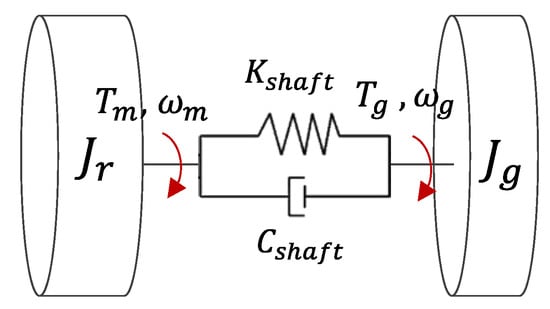
Figure 2.
Drivetrain based on the two-mass shaft model.
2.2. Control Scheme of the Machine Side Converter
The wind turbine generator based on a PMSG had a back-to-back converter, including a machine-side converter and a grid-side converter. Owing to the converter, a PMSG-type wind turbine generator can operate at variable wind speeds and perform the MPPT operation. The MPPT control operates at the tip speed ratio where the power coefficient can operate at its maximum. The power of the MPPT is expressed as
where is the maximum power coefficient and is the optimal tip speed ratio, which provides the maximum power coefficient. In this study, according to (2), was 0.48, was 10.3, and the constant was 0.6834. The torque of the MPPT is expressed as a quadratic function of .
The electromagnetic torque of PMSG is given by
where , , and are the pole pairs of the PMSG, the flux linkage of the permanent magnet, and the quadrature axis current, respectively. Using (7), the machine-side converter can control the MPPT operation. In this study, the stable operating range of was from 0.55 pu to 1.0 pu and the stable operating range of was 0 pu to 1 pu, as shown in Figure 3. When the maximum rotor speed is reached, there is no longer a rotor speed increase in the transition section.
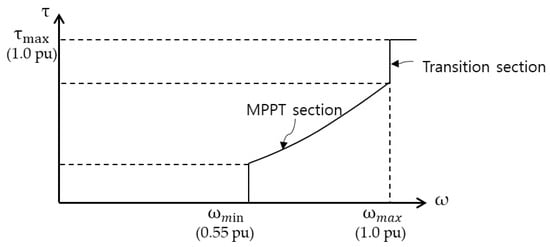
Figure 3.
Torque–rotor speed curve on the MPPT.
2.3. Torque Limit Control of PMSG
Figure 4a shows the control strategy consisting of three sequential steps, indicated by the red line. The first step is the additional output activation step (A-B-C), the second step is the deloaded operation step (C-D-E), and the final step is the recovery rotor speed step (E-F-A). In step A-B-C, the operating point is larger than the mechanical power ; thus, the rotor speed decreases during operation, which results in the extraction of rotational kinetic energy from the drivetrain. Therefore, it is necessary to restore the rotor speed to the MPPT operating point. For this recovery, the operating point is lowered below in step C-D-E. When the operating point is lower than , D-E becomes the acceleration step, and the rotor speed increases. As the rotor speed increases, it meets the MPPT curve (point F) and performs the MPPT operation.
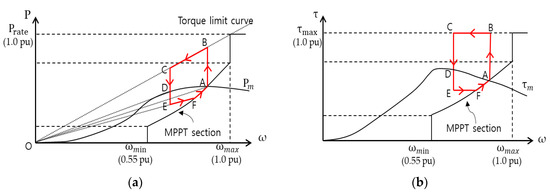
Figure 4.
Proposed control operation on the MPPT curve: (a) power–rotor speed curve; (b) torque–rotor speed curve.
The wind turbine generator based on the PMSG controls torque via a machine-side converter; the torque–rotor speed curve for a simple control strategy is shown in Figure 4b. The electrical torque will be at its maximum value during the deceleration period, that is, the step in which rotating energy is released. In the acceleration period, the electrical torque will decrease to below point D. The electrical torque necessary for the rotor speed to recover is shown in Figure 4a. This must be lower than the OD slope, that is, the torque at point D, and for constant torque control, it must be lower than the OA slope. Therefore, the electrical torque must be set to a value lower than that of point A, as shown in Figure 4b. The rotor speed can decelerate to , but the greater the deceleration, the longer the recovery period. Therefore, in this study, the deceleration period was set to 3 s.
3. Control Strategy in Fast Frequency Response
3.1. Fast Frequency Response
In traditional frequency regulation, low inertia systems have a low frequency nadir owing to the large initial RoCoF, which can adversely affect system stability. As renewable energy sources expand, system inertia inevitably decreases because of the increase in IBRs. To solve these system stability problems, North American Electric Reliability Corporation (NERC) introduced the FFR concept, and Electric Reliability Council of Texas (ERCOT) applied the FFR ancillary service in 2020 [12].
FFR is an ancillary service that allows IBRs to inject or absorb active power in a power system by detecting frequency deviations to improve the frequency nadir or initial RoCoF. FFR utilizes IBRs that can respond quickly when a frequency drop occurs, so it has the advantage of being slower than an electromagnetically connected inertial response but faster than a primary frequency response operating through a droop. FFR is a reaction that uses a power electron device rather than a mechanical reaction, so the activation time is very fast. However, because it is not physically connected to the power system, frequency and RoCoF measurements are required, a process which results in delays in measurement and communication. RoCoF calculation using differentiation is difficult and error-prone. In this study, the RoCoF calculation is given by
where and are frequency at time t and frequency 0.05 s before t.
To activate wind turbine resources for FFR, the wind turbine provides additional output power by utilizing the rotational energy of the drivetrain or the potential energy of the DC-link capacitor of the converter. Photovoltaic systems can be used as an FFR resource along with ESSs.
Types of conventional FFR control include proportional frequency deviation and RoCoF, input of a certain amount of active power when reaching deadband, reduction in proportional frequency deviation and RoCoF load, and reduction in a certain amount of load when reaching the deadband. These methods do not perform coordinated control between multiple resources but, rather, cooperative control for efficient resource utilization, because they activate resources simultaneously when a frequency drop for each resource is detected.
Table 1 shows examples of activation times for various resources in [13]. In addition, Table 2 describes the detection and communication delay for frequency and RoCoF detection in [14]. In this study, we configured a delay of 0.06 s on the frequency meter to reflect the measurement and communication delay time and a delay of 0.05 s on the converter controller to reflect the activation delay.

Table 1.
Activation time for various resources.
Table 2.
Frequency/RoCoF detection and signaling time.
3.2. Novel Coordinated Control Strategy (NCCS)
FFR using a wind turbine achieves a fast response using a converter; in the case of a control method that generates a temporary output according to the frequency deadband, the maximum output of the IBRs is activated, so the frequency nadir is boosted dramatically and the initial RoCoF is reduced dramatically. As a result of the quick response and the period required for the recovery of the wind turbine, a second frequency dip may occur. Therefore, in this study, we proposed a coordinated control method that could improve the lowest frequency by preventing the secondary frequency drop during FFR control and by efficiently utilizing resources.
In general FFR control logic, when the frequency deadband is reached, additional output of the wind turbine and BESS output are simultaneously activated, which is highly likely to cause a second frequency dip owing to the recovery period of the wind turbine. If the FFR resources are activated at the same time, the secondary frequency dip due to wind turbine recovery is likely to be lower than the first frequency nadir. By activating the ESS near the first frequency nadir point, the lowest frequency point can be improved. When the BESS is activated near the first frequency nadir, the value of the first nadir is lower than that of the existing method, which increases the droop response of the synchronous generator and improves the second frequency dip. Figure 5 illustrates the concept used to improve the frequency nadir. In the conventional method, when an event occurs at time , the FFR resources of the wind power generator and ESS are activated at , which is the time when the frequency deadband is reached. However, when the FFR of the ESS is activated at close to the first frequency nadir point, the droop response of the synchronous generator increases compared to the conventional method and the second frequency is improved.
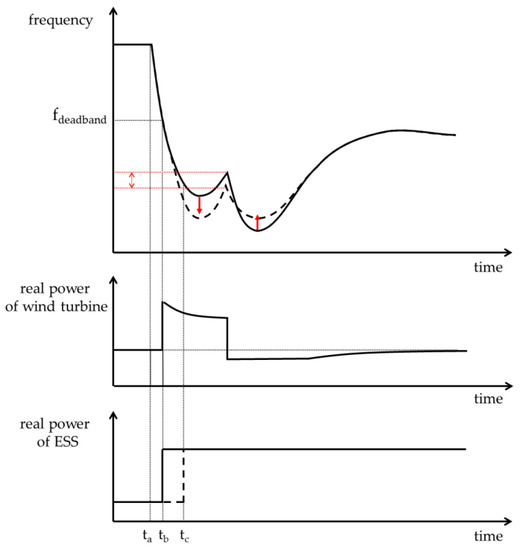
Figure 5.
Concept used to improve frequency nadir.
IBRs are capable of quick response through converter control, so outputting near the nadir point is the most efficient way to improve the lowest frequency. Even if the first frequency nadir is lowered, the lower second frequency nadir can be increased, so it is efficient to output the BESS output near the nadir point to improve the overall lowest frequency.
From the perspective of RoCoF, after the inertial response of the synchronous generator, the FFR of the wind turbine is activated, and the RoCoF increases with a gentle slope. In this study, we proposed the RoCoF constant α to inject the BESS output before the RoCoF reaches zero, that is, before reaching the frequency nadir. α was determined by the system inertia and the amount of FFR that could be output. In the case of a system with large inertia, the initial RoCoF appears smaller when a disturbance occurs compared to a system with a small inertia, and the recovery speed of RoCoF is also slow, so α was determined as a large value, and vice versa. In addition, the value of α can be changed according to the amount of FFR that the ESS can output. Figure 6 shows relationship between RoCoF and the constant α. In this study, the optimal value was determined through repeated preliminary simulations.
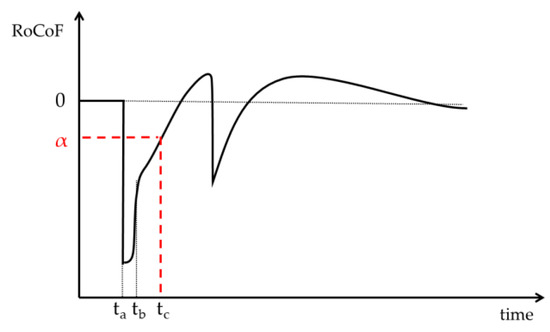
Figure 6.
RoCoF and RoCoF constant α.
The second frequency dip occurs when limited resources are rapidly exhausted or during the recovery period in the wind turbine generator. To prevent the second dip, there is a way to reduce the amount of additional power generated by the wind turbine, but this approach does not utilize resources efficiently, so the wind turbine generator should produce the maximum additional power after reaching the frequency deadband. Instead, the output of the BESS is set to a frequency deadband different from that of the wind turbine and reacts when it reaches the specified RoCoF. In this way, the initial RoCoF can be increased, but a second frequency dip can be avoided, and resources can be used efficiently.
Figure 7 illustrates a flowchart of the proposed NCCS. The NCCS indicates coordinated control between the wind turbine generator and BESS for FFR control in the case of a frequency drop, and efficient resource utilization for the purpose of increasing the frequency nadir. First, when the frequency falls beyond a certain value, the FFR of the PMSG is activated, and when the deceleration period reaches the specified time, the output is reduced through torque control of the converter. When the rotor speed recovers through the acceleration section and the operating point reaches the MPPT curve, the operation is followed by MPPT. In the case of the BESS, the response is not due to the frequency deadband, but to the RoCoF. When a specific RoCoF is reached, the FFR of the BESS operates. This is not an RoCoF proportional control method, but a constant power control method. This is to improve the frequency nadir by operating the BESS when RoCoF is low, that is, when it reaches the frequency nadir.
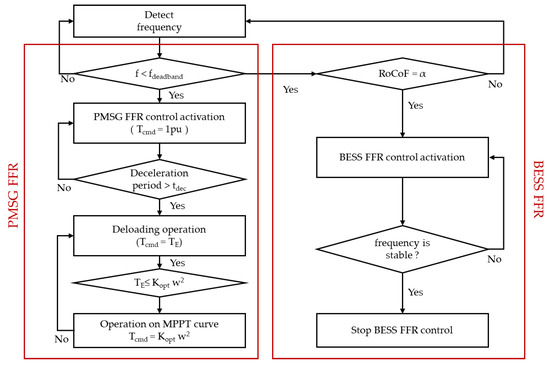
Figure 7.
Flowchart of the proposed NCCS.
4. Test System and Simulation Results
4.1. Configuration of Test System
The test system for verifying the NCCS was built in PSCAD/EMTDC. Figure 8 shows the small-scale grid model, which consisted of a PMSG-based wind turbine, a BESS, two synchronous generators, and a static power load of 30 MW and 3.4 MVAR. The synchronous generators were based on a thermal power plant with an IEEE-type generic steam turbine model, an approximate mechanical-hydraulic control governor model, and a type 1 excitation system [14,15,16,17,18]. The inertia constants of 50 MVA (SG #1) and 10 MVA (SG #2) were 6.0 s and 4.5 s, respectively. The droop coefficient of all synchronous generators was set to 5%. The initial operating points of each generator were 0.4 pu and 1.0 pu, respectively. The capacity of the PMSG-type wind turbine was 7 MW with a wind speed of 8 m/s, which can generate an output of 3.3 MW. The capacity of the BESS was 3 MWh, and the BESS included a 2 MW converter with an initial state of charge (SoC) of 0.5.
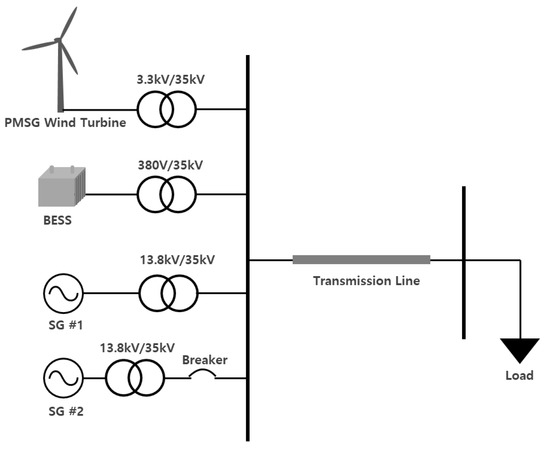
Figure 8.
Configuration of the test system.
4.2. Simulation Results
To evaluate the effectiveness of the proposed method, we simulated the cases of no control, of the FFR operating only the BESS, of the FFR operating the BESS and PMSG-type wind turbine, and of the FFR operating with the proposed control. A typical FFR control scheme injects real power when reaching the deadband. The BESS produces its maximum output, and a wind turbine based on PMSG performs torque limit control. For frequency events, SG #2 generating 10 MW tripped out within 20 s in all cases, resulting in a severe frequency drop due to transient power imbalance.
The NCCS does not set the specified RoCoF constant α. This is because α may vary depending on the activation and communication delay of the IBRs and the inertia of the system. Figure 9 shows the simulation results for changing α. The α values close to zero are too late to improve the lowest frequency, and the α values too far from zero do not effectively prevent secondary frequency dip. In this test system, α was set to −0.45. Figure 10 shows the RoCoF when only the PMSG responds to the FFR.
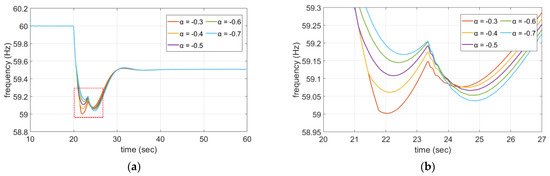
Figure 9.
Proposed NCCS results according to constant α change: (a) system frequency; (b) system frequency (enlarged view).
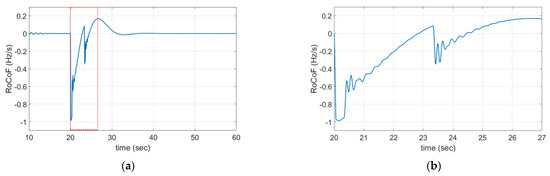
Figure 10.
FFR with only the PMSG control: (a) the RoCoF; (b) the RoCoF (enlarged view).
Figure 11 shows the simulation results for the various control methods in FFR. In the case of FFR control in which the BESS- and PMSG-type wind turbines are activated in the deadband, the second frequency dip was lower than the first frequency dip, indicating that resource utilization was inefficient. However, because the proposed control scheme performed the control to improve the lowest frequency after reaching a specific RoCoF, it was confirmed that the frequency improvement was effective with the same resources.
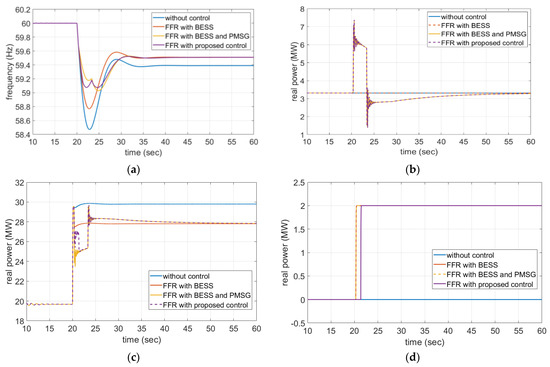
Figure 11.
Simulation results: (a) system frequency; (b) output power of the PMSG type wind turbine; (c) output power of synchronous generator #1; (d) output power of the BESS.
Figure 12 shows the resulting electrical torque and rotor speed during the wind turbine torque limit control. As shown in Figure 4b, the electrical torque was reduced to 1 pu and kept constant, after which the MPPT operation was performed. It can be seen that the rotor speed decreased when generating additional output, converting the inertia of the drivetrain into electrical energy and recovering normally through the acceleration section.
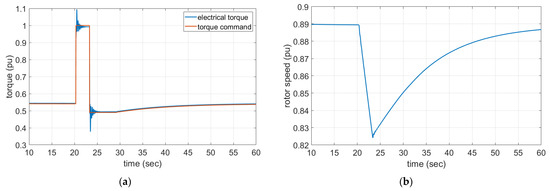
Figure 12.
Simulation results of the PMSG type wind turbine: (a) electrical torque and torque command; (b) rotor speed.
Table 3 shows first and second frequency drop with constant α. Table 4 shows the lowest frequency for each method. The proposed NCCS is the highest frequency nadir among various methods.
Table 3.
First and second frequency nadir according to RoCoF constant α.
Table 4.
Comparison of frequency nadir results.
5. Discussion
This study proposed the use of the NCCS for BESS- and PMSG-type wind turbines to improve the frequency nadir while the system frequency drops during fast frequency response, and it was verified using a small-scale grid. In the proposed strategy, the RoCoF deadband was adapted, and coordinated control between the wind turbine based on the PMSG and the BESS was performed to prevent the second frequency drop and to improve the frequency nadir. This approach has the advantage of improving the frequency nadir because it enables the output of the BESS near the frequency nadir through the RoCoF.
The conventional fast frequency control was not efficient in improving the frequency nadir because it focused on supporting the frequency response as quickly as possible. Simulation results showed that the proposed control strategy can utilize the same resources as in conventional fast frequency control to improve the frequency nadir and prevent the second frequency dip from being lower than the first frequency drop.
Author Contributions
Conceptualization, software, and writing (original draft preparation), H.K.; methodology and validation, H.K. and J.L. (Junghun Lee); writing (review and editing), J.L. (Junghun Lee) and J.L. (Jaehyeong Lee); supervision, G.J. All authors have read and agreed to the published version of the manuscript.
Funding
This research was supported by the Korea Institution of Energy Technology Evaluation and Planning (KETEP) under grant (20183010025440).
Institutional Review Board Statement
Not applicable.
Informed Consent Statement
Not applicable.
Data Availability Statement
Data sharing not applicable.
Conflicts of Interest
The authors declare no conflict of interest.
References
- Yoo, Y.; Jung, S.; Kang, S.; Song, S.; Lee, J.; Han, C.; Jang, G. Dispatchable Substation for Operation and Control of Renewable Energy Resources. Appl. Sci. 2020, 10, 7938. [Google Scholar] [CrossRef]
- Jeong, S.; Lee, J.; Yoon, M.; Jang, G. Energy Storage System Event-Driven Frequency Control Using Neural Networks to Comply with Frequency Grid Code. Energies 2020, 13, 1657. [Google Scholar] [CrossRef]
- Zeng, X.; Liu, T.; Wang, S.; Dong, Y.; Chen, Z. Comprehensive Coordinated Control Strategy of PMSG-Based Wind Turbine for Providing Frequency Regulation Services. IEEE Access 2019, 7, 63944–63953. [Google Scholar] [CrossRef]
- Kang, M.; Kim, K.; Muljadi, E.; Park, J.; Kang, Y.C. Frequency Control Support of a Doubly-Fed Induction Generator Based on the Torque Limit. IEEE Trans. Power Syst. 2016, 31, 4575–4583. [Google Scholar] [CrossRef]
- Lyu, X.; Zhao, J.; Jia, Y.; Xu, Z.; Wong, K.P. Coordinated Control Strategies of PMSG-Based Wind Turbine for Smoothing Power Fluctuations. IEEE Trans. Power Syst. 2019, 34, 391–401. [Google Scholar] [CrossRef]
- Li, Y.; Xu, Z.; Wong, K.P. Advanced Control Strategies of PMSG-Based Wind Turbines for System Inertia Support. IEEE Trans. Power Syst. 2017, 32, 3027–3037. [Google Scholar] [CrossRef]
- Yang, D.; Kim, J.; Kang, Y.C.; Muljadi, E.; Zhang, N.; Hong, J.; Song, S.H.; Zheng, T. Temporary Frequency Support of a DFIG for High Wind Power Penetration. IEEE Trans. Power Syst. 2018, 33, 3428–3437. [Google Scholar] [CrossRef]
- Wu, Z.; Gao, W.; Wang, X.; Kang, M.; Hwang, M.; Kang, Y.C.; Gevogian, V.; Muljadi, E. Improved inertial control for permanent magnet synchronous generator wind turbine generators. IET Renew. Power Gener. 2016, 10, 1366–1373. [Google Scholar] [CrossRef]
- Liu, K.; Qu, Y.; Kim, H.; Song, H. Avoiding Frequency Second Dip in Power Unreserved Control During Wind Power Rotational Speed Recovery. IEEE Trans. Power Syst. 2018, 33, 3097–3106. [Google Scholar] [CrossRef]
- Yan, W.; Cheng, L.; Yan, S.; Gao, W.; Gao, D.W. Enabling and Evaluation of Inertial Control for PMSG-WTG Using Synchronverter With Multiple Virtual Rotating Masses in Microgrid. IEEE Trans. Sustain. Energy 2020, 11, 1078–1088. [Google Scholar] [CrossRef]
- Heier, S. Grid Integration of Wind Energy, 3rd ed.; John Wiley & Sons: Chichester, UK, 2014; pp. 43–44. [Google Scholar]
- Fast Frequency Response Concepts and Bulk Power System Reliability Needs. In NERC Inverter-Based Resource Performance Task Force; NERC: Atlanta, GA, USA, 2020.
- Technology Capabilities for Fast Frequency Response. GE Energy Consulting. 2017. Available online: https://www.aemo.com.au/-/media/files/electricity/nem/security_and_reliability/reports/2017/20170310-ge-ffr-advisory-report.pdf?la=en (accessed on 24 April 2021).
- Working Group Prime Mover and Energy Supply. Hydraulic turbine and turbine control models for system dynamic studies. IEEE Trans. Power Syst. 1992, 7, 167–179. [CrossRef]
- Working Group on Prime Mover and Energy Supply Models for System Dynamic Performance Studies. Dynamic models for fossil fueled steam units in power system studies. IEEE Trans. Power Syst. 1991, 6, 753–761. [Google Scholar] [CrossRef]
- Singh, M.; Santoso, S. Dynamic Models for Wind Turbines and Wind Power Plants; NERL: Denver, CO, USA, 2011.
- Shim, J.W.; Verbic, G.; Kim, H.; Hur, K. On Droop Control of Energy-Constrained Battery Energy Storage Systems for Grid Frequency Regulation. IEEE Access 2019, 7, 166353–166364. [Google Scholar] [CrossRef]
- Wu, Z.; Gao, D.W.; Zhang, H.; Yan, S.; Wang, X. Coordinated Control Strategy of Battery Energy Storage System and PMSG-WTG to Enhance System Frequency Regulation Capability. IEEE Trans. Sustain. Energy 2017, 8, 1330–1343. [Google Scholar] [CrossRef]
Publisher’s Note: MDPI stays neutral with regard to jurisdictional claims in published maps and institutional affiliations. |
© 2021 by the authors. Licensee MDPI, Basel, Switzerland. This article is an open access article distributed under the terms and conditions of the Creative Commons Attribution (CC BY) license (https://creativecommons.org/licenses/by/4.0/).