
Rock Emissivity Measurement for Infrared Thermography Engineering Geological Applications


Featured Application
Abstract
1. Introduction
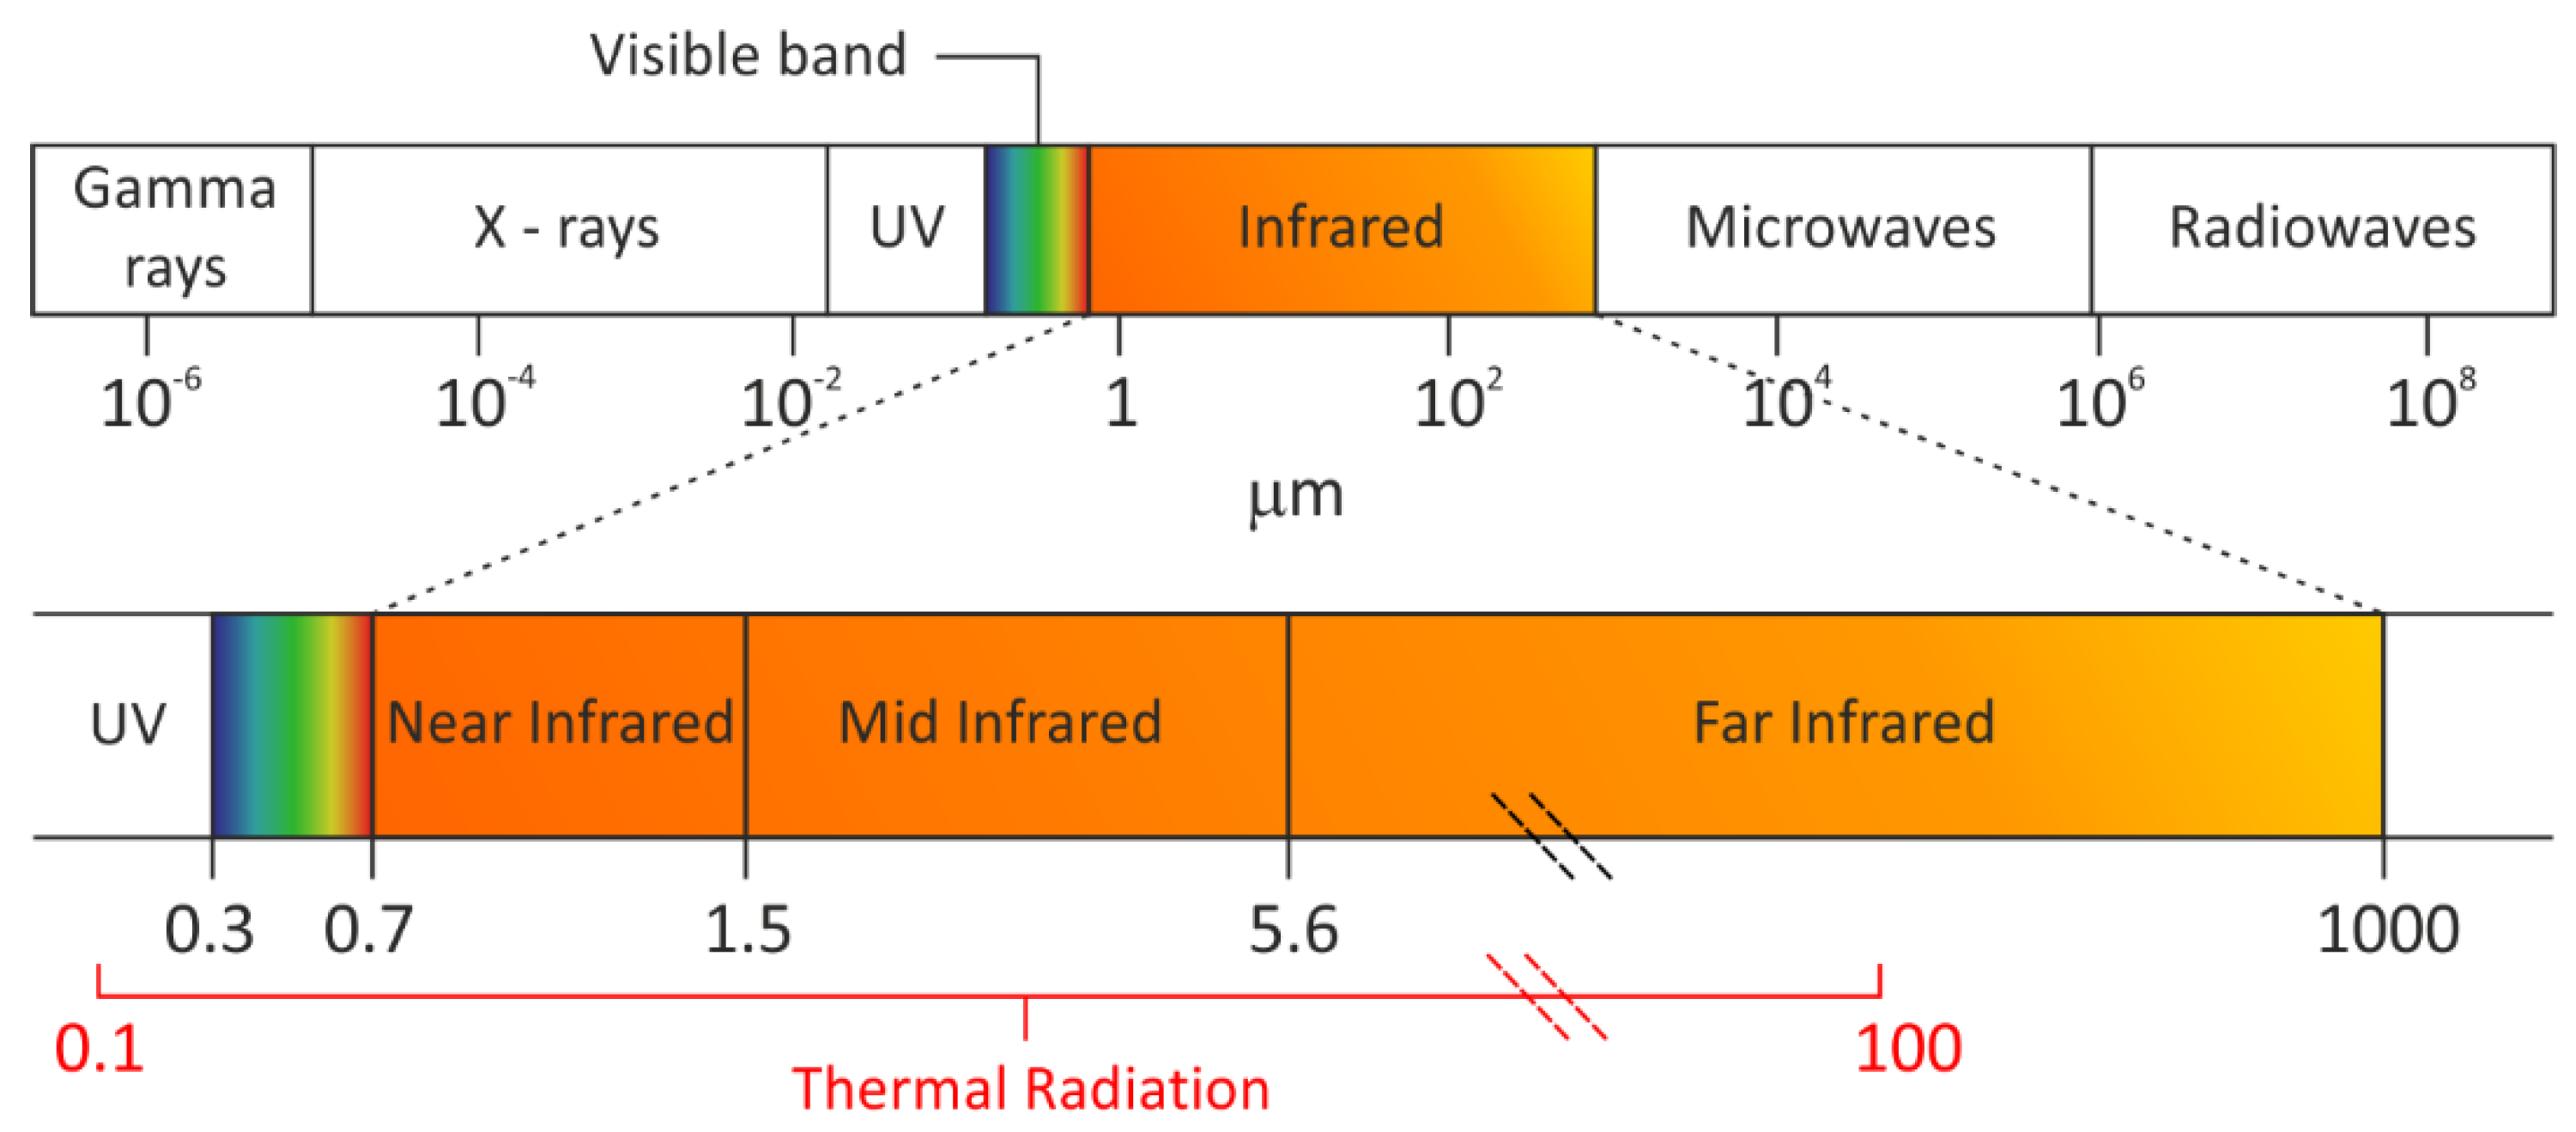
2. IRT Background
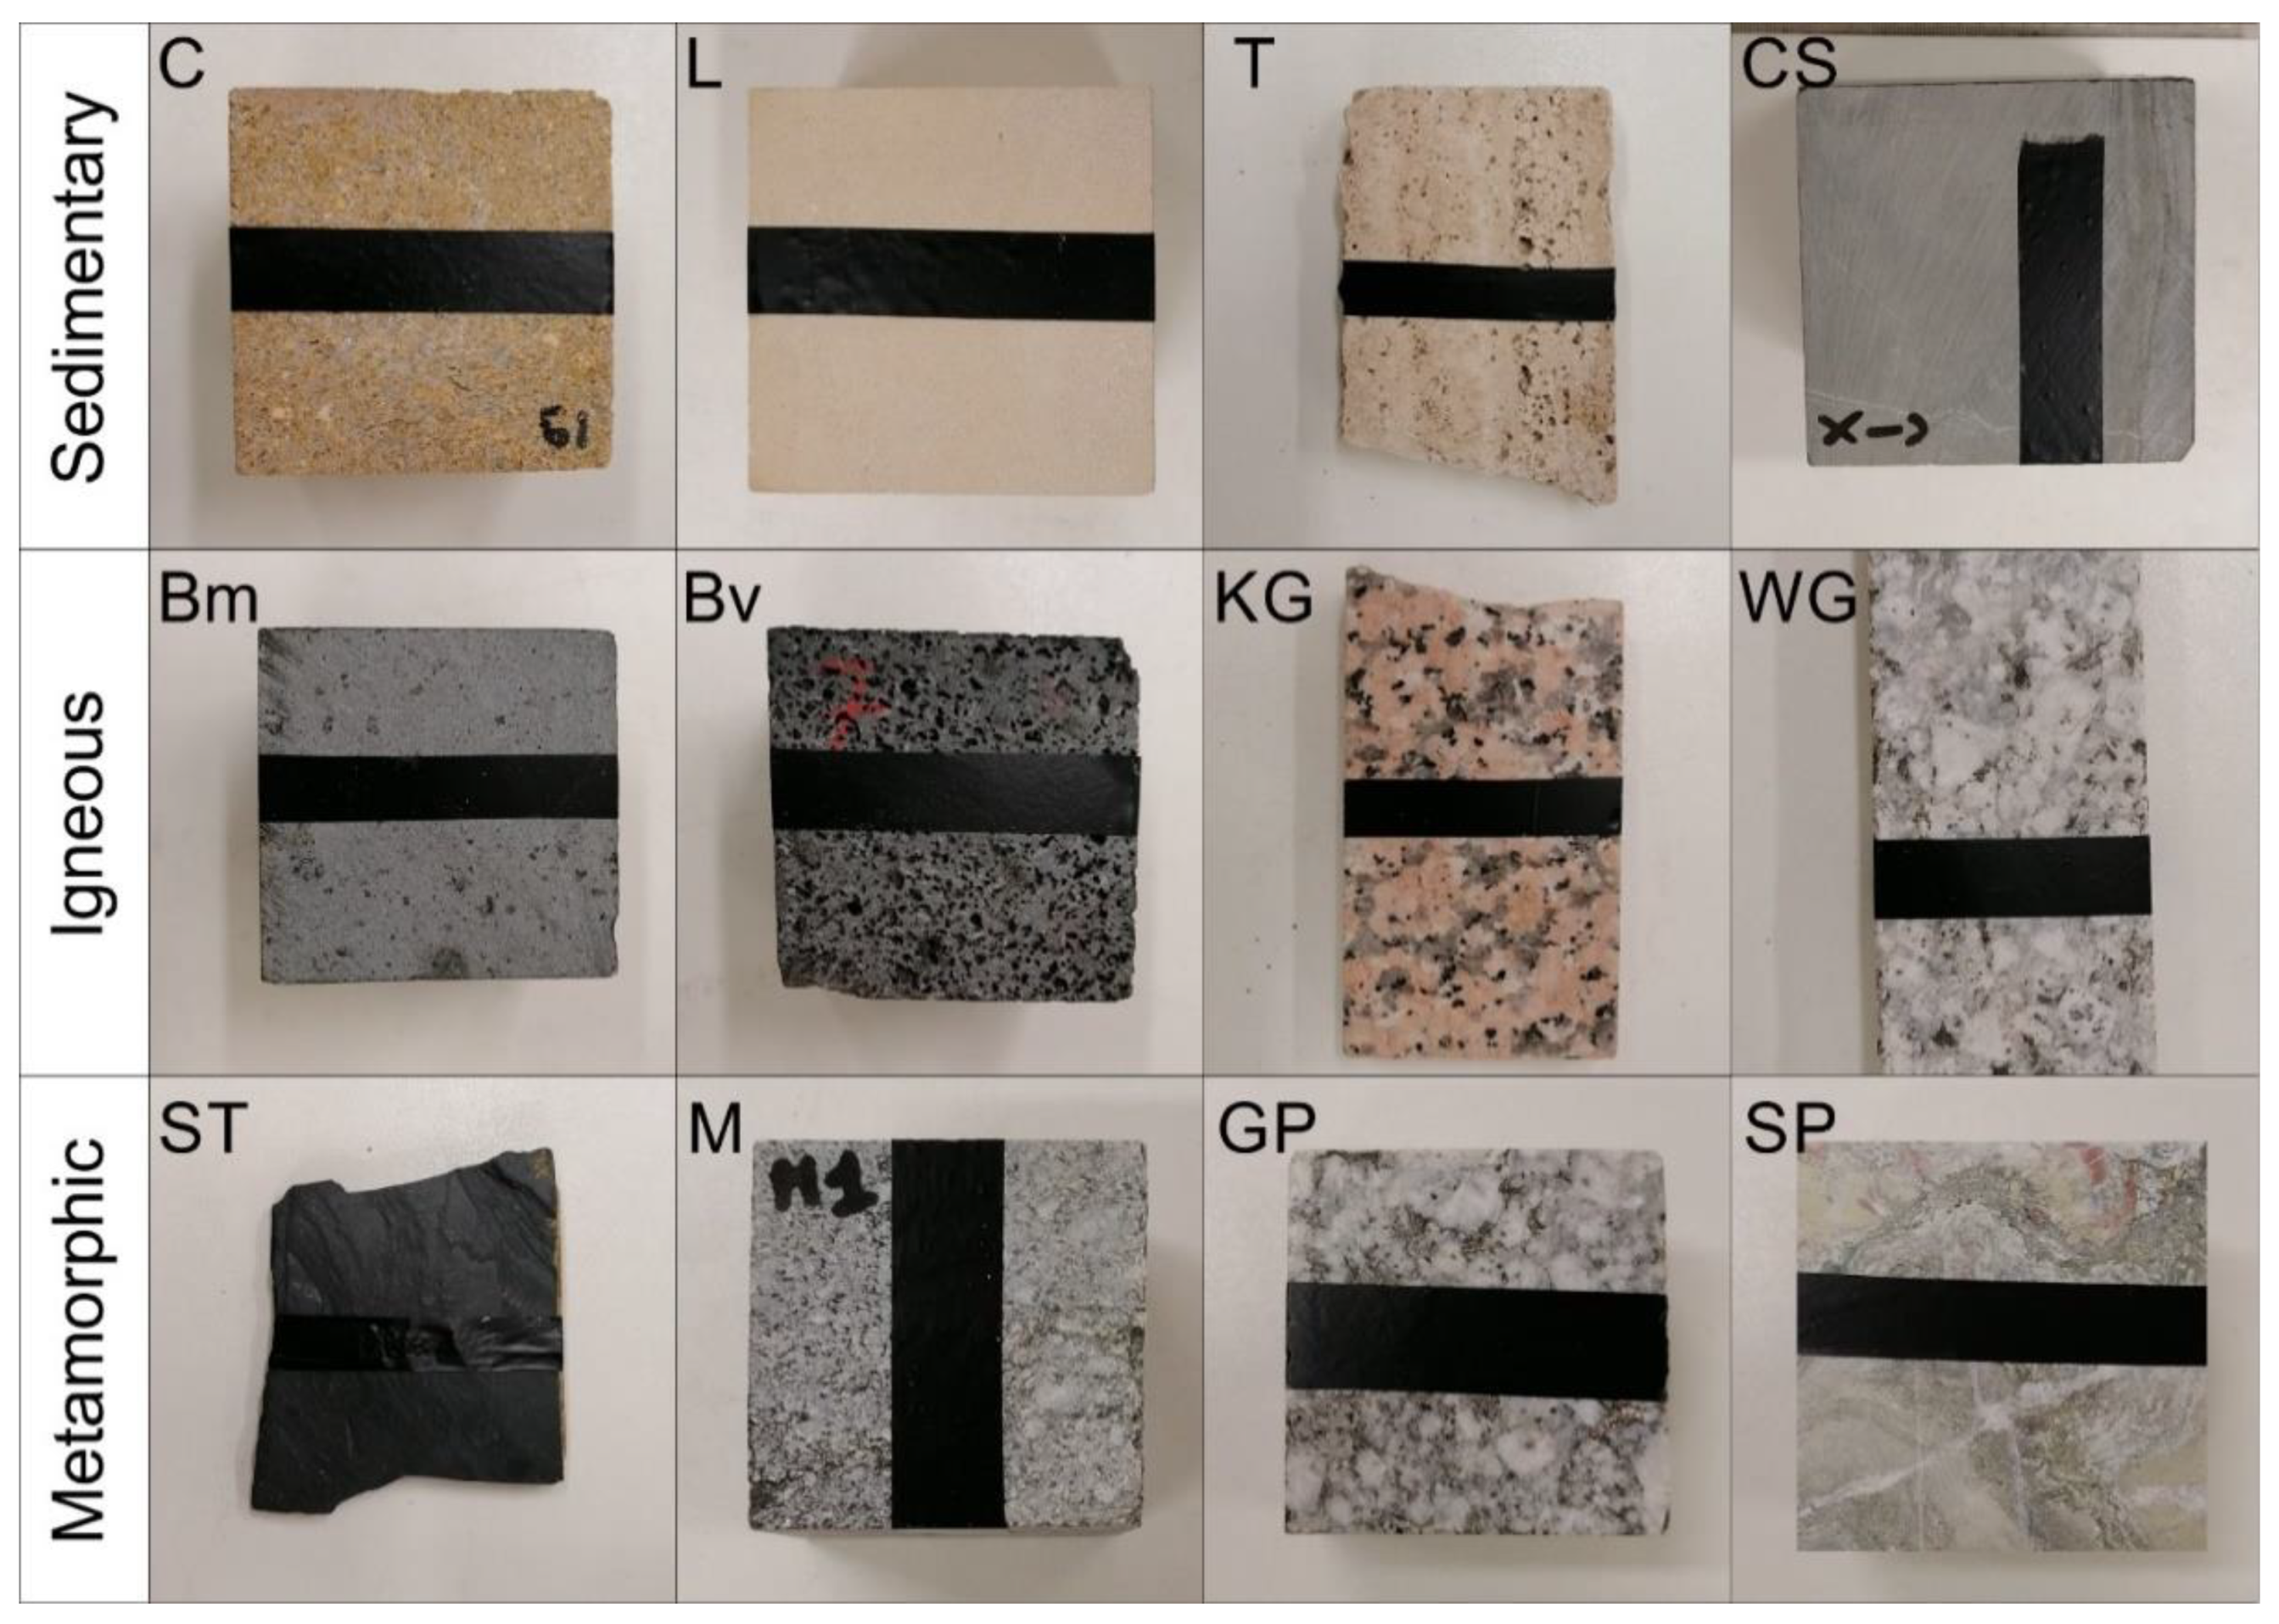
3. Materials
- -
- Limestones (L): fine-grained, light beige, limestone with a porous texture, showing millimetric voids and rare traces of bioturbation. This rock type was specifically employed for the reconstruction of a UNESCO world heritage monument in southeastern Sicily.
- -
- Calcarenites (C): two varieties of sicilian calcarenites were tested herein. The first is known as Sabucina stone, classifiable as a yellowish biosparite, with allochems mainly given by small fragments of foraminifera/bryozoa and orthochems represented by spathic calcite and small amount of micrite [39] and reference therein. The second belongs to the “Panchina” formation and it is a yellowish organogen calcarenite. Rocks show a porous texture, with micro and macro voids up to millimetric size.
- -
- Quartzarenites (QA): belonging to the arenaceous member of a Flysch succession, such greyish rocks contain sharp to sub-rounded lithic fragments (<1 mm) and widely crop out in northeastern Sicily.
- -
- Calcisiltite (CS): dark grey marly calcisiltites, with rare mineral clasts in a microcrystalline carbonate cement.
- -
- Sandstones (S): yellowish to grayish sandstones affected by a grain-size variability, from fine-to medium belonging to the Capo d’Orlando Flysch formation of northern Sicily. Such sandstones have been defined as quartzofeldspathic arcoses [40] and references therein.
- -
- Dolostones (D): cropping out on the Peloritani Mountains (northeastern Sicily) and belonging to the Longi-Taormina Unit, these rocks are characterized by a massive to brecciated structure and show the occurrence of calcite veins. Color ranges from grey to a light pink.
- -
- Travertine (T): cream-colored banded rock composed of calcite, usually formed by the evaporation of river and precipitation of carbonate minerals at spring waters. It is a variety of rock often used for walls and interior decorations.
- -
- Basalt: volcanic, effusive rocks from Mount Etna. At hand-scale, specimens show a porphyritic texture with a massive (Bm) or vesicular (Bv) structure. In the first case, olivine, pyroxene and plagioclase crystals are found in a groundmass and no visible voids can be detected; in the second case, millimetric voids occur within the rock structure, e.g., [41].
- -
- Granite: coarse-grained igneous rock mainly composed of quartz, alkali feldspar, and plagioclase tested herein in three different varieties, i.e., alkali feldspar granite also known as “red granite” with both polished (AGp) and smooth (AGs) surface; K-feldspar pinkish granite with both polished (KGp) and smooth (KGs) surface; white plagioclase granite (WG) with a smooth surface.
- -
- Tuff (TF): medium grain sized volcanic grayish rock, with plagioclase, biotite, with pumice concentration.
- -
- Migmatites (M): massive and fracture-free rocks, with the occurrence of banding given by millimetric alternation of leucocratic and melanocratic portions. The mineral content is represented by quartz, plagioclase, biotite and muscovite with minor chlorite, K-feldspar, and sillimanite.
- -
- Serpentinites (SP): dark green rocks sometimes affected by affected by serpentine and calcite veins.
- -
- Slate (ST): black fine-grained, foliated, low-grade metamorphic rock derived from an original shale-type sedimentary rock composed of clay or volcanic ash.
- -
- Granitoid plutonites (GP): holocrystalline rocks with a faneritic texture mainly composed of quartz, plagioclase, biotite and muscovite.
- -
- Marble: white metamorphic rock composed of recrystallized carbonate minerals from a limestone or dolomite protolith, with both polished (MBp) and smooth (MBs) surface.
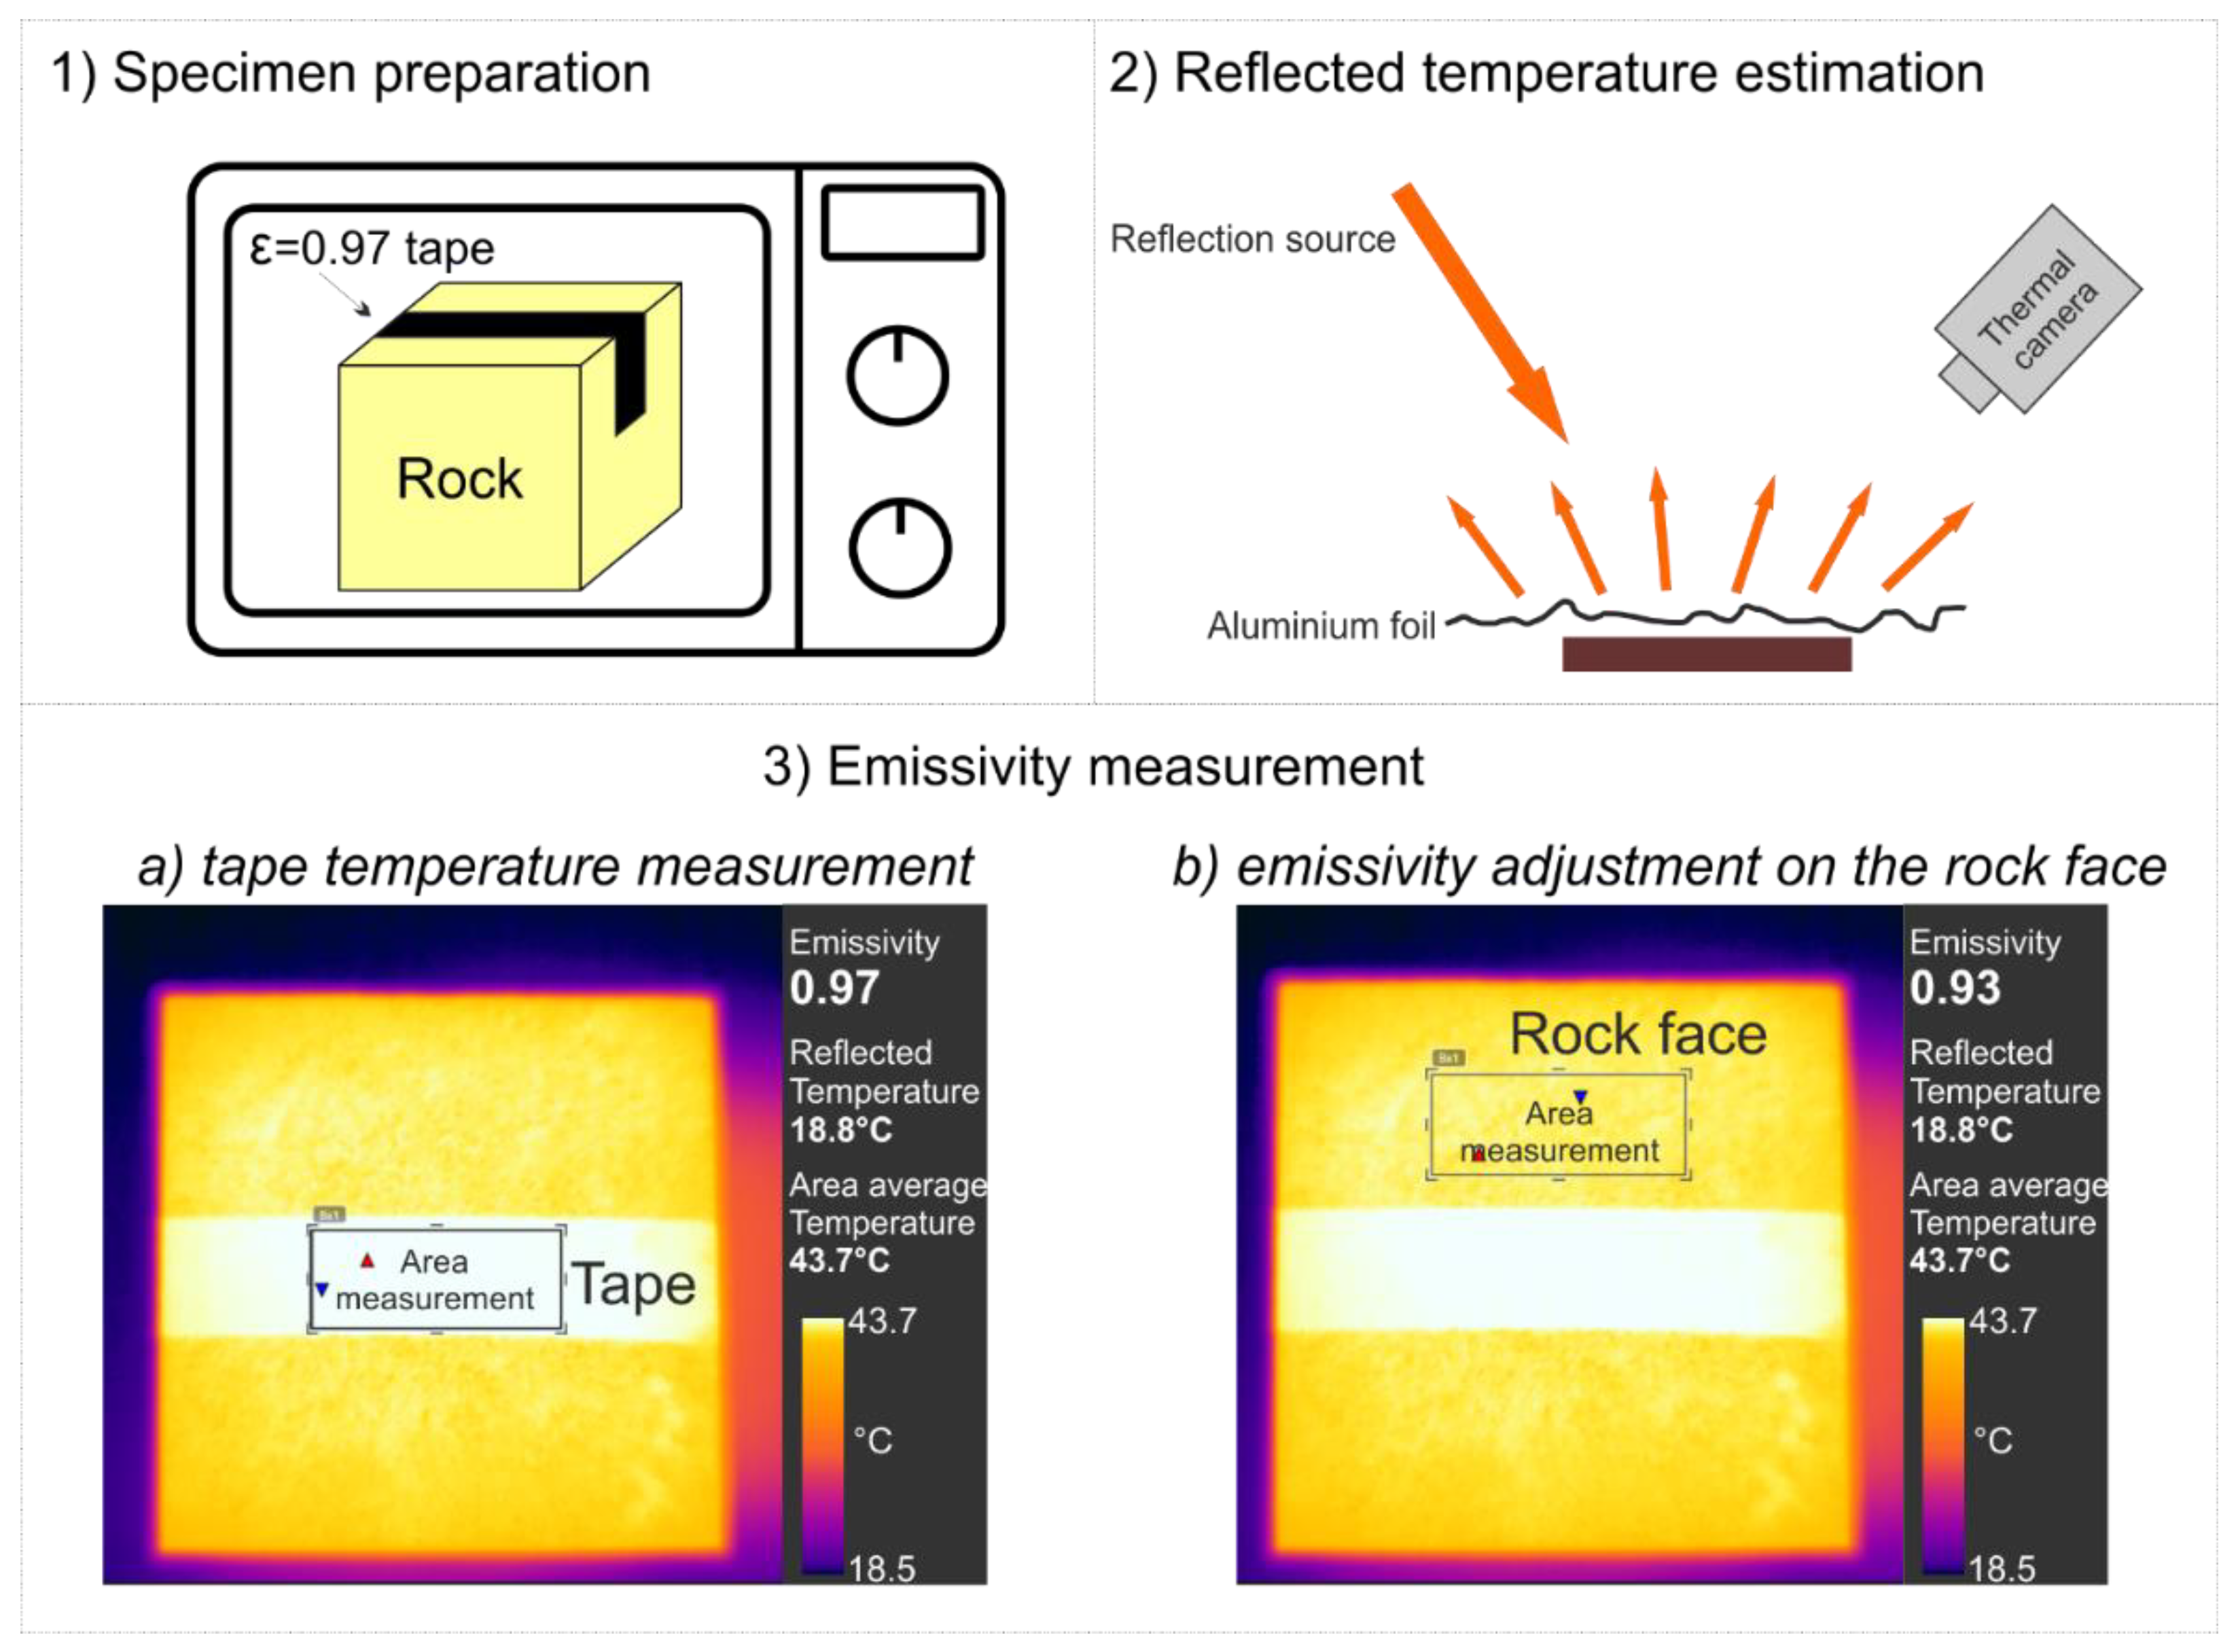
4. Methodology
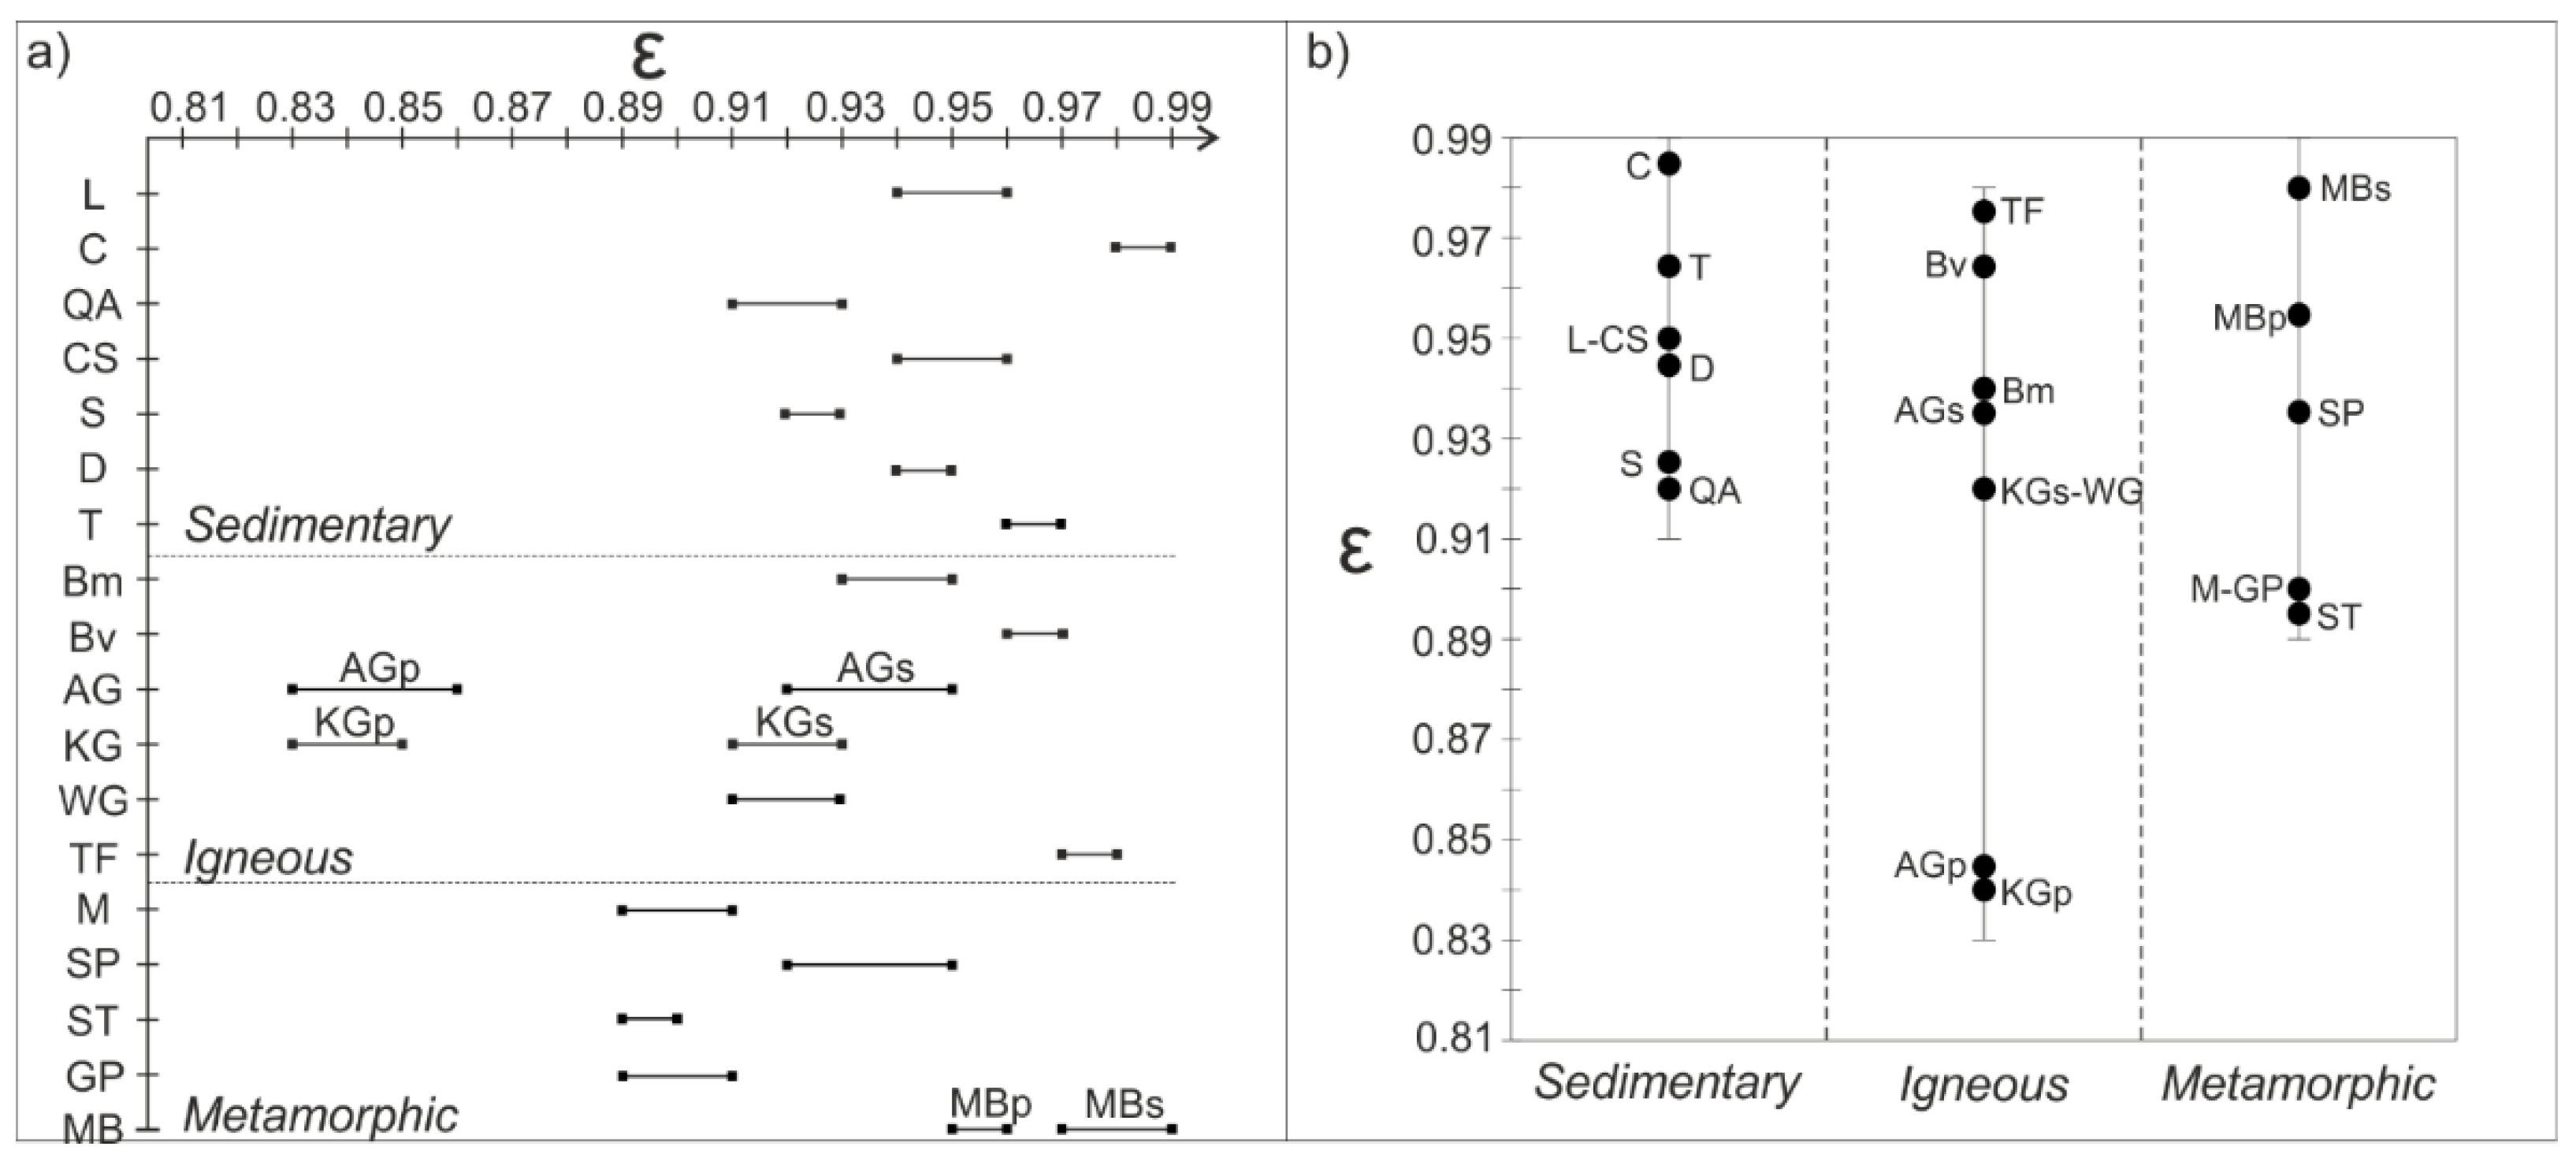
5. Results
5.1. Sedimentary Rocks
5.2. Igneous Rocks
5.3. Metamorphic Rocks
6. Discussion
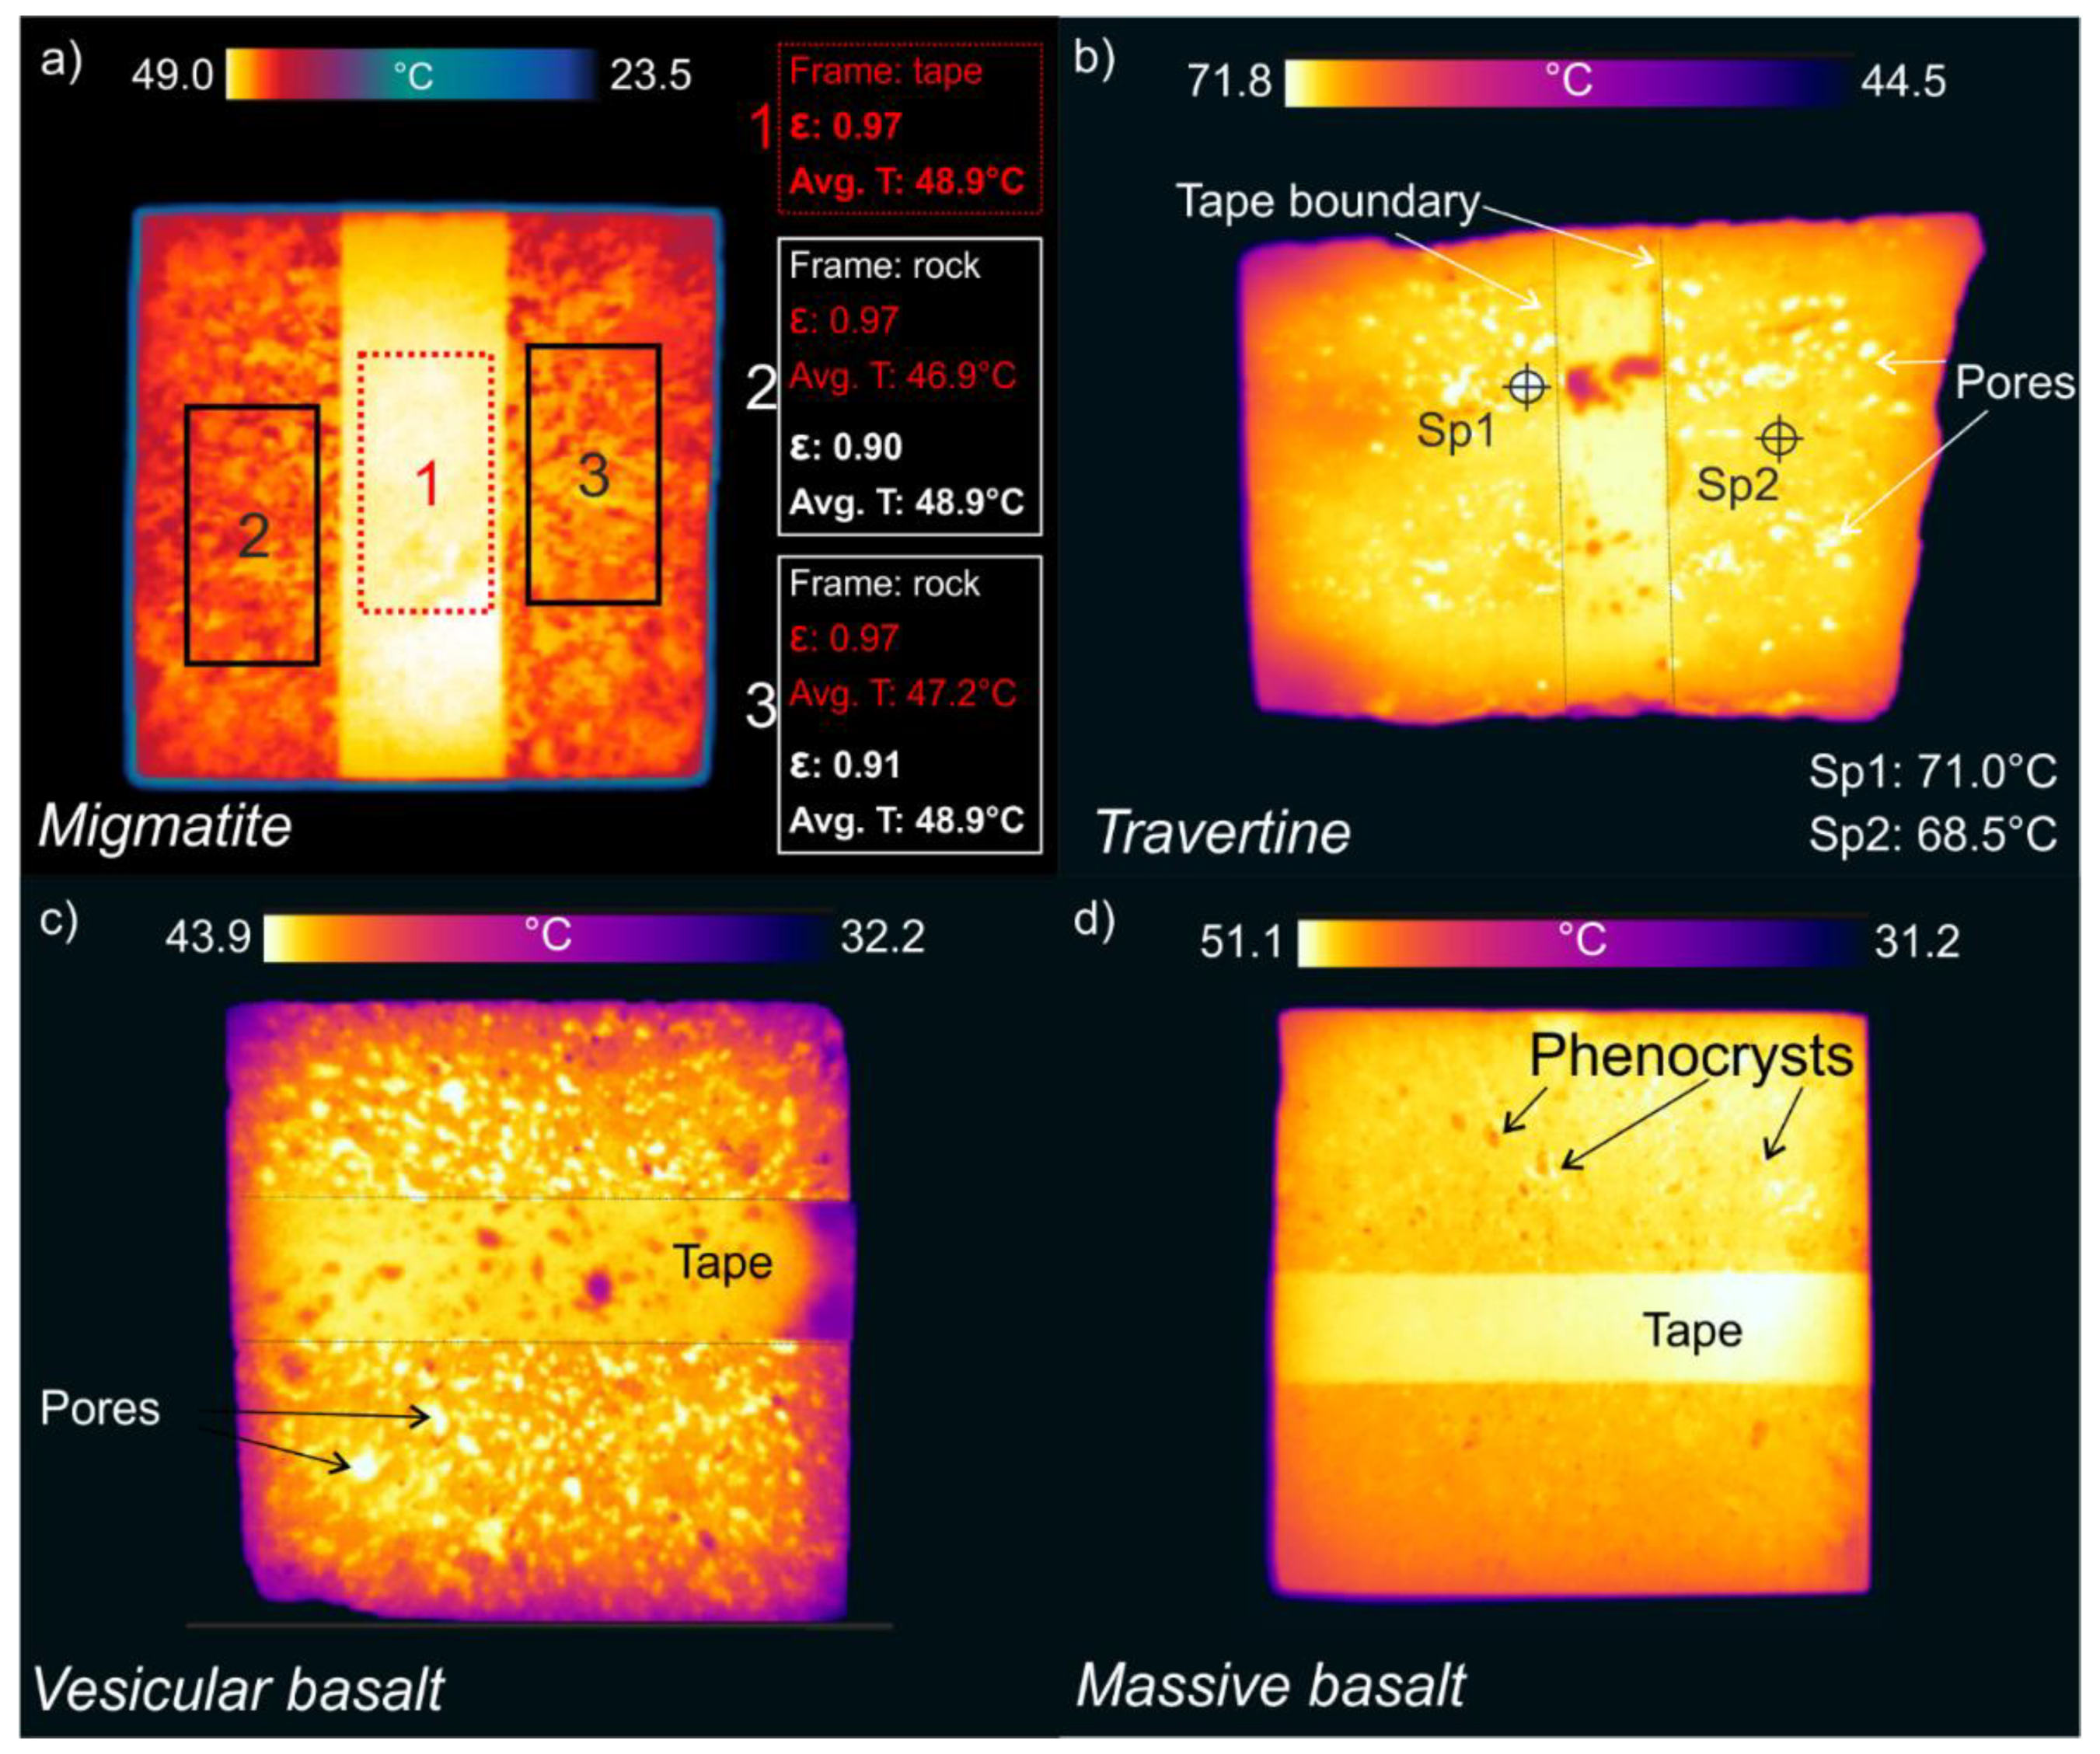
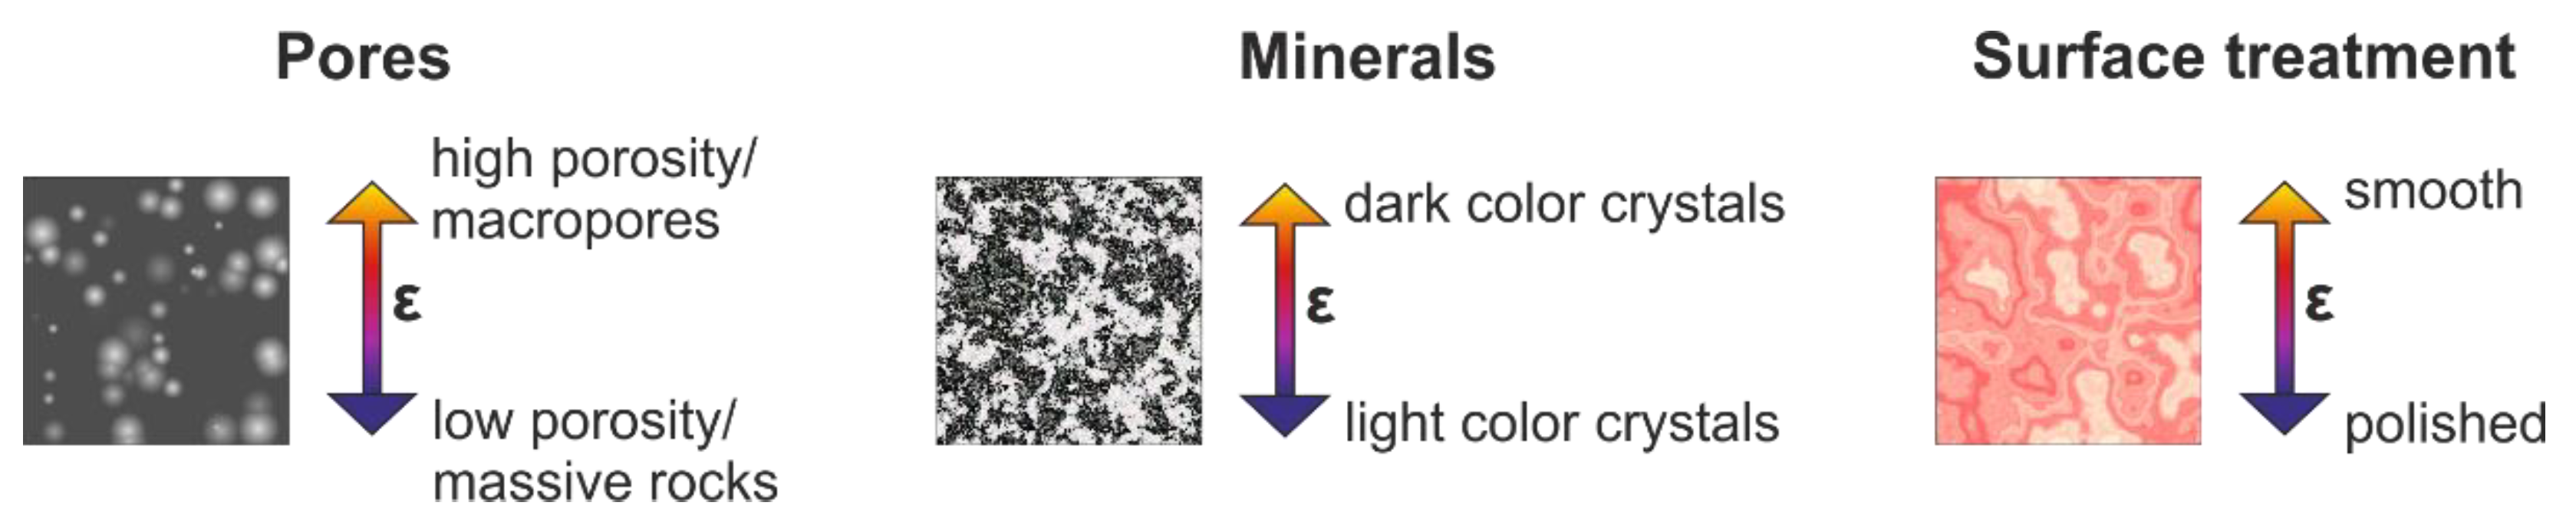
6.1. Pore Effect
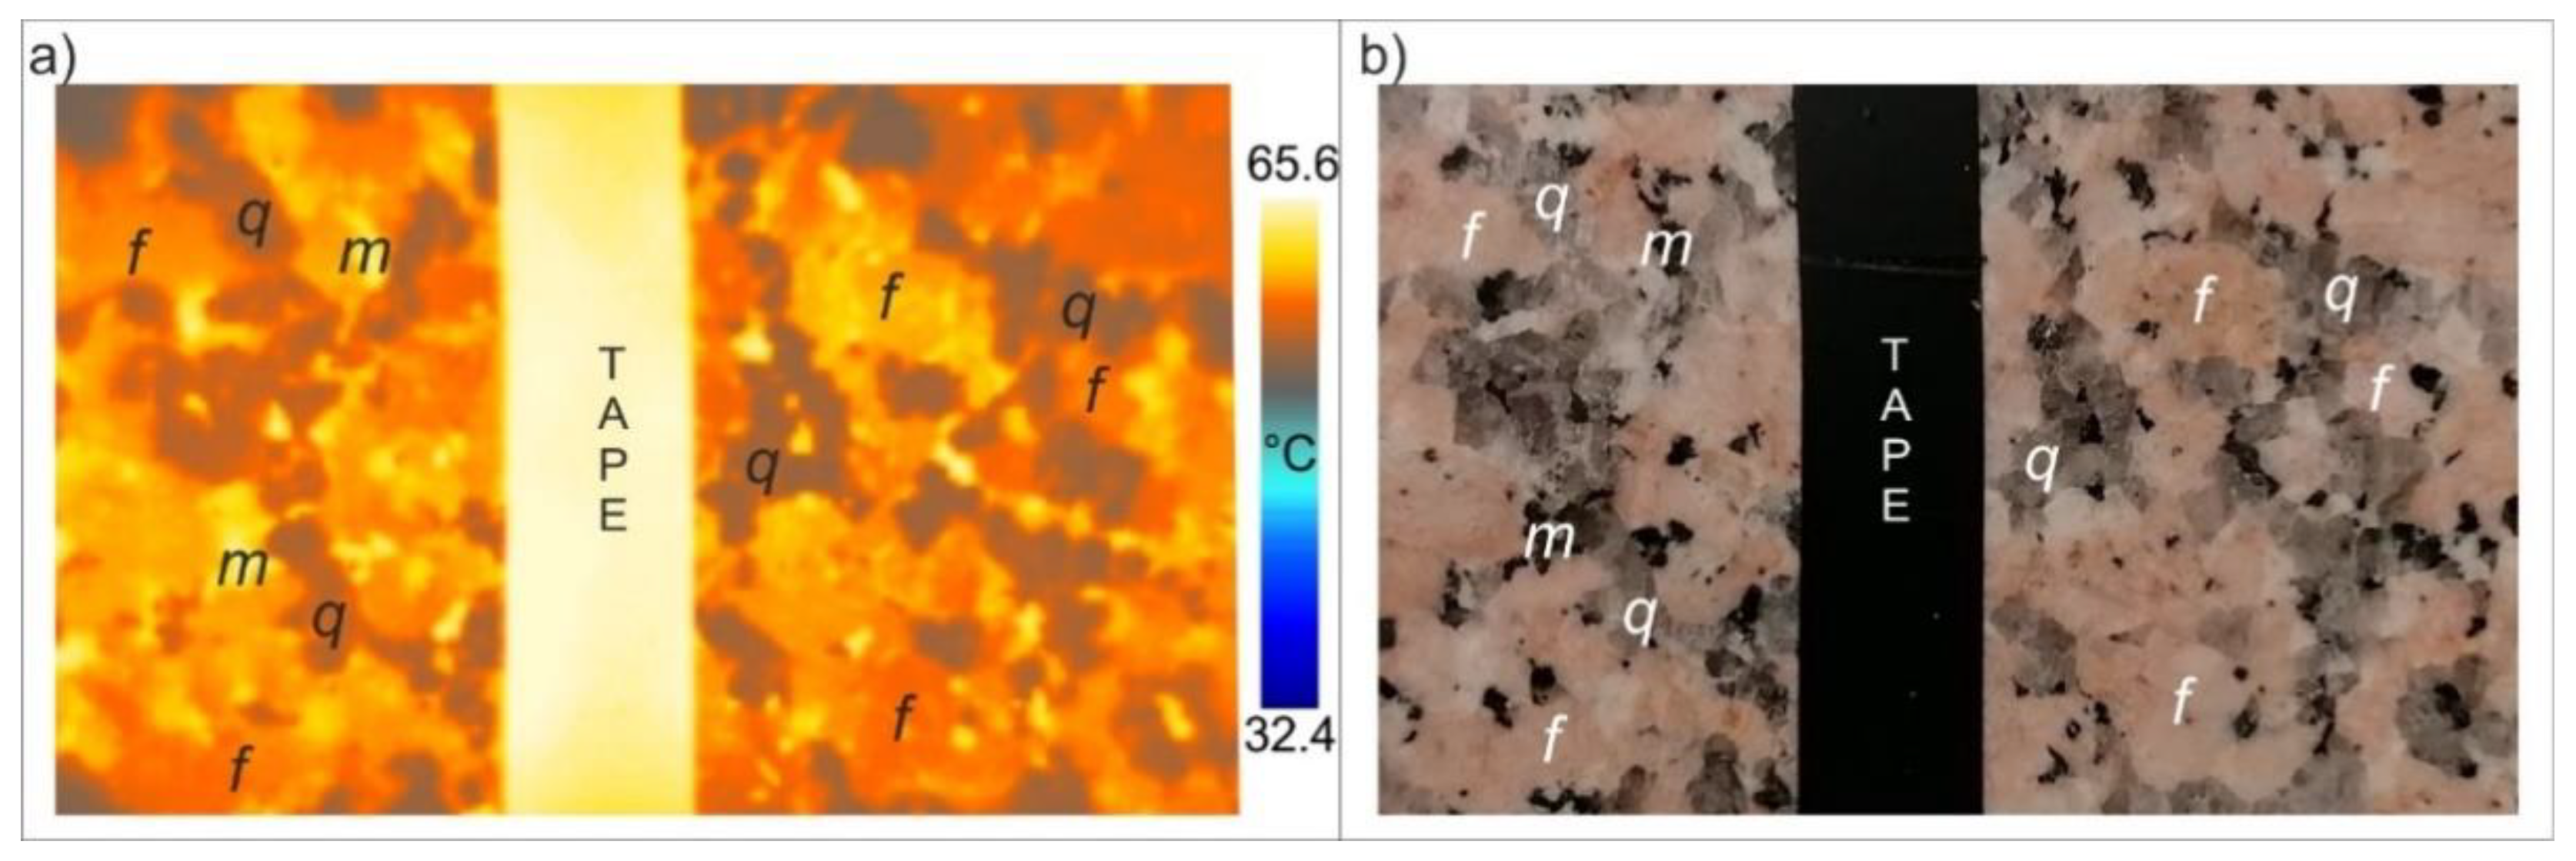
6.2. Mineral Effect
6.3. Consideration on a Possible Color Effect
6.4. Rock Surface Manufacturing
7. Conclusions
Author Contributions
Funding
Acknowledgments
Conflicts of Interest
References
- DeWitt, N. Theory and Practice of Radiation Thermometry; Wiley: New York, NY, USA, 1988. [Google Scholar]
- Wolfe, W.L.; Zissis, G.J. The Infrared Handbook; Office of Naval Research: Washington, DC, USA, 1993. [Google Scholar]
- Avdelidis, N.P.; Gan, T.-H.; Ibarra-Castanedo, C.; Maldague, X.P.V. Infrared Thermography as a Non-Destructive Tool for Materials Characterisation and Assessment Paper. In Proceedings of the Thermosense: Thermal Infrared Applications XXXIII 2011, Orlando, FL, USA, 26–28 April 2011. [Google Scholar]
- Ammer, K. Thermography 2015—A computer-assisted literature survey. Thermol. Int. 2016, 26, 5–42. [Google Scholar]
- Al-Hadhrami, L.M.; Maslehuddin, M.; Shameem, M.; Ali, M.R. Assessing concrete density using infrared thermographic (IRT) images. Infrared Phys. Technol. 2012, 55, 442–448. [Google Scholar] [CrossRef]
- Huh, J.; Tran, Q.H.; Lee, J.-H.; Han, D.; Ahn, J.-H.; Yim, S. Experimental Study on Detection of Deterioration in Concrete Using Infrared Thermography Technique. Adv. Mater. Sci. Eng. 2016. [Google Scholar] [CrossRef]
- Janku, M.; Brezina, I.; Grosek, J. Use of Infrared Thermography to detect defects on concrete bridges. Procedia Eng. 2017, 190, 62–69. [Google Scholar] [CrossRef]
- Barla, G.; Antolini, F.; Gigli, G. 3D Laser scanner and thermography for tunnel discontinuity mapping. Geomech. Tunn. 2016, 9, 29–36. [Google Scholar] [CrossRef]
- Frodella, W.; Gigli, G.; Morelli, S.; Lombardi, L.; Casagli, N. Landslide mapping and characterization through infrared thermography (IRT): Suggestions for a methodological approach from some case studies. Remote Sens. 2017, 9, 1281. [Google Scholar] [CrossRef]
- Mineo, S.; Calcaterra, D.; Perriello Zampelli, S.; Pappalardo, G. Application of Infrared Thermography for the survey of intensely jointed rock slopes. Rend. Online Soc. Geol. It. 2015, 35, 212–215. [Google Scholar] [CrossRef]
- Pappalardo, G. First results of infrared thermography applied to the evaluation of hydraulic conductivity in rock masses. Hydrogeol. J. 2018, 26, 417–428. [Google Scholar] [CrossRef]
- Pappalardo, G.; Mineo, S.; Imposa, S.; Grassi, S.; Leotta, A.; La Rosa, F.; Salerno, D. A quick combined approach for the characterization of a cliff during a post-rockfall emergency. Landslides 2020, 17, 1063–1081. [Google Scholar] [CrossRef]
- Pappalardo, G.; Mineo, S.; Carbone, S.; Monaco, C.; Catalano, D.; Signorello, G. Preliminary recognition of geohazards at the natural reserve “Lachea Islet and Cyclop Rocks” (Southern Italy). Sustainability 2021, 13, 1082. [Google Scholar] [CrossRef]
- Wu, J.H.; Lin, H.M.; Lee, D.H.; Fang, S.C. Integrity assessment of rock mass behind the shotcreted slope using thermography. Eng. Geol. 2006, 80, 164–173. [Google Scholar] [CrossRef]
- Mineo, S.; Pappalardo, G. InfraRed Thermography presented as an innovative and non-destructive solution to quantify rock porosity in laboratory. Int. J. Rock Mech. Min. Sci. 2019, 115, 99–110. [Google Scholar] [CrossRef]
- Huang, J.; Liu, S.; Gao, X.; Yang, Z.; Ni, Q.; Wu, L. Experimental Study of the Thermal Infrared Emissivity Variation of Loaded Rock and Its Significance. Remote Sens. 2018, 10, 818. [Google Scholar] [CrossRef]
- Danov, M.; Stoyanov, D.; Tsanev, V. Measuring the spectral emissivity of rocks and the minerals that form them. SPIE—Int. Soc. Opt. Eng. 2007. [Google Scholar] [CrossRef]
- Baldridge, A.M.; Hook, S.J.; Grove, C.I.; Rivera, G. The ASTER Spectral Library Version 2.0. Remote Sens. Environ. 2009, 113, 711–715. [Google Scholar] [CrossRef]
- Meerdink, S.K.; Hook, S.J.; Roberts, D.A.; Abbott, E.A. The ECOSTRESS spectral library version 1.0. Remote Sens. Environ. 2019, 230, 1–8. [Google Scholar] [CrossRef]
- FLIR. User’s Manual FLIR T6xx Series. 2017. Available online: https://www.flir.com/globalassets/imported-assets/document/flir-t6xx-series-user-manual.pdf (accessed on 21 April 2021).
- Ciocia, C.; Marinetti, S. In-situ emissivity measurement of construction materials. In Proceedings of the 11th International Conference on Quantitative InfraRed Thermography, Naples, Italy, 11–14 June 2012. [Google Scholar]
- Rivard, B.; Thomas, P.J.; Giroux, J. Precise Emissivity of Rock Samples. Remote Sens. Environ. 1995, 54, 152–160. [Google Scholar] [CrossRef]
- National Aeronautics and Space Administration NASA, Science Mission Directorate. Infrared Waves. Retrieved from NASA Science Website. 2021. Available online: http://science.nasa.gov/ems/07_infraredwaves (accessed on 21 April 2021).
- Havens, K.J.; Sharp, E.J. Thermal Imaging Techniques to Survey and Monitor Animals in the Wild; Academic Press: Cambridge, MA, USA, 2016. [Google Scholar] [CrossRef]
- Hillel, D. Environmental Soil Physics; Academic Press: New York, NY, USA, 1998; p. 771. [Google Scholar]
- Rinker, J.N. Airborne infrared thermal detection of caves and crevasses. Photogramm. Eng. Remote Sens. 1975, 41, 1391–1400. [Google Scholar]
- Squarzoni, C.; Galgaro, A.; Teza, G.; Acosta, C.A.T.; Pernito, M.A.; Bucceri, N. Terrestrial laser scanner and infrared thermography in rock fall prone slope analysis. Geophys. Res. Abstr. 2008, 10, EGU2008-A-09254. Available online: https://meetings.copernicus.org/www.cosis.net/abstracts/EGU2008/09254/EGU2008-A-09254.pdf (accessed on 21 April 2021).
- Baroň, I.; Bečkovský, D.; Míča, L. Application of infrared thermography for mapping open fractures in deepseated rockslides and unstable cliffs. Landslides 2014, 11, 15–27. [Google Scholar] [CrossRef]
- Pappalardo, G.; Mineo, S.; Perriello Zampelli, S.; Cubito, A.; Calcaterra, D. InfraRed Thermography proposed for the estimation of the Cooling Rate Index in the remote survey of rock masses. Int. J. Rock Mech. Min. Sci. 2016, 83, 182–196. [Google Scholar] [CrossRef]
- Pappalardo, G.; Mineo, S.; Calcaterra, D. Geomechanical Analysis of Unstable RockWedges by Means of Geostructural and Infrared Thermography Surveys. Ital. J. Eng. Geol. Environ. 2017, 93–101. [Google Scholar] [CrossRef]
- Fiorucci, M.; Marmoni, G.M.; Martino, S.; Mazzanti, P. Thermal Response of Jointed Rock Masses Inferred from Infrared Thermographic Surveying (Acuto Test-Site, Italy). Sensors 2018, 18, 2221. [Google Scholar] [CrossRef]
- Casagli, N.; Frodella, W.; Morelli, S.; Tofani, V.; Ciampalini, A.; Intrieri, E.; Raspini, F.; Rossi, G.; Tanteri, L.; Lu, P. Spaceborne, UAV and ground-based remote sensing techniques for landslide mapping, monitoring and early warning. Geoenviron. Disasters 2017, 4, 9. [Google Scholar] [CrossRef]
- Pappalardo, G.; Mineo, S.; Angrisani, A.C.; Di Martire, D.; Calcaterra, D. Combining field data with infrared thermography and DInSAR surveys to evaluate the activity of landslides: The case study of Randazzo Landslide (NE Sicily). Landslides 2018, 15, 2173–2193. [Google Scholar] [CrossRef]
- Teza, G.; Marcato, G.; Pasuto, A.; Galgaro, A. Integration of laser scanning and thermal imaging in monitoring optimization and assessment of rockfall hazard: A case history in the Carnic Alps (Northeastern Italy). Nat. Hazards 2015, 76, 1535–1549. [Google Scholar] [CrossRef]
- Guerin, A.; Jaboyedoff, M.; Collins, B.D.; Derron, M.-H.; Stock, G.M.; Matasci, B.; Boesiger, M.; Lefeuvre, C.; Podladchikov, Y.Y. Detection of rock bridges by infrared thermal imaging and modeling. Sci. Rep. 2019, 9, 13138. [Google Scholar] [CrossRef]
- Luong, M.P. Infrared thermovision of damage processes in concrete and rock. Eng. Fract Mech. 1990, 35, 291–310. [Google Scholar] [CrossRef]
- He, M.C.; Gong, W.L.; Zhai, H.M.; Zhang, H.P. Physical modeling of deep ground excavation in geologically horizontal strata based on infrared thermography. Tunn. Undergr. Space Technol. 2010, 25, 366–376. [Google Scholar] [CrossRef]
- Junique, T.; Vazquez, P.; Thomachot-Schneider, C.; Hassoun, I.; Jean-Baptiste, M.; Géraud, Y. The Use of Infrared Thermography on the Measurement of Microstructural Changes of Reservoir Rocks Induced by Temperature. Appl. Sci. 2021, 11, 559. [Google Scholar] [CrossRef]
- Mineo, S.; Pappalardo, G. Preliminary results on the estimation of porosity in intact rock through InfraRed Thermography. Rend. Online Soc. Geol. It. 2016, 41, 317–320. [Google Scholar] [CrossRef]
- Mineo, S.; Pappalardo, G.; Casciano, C.I.; Di Stefano, A.; Catalano, S.; Gagliano, M. Insights on the Capo d’Orlando flysch (NE Sicily) by means of geomechanics and sedimentology. Ital. J. Geosci. 2019, 138, 404–417. [Google Scholar] [CrossRef]
- Pappalardo, G.; Mineo, S.; Marchese, G. Effects of cubical specimen sizing on uniaxial compressive strength of Etna volcanic rocks (Italy). Ital. J. Eng. Geol. Environ. 2013, 2, 5–14. [Google Scholar] [CrossRef]
- ASTM Designation: E 1933–99a. Standard Test Methods for Measuring and Compensating for Emissivity Using Infrared Imaging Radiometers; ASTM International: West Conshohocken, PA, USA, 2019. [Google Scholar]
- Barreira, E.; Almeida, R.M.S.F.; Simões, M.L. Emissivity of Building Materials for Infrared Measurements. Sensors 2021, 21, 1961. [Google Scholar] [CrossRef] [PubMed]
- Mashkov, P.; Pencheva, T.; Gyoch, B. Reflow soldering processes development using infrared thermography. In Proceedings of the 32nd International Spring Seminar on Electronics Technology, Brno, Czech Republic, 13–17 May 2009; pp. 1–6. [Google Scholar] [CrossRef]
- Pappalardo, G.; Mineo, S. Investigation on the mechanical attitude of basaltic rocks from Mount Etna through InfraRed Thermography and laboratory tests. Constr. Build. Mater. 2017, 134, 228–235. [Google Scholar] [CrossRef]


| IR resolution | 320 × 240 pixels |
| Object temperature range | −20 °C to +120 °C (−4 °F to +248 °F) 0 °C to +650 °C (+32 °F to +1202 °F) |
| Accuracy | ±2 °C (±3.6 °F) |
| Spectral range | 7.5–13 µm |
| Focal Plane Array | Uncooled microbolometer |
| Rock Type | Acronym | Emissivity Range | Average Emissivity |
|---|---|---|---|
| Basalt (massive) | Bm | 0.93–0.95 | 0.94 |
| Basalt (vesicular) | Bv | 0.96–0.97 | 0.965 |
| Calcarenite | C | 0.98–0.99 | 0.985 |
| Calcisiltite | CS | 0.94–0.96 | 0.95 |
| Dolostone | D | 0.94–0.95 | 0.945 |
| Granite (polished) | WGp-KGp | 0.83–0.85 | 0.84 |
| Granite (smooth) | WGs-KGs | 0.91–0.93 | 0.92 |
| Granitoid plutonite | GP | 0.89–0.91 | 0.90 |
| Limestone | L | 0.94–0.96 | 0.95 |
| Marble (polished) | MBp | 0.95–0.96 | 0.956 |
| Marble (smooth) | MBs | 0.97–0.99 | 0.98 |
| Migmatite | M | 0.89–0.91 | 0.90 |
| Quartzarenite | QA | 0.91–0.93 | 0.92 |
| Red granite (smooth) | AKs | 0.92–0.95 | 0.935 |
| Red granite (polished) | AKp | 0.83–0.86 | 0.845 |
| Sandstone | S | 0.92–0.93 | 0.925 |
| Serpentinite | SP | 0.92–0.95 | 0.935 |
| Slate | ST | 0.89–0.90 | 0.895 |
| Travertine | T | 0.96–0.97 | 0.965 |
| Tuff | TF | 0.97–0.98 | 0.975 |
Publisher’s Note: MDPI stays neutral with regard to jurisdictional claims in published maps and institutional affiliations. |
© 2021 by the authors. Licensee MDPI, Basel, Switzerland. This article is an open access article distributed under the terms and conditions of the Creative Commons Attribution (CC BY) license (https://creativecommons.org/licenses/by/4.0/).
Share and Cite
Mineo, S.; Pappalardo, G. Rock Emissivity Measurement for Infrared Thermography Engineering Geological Applications. Appl. Sci. 2021, 11, 3773. https://doi.org/10.3390/app11093773
Mineo S, Pappalardo G. Rock Emissivity Measurement for Infrared Thermography Engineering Geological Applications. Applied Sciences. 2021; 11(9):3773. https://doi.org/10.3390/app11093773
Chicago/Turabian StyleMineo, Simone, and Giovanna Pappalardo. 2021. "Rock Emissivity Measurement for Infrared Thermography Engineering Geological Applications" Applied Sciences 11, no. 9: 3773. https://doi.org/10.3390/app11093773
APA StyleMineo, S., & Pappalardo, G. (2021). Rock Emissivity Measurement for Infrared Thermography Engineering Geological Applications. Applied Sciences, 11(9), 3773. https://doi.org/10.3390/app11093773