Abstract
Factory shop floor workers are exposed to threats and accidents due to their encounters with tools, equipment, and toxic materials. There are cases of occupational accidents resulting in injuries to workers and precipitating lawsuits, which on the other hand affect company’s operational cost. To ensure the safety of workers within the shop floor, there is a need for proactive activity monitoring. Such activities include detection of falling objects, abnormal vibration, and movement of humans within an acceptable area of the factory floor. Breathing sensor-based monitoring of workers in the smart factory shop floor can also be implemented. This is for the detection of human activity, especially in cases where workers are in isolation with no available emergency assistance. Internet of Things (IoT), Industrial Internet of Things (IIoT), and machine learning (ML) have enabled so many possibilities in this area. In this study, we present a simple test-bed, which is made up of a vibration sensor, a breathing and movement sensor, and a Light Detection and Ranging (LIDAR) sensor. These sensors were used to gather normal and abnormal data of human activities at the factory. We developed a dataset based on possible real-life situations and it is made up of about 10,000 data points. The data was split with a ratio of 75:25 for training and testing the model. We investigated the performance of different ML algorithms, including support vector machine (SVM), linear regression, naive Bayes (NB), K-nearest neighbor (KNN), and convolutional neural network (CNN). From our experiments, the CNN model outperformed other algorithms with an accuracy of 99.45%, 99.78%,100%, and 100%, respectively, for vibration, movement, breathing, and distance. We have also successfully developed a dataset to assist the research community in this field.
1. Introduction
The manufacturing industry is constantly challenged by issues, such as accidents on the factory floor. Several persons are injured in factories around the world, resulting in an increase in operational costs and production downtime [1]. In China, for instance, Ref. [1] collected 152 fatal accidents in the Chinese metallurgical industry from 2001 to 2018 accounting for 731 deaths. Common workplace injuries are usually caused by extended stress due to the use of equipment that vibrates and remaining in the same place for a long time [2]. Slip and falls are also common in factories where oil and other liquids are used in the manufacturing process leading to broken bones, sprains, and spinal injuries capable of keeping the factory worker from work for a long time [3]. In some factories, back and neck pain are caused by heavy lifting, while some others suffer from lacerations, dislocation and loss of limbs from entanglement to machinery in the factory or, in cases where a factory worker working in proximity to hot machinery, can suffer from exhaustion and passing out. In the chemical and allied industries, harmful materials can put the factory worker to huge risk of toxic exposure, leading to respiratory issues, skin irritation and some burns [3,4]. Furthermore, falling objects account for several industrial injuries. For instance, a worker can get trapped in a factory as a result of falling objects, thus sustaining traumatic brain injuries, spinal injury, or broken bones, including death, in cases of larger objects falling from high above, as reported in a recent death in Korea of a worker due to falling objects from a broken crane, and about 6005 fatal accidents in China’s construction industry resulting in 7275 deaths from 2010 to 2019 [5].
In Korea, 50% of the deaths resulting from workplace accidents in 2019 were aftermaths of workers falling or workers being struck by falling objects [6]. In 2018, it was estimated that such accidents accounted for about 25 trillion Korean Won (KRW) in damages [6]. This has lead to a revision in the occupational safety and health act in 2020 [7,8]. Recently, Hyundai motors’ factory in Ulsan, South Korea, halted its production after a worker died in an accident allegedly caused by retooling of its factory for the production of the new electric vehicle [9]. These accidents occur despite the growth in technologies and attendants benefits of the industry 4.0, thereby making research in the area of safe factory (smart or traditional) floor a burning issue. However, developing a testbed to encourage research in this direction is challenged by the cost of implementing experimental testbeds which has limited the amount of dataset available in this area. Dataset availability is critical to research works especially in the development of neural networks for efficient detection and classification of various scenarios in the smart factory.
Today, disruptive technologies, such as the Internet of Things (IoT) and machine learning (ML), have transformed everyday life and positively impacted various sectors of the human endeavor. IoT has become ubiquitous as it can be easily applied in different areas, including assisted living, private homes, communication and the industry as a whole. The application of IoT to the industry or production process is referred to as industrial IoT (IIoT) [10]. When adopted, IIoT enables intelligent data acquisition and smart decision making. Furthermore, it enables efficient, reliable, and scalable mission critical infrastructures which can be easily maintained [11]. ML has extensively been applied in the development of smart factories. Such application includes object detection, which is widely used for automatic surface inspection [12]. Contrary to popular belief, the concept of smart factory does not exclude the human factor, as humans will continue to play a key role in all operations [13], despite the influence of process automation and ML.
In light of this, it is important to ensure the safety of factory workers. To achieve this, there is the need to deploy solutions, such as emergency detection systems, that can respond to the safety and health needs of persons working at the smart factory floor especially those working in isolation. Moreover, the use of ML for the enablement of such applications, is still an issue that is open for exploration. In this regard, we have explored the use of multiple sensors for the acquisition of data in the development of an emergency detection system. We also investigated different ML candidates for the most efficient and accurate emergency detection system in the smart factory. Recent research have proved that ML would not only drastically reduce the rate of false alarms drastically but would also reduce the computational cost of the system when a small dataset is used [14]. Moreover, given that the data generated from smart homes and smart factories are heterogeneous, the use of efficient ML approaches for the detection and classification of various scenarios is a massive research problem [15]. Consequently, we present a simple test-bed comprising three different sensors for the purpose of gathering the data used in the development of our emergency detection system. Our contributions can be summarized as follows:
- We proposed a human-centered test-bed for an emergency detection system. The test-bed is made up of sensors that measure vibration, breathing, movement, and distance location.
- We investigated various ML candidates using the state of the art evaluation metrics. This is critical to identifying the most efficient ML solution for the development of emergency detection systems.
- We designed a convolutional neural network (CNN) algorithm for the classification and detection of anomalous situations in the smart factory.
- We provided a novel dataset, which is available on demand to assist in research pertaining to emergency detection systems.
The rest of this paper is organized as follows: Section 2 presents the basic concepts of ML, smart factory, and IIoT in the form of related works and establishes the research gap. Thereafter, a concise but informative explanation of the materials and methods of the testbed is presented in Section 3. Section 4 describes the performance evaluation where the various ML candidates are compared to determine the most efficient; then, Section 5 concludes the paper.
2. Related Works and Background Information
2.1. Safety of Persons Working in a Smart Factory Shop Floor
The introduction of Industry 4.0 technology, such as IIoT, has undoubtedly resulted in a reduction in accidents and injuries in factories [16]. IIoT sensors have been extensively utilized for the acquisition of real time data regarding the status of machines and the factory environment, including temperature, vibrations, and pressure. Such data allow human supervisors to take preventive and corrective decisions. In the same vein, robots are being utilized to serve as assistants to human workers, especially, where risky tasks are to be undertaken. This will help to eliminate or reduce accidents, such as falling from a great height, inhaling toxic gas, or getting trapped in between machines [17]. Similarly, automated guided vehicles help in the navigation of factory floors, thus helping in the movement of weighty items from one part of the factory to another, without posing any risk to the humans working. Potential risks could include falling, tripping or being struck by heavy objects. In order to improve the training of workers on the appropriate occupational safety measures to take, augmented reality has been employed [18]. This is used to educate workers through the use of simulations which are able to accurately mimic real life situations. The use of biomedical sensors can also be used in keeping track of the worker’s physical activities, especially critical and extreme environmental conditions, such as hot rooms and places with high toxicity. In such places, there is the need for emergency evacuation of workers, to reduce mortality and fatality rate. Thus, it is important to have sensors which can constantly track features, such as heart breathing rate and extreme vibration, and send the necessary data to a supervisory unit, if a predefined threshold is crossed [19]. The authors in Reference [19] proposed industry 4.0-based Bluetooth beacons attached to the worker’s safety helmet to track workers entering danger zones and estimate the positions of workers in the event of an accident.
2.2. Safety and Security: Establishing the Difference
The Industrial internet consortium established the difference between “safety” and “security” in a smart factory. In order to trust IIoT systems, five features were stipulated: security, safety, reliability, resilience, and privacy [20]. Security refers to the measures put in place to protect the system from unintended or unauthorized access, change, or destruction. On the other hand, safety can be described as the “condition of the system operating without causing unacceptable risk of physical injury or damage to the health of the people, either directly or indirectly, as a result of damage to property or to the environment” [20]. Two broad approaches in ensuring safety in the industries include: “intrinsic” and “active” measure [21]. In the intrinsic approach, workers and machines are separated by physically putting them in various locations, locked door, or through the use of specialized insulation. In the “active” measure approach, the system is designed to respond to triggered issues, such as detecting workers intruding or stepping into hazardous or out of band areas, as well as emergency situations [22]. An example of a functional safety standard put in place for the industry is the IEC 61508 [22]. The authors in Reference [23], developed a portable android platform that is designed to raise an alert on emergency cases regarding fall detection and a Bluetooth area positioning. It also incorporates a form of voice broadcast with warning messages to alert a fatigued worker in danger. On the other hand, the authors in Reference [24] designed a protective wearable gear to assist factory floor workers and ensure they put required safety measures in place. Such safety measures include appropriate safety equipment for specific machine type. Proffering solutions to the ethical issues which arise with the technologies that workers currently use or those they consider using in the the factory of the future, authors in Reference [25] believes that all or some of the issues that may arise with these technologies can be responded to and ameliorated by designing these technologies explicitly for human values. In this work, a practical testbed was developed to collect data from the smart factory shop floor which can help in monitoring the safety of smart factory shop floor workers by flagging emergency alert based on CNN detection and classification.
2.3. Smart Factory and IIoT Technologies
IoT refers to the interconnection of devices (known as things) over the internet with identifiable internet protocols (IPs). The application of IoT to the industry is loosely called IIoT since it involves the connections of industrial components (devices or things with IPs). The Smart factories are an important part of the IoT. Meanwhile, the IIoT refers specifically to the impact of this innovation on industrial applications. Smart factories are not necessarily a “factory without people” [13]. It is in the understanding that smart factory also refer to the integration of shop floor decisions and insights with the rest of the supply chain and broader enterprise through an interconnected Information technology/operational technology landscape [26].
Both IoT/IIoT technologies together create “smart” networks. One great example is the wireless technologies of a smart home, which connect homeowners to almost anything in the house, ranging from their entrance door to their refrigerator, and enable remote access via smart phone. In the same vein, a smart factory provides plant managers with remote access to wirelessly-connected machines, as well as access to a wealth of data on the operation of those machines, by automating the communication between industrial automation equipment and systems [26]. Data availability is one of the hallmarks of IIoT because it allows businesses to leverage data more meaningfully, including enabling predictive maintenance for machines. Smart sensors, including those with wireless and IO-Link capabilities, play a key role in making the smart factory a reality. Putting the benefits of smart factory in proper perspective, the authors of Reference [27] listed the advantages of smart factories to include: increased process efficiency, reduction in operational cost, improved product quality and increase in safety and sustainability. The focus of our work is on safety of persons in a smart factory.
Basically, the three critical IIoT capabilities of the smart factory are: remote monitoring, predictive maintenance, and process optimization [28]. With ML, these three can be improved for overall industry benefit and availability of human and machines [29]. In the smart factory, the shop floor is highly computerized such that it is capable of continuously collection of data, as well as sharing among the connected devices, machines, and production systems [30]. To attain the full potential of industry 4.0 beyond the hype, the authors in Reference [31] opined that “collaborative industry 4.0” made possible by the exploitation of the available heterogenous data and leveraging on ML capabilities could help in optimizing smart factories for intelligence and shared situation awareness. Moreover, data gathering alone does not bring about the complete benefit of the smart factory. Rather, the highest level of benefit lies in the use of ML for actionable solutions to issues that are identified from the data [32]. The use of ML is one example of such actionable solutions in the emergency detection system which allows for remedy or counter actions should issues arise that are a deviation from the normal.
2.4. Machine Learning and Neural Network Approaches to Smart Factory Emergency Detection
The use of machine learning and neural networks for emergency detection systems has attracted research interests among industry and research experts [33,34]. For example, authors in Reference [33] described how the approach could lead to early detection of machines or cell failures which allows preventive measures to be put in place as quick as possible before the problem is escalated. According to Reference [34], ML has assisted the industry in achieving sustainability of the manufacturing value chain. Reviewing about eighty-two articles from the web of science and SCOPUS database which, address the application of ML to smart-manufacturing, the authors of Reference [34] posited that ML not only help in addressing the issue of productivity but also allows for optimization of scarce resources (human and natural).
In Reference [35], authors reviewed deep learning approaches for human-robot collaboration for smart manufacturing. The deep learning algorithms were deployed for movement detection, classification and recognition. The smart factory environment imposes an accuracy requirements in the range of 99%. This is made possible recently with the development of deep neural network algorithms, such as AlexNet and CNN. However, the result of Reference [35] gave an accuracy of 96%. Similarly, authors in Reference [36] proposed a long short term memory (LSTM) model to detect and classify abnormal vibrations for emergency detection. However, CNN has been shown to perform better for human action recognition data and most suitable to such classes/type of data [37]. Moreover, the accuracy of 97.39% achieved is below the acceptable threshold for future factory and mission critical systems [38].
A human activity recognition algorithm was proposed by Reference [39], wherein they used random forest and hidden markov models for industrial human robot interaction situations. The result shows an average frame-wise accuracy of 74.82% for movement, 72.65% for gestures and 71.2% for object handling. However, this approach differs from the proposed idea in this work, where we attempted to classify and detect non-image data. Moreover, emerging research focus of smart factory is human-centered systems where the human safety and well-being of smart factory shop floor workers are part of the design consideration [40,41]. To the best of our knowledge, this is a major attempt to develop a testbed to capture data for the purpose of detection and classification of movement, breathing and vibration in a smart factory shop floor for human safety.
2.5. Background on Machine Learning Algorithms
To take care of the unique complexities and coordination of the shop floor, ML was employed for process monitoring, quality control and system integration in the manufacturing environment [42]. The authors in Reference [42] captured several applications of ML to the smart factory namely for production, supply chain planning, health status or conditions of equipment. However, there is a growing need take note of the occupational health and safety of workers as argued by several human-centered researches for smart factory [40,41]. Since the CNN was compared with ML algorithms, such as K-nearest neighbor (KNN), support vector machine (SVM), logistic regression (LR), and naive Bayes (NB), this section presents a brief description of the ML candidates.
2.5.1. Support Vector Machine (SVM)
SVM finds ready application in pattern classification and regression by finding a separating hyperplane which distinguishes two classes (such as emergency and no emergency) with a finite margin. The separating hyperplane is derived or computed, based on euclidean distance measure during the training phase of the SVM model. A recent alternative approach to this is the use of distance metric learning. This approach is aimed at solving the challenge of possible misclassification from euclidean distance. The distance metric learning reduces the distance between similar instances [43].
2.5.2. Naive Bayes (NB)
NB classification algorithm is a probabilistic classifier based on applying Bayes’ theorem with the “naive” assumption of conditional independence between every pair of features given the value of the class variable. There are various types, such as multinomial, complement, Bernoulli, categorical, out-of-core, and gaussian NB, respectively. These types are dependent on the likelihood of features and distribution pattern of data. In this work, NB was implemented using Python and scikit-learn [44].
2.5.3. Logistic Regression (LR)
The LR is mostly applied for binary classification: datasets where y = 0 or 1, where 1 denotes the default class. For example, in predicting whether an emergency will occur or not, there are only two possibilities: that it occurs (which we denote as 1) or that it does not (0). So, if we were predicting the probability of a smart factory floor worker being sick or falling off or is in need of emergency response, we would label the emergency scenario using the value of 1 in our dataset. The algorithm follows the logistic function (S-shaped curve) given as (1)
where , the x value of the sigmoid’s midpoint; L, the curve’s maximum value; k, the logistic growth rate or steepness of the curve. Despite the similarity in classification performance in both cases LR and SVM, local LR can provide class probabilities, whereas SVM is a deterministic classifier. Therefore, if the goal of the ML is classification only, each of them may be used, while LR is preferred where interpretation becomes necessary [45].
2.5.4. K-Nearest Neighbor (KNN)
KNN is a probabilistic pattern recognition technique that classifies a signal output based on the most common class of its k nearest neighbors in the training data. The most common class (also referred to as the similarity function) can be computed as a distance or correlation metric [46]. In this study, we select the Euclidean distance as the similarity function as it is the most commonly used metric in KNN. The number of k-neighbors was varied to be 1, and 2 for fine and medium knn techniques. The euclidean distance d(p,q) of output data P and neighbor q can be calculated as:
2.6. Summary of Related Works and Motivation
From the instance above, it is evident that there is a clear difference between safety and security works in smart factory. Examples of security researches are AI-enabled anomalous detection, intrusion detection, and vulnerability detection of the cyber physical systems. However, few research works exist in AI-enabled safety detection of smart-factory floor workers. Existing works are mainly devoted to smart homes for elderly or assisted living [47,48]. In this work, we proposed a CNN model for the emergency detection in the smart factory shop floor, as well as developed a simple testbed for the purpose of providing dataset for future research direction in this area. In addition, the use of CNN for non-image dataset is a novel area that is now attracting research attention, such as it is with this work.
3. TestBed Materials and Machine Learning Model
3.1. System Model of the Proposed Testbed
This section gives a brief and concise description of the materials used in the testbed. The major objective of this research as already stated is to develop a dataset comprising vibration, breathing, movement, and location depicting human activities in a smart factory shop floor. These data can assist in identifying the need for an emergency for the health need of a shop floor worker. For instance, the ultra-wide band (UWB) sensor is capable of giving readings of normal and abnormal breathing status of a person within its recognition range (typical values range from 2.5 m to 8 m placement of the sensor on a roof surface from the floor) [49].
If there are more than one person at the floor, the UWB sensor gives out a motion or movement value ranging from 100 to 4800, depending on the number of persons and type of movement. In such a case, the UWB gives zero (0) breathing value. Moreover, the UWB sensor gives breathing values ranging from 6 to 40 only when there is one worker at the floor. The values represent respiration rate (breaths per minute). So, to detect emergency, this dataset considers the situation of an isolated factory floor worker in need of attention. His/her breathing rate is captured by the UWB sensor. His/her exact location is captured by the LIDAR, while the vibration sensor detects the vibration when a human(worker) falls or when it is an object that falls. The system model was made up of three prominent sensors, which were used for the collection of data. These sensors include: G-link vibration, RP-LIDAR A1, and ultra-wide band (UWB) sensor. Thereafter, the collected data was used as input to various implemented ML algorithms. To create the smart factory environment for data collection, we leveraged on the facilities of Daegu Mechatronics and Materials Institute in Korea, as shown in Figure 1. The dataset is available on demand via the corresponding author.
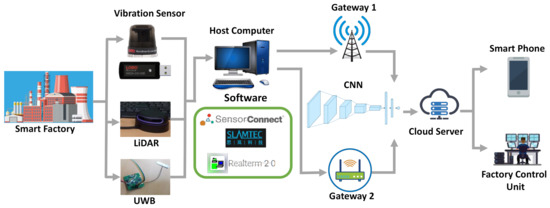
Figure 1.
System model showing the vibration sensor, LIDAR, and ultra-wide band (UWB) sensor for the data collection. We have also Implemented the AI algorithms on the host computer.
The breathing and movement data were collected in three situations. The first situation is in cases where two or more persons were located at the smart factory shop floor indicated by movement readings of the UWB. The second is in situations where only one person is at the smart factory floor and without a case for any emergency attention indicated by normal breathing value. And the third is where a fallen person(worker) seems not to have breathing value in the acceptable range. The vibration sensor was used to collect dataset for cases of falling person, fallen heavy objects, and cases of no vibration at all, thus suggesting a zero need for attention. On the other hand, the RP-LIDAR gave the location distance and angle of the persons in the smart factory floor. All these data were collected and saved in the host computer prior to processing detection and classification, as shown in the system model in Figure 1. The dataset collected is of binary nature having labels of “normal and abnormal human activities” judged by the movement, breathing, LIDAR, and vibration values obtained from the factory floor.
3.2. Vibration Sensor Description
Vibration dataset was collected using a wireless triaxial accelerometer sensor known as G-Link-200. This sensor is a battery powered wireless 3-axis accelerometer connected to the host computer through wireless gateway (a universal serial bus (USB) or WSDA-200 USB). The visualization of the vibration data is achieved using the customized application known as “sensorconnect”. This allows for the configuration of gateways and nodes, selecting and sampling modes and parameters, initializing data acquisition and viewing and saving data [50] of normal smart factory situation and abnormal vibration that can arise in the factory floor. A schematic diagram of the G-Link sensor connection for data collection is shown in Figure 2. Moreover, Figure 3 is the visualization of the vibration using the sensor connect. Details of the features and parameters of the G-link-200 sensor can be gotten from Reference [50].

Figure 2.
Vibration sensor connection to the host computer using the universal serial bus (USB) gateway. Visualization and saving of data is achieved with the sensorconnect software.
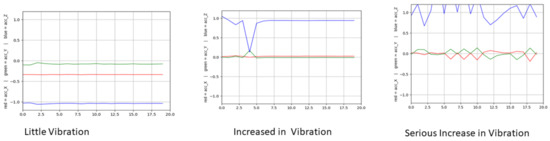
Figure 3.
Visualizing the vibration data. Here, the sensor connect shows the 3-axis data of the vibration sensor for little vibration, moderate vibration, and intense vibration.
3.3. Ultra-Wide Band (UWB) Sensor for Movement and Breathing Monitoring
The movement and breathing (respiration) dataset was collected using a UWB Sensor by “Thunder Series”. This sensor operated in the UWB territories (7–9 GHz), which can be utilized to recognize the presence of an individual or creatures inside recognition range. Sensor “Thunder Series” gives the information by Bluetooth Low Energy (BLE) and UART interfaces. The sensor’s most extreme working distance can be changed through the UART interface or utilizing infra-red (IR) [49]. Visualization can be done using the following software: RealTerm, BLE Terminal, and ‘nRF’ for smart phone. To ease integration of all data, we have adopted the RealTerm software for data capture, visualization and saving. The RealTerm software visualization of the moving and breathing values are shown in Figure 4. The movement value changes, depending on how fast the person can move. When there is no movement of person or only one person in isolation, breathing value is captured. When there is no person in the smart factory shop floor, the moving and respiration value will be zero (0).
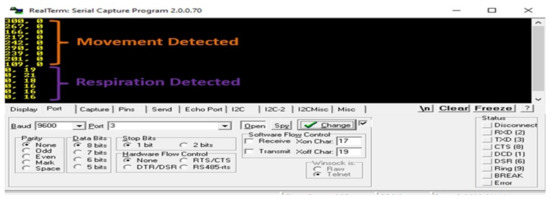
Figure 4.
Visualizing the UWB data output showing the movement and breathing data. The visualization is made possible using the RealTerm Serial capture program 2.0.0.070 version installed in the host computer. The unit of the breathing data is breaths per minute (bpm).
3.4. Light Detection and Ranging (LIDAR) Sensor Description
LIDAR is used to locate the remote worker by collecting the distance and angle data of the remote or isolated worker. In this work, RP-LIDAR A1 by RoboPeak was used. This is a low cost 360 degree 2D laser solution capable of 360 degree scan within 6 to 100 m range depending on the settings. It contains a range scanner system and motor system, as shown in Figure 5. It is connected to the host computer via a Universal Asynchronous Receiver-Transmitter(UART)/USB communication interface. The data output is made of four types: distance (mm), current heading angle of the measurement (degree), quality of the measurement (level), and start flag (Boolean). The meaningful data relevant to the testbed is the distance and current heading angle of the measurement to locate the isolated factory worker. Details of the sensor is found in Reference [51]. To visualize data, there are several options, such as RoboStudio, development SDK available for Windows, x86 Linux, and Arm Linux. However, since we have used windows for other sensors, we maintained same for RP-Light Detection and Ranging (LIDAR) by using RoboStudio application in windows. Figure 6 is a sample of how the data is displayed using RoboStudio application.
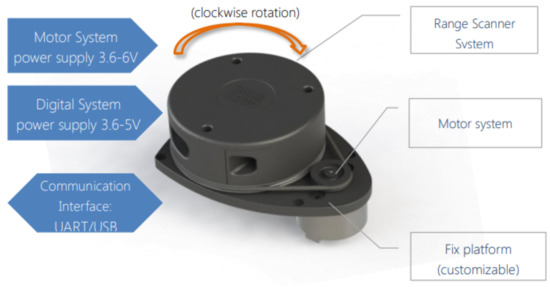
Figure 5.
RP-LIDAR System Connection showing the specification of the motor, scanner, and interface.
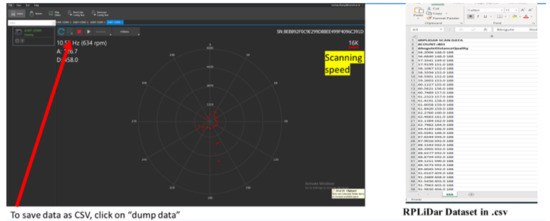
Figure 6.
Visualization and saving of the RP-LIDAR data using RoboStudio application.
3.5. Proposed CNN Architecture Description
Since 2006, deep learning has attracted diverse research applications due to its superior capability over traditional algorithms. One of such deep learning is CNN. CNN have been used in speech recognition, behavior recognition, image classification, face detection, handwriting recognition, and recommender systems. In CNN, learning process is influenced by parameter sharing, sparse intervention, and equivalent representation of data [52].
In Figure 7, the control flow from data input to classification is shown. As is common with all machine learning operation, the dataset to be used is first pre-processed as this enables the would be model to be train with meaningful data. Three basic steps were taken in the pre-processing stage, and they include:
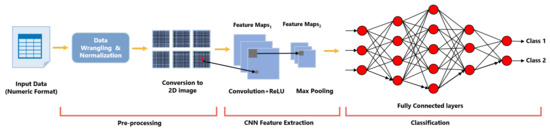
Figure 7.
Control flow of the proposed model showing data input, data pre-processing, and classification. Note that the pre-processing stage involved converting the non-image data to a 2D image, which is the format proper as input to convolutional neural network (CNN) [53].
- Implementing a correlation test. This step is aimed at eliminating data redundancy by removing highly correlated features. Performing of correlation test also reduces the complexity and computational cost of the model.In performing correlation test, we made use of the Pearson Correlation Coefficient (PCC) given as:where is PCC, , and are the standard deviations of X and Y, respectively, and is the covariance.
- Data balancing is done to ensure even distribution of samples in classes. An uneven distribution of the total number of class samples leads to a model that leans/favors the class with majority sample, while the minority sample class(es) suffers.
- The data is converted into an image format. CNN was original meant for image classification, but, over the years, it has evolved and is now being used for both time series classification and feature extraction [53]. As CNN is the algorithm of choice in this paper (mainly due to its high accuracy), there is need to convert the dataset to be used into an image format to be recognized by the CNN.
The imbalance data can be resolved by a process of either undersampling or oversampling. The former leads to loss of (probably) important data as it involves reducing the number of samples in the majority class(es) till it equals that of the minority class. However with oversampling, data loss would no longer occur, and, by using the Adaptive Synthetic (ADASYN) algorithm, synthetic data of the minority class are generated to level up with that of the majority class [54].
The structure of the CNN model used in this paper is presented in Figure 8. It consists of two convolutional layers, each of which is followed by a max pooling layer. Max pooling is carried out to reduce the dimension of the dataset. The convolutional layers have 128 and 64 filters, respectively, and are activated using the Rectified Linear Unit (ReLU) activation function. At the end of the second max pooling layer is a dropout layer, followed by a flatten layer. The output of the flatten layer is fed as input for the fully connected (FC) layer. The FC layers is made up of two dense layers separated by a dropout layer. The primary aim of dropout layers is for the model to unlearn a portion of the previous stage, hence reducing overfitting. Finally, the output layer which gives the final classification result.
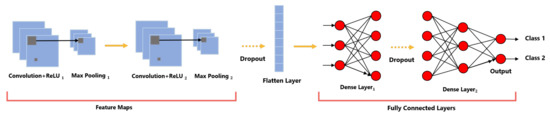
Figure 8.
CNN architecture showing the structures of the two Rectified Linear Unit (ReLU) activated convolutional layers and that of the fully connected layers having two dense layers.
Basically, CNN is a multi-layer neural network made of convolution layers (c-layers) and sub-sampling layers (s-layers) [55]. While the c-layer is for feature extraction, the s-layer is used for feature mapping. One common challenge faced by CNN is the high dimentionality, resulting in overfitting of classifiers. This problem, however, is solved by the pooling process (sub-sampling or down-sampling). The standard way to model a neuron’s output f as a function of its input x is with (4):
or (5)
In terms of training time with gradient descent, these saturating nonlinearities are much slower than the non-saturating nonlinearity . Neurons with this nonlinearity are known as Rectified Linear Units (ReLUs). Deep convolutional neural networks with ReLUs train several times faster than their equivalents with tanh units [56]. System was simulated using keras with graphical processing unit (GPU) 1xTesla K80, 2496 CUDA cores, and 12 GB GDDR5 video random access memory (VRAM) on top of Google colaboratory. Training and testing data were split into 75% and 25%, respectively. The optimizer used is adam, and sparse categorical cross entropy is used for the loss value. In this work, the parameters of the proposed CNN model is summarized in Figure 9.
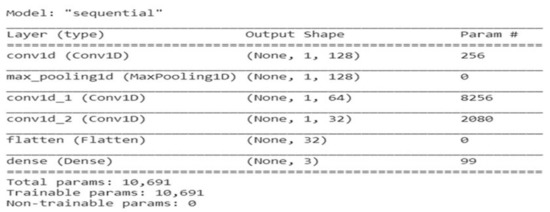
Figure 9.
Summary of the parameters of the proposed CNN.
As observed from Figure 7, we have provided for the conversion of the non-image data to 2D Image format during the pre-processing stage. CNN is commonly designed for images, text and sound data [53]. However, for non-image data, conversion techniques are employed to enable the CNN carry out feature extraction and classification.
4. Performance Evaluation and Lessons Learnt
4.1. Evaluation Metrics
For fair comparison, traditional performance metrics, such as true positive (TP), true negative (TN), false negative (FN), false positive (FP), false alarm rate (FAR), precision, F1-measure, recall, area under receiver operating characteristics (AUC), executive time, and sensitivity, was used. Suffice it to say that a good detection system should have high level of accuracy, precision, recall and F1-measure with low false alarm rate. The accuracy is computed as (6):
On the other hand, FAR is given as (7):
In addition, the Root Mean Squared Error (RMSE), defined as the difference between the actual output and predicted or trained output was used. It is given as
where represents the actual or observed or known value, and represents the predicted value. The RMSE compares the actual and predicted values to determine the level of closeness between them. The smaller the value of RMSE, the closer predicted and actual values.
4.2. Results and Discussion
4.2.1. UWB Dataset Classification
The UWB dataset contains Movement and Respiration data. The data is labeled based on detecting the movement of human in the shop floor or no movement. The value remains zero (0), as long as there is no movement. However, it gave values other than zero once movement is detected. On the other hand, the breathing value gives maximum of 40 (meaning 80 bpm if multiplied by 2) for normal healthy person. The labeling is such that, for bpm between 5–40, we return as normal, while declaring all bpm below as anomaly and needing emergency attention to check the health status of the workers in such factory. Similarly, if there are more than one (1) person in the shop floor, the breathing value is returned as zero since there is no case of isolated factory worker. The data labeled as one (1) if the movement is above 0 means that it is a normal condition; otherwise, it is labeled as zero (0), which means abnormal. On the other hand, if the respiration value is below 5 and above 20, it means abnormal and is labeled as zero, while, if the respiration value is between 5 to 20, it is labeled as normal or one. Figure 10 is the distribution pattern of the UWB dataset. It can be seen from the figure that both the respiration and movement data are randomly distributed.
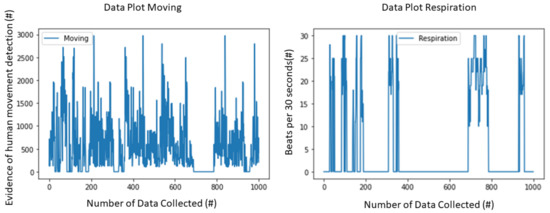
Figure 10.
Visualizing the UWB data output showing the movement and breathing data. The unit of the breathing data is breaths per minute (bpm).
The basic LR algorithm function in Python is used by calling the LR function using Keras. After the simulation, the LR algorithm achieved 97.54% accuracy rate for Movement data, while, for Respiration data, it achieved 100% accuracy rate. So, on average, the LR achieved 98.77% accuracy rate. Similarly, we designed two different KNN algorithms. First KNN (KNN-1) consist of one neighbor, while, for the second KNN, (KNN-4) has 4 neighbors. Based on the simulations, KNN-1 and KNN-4 achieved 97.76% and 98.60% accuracy rate, respectively, for Movement data, while, for Respiration data, both KNNs achieved 100% accuracy rate. So, in summary, KNN achieved 99.32% accuracy rate.The accuracy for SVM, NB all were in the same range of 97%. Loss function plotted for given number of epoch is given in Figure 11. The CNN algorithm achieved 90.04% accuracy rate for Movement data, and 100% accuracy rate for Respiration data.
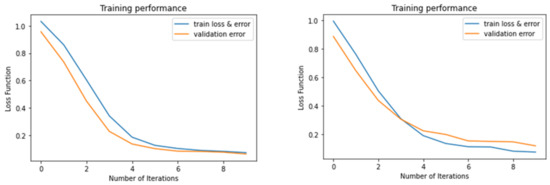
Figure 11.
The first subfigure shows the training performance of the respiration dataset, while the second subfigure shows the training performance of the movement dataset. These training performances are based on the number of iterations to loss function.
4.2.2. Vibration Dataset Classification
The Vibration dataset contains three channels. The data was collected under scenarios, such as excessive vibration, falling human, and falling of object, within the shop floor. This served as the basis for data labeling. Based on simulation result, the CNN algorithm achieved 99.45% accuracy rate for all three channels. Other ML results were LR (88.42%), SVM (57.03%), NB (78.87%), and KNN (94.20%). So, CNN outperformed other ML algorithms for Vibration dataset.
4.2.3. RP-LIDAR Dataset Classification
The RP-LIDAR dataset contains two measurement data. With the customized platform, we set up an angle to capture cases of falling person in the shop floor and cases where there are no falling situations. As already stated, dataset is available on demand. The data is then labeled based on the scenario. The falling person can be within the angular range of values from 0 to 19 degrees. The distance value shows the exact location of the falling person in the smart factory. Figure 12 below is the normal distribution of the angle value of the RP-LIDAR datasets represented in histogram which can be described as symmetrical and unimodal considering the position of the center line. A histogram following the normal distribution law is expected to be symmetrical around its center [57]. There was no significant difference in the performance of all ML and CNN, as they all had 100% accuracy.
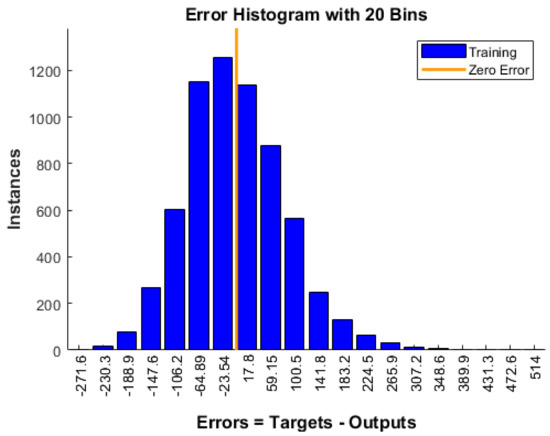
Figure 12.
Error histogram distribution curve of the RP-LIDAR range data.
4.2.4. Summary of Results
Table 1 shows the comparison of the accuracy level of the various machine learning models. From the results, CNN outperformed other ML models, like LR, NB, SVM, and KNN. Figure 13 and Figure 14 are the training and validation accuracy and loss, respectively, of the CNN model. The result shows that CNN outperformed other algorithms.

Table 1.
Model accuracy summary.
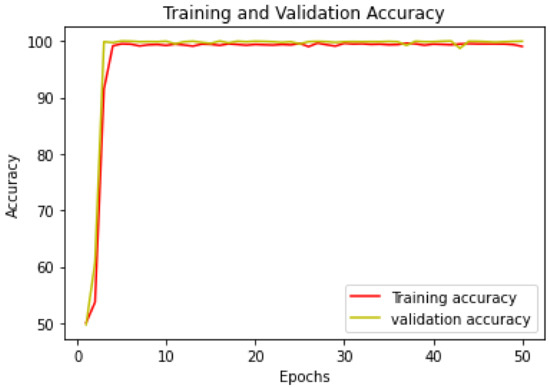
Figure 13.
Training and validation accuracy of the CNN model.
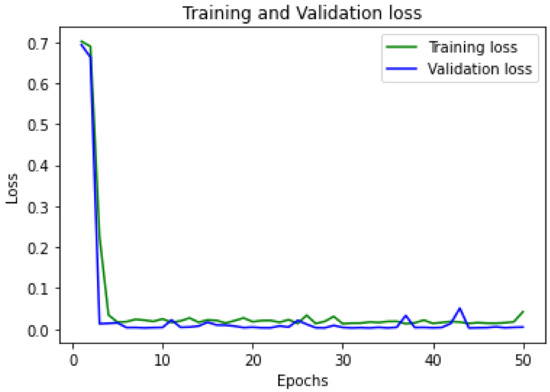
Figure 14.
Training and validation loss of the CNN model.
4.3. Lessons Learnt and Research Gap
Given that, the performance of ML algorithms tend to improve with more data, the scale and quality of the dataset is very relevant. Although much of the data from the shop floor origin is structured, there is the need for task-specific feature engineering or regularization to improve the performance of ML [58]. This is due to the multimodality and time-series alignment of the various input feature data, the intermittent scenario of unstructured data in the case of datasets derived from the sensors. Moreover, real-world time-series data are quite skewed in their distribution which presents another challenge in the form of class imbalance. Given the multitude of ML algorithms, the selection of the most appropriate one for a complex manufacturing process remains a challenge, as there is no universal rule that determines such selections, and multiple algorithms are often trained and tested before the one with best accuracy and generalization ability is selected [58,59]. This limitation can be addressed through a lifelong learning approach where the selected algorithm continuously trains and learns from historical data and evolves over a period of time [60]. In addition, data fusion is still a challenge as sensors had different data types making integration a research concern.
5. Conclusions
This work has presented a simple testbed approach to multiple IoT sensor data gathering and emergency detection using machine learning algorithms. Three sensors were used to collect vibration, breathing, movement, and object distance data. The dataset was collected using the facilities of Daegu Mechatronics and Materials Institute in Korea. The collected dataset were processed and used for the detection and classification of human activity for emergency response. The data comprised of breathing, movement, falling, vibration and normal activities in the smart factory environment. The availability of the dataset will further enrich the research works in this area where data is needed. In addition, various ML algorithms were compared to have a fair view of the best candidate. Results showed that a simple CNN algorithm outperformed other ML algorithms, such as KNN, SVM, LR, and NB, in terms of classification accuracy. It is our future research objective to explore the possibility of using ensemble neural networks over traditional ML. Ensemble neural network can help in enhancing the accuracy of the detection and classification of the vibration and movement data. Improving the data fusion performance by reducing the difference between fused decisions and observations using high-dimensional space to map the correlation of complex relationships between the fused decisions is also a future research direction.
Author Contributions
Conceptualization, formal analysis, investigation, data curation, writing—original draft preparation, methodology, software, C.I.N., F.B.I., M.P.M., and J.-M.L.; validation, C.I.N., J.-M.L., and D.-S.K.; writing—review and editing, C.I.N., and J.-M.L.; visualization, supervision, resources, project administration, funding acquisition, J.-M.L. and D.-S.K. All authors have read and agreed to the published version of the manuscript.
Funding
This research was funded by Priority Research Centers Program through the National Research Foundation of Korea (NRF) funded by the Ministry of Education, Science and Technology (2018R1A6A1A03024003). It is also supported by National Research Foundation of Korea (NRF) grant funded by Korea government (MSIT) (2019R1F1A1064055) and also supported by the MSIT (Ministry of Science and ICT), Korea, under the Grand Information Technology Research Center support program (IITP-2020-2020-0-01612) supervised by the IITP (Institute for Information & communications Technology Planning & Evaluation).
Institutional Review Board Statement
Not Applicable.
Informed Consent Statement
Not Applicable.
Data Availability Statement
The data and codes presented in this study are available on request from the corresponding author. This is according to the laboratory rules.
Conflicts of Interest
The authors declare no conflict of interest. The funders had no role in the design of the study; in the collection, analyses, or interpretation of data; in the writing of the manuscript, or in the decision to publish the results.
Abbreviations
Abbreviations and their corresponding meaning.
| Acronyms | Meaning |
| IoT | Internet of Things |
| IIoT | Industrial Internet of Things |
| AI | Artificial Intelligence |
| PCC | Pearson Correlation Coeffiecient |
| DNN | Deep Neural Network |
| ML | Machine Learning |
| LR | Logistic Regression |
| NB | Naive Bayes |
| RMSE | Root Mean Squared Error |
| USB | Universal Serial Bus |
| CNN | Convolution Neural Network |
| RNN | Recurrent Neural Network |
| KNN | K-Nearest neighbor |
| SVM | Support Vector Machine |
| API | Application Programming Interface |
| IMU | Innertial Measurement Unit |
| UWB | Ultra-Wide Band |
| BPM | Breaths Per Minute |
| LIDAR | Light Detection and Ranging |
| UART | Universal Asynchronous Receiver-Transmitter |
| AUC | Area Under Curve |
| ReLU | Rectified Linear Unit |
| TP | True Positive |
| FP | False Positive |
| TN | True Negative |
| FN | False Negative |
| FAR | False Alarm Rate |
References
- Xu, Q.; Xu, K. Statistical Analysis and Prediction of Fatal Accidents in the Metallurgical Industry in China. Int. J. Environ. Res. Public Health 2020, 17, 3790. [Google Scholar] [CrossRef]
- Pearce, M.; Mutlu, B.; Shah, J.; Radwin, R. Optimizing Makespan and Ergonomics in Integrating Collaborative Robots Into Manufacturing Processes. IEEE Trans. Autom. Sci. Eng. 2018, 15, 1772–1784. [Google Scholar] [CrossRef]
- Heo, S.; Kim, M.; Yu, H.; Lee, W.-K.; Sohn, J.R.; Jung, S.-Y.; Moon, K.W.; Byeon, S.H. Chemical Accident Hazard Assessment by Spatial Analysis of Chemical Factories and Accident Records in South Korea. Int. J. Disaster Risk Reduc. 2018, 27, 37–47. [Google Scholar] [CrossRef]
- Jung, S.; Woo, J.; Kang, C. Analysis of Severe Industrial Accidents Caused by Hazardous Chemicals in South Korea from January 2008 to June 2018. Saf. Sci. 2020, 124, 104580. [Google Scholar] [CrossRef]
- Xu, Q.; Xu, K. Analysis of the Characteristics of Fatal Accidents in the Construction Industry in China Based on Statistical Data. Int. J. Environ. Res. Public Health 2021, 18, 2167. [Google Scholar] [CrossRef]
- Statista. Number of Deaths from Industrial Accidents in South Korea from 2010 to 2019. Statista Research Department. 2021. Available online: https://www.statista.com/statistics/1221800/south-korea-number-of-industrial-accident-deaths/ (accessed on 23 March 2021).
- CIRS. Korean Occupational Safety and Health Act Will Be Implemented from 16 January 2020. Chemical Inspection and Regulation Service (CIRS). Available online: http://www.cirs-reach.com/news-and-articles/Korean-Occupational-Safety-and-Health-Act-will-be-Implemented-from-16-January-2020.html (accessed on 25 March 2021).
- ILO. Occupational Safety and Health Country Profile: Republic of Korea. International Labour Organization. Available online: https://www.ilo.org/safework/countries/asia/korea/lang–en/index.htm (accessed on 26 March 2021).
- Lee, J.; Jin, H.; Potter, M. Fatal Incident Halts Hyundai’s S.Korean Factory after Retooling for New EV. Reuters. 2021. Available online: https://www.reuters.com/article/uk-hyundai-motor-production-idUKKBN2990VI (accessed on 23 March 2021).
- Hossain, M.S.; Nwakanma, C.I.; Lee, J.M.; Kim, D.S. Edge Computational Task offloading Scheme using Reinforcement Learning for IIoT scenario. ICT Express 2020, 6, 291–299. [Google Scholar] [CrossRef]
- Long, N.B.; Tran-Dang, H.; Kim, D.S. Energy-Aware Real-Time Routing for Large-Scale Industrial Internet of Things. IEEE Internet Things J. 2018, 5, 2190–2199. [Google Scholar] [CrossRef]
- Djenouri, Y.; Srivastava, G.; Lin, J.C.W. Fast and Accurate Convolution Neural Network for Detecting Manufacturing Data. IEEE Trans. Ind. Inform. 2021, 17, 2947–2955. [Google Scholar] [CrossRef]
- Burke, R.; Mussomeli, A.; Laaper, S.; Hartigan, M.; Sniderman, B. The Smart Factory: Responsive, Adaptive, Connected Manufacturing. In A Deloitte Series on Industry 4.0, Digital Manufacturing Enterprises, and Digital Supply Networks; Deloitte University Press: Westlake, TX, USA, 2017; Available online: https://www2.deloitte.com/content/dam/insights/us/articles/4051_The-smart-factory/DUP_The-smart-factory.pdf (accessed on 23 March 2021).
- Akpudo, U.E.; Hur, J.-W. A Cost-Efficient MFCC-Based Fault Detection and Isolation Technology for Electromagnetic Pumps. Electronics 2021, 10, 439. [Google Scholar] [CrossRef]
- Khan, M.A.; Kim, J. Toward Developing Efficient Conv-AE-Based Intrusion Detection System Using Heterogeneous Dataset. Electronics 2020, 9, 1771. [Google Scholar] [CrossRef]
- Vijayaraghavan, V.; Rian Leevinson, J. Internet of Things Applications and Use Cases in the Era of Industry 4.0. In The Internet of Things in the Industrial Sector. Computer Communications and Networks; Mahmood, Z., Ed.; Springer: Cham, Switzerland, 2019. [Google Scholar] [CrossRef]
- Min, J.; Kim, Y.; Lee, S.; Jang, T.-W.; Kim, I.; Song, J. The Fourth Industrial Revolution and Its Impact on Occupational Health and Safety, Worker’s Compensation and Labor Conditions. Saf. Health Work 2019, 10, 400–408. [Google Scholar] [CrossRef] [PubMed]
- Samsung SDS. Reducing Factory Accidents through Digital Design and New Technologies-Smart Helmets and FaaS. Customer Experience Innovation Report 2017. AGO30. Available online: https://www.samsungsds.com/la/insights/083017_IR_CX_SmartFactory2.html (accessed on 26 March 2021).
- Park, S.; Lee, S. A Study on Worker’s Positional Management and Security Reinforcement Scheme in Smart Factory Using Industry 4.0-Based Bluetooth Beacons. In Advances in Computer Science and Ubiquitous Computing; Springer: Singapore, 2017; pp. 1059–1066. [Google Scholar] [CrossRef]
- Walenza-Slabe, E.; Jasti, A.; Rocheleau, C.; Previtali, D.; Ramesh, D.; Kowal, J.; Schwarzer, K.; Albrecht, K.; Mass, M.; Klement, P.; et al. Smart Factory Applications in Discrete Manufacuring. In An Industrial Consortium White Paper; Version 1.0, IIC:WHT:IS2:V1.0:PB:20170222; Object Management Group (OMG): Milford, MA, USA, 2017. [Google Scholar]
- Tran, T.K.; Yahoui, H.; Siauve, N. Functional Safety and Industrial Communication Associated for the Smart Factory. In Proceedings of the 27th EAEEIE Annual Conference (EAEEIE), Grenoble, France, 7–9 June 2017; pp. 1–6. [Google Scholar] [CrossRef]
- Kosmowski, K.T. Functional Safety Concept for Hazardous Systems and New Challenges. J. Loss Prev. Process Ind. 2006, 19, 298–305. [Google Scholar] [CrossRef]
- See, A.R.; Kuo, H.-H.; Yang, C.-H. A Portable Remote Emergency Support System (PRESS) for Worker Safety in Noisy Working Environments. In Proceedings of the 2020 IEEE International Conference on Consumer Electronics—Taiwan (ICCE-Taiwan), Taoyuan, Taiwan, 28 September 2020; pp. 1–2. [Google Scholar] [CrossRef]
- Parmar, C.M.; Gupta, P.; Bharadwaj, K.S.; Belur, S.S. Smart work-assisting gear. In Proceedings of the 2018 IEEE 4th World Forum on Internet of Things (WF-IoT), Singapore, 5–8 February 2018; pp. 724–728. [Google Scholar] [CrossRef]
- Longo, F.; Padovano, A.; Umbrello, S. Value-Oriented and Ethical Technology Engineering in Industry 5.0: A Human-Centric Perspective for the Design of the Factory of the Future. Appl. Sci. 2020, 10, 4182. [Google Scholar] [CrossRef]
- Phuyal, S.; Bista, D.; Bista, R. Challenges, Opportunities and Future Directions of Smart Manufacturing: A State of Art Review. Sustain. Futures 2020, 2, 100023. [Google Scholar] [CrossRef]
- Sjödin, D.R.; Parida, V.; Leksell, M.; Petrovic, A. Smart Factory Implementation and Process Innovation. Res. Technol. Manag. 2018, 61, 22–31. [Google Scholar] [CrossRef]
- The Smart Factory Is Here: Top IIoT Capabilities for the Modern Manufacturer. Banner Expert Insight. Available online: https://www.bannerengineering.com/be/en/company/expert-insights/smart-factory-iiot.html (accessed on 3 April 2021).
- Ge, Z.; Song, Z.; Ding, S.X.; Huang, B. Data Mining and Analytics in the Process Industry: The Role of Machine Learning. IEEE Access 2017, 5, 20590–20616. [Google Scholar] [CrossRef]
- Kalsoom, T.; Ramzan, N.; Ahmed, S.; Ur-Rehman, M. Advances in Sensor Technologies in the Era of Smart Factory and Industry 4.0. Sensors 2020, 20, 6783. [Google Scholar] [CrossRef] [PubMed]
- Camarinha-Matos, L.M.; Fornasiero, R.; Ramezani, J.; Ferrada, F. Collaborative Networks: A Pillar of Digital Transformation. Appl. Sci. 2019, 9, 5431. [Google Scholar] [CrossRef]
- Snyder, S.; Meek, D.; Lehtonen, T.; Kiradjiev, P. Smart Manufacturing: AI technologies, intelligent insights. In Expert Insights; IBM Institute for Business Value, IBM Corporation: New York, NY, USA, 2020; Available online: https://www.ibm.com/downloads/cas/ZLKE8R2X (accessed on 26 March 2021).
- Yang, S.; Kaminski, J.; Pepin, H. Opportunities for Industry 4.0 to Support Remanufacturing. Appl. Sci. 2018, 8, 1177. [Google Scholar] [CrossRef]
- Cioffi, R.; Travaglioni, M.; Piscitelli, G.; Petrillo, A.; De Felice, F. Artificial Intelligence and Machine Learning Applications in Smart Production: Progress, Trends, and Directions. Sustainability 2020, 12, 492. [Google Scholar] [CrossRef]
- Wang, P.; Liu, H.; Wang, L.; Gao, R.X. Deep Learning-based Human Motion Recognition for Predictive Context-aware Human-robot Collaboration. CIRP Ann. 2018, 67, 17–20. [Google Scholar] [CrossRef]
- Nwakanma, C.I.; Islam, F.B.; Maharani, M.P.; Lee, J.M.; Kim, D.S. IoT-Based Vibration Sensor Data Collection and Emergency Detection Classification using Long Short Term Memory (LSTM). In Proceedings of the 3rd International Conference on Artificial Intelligence in Information and Communication (ICAIIC 2021),Cheju Halla University, Jeju Island, Korea, 13–16 April 2021. [Google Scholar]
- Ullah, A.; Muhammad, K.; Haq, I.U.; Baik, S.W. Action Recognition using Optimized Deep Autoencoder and CNN for Surveillance Data Streams of Non-stationary Environments. Future Gener. Comput. Syst. 2019, 96, 386–397. [Google Scholar] [CrossRef]
- Nwakanma, C.I.; Anantha, A.P.; Islam, F.B.; Lee, J.-M.; Kim, D.-S. 3GPP Release-16 for Industrial Internet of Things and Mission Critical Communications. In Proceedings of the 2020 International Conference on Information and Communication Technology Convergence (ICTC), Jeju, Korea, 21–23 October 2020; pp. 403–406. [Google Scholar] [CrossRef]
- Roitberg, A.; Perzylo, A.; Somani, N.; Giuliani, M.; Rickert, M.; Knoll, A. Human Activity Recognition in the Context of Industrial Human-robot Interaction. In Proceedings of the Signal and Information Processing Association Annual Summit and Conference (APSIPA), Siem Reap, Cambodia, 9–12 December 2014; pp. 1–10. [Google Scholar] [CrossRef]
- Peruzzini, M.; Pellicciari, M. A framework to design a human-centred adaptive manufacturing system for aging workers. Adv. Eng. Inform. 2017, 33, 330–349. [Google Scholar] [CrossRef]
- Peruzzini, M.; Pellicciari, M.; Gadaleta, M. A comparative study on computer-integrated set-ups to design human-centred manufacturing systems. Robot. Comput. Integr. Manuf. 2019, 55 Pt B, 265–278. [Google Scholar] [CrossRef]
- Suvarna, M.; Büth, L.; Hejny, J.; Mennenga, M.; Li, J.; Ting Ng, Y.; Herrmann, C.; Wang, X. Smart Manufacturing for Smart Cities—Overview, Insights, and Future Directions. Adv. Intell. Syst. 2020, 2, 10. [Google Scholar] [CrossRef]
- Ruan, Y.; Xiao, Y.; Hao, Z.; Liu, B. A Convex Model for Support Vector Distance Metric Learning. IEEE Trans. Neural Netw. Learn. Syst. 2021. [Google Scholar] [CrossRef]
- Available online: https://scikit-learn.org/stable/modules/naive_bayes.html (accessed on 26 February 2021).
- Gámiz, M.L.; Navas-Gómez, F.J.; Raya-Miranda, R. A Machine Learning Algorithm for Reliability Analysis. IEEE Trans. Reliabil. 2020. [Google Scholar] [CrossRef]
- Ayodele, E.; Bao, T.; Zaidi, S.A.R.; Hayajneh, A.; Scott, J.; Zhang, Z.; McLernon, D. Grasp Classification with Weft Knit Data Glove using a Convolutional Neural Network. IEEE Sens. J. 2021. [Google Scholar] [CrossRef]
- Harrou, F.; Zerrouki, N.; Sun, Y.; Houacine, A. An Integrated Vision-Based Approach for Efficient Human Fall Detection in a Home Environment. IEEE Access 2019, 7, 114966–114974. [Google Scholar] [CrossRef]
- Brulin, D.; Benezeth, Y.; Courtial, E. Posture Recognition Based on Fuzzy Logic for Home Monitoring of the Elderly. IEEE Trans. Inform. Technol. Biomed. 2012, 16, 974–982. [Google Scholar] [CrossRef] [PubMed]
- Available online: http://www.umain.co.kr/default/03/01.php (accessed on 26 March 2021).
- LORD USER MANUAL. G-Link-200 Wireless Accelerometer Node, Document 8500-0069 Revision K. Available online: https://www.microstrain.com/sites/default/files/g-link-200_user_manual_8500-0069_rev_k.pdf (accessed on 26 March 2021).
- Available online: http://www.slamtec.com/en/lidar/a1 (accessed on 26 March 2021).
- Liu, W.; Wang, Z.; Liu, X.; Zeng, N.; Liu, Y.; Alsaadi, F.E. A survey of Deep Neural Network Architectures and their Applications. Neurocomputing 2017, 234, 11–26. [Google Scholar] [CrossRef]
- Sharma, A.; Kumar, D. Non-image Data Classification with Convolutional Neural Networks. arXiv 2020, arXiv:2007.03218v1. [Google Scholar]
- Amaizu, G.C.; Nwakanma, C.I.; Bhardwaj, S.; Lee, J.M.; Kim, D.S. Composite and Efficient DDoS Attack Detection Framework for B5G Networks. Comput. Netw. 2021, 188, 107871. [Google Scholar] [CrossRef]
- Tunze, G.B.; Huynh-The, T.; Lee, J.-M.; Kim, D.-S. Sparsely Connected CNN for Efficient Automatic Modulation Recognition. IEEE Trans. Veh. Technol. 2020, 69, 15557–15568. [Google Scholar] [CrossRef]
- Krizhevsky, A.; Sutskever, I.; Hinton, G.E. ImageNet Classification with Deep Convolutional Neural Networks. Adv. Neural Inf. Process. Syst. 2012, 2, 1097–1105. [Google Scholar] [CrossRef]
- Frost, J. Using Histograms to Understand your Data. Introduction to Statistics: An Intuitive Guide for Analyzing Data and Unlocking Discoveries. 2020. Available online: https://statisticsbyjim.com/basics/histograms/ (accessed on 26 March 2021).
- Wuest, T.; Weimer, D.; Christopher Irgens, C.; Thoben, K. Machine learning in Manufacturing: Advantages, Challenges, and Applications. Prod. Manuf. Res. 2016, 4, 23–45. [Google Scholar] [CrossRef]
- Zhu, X.; Li, Y.; Wang, X. Machine Learning Prediction of Biochar Yield and Carbon Contents in Biochar Based on Biomass Characteristics and Pyrolysis Conditions. Bioresour. Technol. 2019, 288, 121527. [Google Scholar] [CrossRef]
- Parisi, G.I.; Kemker, R.; Part, J.L.; Kanan, C.; Wermter, S. Continual lifelong learning with neural networks: A review. Neural Netw. 2019, 113, 54–71. [Google Scholar] [CrossRef]
Publisher’s Note: MDPI stays neutral with regard to jurisdictional claims in published maps and institutional affiliations. |
© 2021 by the authors. Licensee MDPI, Basel, Switzerland. This article is an open access article distributed under the terms and conditions of the Creative Commons Attribution (CC BY) license (https://creativecommons.org/licenses/by/4.0/).