Abstract
A navigation system using a binaural bone-conducted sound is proposed. This system has three features to accurately navigate the user to the destination point. First, the selection of the bone-conduction device and the optimal contact conditions between the device and the human head are discussed. Second, the basic performance of sound localization reproduced by the selected bone-conduction device with binaural sounds is confirmed considering the head-related transfer functions (HRTFs) obtained in the air-borne sound field. Here, a panned sound technique that may emphasize the localization of the sound is also validated. Third, to ensure the safety of the navigating person, which is the most important factor in the navigation of a visually impaired person by voice guidance, an appropriate warning sound reproduced by the bone-conduction device is investigated. Finally, based on the abovementioned conditions, we conduct an auditory navigation experiment using bone-conducted guide announcement. The time required to reach the destination of the navigation route is shorter in the case with voice information including the binaural sound reproduction, as compared to the case with only voice information. Therefore, a navigation system using binaural bone-conducted sound is confirmed to be effective.
1. Introduction
As of 2015, approximately 36 million people were reported to be blind, 217 million people were reported to have moderate to severe visual impairment, and 189 million people were reported to have mild visual impairment [1]. Furthermore, according to the WHO (World Health Organization), in 2019, 2.2 billion people were reported to be visually impaired or blind, and the number of visually impaired people was reported to be increasing [2]. As indicated by these reports, the number of people with visual information impairment is expected to continue to increase. These people do not have access to information from sight and, therefore, need to rely on information from senses other than sight while moving through the city. The safety of walking for such individuals is secured through the use of white canes and various types of sound information.
A visually challenged person perceives the environmental situation using information obtained from sensory organs other than the eyes in all cases, but, especially, when walking in the city, the individual uses information obtained from the auditory and tactile senses. Tactile information is mainly obtained through a white cane and from the unevenness of the ground through the soles of the feet, whereas auditory information is mainly obtained from sounds of approaching cars and other moving objects, footsteps of others, and signal sounds in public spaces. The type of object or its relative position may be determined from the sound, whereas in cases related to human echolocation, the existence of an object is recognized by the sound reflected from obstacles, such as walls [3,4]. According to Rowan et al. [4], humans have been found to use echoes to detect objects. As for the sense of the directionality of objects, Nilsson and Schenkman [5] showed that blind people are more sensitive to binaural sound localization than sighted people. As mentioned above, visually impaired people indirectly detect morphological characteristics in their surrounding environment based on information of sounds in their environment.
In such a situation, various technologies have been proposed to increase the mobility of visually impaired people. Electronic aids for the mobility problems of blind people have been investigated since the 1960s [6]. Hub et al. investigated a new system that assists blind users in orientating themselves in indoor environments [7]. Ding et al. then presented a new blind navigation system [8] for traveling in a city using an RFID (Radio Frequency Identification) tag and wireless and mobile communication. Fernandes et al. newly developed the nav4b system, which combines guidance and navigation with object recognition by extending the traditional aids of the white cane and a smartphone [9]. Dunai et al. presented a new electronic travel aid “acoustic prototype” using a binaural reproduction technology [10] with air-borne sound. In contrast, Rodríguez et al. proposed an obstacle detection and warning system by bone-conduction acoustic feedback to assist visually impaired persons [11].
In recent years, bone-conducted sound technology has been used in various fields. An implantable bone-conducting hearing aid device [12] for people with conductive hearing loss due to damage to the ear canal or middle ear system has been broadly used. On the other hand, this technology has also been widely used in various industries, targeting people, including not only hearing-impaired people, but also healthy people. For example, such systems are used as a communication devices in noisy workplaces [13]. Bone-conducted sound is transmitted via different sound transmission paths as compared to air-borne sound. Since we can acquire information by bone-conducted sounds while also hearing environmental sounds, this system can be applied to the guidance of visually impaired people in the city. Walker and Lindsay studied the navigation performance with bone-conducted sounds inside a virtual environment [14]. The bone-conducted navigation sounds [11,14] are used to increase the ability to hear environmental sounds. Although, the applicability of the presented bonephones to efficient audio navigation was confirmed, the importance of spatialization algorithms using such a database of HRTFs (head-related transfer functions) was also mentioned [14]. Head-related transfer functions are generally used to investigate sound localization by air-borne sound transmission, and the detailed mechanisms of the HRTFs are investigated [15]. This concept may also be applied to bone-conducted sound transmission. Purcell et al. experimentally investigated the bone-conduction transfer functions inside human heads using otoacoustic emissions [16]. In contrast, Chang et al. numerically developed a whole-head human finite-element model to simulate the transmission of the bone-conducted sound [17]. McBride et al. developed head sensitivity mapping to investigate the bone conduction reception by a human head [18].
Although the abovementioned studies have been conducted, binaural reproduction technology in the bone-conducted sound field has not been established, as compared to that in air-conducted sound. Moreover, this technology cannot be applied to localization in the direction of clock positions every 30° in the horizontal plane, which is generally used by visually impaired people when they recognize the direction. Therefore, a navigation system that uses binaural bone-conducted sound reproduction has not yet been put into practice. If the accuracy of the binaural reproduction technique using bone-conducted sounds can be improved to the level of that using air-conducted sounds, then this improvement in accuracy will be greatly beneficial to both healthy and visually impaired people.
In the present study, we develop an auditory navigation system based on binaural bone-conducted sound and obstacle-detection techniques. First, the system reproduces the bone-conducted sound of a voice announcement, i.e., in which direction to move at each corner point. A binaural flashing sound that indicates the direction of the next movement near the corner point is reproduced as the bone-conducted sound, in addition to the voice announcement. The appearance of objects such as other walking people is then announced. Such objects can be detected by the you only look once detection algorithm. Here, a binaural warning sound indicating the direction of the object can be reproduced by bone-conducted sound in addition to the announcement of the appearance of objects. To investigate this navigation system, first, a panning scheme is adopted for the binaural bone-conducted sound to improve the sound localization performance, and the misjudgment of the perceived direction is effectively decreased, especially under a panning angle of 20°. Second, an efficient warning sound is designed through a subjective evaluation investigation in three phases. Through a basic investigation of Phase 1, the risk factor, which is most important as a warning sound, is the highest as a result of the subjective evaluation experiment by the semantic differential method, for the case in which the sound is reproduced as a square wave at a single frequency of 1.2 kHz. Then, in Phases 2 and 3, the appropriate setting of the on/off timing of the square wave reproduction is investigated so that both of the risk and comfort factors have a relatively higher score. Finally, a navigation experiment is conducted using the proposed system, including the obtained panned bone-conducted binaural sound and the efficient warning sound, and the effectiveness of the proposed system was investigated.
2. Proposed Navigation System
An outline of the navigation system developed in the present study is shown in Figure 1. As shown in Figure 1a, this system consists of a bone-conduction device and a camera (RealSense 435i) for obstacle identification mounted on the head and has a GPS (Global Positioning System) for location identification and a PC (Personal Computer) to control the navigation system. The detailed composition of the devices on the head is shown in Figure 1b, whereas that in the waist bag is shown in Figure 1c.
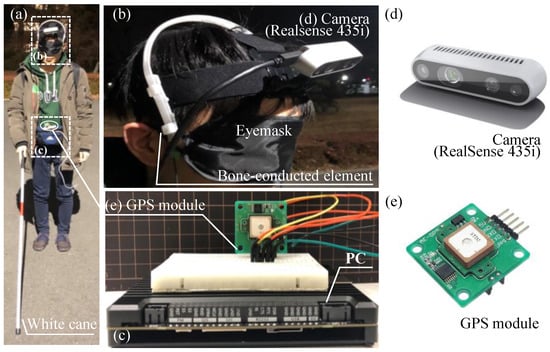
Figure 1.
(a) Overview of the proposed navigation system, (b) bone-conduction device and obstacle detection device (RealSense 435i), (c) GPS module and PC to control the system, and devices adopted for (d) the detection camera and (e) the GPS module.
In this apparatus, the camera firstly monitor the view in front the subject. Then, object detection in front of the subject is performed by using CNN (Convolutional Neural Network). The information related to the object can be announced to the subject by the bone-conducted sound. Secondly, by using the GPS connected to the PC (Arduino Leonardo), the self-location of the subject can be estimated. Then, the route from the location of the subject to the destination is calculated and announced from the by the bone-conducted sound. From the next section, the verification of the sound image localization performance, the design of the warning sound, and finally the navigation experiment to verify the validity of the system will be discussed.
3. Sound Localization Performance of Panned Binaural Sound
The investigated system navigates using a guidance voice that informs the user as to which direction to walk. Then, to increase the perception of the direction of walking, binaural sound reproduction based on bone conduction is applied.
3.1. Details of the Bone-Conduction Device
As a reproduction method of the bone-conducted sound, there are two types of conduction scheme: the direct-bone-drive-type scheme and the over-skin-drive-type scheme. The former type has an implant device, such as a bone-anchored hearing aid (BAHA) [19,20]. This type of bone conduction realizes sound transmission to the inner ear with high efficiency. However, due to the invasive nature of this method, it is difficult to adopt this manner of conduction from the viewpoint of casual usage of bone conduction in a navigation device. In contrast, the latter type of conduction scheme can provide a very-easy-to-wear bone-conduction device due to its non-invasivity, whereas the efficiency of sound transmission by this scheme is slightly decreased compared to the former type of conduction scheme, particularly in higher-frequency ranges. In the present study, to increase the usability of the device, the latter type of scheme was adopted so as to reproduce the bone-conducted sound by pressing the device against the human face.
Figure 2a shows the exciter (COM-10917, Sparkfun Electronics [21]) of the bone-conduction device used in the present study. The device can be excited in the frequency range of from 500 Hz to 12 kHz. The actuator was forced to contact the human face using a hairband-type fixing device, as shown in Figure 2b. The contact position of the actuator was set to P1, as shown in Figure 2c, which was selected in our previous study [22] as the best position to efficiently reproduce the bone-conducted sound.
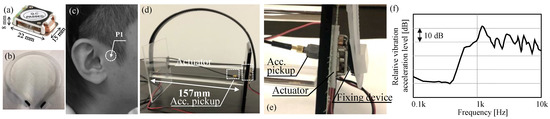
Figure 2.
(a) Actuator used for the bone-conducted sound reproduction, (b) hairband-type fixing device of the actuator, (c) contact position of the actuator, (d,e) measurement settings of the excitation characteristics of the adopted actuator with the fixing device, and (f) measured frequency characteristics of the vibration acceleration exited by the actuator.
In our former study, the excitation performance by the abovementioned actuator was measured by a simple acrylic model of the head, as shown in Figure 2d [22]. As the model of human skin, a thin gel sheet with a thickness of 1 mm was sandwiched between the actuator and the acrylic plate, as shown in Figure 2e. White noise was generated by the actuator fixed by each hairband-type device. The vibration acceleration transmitted to the acrylic plate was measured, as shown in Figure 2f. Since the measured result has generally flat characteristics from approximately 500 Hz up to 10 kHz, this actuator was adopted for the navigation system.
3.2. Procedure of the Sound Localization Test
The present study attempt to achieve high-accuracy sound-image-localization using HRTF measured with a head and torso simulator (HATS). However, the results of the experiments performed in our previous study [22] showed that misjudgments often occurred in both air-borne and bone-conducted sound reproduction, as shown in Figure 3, due to various factors, one of which was that each of the individual HRTFs of the subject was not used in this experiment.
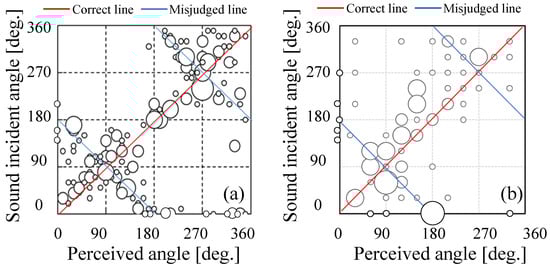
Figure 3.
Sound localization performance for the cases in which the test signals were presented by (a) air-conducted sound and (b) bone-conducted sound [22].
To guide a visually impaired person using binaural reproduction, the accuracy of sound localization performance should be as high as possible to guarantee the spatial resolution of every direction of the clock positions used by visually impaired people for direction recognition (every 30°, twelve divisions of 360° in the horizontal plane). In the present study, the improvement of the accuracy of the sound localization in bone-conducted sound reproduction was investigated using the following panning method.
The panning method moves the reproduced sound image to the left and right to improve the human perception of sound localization. Figure 4 shows an overview of the panning method. The angle F from the front to the direction of O is the main angle, and the angle θ from the direction of position A to that of position B is the panning angle. The main angle Φ is fixed at every 30° in the horizontal plane, following the method of clock position. The sound for the direction of O was played back 3 dB louder than that for the directions of A and B, so that the subjects could distinguish the panning sound. The switching time between the signals was set to 0.5 s. In the present study, three panning angles, 10°, 20°, and 30°, were evaluated. The reproduced sound is a flashing sound that was generated by convolving the dry source of the flashing sound and the HRTFs measured with the HATS by KEMAR, provided by the Massachusetts Institute of Technology (MIT) [23]. Note that the flashing sound will be used in the main navigation system to guide the subjects in the target direction.
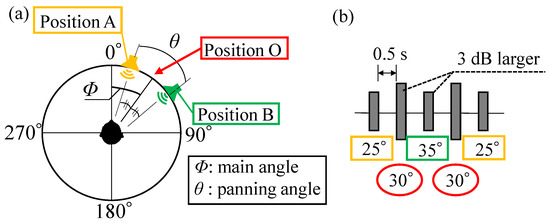
Figure 4.
Overview of the sound reproduction method. (a) Procedure for generating panned sounds and (b) example of reproduction sound.
In the sound localization tests, the subjects were surrounded by twelve virtual sound sources placed at 30° intervals in the horizontal plane (main angle: Φ), and subjects reported the perceived incoming direction of the sound reproduced at random. As the subjects, ten males in their 20 s were adopted.
3.3. Results and Discussion
Figure 5 shows the results of the sound localization tests, in which the sound image was moved at panning angles of θ = 10°, 20°, and 30°. In the case of θ = 20° or 30°, misjudgment of the front and rear images was less pronounced than for the case in which θ = 10°. In particular, θ = 20° reduced the misjudgment of the sound image, which resulted in the most appropriate angle among the three conditions. The reasons why θ = 20° was more appropriate than the other angles are as follows. First, θ = 10° was so narrow that panning of the sound source was not perceived by the subjects. Second, the sound image of θ = 30° was mistakenly perceived as the neighboring clock position. Based on these results, θ = 20° was adopted in the panning scheme of the navigation sound in the system.
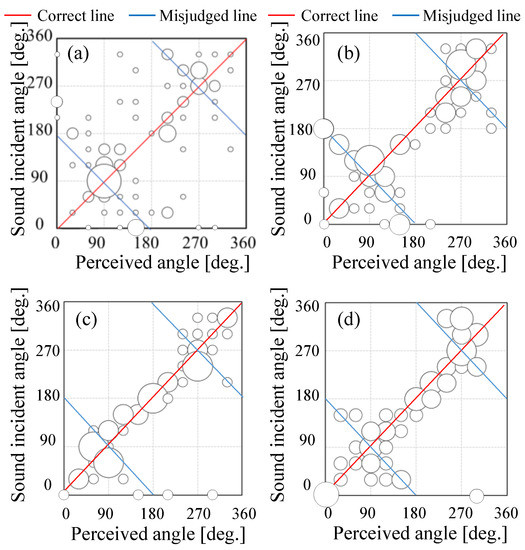
Figure 5.
Results of sound localization tests. (a) θ = 0°, (b) θ = 10°, (c) θ = 20°, and (d) θ = 30°.
4. Design of the Warning Sound
The navigation system should be able to reproduce immediately the warning sound when an obstacle appears in front of the walking user. Moreover, it is more appropriate for a visually impaired person to be able to perceive the direction of the obstacle based on the binaural warning sound. To design desirable warning sounds, human impressions of warning sounds with various time and frequency characteristics, which are reproduced by the bone-conduction device, are measured through subjective experiments. Since bone-conducted sound can be heard even while the ear canal is unblocked, background environmental sounds can also be heard simultaneously, and such sounds have acoustic effects on bone-conducted sounds. For this reason, the experiment was carried out by simultaneously wearing both the bone-conducted device and headphones.
The discussion in this section is separated based on the following three phases of Table 1: Phase 1; determination of the basic waveforms of the warning sound (triangle, square, and sawtooth waves), and Phases 2 and 3; determination of the duration of the playback and pausing times for the warning signal reproduction, respectively. In Phase 1, the square wave was found to be the most suitable as a warning sound among the three waveforms mentioned above. In Phase 2, we distributed the playback and pausing (on-off) interval between 0.1 s and 1.6 s to investigate the influence of these time parameters on the sound evaluation. Since this phase showed that a warning sound based on a pausing time of 0.1 s was preferable, we also investigated shorter pausing times between 0.01 and 0.1 s in Phase 3. The details of these studies are described below.

Table 1.
Each of the contents investigated in the three phases.
4.1. Phase 1
4.1.1. Experimental Scheme
A total of nine test sounds, shown in Table 2, were generated and used in the experiment. The subjects were asked to evaluate the randomly reproduced test sounds based on the semantic differential (SD) method. In this experiment, the 27 adjectives shown in Table 3 were adopted to evaluate the warning sounds. To evaluate the extent of each adjective, seven bipolar categories were adopted. The subjects were ten males in their 20s. As described above, the experiment was carried out by simultaneously wearing both the bone-conduction device and headphones. The evaluated warning sounds and environmental sounds were then played through the bone-conduction devices and headphones, respectively. The headphones reproduced environmental sounds recorded by HATS on the campus of the Tokyo University of Science. The recorded environmental sounds were captured in a rather calm situation (Leq: 56 dB) without any human voices but including some road traffic noise from a distant road. Note that the environmental sound data was reproduced by the headphones at the same level (Leq: 56 dB) as the that of the on-side environment. The reproduction level of the warning sound from the bone-conduction device was fixed by following the scheme described in the next section.
Table 2.
List of the warning sounds adopted in Phase 1 of the present study.
Table 3.
List of the 27 pairs of adopted adjectives.
4.1.2. Determination of Sound Reproduction Volume
The volume of sound reproduction by the bone-conduction device was separately fixed for each of the subjects as follows. In this adjustment, the subjects wore both the headphones and the bone-conduction device to compare the bone-conducted and air-conducted sounds. The output volume of the bone-conducted sound reproduction was determined so that the subjective loudness of the pure tone of 1 kHz reproduced by the bone-conduction device was equivalent to that reproduced by the headphones. For this adjustment, the following procedure was performed. A subject first listened to the reference air-borne sound of the abovementioned pure tone of 1 kHz through the headphones. After that, the subject listened to the same sound through the bone-conduction device and controlled the output volume of the bone-conduction device by freely turning the volume controller of the audio interface. Note that the pure tone of 1 kHz was reproduced at 66 dB SPL. The reproduction level of 66 dB was selected because the warning sound should be clearly heard with a sufficient S/N. For this reason, the reproduction level of the sound was fixed as 66 dB, which is 10 dB higher than the background level of 56 dB in Leq. The adjusted individual output volume into the channels for bone-conducted sound reproduction actuators was fixed throughout the experiment. Note that the output volume of each subject was not so different and was in the range of a few decibels.
4.1.3. Results for Phase 1
The experimental results obtained by the SD test are shown as profile ratings in Figure 6. These figures show the average values for the scores of all subjects. To identify the factors concerning the subjective impressions of the warning sound, factor analysis based on the Promax rotation was performed. The estimated results are shown in Table 4. As shown in the table, three factors, each of which has an eigenvalue of over 1.0, were extracted by following the Kaiser–Guttman criterion. The factors with high correlation are indicated by red characters. As shown in the table, each of the adjectives is categorized into factors. These results suggest that the participant impressions of the warning sound can be generally described using three factors: risk, discomfort, and timbre. Herein, to consider the important factors that can provide user safety and comfort, each of the warning sounds was evaluated through Factors 1 and 2. The factor scores of Factors 1 (risk) and 2 (discomfort) calculated based on the results of the factor analysis are illustrated in Figure 7.
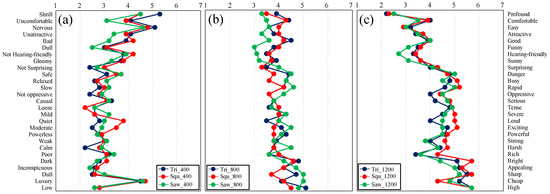
Figure 6.
Average profile ratings obtained by the semantic differential (SD) test for (a) 400 Hz, (b) 800 Hz, and (c) 1200 Hz.
Table 4.
Experimental results of factor analysis in case of Phase 1.
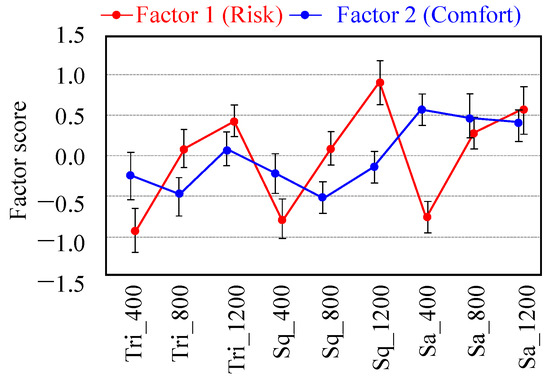
Figure 7.
Average factor scores and associated SDs (error bars indicate 95% confidence intervals).
As shown in Figure 7, the scores for Factor 1 (risk) are higher at 1.2 kHz and lower at 400 Hz for all of the wave types. The 1.2-kHz square wave had the highest score. On the other hand, the scores for Factor 2 (discomfort) were higher at 800 Hz, except for the sawtooth wave. However, the condition of Squ_1200 has relatively higher scores for Factor 2 as well as Factor 1. Therefore, in the next section, detailed time transient characteristics of the warning sound for a square wave with 1.2 kHz will be discussed.
4.2. Phase 2
The method by which to enhance the warning characteristics of a square wave with 1.2 kHz was investigated. To improve the warning effect, we focused on the length of the playback and pausing times of the warning sound, which corresponds to the on/off timing of the square wave.
4.2.1. Experimental Scheme
Ten warning sounds with different on/off time characteristics having total durations of 7 s were prepared, as shown in Table 5. The patterns of the test sounds were divided into two categories indicated by Patterns A and B. The sounds of Pattern A were set by fixing the on (playback) time as 0.2 s and distributing the off (no sounds) times from 0.1 s to 1.6 s, whereas those of Pattern B were set by simultaneously changing the on and off times. The test tones were randomly played back and rated using seven bipolar seven categories with 27 adjective pairs, which are the same as the previous section. The volume of sound reproduction was unified to the arithmetic mean of each of the adjusted reproduction levels. Ten males in their 20 s were also chosen as subjects in Phase 2.
Table 5.
List of warning sounds adopted for Phase 2 of the present study.
4.2.2. Results for Phase 2
The experimental results obtained by the SD test are shown as profile ratings in Figure 8. The factor analysis based on the Promax rotation was also performed. The estimated results are shown in Table 6. As shown in the table, three factors, each of which has an eigenvalue of over 1.0, were extracted. These results suggest that the impressions of participants regarding the warning sound can also be generally described by the three factors, risk, comfort, and timbre, whereas the components of the adjectives are slightly different from those of Phase 1. In this evaluation phase, each of the warning sounds was also evaluated using Factors 1 (risk) and 2 (comfort). The factor scores for Factors 1 and 2 calculated based on the results of the factor analysis are illustrated in Figure 9a,b, respectively.
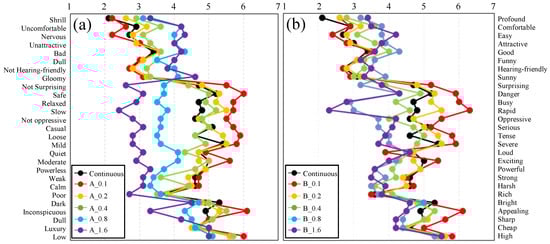
Figure 8.
Average profile ratings obtained by the SD test for (a) Pattern A and (b) Pattern B.
Table 6.
Experimental results of factor analysis in case of Phase 2.
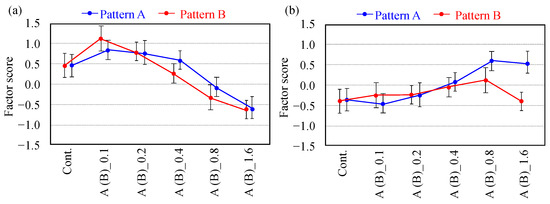
Figure 9.
Average factor scores and associated SDs (error bars indicate 95% confidence interval) for (a) Factor 1 (risk) and (b) Factor 2 (comfort).
As shown in Figure 9a, the scores for Factor 1 (risk) for both Patterns A and B become higher as the off times become shorter, except for the continuous sound. As shown in the figure, B_0.1 had the highest score of the risk factor. This may be due to the fact that this warning sound had the shortest flashing cycle, because, as shown in Figure 8, the scores for the adjectives of danger, tense, and severe become higher as the off times become shorter. On the other hand, as shown in Figure 9b, the scores for Factor 2 (Comfort) for both Patterns A and B become lower as the off times become shorter. To investigate the effect of the on/off timing for the case in which the on/off times are shorter than 0.1 s, the additional experiment in Phase 3 was conducted, as described in the next section.
4.3. Phase 3
In this additional experiment, the effect of on/off times rather shorter than 0.1 s, as set in the previous section for the risk and comfort factors, was investigated.
4.3.1. Experimental Scheme
Six warning sounds with different on/off time characteristics, as shown in Table 7, were divided into two categories, indicated as Patterns A and B. Under these conditions, the durations of on/off times are composed of time intervals shorter than 0.1 s. The sounds of Pattern A were set by fixing the on (playback) time as 0.2 s and distributing the off (no sounds) time from 0.01 s to 0.05 s, whereas those of Pattern B were set by simultaneously changing the on and off times. The test tones were randomly played back and rated on seven monopolar categories from strongly agree (score: 7) to strongly disagree (score: 1), with two adjectives of “danger” and “comfortable”. In this evaluation, the warning sound of B_0.1 investigated in the previous section was reproduced as a reference sound before each test sound. Then, the extent of these adjectives was rated so that the same extent as that by the B_0.1 is rated as four (neutral) among these categories. The volume setting of sound reproduction and the number of subjects are the same as in Phase 2.
Table 7.
List of warning sounds adopted for Phase 3 of the present study.
4.3.2. Results for Phase 3
The experimental results obtained by the SD test are shown for the extent of danger and comfort in Figure 10a,b, respectively. As shown in Figure 10a, the scores for Patterns A and B slightly decrease as the off times increase, whereas the scores for A_0.01, A_0.02, and B_0.01 are almost the same (slightly higher than the score of 4, which was equivalent to the reference sound of B_0.1). The scores for A_0.01 and A_0.02 are almost the same because A_0.01 and A_0.02 are indistinguishable due to excessively fine on and off time intervals. On the other hand, as shown in Figure 10b, the scores for both Patterns A and B increase for the case in which the score is less than 4 as the off times increase.
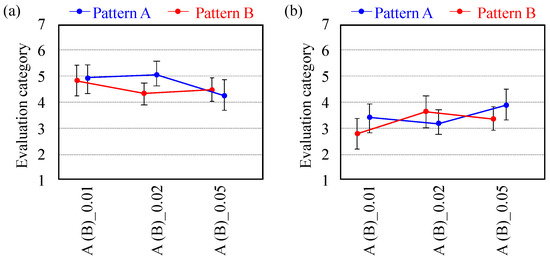
Figure 10.
Average evaluation scores and associated SDs (error bars indicate 95% confidence intervals) for the extent of (a) danger and (b) comfort.
Further study is required to determine the most appropriate warning sound in a human navigation system. However, a warning sound should balance both risk and comfort factors because the usability of the sound will be decreased if the warning sound provides an uncomfortable feeling to the user. Based on the results for Phase 3, the comfort score decreases, whereas the risk score increases slightly, as the on and off time intervals are shorter than 0.1 s. Thus, the most appropriate condition among the warning sounds was judged to be B_0.1, and this condition was adopted as the warning sound in the navigation experiment conducted in the next section.
5. Evaluation of the Proposed Navigation System
5.1. Experimental Scheme
The navigation experiment was conducted at the Noda campus of the Tokyo University of Science, as shown in Figure 11. The route of navigation is from S to G in the figure. Note that there were no stairs or steps in order to prevent injury of the subjects. Four sighted males in their 20 s participated in the experiment. All four subjects were quite familiar with the route because all of the subjects were students of the Noda campus of the Tokyo University of Science. The subjects used an eye mask and a white cane, as shown in Figure 1a, to simulate a visually impaired person. To ensure safety, an assistant (person) closely followed the subject. Table 8 shows the three experimental conditions for the different navigation sounds. Condition 1 gives quite basic information concerning the direction in which the subject should walk when the subject arrived at each of the junctions from C1 to C8. Detailed voice guidance reproduced at each junction is shown in Table 9. As shown in this table, the voice indicating the direction stated, “Please turn right in the 2/3/9/10 o’clock direction”, which is often used to guide visually impaired people. Conditions 2 and 3 provide additional information of binaural flashing sounds indicating the traveling directions of 60°, 90°, 270°, and 300°, as shown in Figure 4a, the sound localization performances of which were confirmed in Section 3.2. Note that the panned sound with a 20° swing angle was considered for the flashing sound. In addition, conditions 2 and 3 give voice information on obstacles, such as a walking person, a bicycle, or a chair, in front of the subject. In condition 3 only, a binaural warning sound indicating the obstacle direction was also reproduced.
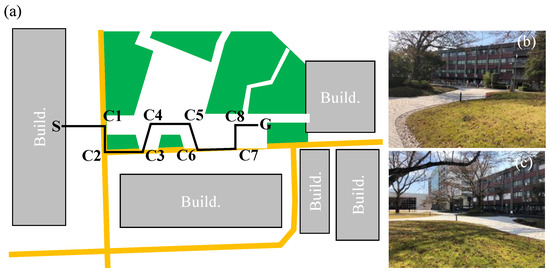
Figure 11.
(a) Route of the navigation experiment and photographs of the landscape (b) from S to C2 and (c) from C5 to G.
Table 8.
Experimental conditions.
Table 9.
Voice information on the direction in which to move at each of the junctions from C1 to C8.
In the experiment for each condition, the subjects walked all routes one time without “blindness”. Thereafter, as practice in conducting the experiment, the subjects also walked all routes one time with “blindness”. Finally, as the main experiment, the subjects walked a route following the indicated information for each condition. Note that, in condition 1 only, the assistant guided the subject when walking in the wrong direction because the traveling direction of condition 1 is quite unclear due to the lack of binaural sounds.
To avoid the effect of familiarity with the walking route in the experiment caused by the order of navigation for conditions 1, 2, and 3, the order of the three conditions was randomized for each of the four subjects, and the experiments using these three conditions were conducted after an interval of a few days between each condition.
5.2. Evaluation of Each Navigation Condition
Three evaluation methods were adopted as follows: (1) the total time to walk from S to G, (2) the walking path on each of the three conditions obtained by GPS trajectory, and (3) a subjective evaluation questionnaire after the navigation experiment. Each of the questionnaires was answered based on a five-category bipolar scale or a yes/no option, as shown in Figure 12.
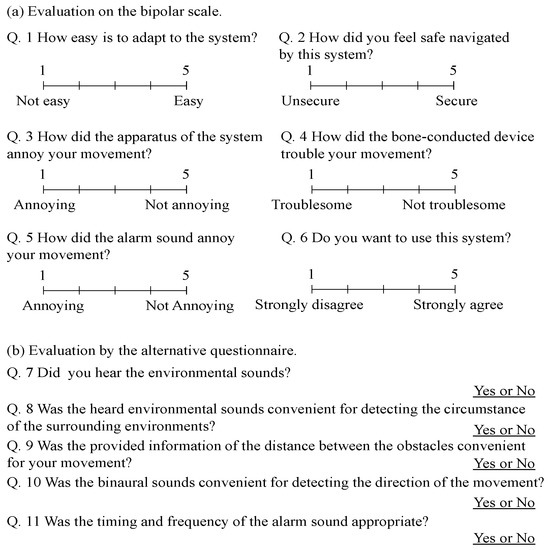
Figure 12.
(a) Subjective evaluation questionnaire based on a five-category bipolar scale and (b) yes/no options.
5.3. Determination of Self-Location of Subjects
The self-location of the subjects was estimated based on the GPS. A GPS receiver kit adopting a small high-sensitivity GPS receiver kit GYSFDMAXB (TAIYO YUDEN), shown in Figure 1e, was used. This GPS receiver kit was connected to the Arduino Leonard on the Lattepanda alpha 864 s via GPIO code and a breadboard, and the latitude and longitude data were obtained from the GPS receiver kit via serial communication. The data transfer between Arduino and Lattepanda was performed every 1 s using the Arduino IDE and the Pyserial library installed in the Python program. After receiving the data, the distances between the present position and each of the positions from C1 to C8 and G are calculated and used for the navigation. If the distance between the present location and one of the points became shorter than 4 m, then the voice information of Table 9 was reproduced.
5.4. Method of Obstacle Detection
A high-resolution depth sensor (RealSense 435i [24]) and the “you only look once” (YOLO) object detection algorithm, which detects objects by CNN, were adopted. To reduce the computational cost of the CPU of Lattepandaalpha864, the Tiny-YOLOv2 was used instead of YOLOv2. The frame rate of the video monitored by the camera was set to 4 FPS. This is because the walking speed and stride length of a visually impaired person with a white cane are approximately 1 m/s and 0.55 m, respectively. The frame is then refreshed twice for each step at this frame rate.
This system can detect what the object is, as well as the distance to the object. The experiment was conducted in the campus courtyard, so that the target of the detection was limited to a walking person or a moving bicycle. When a person or bicycle is recognized as an obstacle in the walking path, the object name, and the distance from the subject to the detected object are announced, as shown in Table 10.
Table 10.
Voice guidance for obstacle avoidance.
In this system, the digital image is acquired at every frame at 640 × 480 pixels. When the object in the image is detected by a CNN as a person or a bicycle, the object is surrounded by a bounding box in the image. If the center coordinate of the bounding box is in the left-side rectangular area with a size of 210 × 480 pixels, then the binaural warning sound in the direction of 330° was reproduced. If the center coordinate is in the center rectangular area with a size of 210 × 480 pixels, the sound for 0° was reproduced. In cases other than these two conditions, the sound for 30° was reproduced.
5.5. Results and Discussion
The trajectories of the induction paths in conditions 1, 2, and 3 are shown in Figure 13, whereas the times required to reach the goal are shown in Figure 14. First, in all three conditions, the subject can walk from point S to point G. However, for each condition and subject, the trajectories differ slightly from each other. As mentioned in the previous section, the subjects had a chance to practice walking the route and were quite familiar with the route. However, the subjects often became lost and were unable to reach their goals, as indicated by paths A, B, and C in Figure 13. For example, in the case of path A, the subject was slightly confused and eventually became lost. In the case of path B, the subject also became lost, but eventually reached his goal. However, in the case of path C, the subject did not recognize the timing to turn right and eventually reached his goal via an incorrect route. Note that, at these points of becoming lost, the assistant following the subject guided the subject in the correct direction. The fact that the subjects are sighted and so are not accustomed to walking under “blindness” conditions may be one reason for the abovementioned confusion.
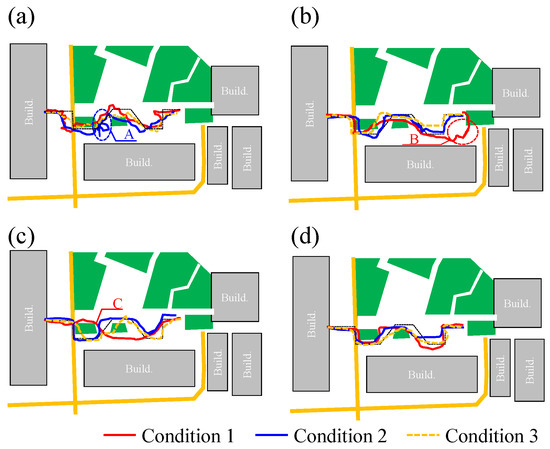
Figure 13.
Walking paths of the four subjects from (a–d).
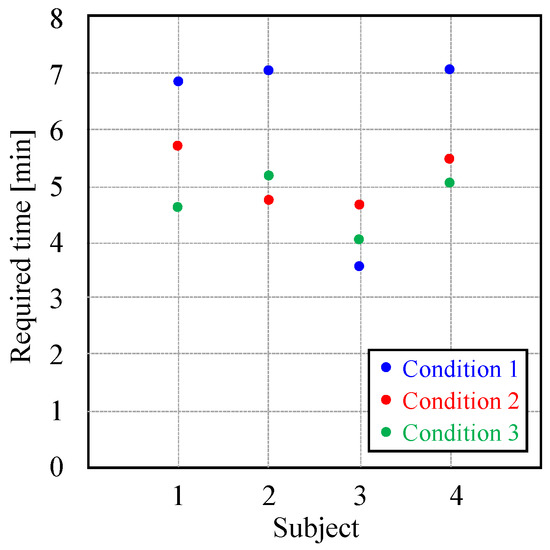
Figure 14.
Required time for each subject and condition.
Although some confusion was observed during navigation, the subjects could generally walk the route without any support by the assistant. The reason for this is that the information on the variation of the texture on the road surface obtained by the white cane is of great use in blind walking. However, the time required to reach the goal largely varied depending on each condition. The time required for conditions 2 and 3, including information on obstacles with binaural sound reproduction, was largely shorter than that required for condition 1, in which only voice guidance was provided. In the case of subject 3, the order of the required time was not the same as those of the other subjects. In particular, the required time in the case of condition 1 is quite short. This is because, as mentioned previously, the subject failed to recognize the timing to turn right and followed an incorrect route. By comparing conditions 2 and 3, the required time for condition 3 was generally shorter than that for condition 2 in the case of subjects 1, 3, and 4. The reason for this is considered to be that the direction of the obstacle can be detected based of the binaural warning sound, and the subjects were able to walk without worry.
Next, the subjective evaluation results are shown in Table 11. Comparing conditions 1, 2, and 3, the usability of the system is increased in conditions 2 and 3. In conditions 2 and 3, the subjects reported that the binaural sound largely helped them to imagine the route (all of the subjects answered “Yes” for Q. 10). Due to the usage of the bone-conducted sounds with the ear of the subject open, all subjects answered “Yes” for Q. 7 and Q. 8, in which the convenience of the environmental sounds for detecting the circumstance of the surrounding environment is evaluated. As indicated by Q. 9, it was useful for all subjects to present a distance between the subject and other objects. In other questions regarding ease of adaptation for the system (Q. 1), the feeling of safety when using the system (Q. 2), and the total convenience obtained from the system (Q. 6), the average scores for condition 3 were the highest.
Table 11.
Results of subjective evaluation.
In contrast to the abovementioned tendency, the annoyance of the warning sound (Q. 5 in condition 3) varied among subjects. This is because, to design the warning sound in Section 4, the most important factor of the warning sounds was set to “risk”. However, in the practical use of the system, this result suggests that the factor of “comfort” is also important when the user is walking using this system.
6. Conclusions
A navigation system using a binaural reproduction technique with bone-conducted sound was proposed, and the effectiveness of the proposed system was investigated through a navigation experiment. First, sound localization experiments for panned binaural sound reproduction by bone-conducted sound were carried out. Although misjudgments between the front and back directions were caused in the condition without any panning due to the use of the head transfer function measured using a dummy head, the misjudgment was effectively decreased, especially in the condition with a panning angle of 20°. Second, to inform the user of the navigation system that objects, such as walking people, have been detected in front of the user, an efficient warning sound was designed through subjective evaluation investigation in three phases. Through a basic investigation of Phase 1, the risk factor, which is quite important as a warning sound, was highest when the sound was played back on a 1.2 kHz square wave. Then, in Phases 2 and 3, an appropriate variation of the on/off timing of the square wave reproduction was investigated so that both the risk and comfort factors have higher scores in all conditions. Finally, a navigation experiment was carried out using the proposed system, including a panned bone-conducted binaural sound and an effective warning sound. The time required to reach the goal of the navigation route was shorter in the case with the voice information, binaural sound guidance, and sound information on an object in front of the subject, as compared to the case with only voice information. A navigation system using binaural bone-conducted sound was confirmed to be effective, although the current accuracy and functions are not sufficient for practical navigation of a blind person walking alone in a city. In the future, the proposed navigation system will be improved to obtain a more accurate navigation system by conducting more practical navigation tests in cooperation with visually impaired people.
Funding
This research received no external funding.
Institutional Review Board Statement
Not applicable.
Informed Consent Statement
Informed consent was obtained from all subjects involved in the study.
Data Availability Statement
Not applicable.
Acknowledgments
The author would like to thank K. Takai and A. Nakamura for technical assistance with the subjective evaluation tests and navigation experiments.
Conflicts of Interest
The author declares no conflict of interest.
References
- Bourne, R.R.A.; Flaxman, S.R.; Braithwaite, T.; Cicinelli, M.V.; Das, A.; Jonas, J.B.; Keeffe, J.; Kempen, J.H.; Leasher, J.; Limburg, H.; et al. Magnitude, temporal trends, and projections of the global prevalence of blindness and distance and near vision impairment: A systematic review and meta-analysis. Lancet Glob. Health 2017, 5, E888–E897. [Google Scholar] [CrossRef]
- World Health Organization. Blindness and Vision Impairment. 2019. Available online: https://www.who.int/en/news-room/fact-sheets/detail/blindness-and-visual-impairment (accessed on 8 April 2021).
- Kolarik, A.J.; Cirstea, S.; Pardhan, S.; Moore, B.C.J. A summary of research investigating echolocation abilities of blind and sighted humans. Hear. Res. 2014, 310, 60–68. [Google Scholar] [CrossRef] [PubMed]
- Rowan, D.; Papadopoulos, T.; Edwards, D.; Allen, R. Use of binaural and monaural cues to identify the lateral position of a virtual object using echoes. Hear. Res. 2015, 323, 32–39. [Google Scholar] [CrossRef] [PubMed]
- Nilsson, M.E.; Schenkman, B.N. Blind people are more sensitive than sighted people to binaural sound-location cues, particularly inter-aural level differences. Hear. Res. 2016, 332, 223–232. [Google Scholar] [CrossRef] [PubMed]
- Charden, G. A mobility aid for the blind. In Proceedings of the Rotterdam Mobility Research Conference; American Foundation for the Blind: New York, NY, USA, 1965. [Google Scholar]
- Hub, A.; Diepstraten, J.; Ertl, T. Design and development of an indoor navigation and object identification system for the blind. ACM SIGACCESS Access. Comput. 2003, 147–152. [Google Scholar] [CrossRef]
- Ding, B.; Yuan, H.; Zang, X.; Jiang, L. The research on blind navigation system based on RFID. In Proceedings of the 2007 International Conference on Wireless Communications, Networking and Mobile Computing, Shanghai, China, 21–25 September 2007; pp. 2058–2061. [Google Scholar]
- Fernandes, H.; Faria, J.; Paredes, H.; Barroso, J. An integrated system for blind day-to-day life autonomy. In Proceedings of the 13th International ACM SIGACCESS Conference on Computers and Accessibility, Dundee Scotland, UK, 18–22 October 2011; pp. 225–226. [Google Scholar]
- Dunai, L.; Peris-Fajarnés, G.; Lluna, E.; Defez, B. Sensory navigation device for blind people. J. Navig. 2013, 66, 349–362. [Google Scholar] [CrossRef]
- Rodríguez, A.; Yebes, J.J.; Alcantarilla, P.F.; Bergasa, L.M.; Almazán, J.; Cela, A. Assisting the visually impaired: Obstacle detection and warning system by acoustic feedback. Sensors 2012, 12, 17476–17496. [Google Scholar] [CrossRef] [PubMed]
- Tjellström, A.; Håkansson, B.; Granström, G. Bone-anchored hearing aids: Current status in adults and children. Otolaryngol. Clin. N. Am. 2001, 34, 337–364. [Google Scholar] [CrossRef]
- Horie, S. Improvement of occupational noise-induced temporary threshold shift by active noise control earmuff and bone conduction microphone. J. Occup. Health 2002, 44, 414–420. [Google Scholar] [CrossRef]
- Walker, B.N.; Lindsay, J. Navigation performance in a virtual environment with bonephones. In Proceedings of the ICAD05-Eleventh Meeting of the International Conference on Auditory Display, Limerick, Ireland, 6–9 July 2005. [Google Scholar]
- Iida, K.; Oota, M. Median plane sound localization using early head-related impulse response. Appl. Acoust. 2018, 139, 14–23. [Google Scholar] [CrossRef]
- Purcell, D.W.; Kunov, H.; Cleghorn, W. Estimating bone conduction transfer functions using otoacoustic emissions. J. Acost. Soc. Am. 2003, 114, 907–918. [Google Scholar] [CrossRef] [PubMed]
- Chang, Y.; Kim, N.; Stenfelt, S. The development of a whole-head human finite-element model for simulation of the transmission of bone-conducted sound. J. Acoust. Soc. Am. 2016, 140, 1635–1651. [Google Scholar] [CrossRef] [PubMed]
- McBride, M.; Letowski, T.; Tran, P. Bone conduction reception: Head sensitivity mapping. Ergonomics 2008, 51, 702–718. [Google Scholar] [CrossRef] [PubMed]
- Tjellström, A.; Lindström, J.; Hallén, O.; Albrektsson, T.; Brånemark, P.I. Osseointegrated titanium implants in the temporal bone. A clinical study on bone-anchored hearing aids. Am. J. Otol. 1981, 2, 304–310. [Google Scholar] [PubMed]
- Håkansson, B.; Reinfeldt, S.; Persson, A.C.; Jansson, K.J.F.; Rigato, C.; Hultcrantz, M.; Eeg-Olofsson, M. The bone conduction implant—A review and 1-year follow-up. Int. J. Audiol. 2019, 58, 945–955. [Google Scholar] [CrossRef] [PubMed]
- Sparkfun. Available online: https://www.sparkfun.com/products/10917 (accessed on 22 March 2021).
- Asakura, T.; Takai, K. Effect of the contact condition of the actuator on the sound localization of bone-conducted reproduction. Acoust. Sci. Tech. 2019, 40, 259–264. [Google Scholar] [CrossRef]
- Gardner, B.; Martin, K. The MIT Media Lab: HRTF Measurements of a KEMAR Dummy-Head Microphone. Available online: https://sound.media.mit.edu/resources/KEMAR.html (accessed on 8 April 2021).
- Intel Real Sense. Available online: https://www.intelrealsense.com/depth-camera-d435i/ (accessed on 22 March 2021).


Publisher’s Note: MDPI stays neutral with regard to jurisdictional claims in published maps and institutional affiliations. |
© 2021 by the author. Licensee MDPI, Basel, Switzerland. This article is an open access article distributed under the terms and conditions of the Creative Commons Attribution (CC BY) license (https://creativecommons.org/licenses/by/4.0/).