Abstract
The removal of Cr(VI) ions from aqueous solutions with wet pomace treated with laponite was investigated. A direct comparison with untreated biomass revealed an increase in both the rate of adsorption and the amount adsorbed. A cooperative interaction between the laponite platelets and biomass surface making more adsorption sites accessible was suggested. In this process, a key role is played by intraparticle diffusion. The experimental results indicate that intraparticle diffusion plays an important role in the adsorption process. A simple diffusion-binding model is presented to discuss the experimental results. The diffusion lifetime is linearly related to the adsorbent mass. The model combined with experimental results allowed us to estimate the average free path of a Cr(VI) molecule. Particularly, it was obtained that, in 1 dm of solution, the diffusion path increased by nearly 1 cm per gram of adsorbent. However, this did not imply that the amount of Cr(VI) removed decreased because the total number of adsorption sites also increased.
1. Introduction
The majority of consumable vegetable oils must be refined in order to eliminate undesirable substances affecting the quality of the oil. On the contrary, the quality of olive oil in terms of free fatty acids makes its refining unnecessary and the oil can be consumed as “virgin olive oil” [1]. Virgin olive oil is produced by the mechanical pressing of olive fruits and the olive oil is released from the oil bodies of the fruits, and together with many other ingredients, forms the bulk olive oil [2]. The malaxation step aims to destroy the oil bodies (inner structure of the olives acting as tiny reservoirs) and liberate the oil. After the first pressing of the olives remains a mixture of the pulp and stones of olives, which constitute the solid olive mill waste. Many reports indicate that such residue is a combustion material for heating, due to its content of cellulose, hemicellulose and lignin [3,4,5,6]. It was also reported that olive mill waste has good adsorbing capacity of heavy metals [7,8,9].
It is well known that the uncontrolled disposal of olive mill waste produces severe environmental problems. In order to prevent serious damage to the environment, various alternatives can be adopted. With this in mind, in recent years we investigated the ability of solid olive mill waste to adsorb heavy metals and in particular Cr(VI). The adsorption process is affected by the chemical composition of biomass as well as its surface characteristics. On the other hand, several experimental investigations have established good potentiality for the composites of solid olive mill waste clays to be used as adsorbent for the removal of pollutants from wastewater [10,11,12]. Furthermore, various types of nanoclays such as kaolinite nanosheets and halloysite nanotubes have become important targets for applications in bioremediation [13].
In this study, the adsorption behavior of solid olive mill waste treated with laponite was investigated. The research had a dual purpose: on the one hand, to analyze the adsorption of the treated biomass; and on the other hand, how a highly plastic synthetic clay [14] modifies the surface of organic residue. In this study, the ability of solid olive mill waste treated with laponite (LAP) to adsorb chromium (VI) from aqueous solutions was investigated. The first objective was addressed by directly comparing the amount of Cr(VI) adsorbed on equal quantities of treated and untreated biomass. The second was approached by analyzing the role of intraparticle diffusion in the adsorption process. The experimental results were interpreted on the basis of a simple binding–diffusion model to justify the evidence of a reinforced adsorption capacity towards Cr(VI).
2. Materials and Methods
2.1. Chemicals
Laponite RD, i.e., the synthetic hectorite of chemical formula [Si8Mg5.5O20(OH)4]−0.7, manufactured by Rockwood Additives BYK, was kindly offered for this research. Potassium chromate (K2CrO4) (assay > 95%) from Carlo Erba Reagents, Milan Italy. Both chemical products were used without further purification for all experiments.
2.2. Biomass
The biomass, used for adsorption investigations, was wet pomace produced by a laboratory miniplant with a capacity from 50 to 100 kg· h (OLIOMIO, Toscana Enologica Mori). The material was a pulpy matter containing oil, water, small pieces of kernels, pulp debris and pieces of leaves. It was immediately stored at 18 C until use. Hereafter, it will be referred to as biomass WP.
2.3. Preparation of Cr(VI) Stock Solution
A stock solution of K2CrO4 was prepared by dissolving 0.0750 g in 0.500 dm of ultra pure water (UPW). The stock solution was designed to have a metallic chromium (Cr) concentration of 40 mg·dm. The pH of stock solution was 7.60. For batch adsorption experiments, the stock solution was diluted as necessary.
2.4. Preparation of Natural Adsorbent
An appropriate amount of biomass WP was centrifuged at 800 rpm for 20 min at room temperature in order to separate the liquid oil from the solid residue. The solid material was mixed with n-hexane to eliminate the trace of oil and WAS dehydrated by ethanol. The solid material was stored in a dryer until constant mass. The separation yield of the solid biomass was about 30%. Herein, we will refer to it as natural adsorbent.
2.5. Preparation of Treated Adsorbent
LAP (2.000 g) was dispersed into 0.200 dm of UPW and the mixture was stirred at 350 rpm. Then, 5.00 g of natural adsorbent was added and the mixture was stirred continuously for about 3 days. Finally, the sample was collected into tubes and centrifuged at 8000 rpm for 20 min. The centrifuged solid was dried in an oven at 60 C for about 2 days. The dry solid was pounded in a mortar until an apparently homogeneous powder was obtained. Hereafter, we will label this composite as WPLAP.
In order to carry out adsorption measurements, 2.5 g of LAPWPwas placed in a flask and mixed with 0.250 dm of K2CrO4 solution at 48.1 M. The pH of the resulting mixture was 7.20. Other measurements were performed by preparing the mixture with the same procedure, namely keeping both the initial chromium concentration and solution volume fixed, but using 1.5, 5.0 and 10 g of adsorbent. In order to evaluate the effect of LAP on Cr(VI) uptake, kinetic measurements with 2.5 g of adsorbent were carried out in parallel both with treated and natural biomass.
The thermal analysis equipment consisted of a DSC–TG unit, TA Instruments Model Q-600. An empty platinum crucible served as a reference. A heating rate of 10 C min was used during all the experiments. The samples were analyzed in dry nitrogen at 100 mL min in the temperature range 20–900 C. The sample mass was around 15–25 mg in all the experiments.
2.6. Uptake Measurements
All measurements were performed at 25 C and the Cr(VI) concentration decrease was determined by a UV/vis spectrophotometer Cary 100-Varian equipped with thermostated cells. For every investigated system, absorption spectra were recorded at room temperature in the 200–800 wavelength region and Cr(VI) was calculated from the area under each spectrum by applying the calibration curve method. Samples were in a shaking water bath vibrating at 30 oscillation per min. At regular intervals, 1 mL of solution was withdrawn, and the UV–visible spectrum was acquired and fed back into the initial solution. All uptake measurements were performed in duplicate and the accuracy was estimated by the mean root-mean-square error which was around 10–15%. The amount of Cr(VI) adsorbed on the solid was obtained using the following matter balance formula:
where (mol·dm) and (mol·dm) are the Cr(VI) concentration at time t and 0, respectively, and V (dm) is the solution volume and W (g) the adsorbent mass.
3. Diffusion-Binding Model
Considering a mass m of the adsorbent, which is suspended in K2CrO4 solution of concentration , the adsorbate diffuses into the solid and is adsorbed on the interior surface area. The rate accumulation in the solid results [15]:
where is the diffusion coefficient of Cr(VI) ion in solution, t is the time, and is the Laplacian operator. The reaction term, is an empirical expression. In general, the Laplacian operator involves all three spatial coordinates, however, we will mainly be concerned with systems where the symmetry allows this diffusion term to be written as a function of a single spatial coordinate.
Cr(VI) ions penetrate the pores of the composite, diffuse into the solid and bind to specific sites. We assume that the binding process is described by the following reaction [16]:
where A, S and AS represent Cr(VI), adsorption site, and complex Cr(VI)-solid, respectively. Therefore, one can write:
where , i.e., the concentration at position z and time t in the solid, assumes the form:
In order to solve this differential equation, a relationship between and must exist.
Actual solid concentration is related to by the matter balance, thus:
Since the binding reaction proceeds very rapidly compared with the pore diffusion, we made the assumption that a local steady state
and consequently, we have:
where has been used.
At low penetrant concentration so that Equation (10) can be rewritten as
Equation (11) describes the rate of change in Cr(VI) concentration in terms of an effective diffusion coefficient, defined as
where it is evident that the binding to specific sites hinders the molecular diffusivity by the factor . Equation (11) has to be solved in some region such as with a given initial value of at the instant , and with boundary conditions at the ends of the region.
We seek a solution of Equation (11) in a solid sheet which satisfies the boundary and initial conditions:
For the sake of simplicity, we assume that the concentration at one end of the region reaches the equilibrium value, i.e., . By applying the well-known method of variable separation [17], one finds the following solution:
with .
Comparison with Equation (1) yields the following equation for the amount of A component adsorbed on the solid:
By averaging over the entire solid, the uptake rate is determined:
where the diffusion lifetime [18]:
is introduced.
Thus, the model predicts that the diffusion time against the adsorbent concentration increases linearly, at a low Cr(VI) concentration.
4. Results and Discussion
4.1. Thermal Characterization of Biomass WP
As pointed out elsewhere, TG measurements within a group of specimens provide information about the structural change undergone by the material [19]. Figure 1a shows TG and DTG profiles for biomass WP measured in N2 atmosphere. The TG curve exhibits two main mass loss contributions. The first mass loss in the range of 20–200 C has to be ascribed to water evaporation or the elimination of volatile substances. The second major mass loss in the range of 200–700 C is due to pyrolysis. Although the TG curve in the pyrolysis region appears to show only one mass loss, the DTG curve shows three different peaks in this region. Such peaks can be more easily interpreted from the DSC curve, which is the result of the pyrolysis of the sample. Indeed, as one can see in Figure 1b, the first major peak, from room temperature to 165 C, is due to the water amount and volatile compounds. The second peak around 290 C can be attributed to hemicellulose decomposition. The third peak centered at 330 C is ascribed to the cellulose decomposition. Finally, the fourth largest peak around 425 C is due to the lignin decomposition [20].
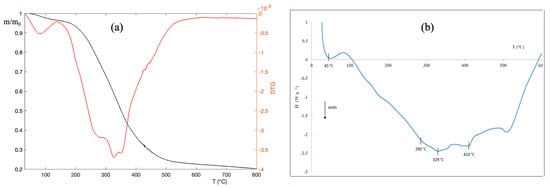
Figure 1.
(a) TG and DTG curves of biomass WP. Measurements were performed under N2 stream (100 cm min) and at a heating rate of 10 C min; (b) the DSC profiles of biomass WP were obtained by measurements performed under N2 stream (100 cmmin) and a heating rate of 10 C min.
4.2. Spectral Characterization of Cr(VI) Aqueous Solutions
In aqueous solutions, Cr(VI) gives rise to different chemical equilibria involving various ionic species (speciation) [8,21]. In Figure 2a, the absorption spectra of K2CrO4, at 25 C, for 0.96, 1.92, 3.85, 7.69, 9.61, 19.6, 50.0, 76.9 M concentrations, were collected. It was immediately seen that, for each concentration investigated, the spectrum exhibited two distinct bands. Since at pH = 7.6, CrO42− and HCrO4− are the predominant species, the following equilibrium:
can be considered as largely responsible for the spectra displayed in Figure 2a [8,21].
CrO4−2 + H2O ⇄ HCrO4− + OH−
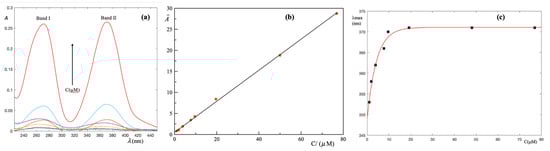
Figure 2.
Results of the spectrophotometric measurements on aqueous solutions of K2CrO4 at different concentrations in the range of 0.960–76.9 M. (a) The absorption spectra show two distinct bands whose intensity increases with increasing Cr(VI) concentration; (b) the integral absorbance of the individual samples is a linear function of Cr(VI) concentration and can be used as a calibration line; (c) increasing Cr(VI) concentration of of band II shifts to longer wavelengths and reaches a plateau.
Indeed, the electronic configuration of Cr(VI) is 3d4s corresponding to a state , then the probability of d–d transitions is negligibly small. In addition, the formal charge on Cr atom () is very high so that electrons flow from O atoms to the Cr atom. In other words, both bands shown in the spectra of Figure 2a are the result of the charge transfer. If the molecular structure of the CrO4−2 ion is analyzed, one finds that it is perfectly symmetrical since the metal is surrounded by four perfectly equivalent O atoms. Hence, the representative band II is wide and centered in the range of 360–373 nm. On the contrary, in the HCrO4− molecule, the neutralization of an O atom reduces the symmetry and makes the charge transfer more energetic. As a result, the representative band I shifts to lower wavelengths and is displayed at 262 nm. A careful inspection of Figure 2a reveals that increasing the Cr(VI) concentration, band I remains practically fixed while band II shifts to longer wavelengths.
Whilst it can be seen that only the peak wavelength, can hardly capture information about the molecular structure and it is convenient to refer to integral absorbance, this allows us to generalize Beer’s law [22]. Mathematically, it assumes the following form:
where is a wavelength (in nm) within the experimental interval and C is the Cr(VI) molar concentration. In Figure 2b, is plotted as a function of Cr(VI) concentration (M). The relationship between and C is established by fitting the first-degree polynomial, , to experimental data. A linear least square method is used for determining the parameters and and the goodness of the fit is confirmed by a high correlation coefficient . Accordingly, this polynomial is used as a calibration line to convert the integral absorbance into Cr(VI) concentration.
The effect of Cr(VI) concentration was studied by monitoring , i.e., the wavelength corresponding to the maximum of band II, as a function of C. The results are displayed in Figure 2c. A detailed numerical analysis indicates that experimental results are well described by a saturation curve of the type:
where C is the Cr(VI) molar concentration, and a and b are adjustable parameters.
It is immediately deduced that:
In short, at a high Cr(VI) concentration, band II remains constantly centered at nm. It is worth noting that this value coincides with the theoretically established value for pure CrO42− [23]. On the contrary, at low Cr(VI) concentration, each ion is more effectively surrounded by water molecules which hydrate the Cr(VI) molecule more strongly, i.e., with a high energy content interaction, and the shifts towards lower values.
4.3. Uptake Measurements
Figure 3 shows (for the sake of simplicity, the subscript A has been omitted) vs. the contact time between the Cr(VI) solution and either the LAPWP or natural adsorbent.
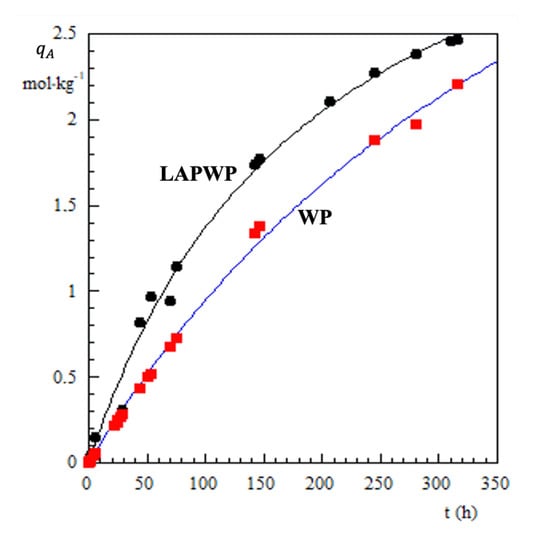
Figure 3.
Cr(VI) adsorbed on natural biomass (red squares) (WP) and biomass treated with LAP(dark points), (LAPWP).
The inspection of Figure 3 reveals that adsorption on LAPWP is faster than on natural adsorbent. Furthermore, the amount of chromium retained by LAPWP biomass is approximately 25% higher than natural adsorbent.
Dry biomass immersed into liquid water absorbs about 40% of its mass. Accordingly, one can estimate that the LAPWP sample contains about 0.4% LAP dispersed in the organic matrix. With this in mind, the experimental results displayed in Figure 3 must consider a synergistic effect between the LAP structure and biomass. Indeed, LAP particles are disk-shaped with a thickness of 1 nm and a diameter of 25 nm. In aqueous medium, at pH 7.6, the faces of the disks assume a negative charge, while the edges exhibit a positive charge [24]. Furthermore, at pH = 7.6, the biomass surface is slightly negative. Thus LAP-platelets orient their edges to bond with the biomass surface, causing a very extensive perturbation in its three-dimensional structure. This molecular rearrangement of biomass makes many more binding sites accessible for CrO42−, HCrO4− ions. In other words, the synergistic interaction between LAP-platelets and the biomass surface produces a greater number of adsorption sites to the Cr(VI) species. Obviously, the individual molecules diffuse into the material before binding to the adsorption sites. Namely, the diffusion process plays a key role in understanding the synergic interaction between LAP and the organic matrix of the biomass. To gather information in this direction, uptake measurements were performed in the presence of 1.5, 2.5, 5 and 10 g of LAPWP adsorbent, while the Cr(VI) concentration (48.1 M) and the dispersion volume (0.250 dm) were kept constant. All of experimental results are presented in Figure 4 where as a function of the contact time, t, is plotted, for each amount of LAPWP used.
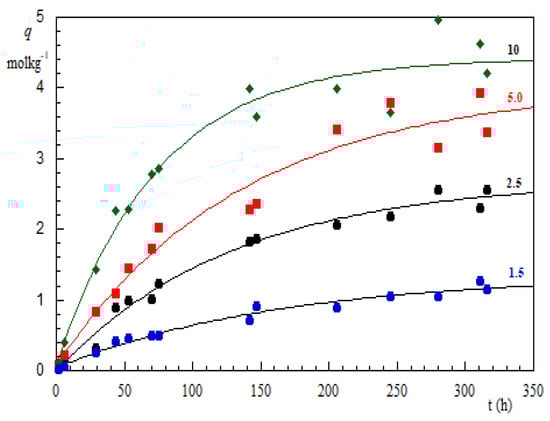
Figure 4.
Cr(VI) amount adsorbed on biomass LAPWP as a function of the contact time. The number on each curve indicates the grams of LAPWP dispersed in 0.25 dm of Cr(VI) solution at 48.1 M. Each measurement was in duplicate and the root-mean-square error of the measurements was estimated to be 10–15%.
It is evident that increasing the LAPWP mass increases the corresponding uptake curve. Such a trend is mostly attributed to an increase in the adsorbent surface area and the availability of more active binding sites on the surface of the adsorbent. Of course, to evaluate the role of diffusion, the term has to be determined. Here, we apply the procedure developed to extract the sedimentation limiting height from the experimental data [25].
It is empirically verified that a plot vs. exhibits a linear trend whereby was evaluated by a linear best-fit, as shown in Figure 5. Having obtained , the dimensionless ratio is plotted as function of t, as shown in Figure 6a.
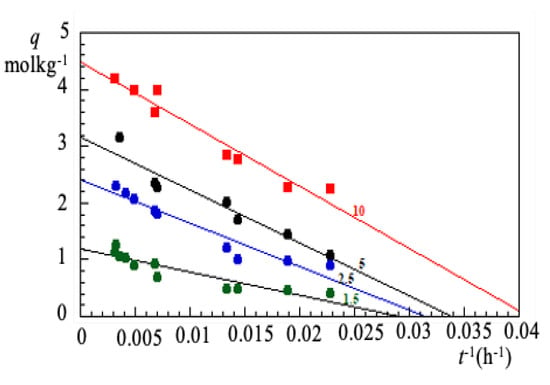
Figure 5.
Cr(VI) amount adsorbed on biomass LAPWP as a function of the (contact time). The number on each curve indicates the grams of LAPWP dispersed in 0.25 dm of Cr(VI) solution at 48.1 M.The linearity of the experimental curve, for long contact times, allows the extrapolation of at infinite time.
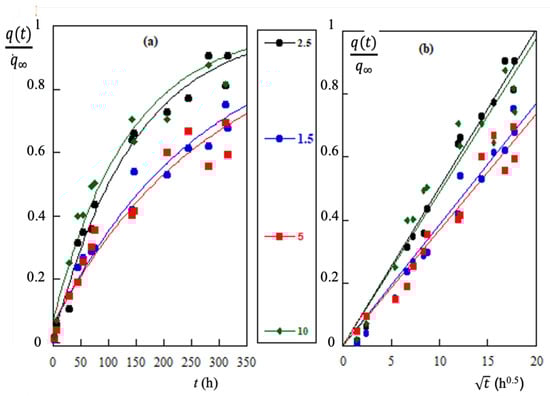
Figure 6.
(a) Adsorption results of Cr(VI) on LAPWP adsorbent at 25C, shown by continuous curves, represent the fitting of Equation (18) to the experimental data. (b) Adsorption results of Cr(VI) vs. . The linearity of plots indicates that the experimental data are well approximated by parabolic diffusion law. The numbers in the middle column represent the adsorbent mass (g) dispersed in 0.25 dm of Cr(VI) solution at 48.1 M.
The curves are well fitted to Equation (19), that is to say the experimental values are in good agreement with what would be predicted by the diffusion-binding model. However, if the adsorption process is actually governed by diffusion, the ratio has to verify the parabolic law of diffusion [17]. For this reason, the experimental values of Figure 6a are also plotted as a function of in Figure 6b. The straight line obtained confirms the prediction based on Equation (19), in other words, the diffusion-binding model explains the experimental results of Cr(VI) adsorption on LAPWP.
According to Equation (18), by the slope of lines in Figure 6b, one can calculate the lifetime . The results obtained are shown in Figure 7 as a function of the amount of LAPWP per volume unit (, gdm).
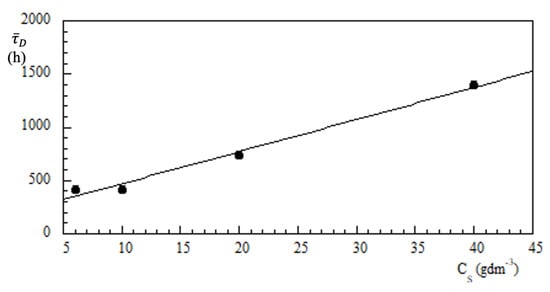
Figure 7.
Diffusion lifetime vs. LAPWP concentration. Experiments were carried out in a volume of 0.25 dm and an initial concentration of Cr(VI) of 48.1 M.
The best-fit gives an intercept, i.e., h and h·dmg. This means that, when the volume is fixed at 1 dm, the diffusion time increases by 1800 min for each gram of LAPWP used in the adsorption process.
The molecular diffusion coefficient of Cr(VI) in water solution, , at M, is calculated by literature equations [26]. Therefore, by assuming , and the same in the material pores, we can estimate the increase in length that a Cr(VI) molecule undergoes (in 1 dm of solution) per gram of material. In other words, letting be the diffusion length increment, we find cm per gram of LAPWP. Namely, each gram of LAPWP produces an increase in the diffusion path of about 1 cm. In other words, the path to reach the adsorption site lengthens by an average of 1 cm. Of course, this does not mean that the material adsorbs less Cr(VI) because the total number of the sites increases.
5. Conclusions
A wet pomace was obtained from a two-phase continuous plant and thermally characterized. The biomass was treated with LAP and used as a solid adsorbent to remove Cr(VI) from aqueous solutions. Uptake measurements made on both WP and LAPWP biomass show that the treated biomass adsorbs about 25% more Cr(VI). The amount of LAP retained in the biomass was 0.4% of the mass. Then, a synergistic effect between the LAP platelets and the biomass surface is suggested. The synergy, i.e., the cooperativity [24] between the interactions, releases more adsorption sites for CrO4−2 and HCrO4− ions. In this process, intraparticle diffusion plays a key role in reaching the adsorption sites. Experimental results indicate that diffusion plays a fundamental role, so they can be interpreted on the basis of a simple diffusion-binding model. Diffusion lifetime, , appears to be linearly correlated to the LAPWP concentration, indicating that in 1 dm of Cr(VI) 48.1 M solution, the diffusion time increases by about 30 h for each gram of adsorbent. By assuming that the diffusion coefficient of Cr(VI) in water, , remains the same even in the pores of the material, we estimated that the diffusion length increases by approximately 1 cm per gram of LAPWP. In other words, the distance traveled by a Cr(VI) molecule before being adsorbed increases by about 1 cm for each gram of LAPWP (in 1 dm of solution). Obviously, this does not correspond to a decrease in Cr(VI) adsorbed because the total number of adsorption sites increases.
Author Contributions
Conceptualization, methodology, L.A.; software, M.P. formal analysis, M.P.; investigation, F.D.N.; data curation, G.B.; writing—original draft preparation, S.S.; project administration, L.A. All authors have read and agreed to the published version of the manuscript.
Funding
This research received no external funding.
Acknowledgments
The author thak Giuseppe D’Amato for the IT support during the drafting of the paper.
Conflicts of Interest
The authors declare no conflict of interest.
Abbreviations
The following abbreviations are used in this manuscript:
| LAP | Laponite |
| UPW | Ultra pure water |
| WP | Wet pomace |
| LAPWP | Wet pomace treated with laponite |
| DSC | Differential scanning calorimetry |
| TG | Thermal gravimetry |
| DTA | Differential thermal gravimetry |
| Integral absorbance at concentration C | |
| Diffusion coefficient of species A | |
| Molar concentration of species A | |
| Amount of species A adsorbed on solid | |
| Wavelength corresponding to the maximum of the band | |
| Diffusion lifetime of species A | |
| Diffusion lifetime of species A at zero solid concentration |
References
- Boskou, D. Olive Oil: Chemistry and Technology; Boskou, D., Ed.; Elsevier: Amsterdam, The Netherlands, 2015. [Google Scholar]
- Del Caro, A.; Vacca, V.; Poiana, M.; Fenu, P.; Piga, A. Influence of technology, storage and exposure on components of extra virgin olive oil (Bosana cv) from whole and de-stoned fruits. Food Chem. 2006, 98, 311–316. [Google Scholar] [CrossRef]
- Morvová, M.; Onderka, M.; Morva, I.; Chudoba, V. Pyrolysis of olive mill waste with on-line and ex-post analysis. Waste Biomass Valorization 2019, 10, 511–520. [Google Scholar] [CrossRef]
- Guida, M.Y.; Hannioui, A. A review on thermochemical treatment of biomass: Pyrolysis of olive mill wastes in comparison with other types of biomass. Prog. Agric. Eng. Sci. 2016, 12, 1–23. [Google Scholar] [CrossRef]
- Ouazzane, H.; Laajine, F.; El Yamani, M.; El Hilaly, J.; Rharrabti, Y.; Amarouch, M.Y.; Mazouzi, D. Olive mill solid waste characterization and recycling opportunities: A review. Prog. Agric. Eng. Sci. 2017, 8, 2632–2650. [Google Scholar]
- Dinc, G.; Isik, F.; Yel, E. Effects of Pyrolysis Conditions on Organic Fractions and Heat Values of Olive Mill Wastes Pyrolysis Liquid. J. Energy Resour. Technol. 2020, 142, 1–13. [Google Scholar] [CrossRef]
- Martinez-Garcia, G.; Bachmann, R.T.; Williams, C.J.; Burgoyne, A.; Edyvean, R.G.J. Olive oil waste as a biosorbent for heavy metals. Int. Biodeterior. Biodegrad. 2006, 58, 231–238. [Google Scholar] [CrossRef]
- Mosca, M.; Cuomo, F.; Lopez, F.; Palumbo, G.; Bufalo, G.; Ambrosone, L. Adsorbent properties of olive mill wastes for chromate removal. Desalin. Water Treat. 2015, 54, 275–283. [Google Scholar] [CrossRef]
- Venditti, F.; Cuomo, F.; Ceglie, A.; Ambrosone, L.; Lopez, F. Effects of sulfate ions and slightly acidic pH conditions on Cr(VI) adsorption onto silica gelatin composite. J. Hazard. Mater. 2010, 173, 552–557. [Google Scholar] [CrossRef]
- Al-Malah, K.; Azzam, M.O.J.; Abu-Lail, N.I. Olive mills effluent (OME) wastewater post-treatment using activated clay. Sep. Purif. Technol. 2000, 20, 225–234. [Google Scholar] [CrossRef]
- Al Bsoul, A.; Hailat, M.; Abdelhay, A.; Tawalbeh, M.; Jum’h, I.; Bani-Melhem, K. Treatment of olive mill effluent by adsorption on titanium oxide nanoparticles. Sci. Total. Environ. 2019, 668, 1327–1334. [Google Scholar] [CrossRef]
- Barbieri, L.; Andreola, F.; Lancellotti, I.; Taurino, R. Management of agricultural biomass wastes: Preliminary study on characterization and valorisation in clay matrix bricks. Waste Manag. 2013, 33, 2307–2315. [Google Scholar] [CrossRef]
- Yuan, G. Natural and modified nanomaterials as sorbents of environmental contaminants. J. Environ. Sci. Health Part A 2004, 39, 2661–2670. [Google Scholar] [CrossRef]
- Ochoa-Cornejo, F.; Bobet, A.; Johnston, C.; Santagata, M.; Sinfield, J.V. Dynamic properties of a sand–nanoclay composite. Géotechnique 2020, 70, 210–225. [Google Scholar] [CrossRef]
- Di Nezza, F.; Caruso, C.; Costagliola, C.; Ambrosone, L. Reaction-diffusion model as framework for understanding the role of riboflavin in “eye defence” formulations. RSC Adv. 2020, 70, 14965–14971. [Google Scholar] [CrossRef]
- Salvestrini, S. Analysis of the Langmuir rate equation in its differential and integrated form for adsorption processes and a comparison with the pseudo first and pseudo second order models. React. Kinet. Mech. Catal. 2018, 123, 455–472. [Google Scholar] [CrossRef]
- Crank, J. The Mathematics of Diffusion; Oxford University Press: Great Britain, 1979. [Google Scholar]
- Venditti, F.; Bufalo, G.; Lopez, F.; Ambrosone, L. Pollutants adsorption from aqueous solutions: The role of the mean lifetime. Chem. Eng. Sci. 2011, 23, 5922–5929. [Google Scholar] [CrossRef]
- Bufalo, G.; Costagliola, C.; Mosca, M.; Ambrosone, L. Thermal analysis of milling products and its implications in self-ignition. J. Therm. Anal. Calorim. 2014, 1115, 1989–1998. [Google Scholar] [CrossRef]
- Gomez-Martin, A.; Chacartegui, R.; Ramirez-Rico, J.; Martinez-Fernez, J. Performance improvement in olive stone’s combustion from a previous carbonization transformation. Fuel 2018, 228, 254–262. [Google Scholar] [CrossRef]
- Fenti, A.; Chianese, S.; Iovino, P.; Musmarra, D.; Salvestrini, S. Cr(VI) Sorption from Aqueous Solution: A Review. Appl. Sci. 2020, 10, 6477. [Google Scholar] [CrossRef]
- Di Nezza, F.; Guerra, G.; Lopez, F.; Ambrosone, L. Pollutants adsorption from aqueous solutions: The role of the mean lifetime. Dye. Pigment. 2016, 134, 342–347. [Google Scholar] [CrossRef]
- Torrent, M.; Duran, M.; Solà, M. Theorethical study on the ground and excited states of Chromyl Fluoride (CrO2F2). Sci. Gerund. 1997, 23, 5–16. [Google Scholar]
- Cinelli, G.; Guerra, G.; Bufalo, G.; Lopez, F.; Ambrosone, L. Cooperativity between Dimerization and Binding Equilibria in the Ternary System Laponite-Indocyanine Green-Water. ChemEngineering 2021, 5, 6. [Google Scholar] [CrossRef]
- Molino, B.; Bufalo, G.; De Vincenzo, A.; Ambrosone, L. Semiempirical Model for Assessing Dewatering Process by Flocculation of Dredged Sludge in an Artificial Reservoir. Appl. Sci. 2020, 10, 3051. [Google Scholar] [CrossRef]
- Iadicicco, N.; Paduano, L.; Vitagliano, V. Diffusion coefficients for the system potassium chromate—Water at 25 ∘C. J. Chem. Eng. Data 1996, 41, 529–533. [Google Scholar] [CrossRef]
Publisher’s Note: MDPI stays neutral with regard to jurisdictional claims in published maps and institutional affiliations. |
© 2021 by the authors. Licensee MDPI, Basel, Switzerland. This article is an open access article distributed under the terms and conditions of the Creative Commons Attribution (CC BY) license (https://creativecommons.org/licenses/by/4.0/).