Article

Load Bearing Capacity of Cohesive-Frictional Soils Reinforced with Full-Wraparound Geotextiles: Experimental and Numerical Investigation

1
School of Engineering and Technology, Center of Excellence in Sustainable Disaster Management, Walailak University, 222 Thaiburi, Thasala District, Nakhon Si Thammarat 80161, Thailand
2
School of Civil Engineering, Undergraduate Program in Civil and Infrastructure Engineering, Center of Excellence in Innovation for Sustainable Infrastructure Development, Suranaree University of Technology, Nakhon Ratchasima 30000, Thailand
3
The Royal Society of Thailand, Bangkok 10300, Thailand
4
Department of Civil and Construction Engineering, Swinburne University of Technology, Melbourne, VIC 3122, Australia
*
Authors to whom correspondence should be addressed.
Appl. Sci. 2021, 11(7), 2973; https://doi.org/10.3390/app11072973
Submission received: 17 February 2021 / Revised: 23 March 2021 / Accepted: 23 March 2021 / Published: 26 March 2021
(This article belongs to the Special Issue Trends and Prospects in Geotechnics)

Abstract

:
This research investigated the effects of types of cohesive-frictional soil and geotextile reinforcement configurations on the bearing capacity of reinforced soil foundation (RSF) structures, via laboratory test and numerical simulation. The four reinforcement configurations studied for the RSF included: (i) horizontal planar form of geotextile, (ii) full-wraparound ends of geotextile, (iii) full-wraparound ends of geotextile with filled-in sand, and (iv) full-wraparound ends of geotextile with filled-in sand and sand backfill. The foundation soils studied were mixtures of fine sand and sodium bentonite at replacement ratios of 0, 20, 40, 60, 80, and 100% by dry weight of sand to have various values of plasticity index (PI). The numerical analysis of RSF structures was performed using PLAXIS 2D software. Several factors were studied, which included: embedment depth of the top reinforcement layer (U), width of horizontal planar form of the reinforcement (W), and spacing between geotextile reinforcement layers (H). Number of reinforcement layers (N) was varied to determine the optimum parameters of U/B, W/B, H/B, and N, where B is the footing width. The most effective improvement technique was found for the full wraparound ends of geotextile with filled-in sand and sand backfill. The outcome of this research will provide a preliminary guideline in a design of RSF structure with different ground soils and other RSF structures with different geosynthetic types.

1. Introduction

The Reinforced Soil Foundation (RSF) structure system using geosynthetic reinforcement has grown significantly over the past four decades. Geosynthetics, such as geotextiles, geogrids, and geocells, are widely used in ground improvement and transportation geotechnics projects, to improve the load bearing capacity and decrease the settlement of weak soil foundation [1,2,3,4,5,6,7,8,9]. In addition, the embedded geosynthetic reinforcement can inhibit the development of stress bulbs, which induces the progressive failure of soil underneath the footing [10,11,12].
Recently, a wraparound ends of geotextile technique was introduced to increase the load-bearing capacity of soils [6,7,13,14]. The bearing capacity of the wraparound ends of geotextile reinforced sand increased by approximately twice, as compared with the unreinforced sand [6]. Moreover, this wraparound technique is more suitable for constructing in a confined area, unlike the conventional techniques that incorporate the horizontal planar form of geotextile reinforcements.
Previous research on the bearing capacity of RSF structures [6,13,14,15] was mainly conducted via experimental tests and numerical simulations using either cohesionless (sand) or cohesive (clay) soils, which were reinforced with the horizontal planar form and wraparound of geotextile reinforcement. Numerical simulations were undertaken to compute the deformation, pore pressure, stress, and strain at various locations underneath the RSF structures [15,16,17,18].
Natural soils are commonly cohesive-frictional by nature and they are composed of coarse and fine particles [19]. The shear strength parameters of soil are essential for predicting the load bearing capacity of RSF structures. Several researchers established correlations between plasticity index (PI) and the strength parameters for predicting the behavior of cohesive-frictional soil [20,21,22,23,24]. However, the investigation of RSF using the full-wraparound technique and cohesive-frictional soil is limited. Therefore, the physical model tests and numerical simulation on RSF structures were carried out in this research. Four reinforcement layout configurations studied were (i) horizontal planar form of geotextile, (ii) full-wraparound ends of geotextile with filled-in foundation soils, (iii) full-wraparound ends of geotextile with filled-in sand, and (iv) full-wraparound ends of geotextile with filled-in sand and sand backfill. To obtain various PIs, the foundation soils studied were mixtures of sand and sodium bentonite at different ratios of 0, 20, 40, 60, 80 and 100% bentonite.
Large-scale load-bearing tests were performed to simulate the RSF structures with varying the embedment depth of top reinforcement layer (U), width of horizontal planar reinforcement (W), the spacing between geotextile reinforcement layers (H), and the number of reinforcement layers (N) to determine the optimum parameters of U/B, W/B, H/B and N, where B is the width of footing. The physical model test results of load-bearing capacities of RSF were compared with the numerical simulation results to calibrate the numerical model. The PLAXIS 2D program, which has been proved to be a robust and accurate tool [25,26,27,28], was used to investigate the performance of RSF.
A relationship between PI and ultimate bearing capacity of unreinforced cohesive-frictional soils was proposed. The numerical simulations were then carried out to evaluate the bearing capacity improvement of various types of soil reinforced with different configurations of reinforcement by varying the N layers. The simulation technique performed in this research can explain the stress distribution and soil movement underneath the model rigid footing, and it can be applied to the real practice. Based on the analysis of the numerical result, the appropriate reinforcement configurations were recommended for the foundation soils at different PIs. The outcome of this study will provide a preliminary guideline in predicting the bearing capacity improvement of cohesive-frictional soils that are reinforced with geotextile.

2. Theoretical Background

The ultimate bearing capacity of a foundation is defined as the maximum magnitude of the applied load for which failure plane extends to a considerable volume of soils. Prandtl [29] first proposed the bearing capacity equation, by assuming that the soil is weightless. Terzaghi [30] proposed the ultimate bearing capacity equation of shallow foundations on soils by extending the equation proposed by Prandtl [29].
For strip footing, the ultimate bearing capacity ( σ b ( u l t ) ) of cohesive-frictional soils is calculated, as follows [30]:
σ b ( u l t ) = c N c + γ D f N q + 0.5 γ B N γ
where c is cohesion of soil, γ is unit weight of soil, B is width of footing, Df is depth of foundation, N c , N q and N γ are the bearing capacity factors, which are functions of the internal friction angle, ϕ . The bearing capacity factors proposed by Meyerhof [31] are expressed by the following equations:
N q = e π tan ϕ tan 2 ( 45 + ϕ 2 )
N c = ( N q 1 ) cot ϕ
N γ = ( N q 1 ) tan ( 1.4 ϕ )
Common techniques for improving soil-bearing capacity are the soil replacement by high quality material [32,33,34,35,36] and geosynthetic reinforcement. For the soil replacement technique, Chen and Abu-Farsakh [11] suggested the thickness of sand soil over clayey soil of more than four times the footing dimension.
The RSF technique has considerable potential as an alternative cost-effective method. Several investigators [1,5,8,14,37,38,39] have experimentally and numerically studied the behaviors of the footing on the geosynthetic reinforced cohesionless and cohesive soils. All previous investigators indicated that the RSF technique can increase the ultimate bearing capacity and decrease the settlement of footing. Previous studies revealed that the width of the footing (B), embedment depth of top reinforcement layer (U), width of horizontal planar form of reinforcement (W), vertical spacing between reinforcement layers (H), and number of reinforcement layers (N) were dominant factors controlling the soil-bearing capacity. The optimum values of U/B, W/B and H/B have been recommended: U/B = 0.25–0.5, W/B = 6, H/B = 0.2–0.4, and N = 4 [39,40].

3. Experimental and Numerical Procedures
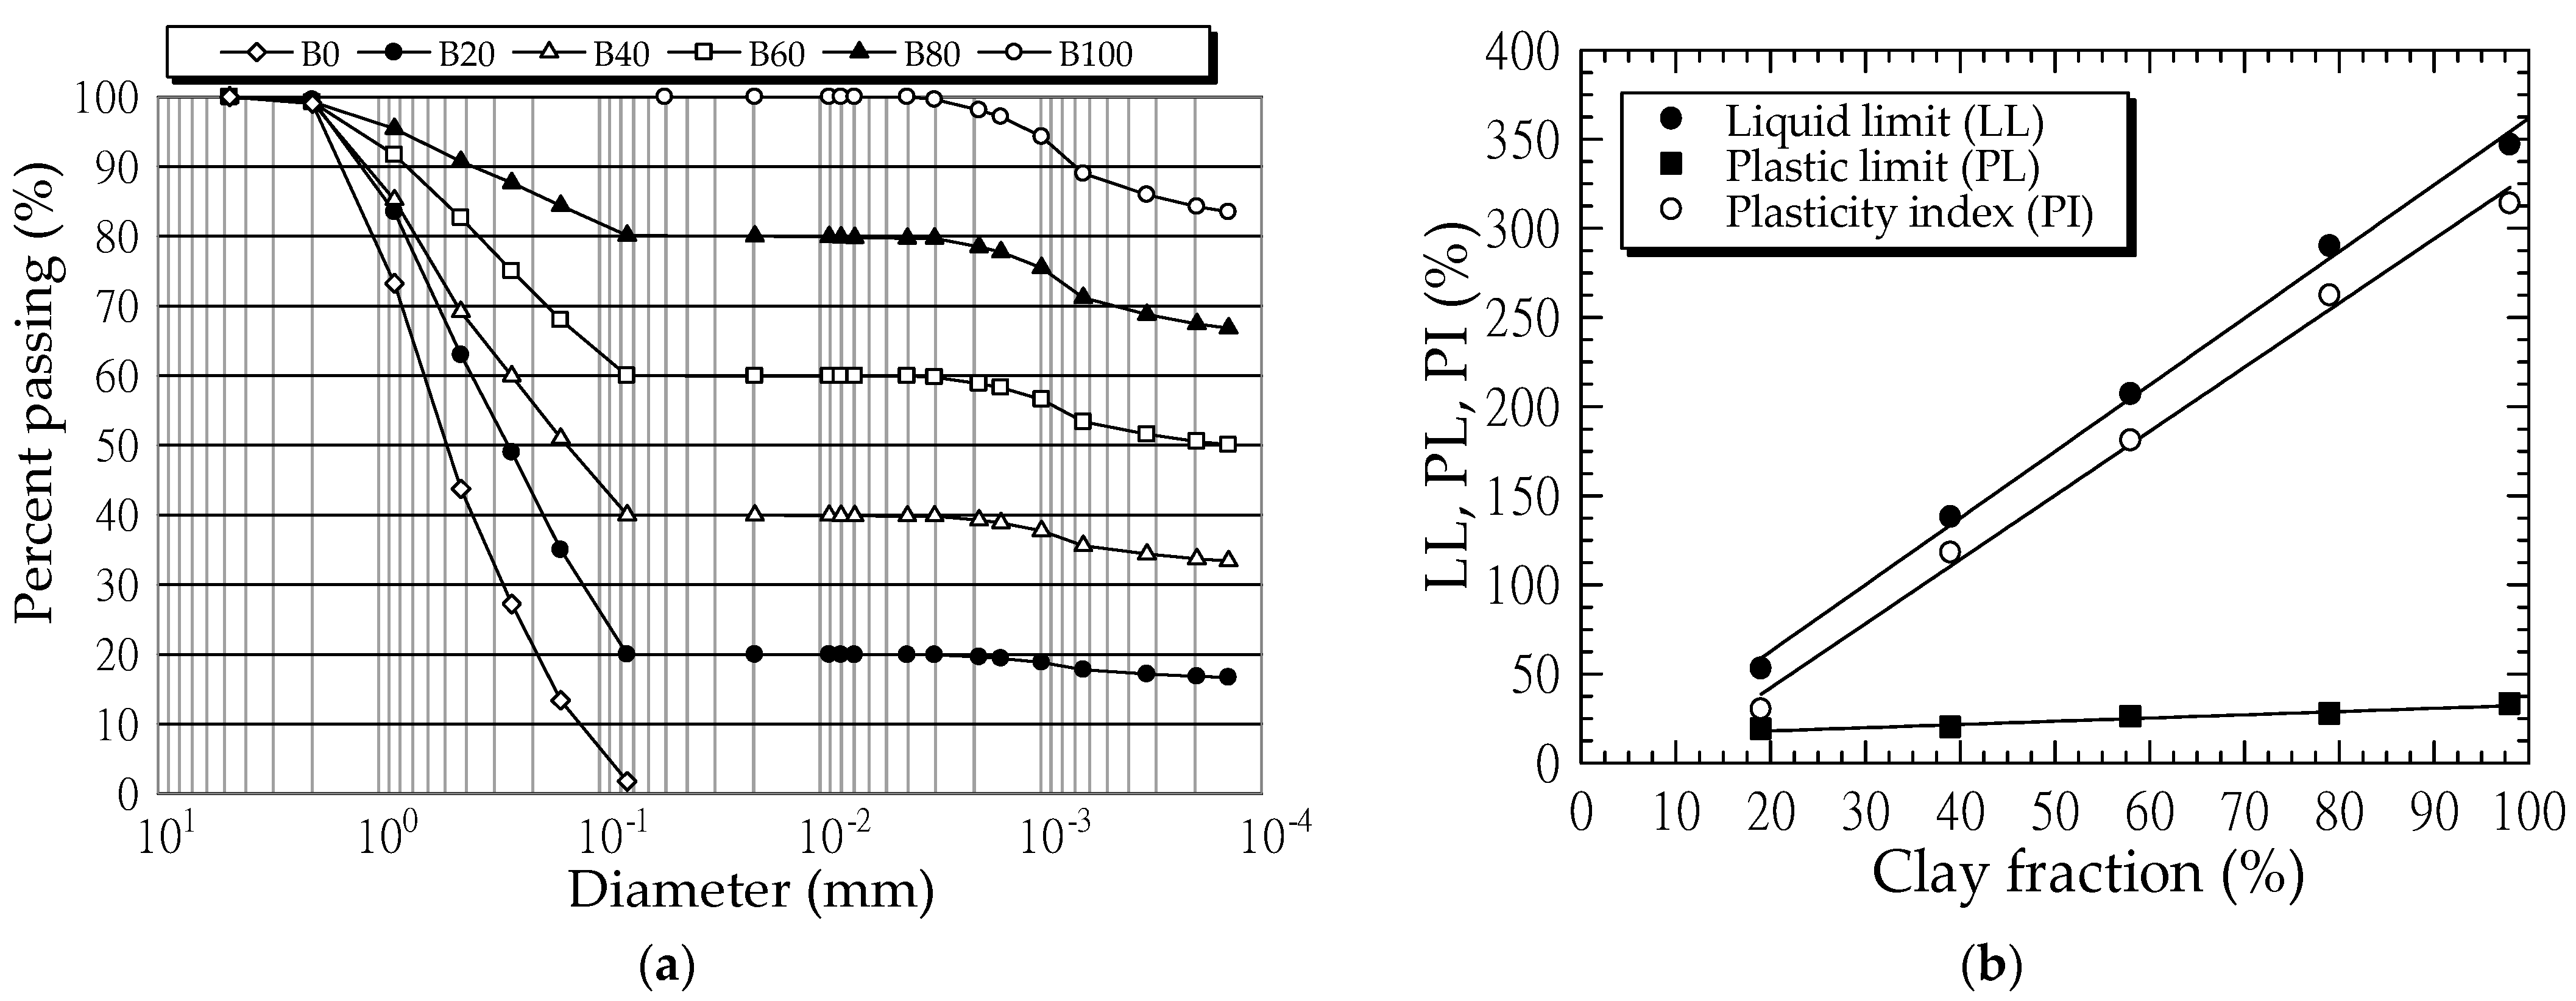
3.1. Soil Samples

In order to obtain various PIs, a fine sand was mixed with bentonite (montmorillonite) at various ratios of 0, 20, 40, 60, 80 and 100% bentonite, and labeled as B0, B20, B40, B60, B80 and B100, respectively. The bentonite powder was a commercial product, which is mainly used as drilling mud for geotechnical construction. The commercial bentonite powder was purchased from Geomechanical Service Co., Ltd., Bangkok, Thailand. The grain size distribution of bentonite powder was investigated by laser diffraction grain size analyzer. The bentonite consisted of 98% clay and 2% silt. The liquid limit (LL) and plastic limit (PL) of bentonite obtained from the Casagrande’s and rolling thread methods, according to ASTM-D4318, were 347% and 33%, respectively.
The fine sand was air-dried and passed through a 2.00 mm sieve (No.10). The tested sand (B0) consisted of 98% sand and 2% silt, as shown in Figure 1a. Its average grain size, D50 was 0.5 mm. The bentonite and sand had specific gravity values of 2.35 and 2.80, respectively, and they were classified as a high plasticity clay (CH) and poorly graded sand (SP), respectively, according to the Unified Soil Classification System (USCS).
Figure 1a also shows the grain size distribution curves of the sand-bentonite mixtures. Figure 1b shows the relationships between clay fraction content (<0.002 mm) and LL, PL and PI. The LL significantly increased from 49 to 347% with the increased clay fraction content from 19 to 98% due to the increase in water holding capacity of bentonite. The linear increase of PL, LL and PI with the increased bentonite content (clay fraction) is in agreement with the previous researches [41,42]. The slope of the relationship between PI and clay content, defined as activity [43], was equal to 3.61 and, therefore, classified as active soil. Table 1 summarizes the optimum water content and maximum dry unit weight of these mixtures under the standard Proctor energy (ASTM-D698 [44]).
The dried sand-bentonite mixtures were mixed with water by spraying water droplets to attain their optimum water content (obtained from laboratory compaction tests). The soil preparation and direct shear test details can be referenced to Sukmak et al. [19]. The values of cohesion and internal friction angle were obtained from a 65 mm in diameter of a direct shear device at a constant shearing rate of 0.5 mm/min.
Figure 2 shows the internal friction angle and cohesion versus clay fraction relationship. The cohesion linearly increased, while the internal friction angle decreased in a polynomial manner as the clay fraction increased. For clay fraction < 60% (B0, B20, B40 and B60), the internal friction angle significantly decreased with increasing the clay content. Previous researchers [45,46,47] reported that the ϕ value decreased, as the clay fraction content increased, due to increased lubrication from the clay paste filling the void spaces between sand. The rate of reduction in value was relatively low when clay fraction > 60% (B80 and B100). The highest cohesion of 33 kPa and lowest friction angle of 0 were found at B100. Table 1 summarizes the physical and engineering properties of tested soils.

3.2. Geotextile Reinforcement

A woven geotextile that was manufactured from the high strength polyester (PET) was used as the reinforcement in this study. The material properties of geotextile were: mass per unit area = 445 g/m2, nominal thickness = 0.9 mm, tensile strength = 200 kN/m, and 50 kN/m in machine and cross-machine directions, respectively, and the tensile strain at failure in machine direction = 10%.

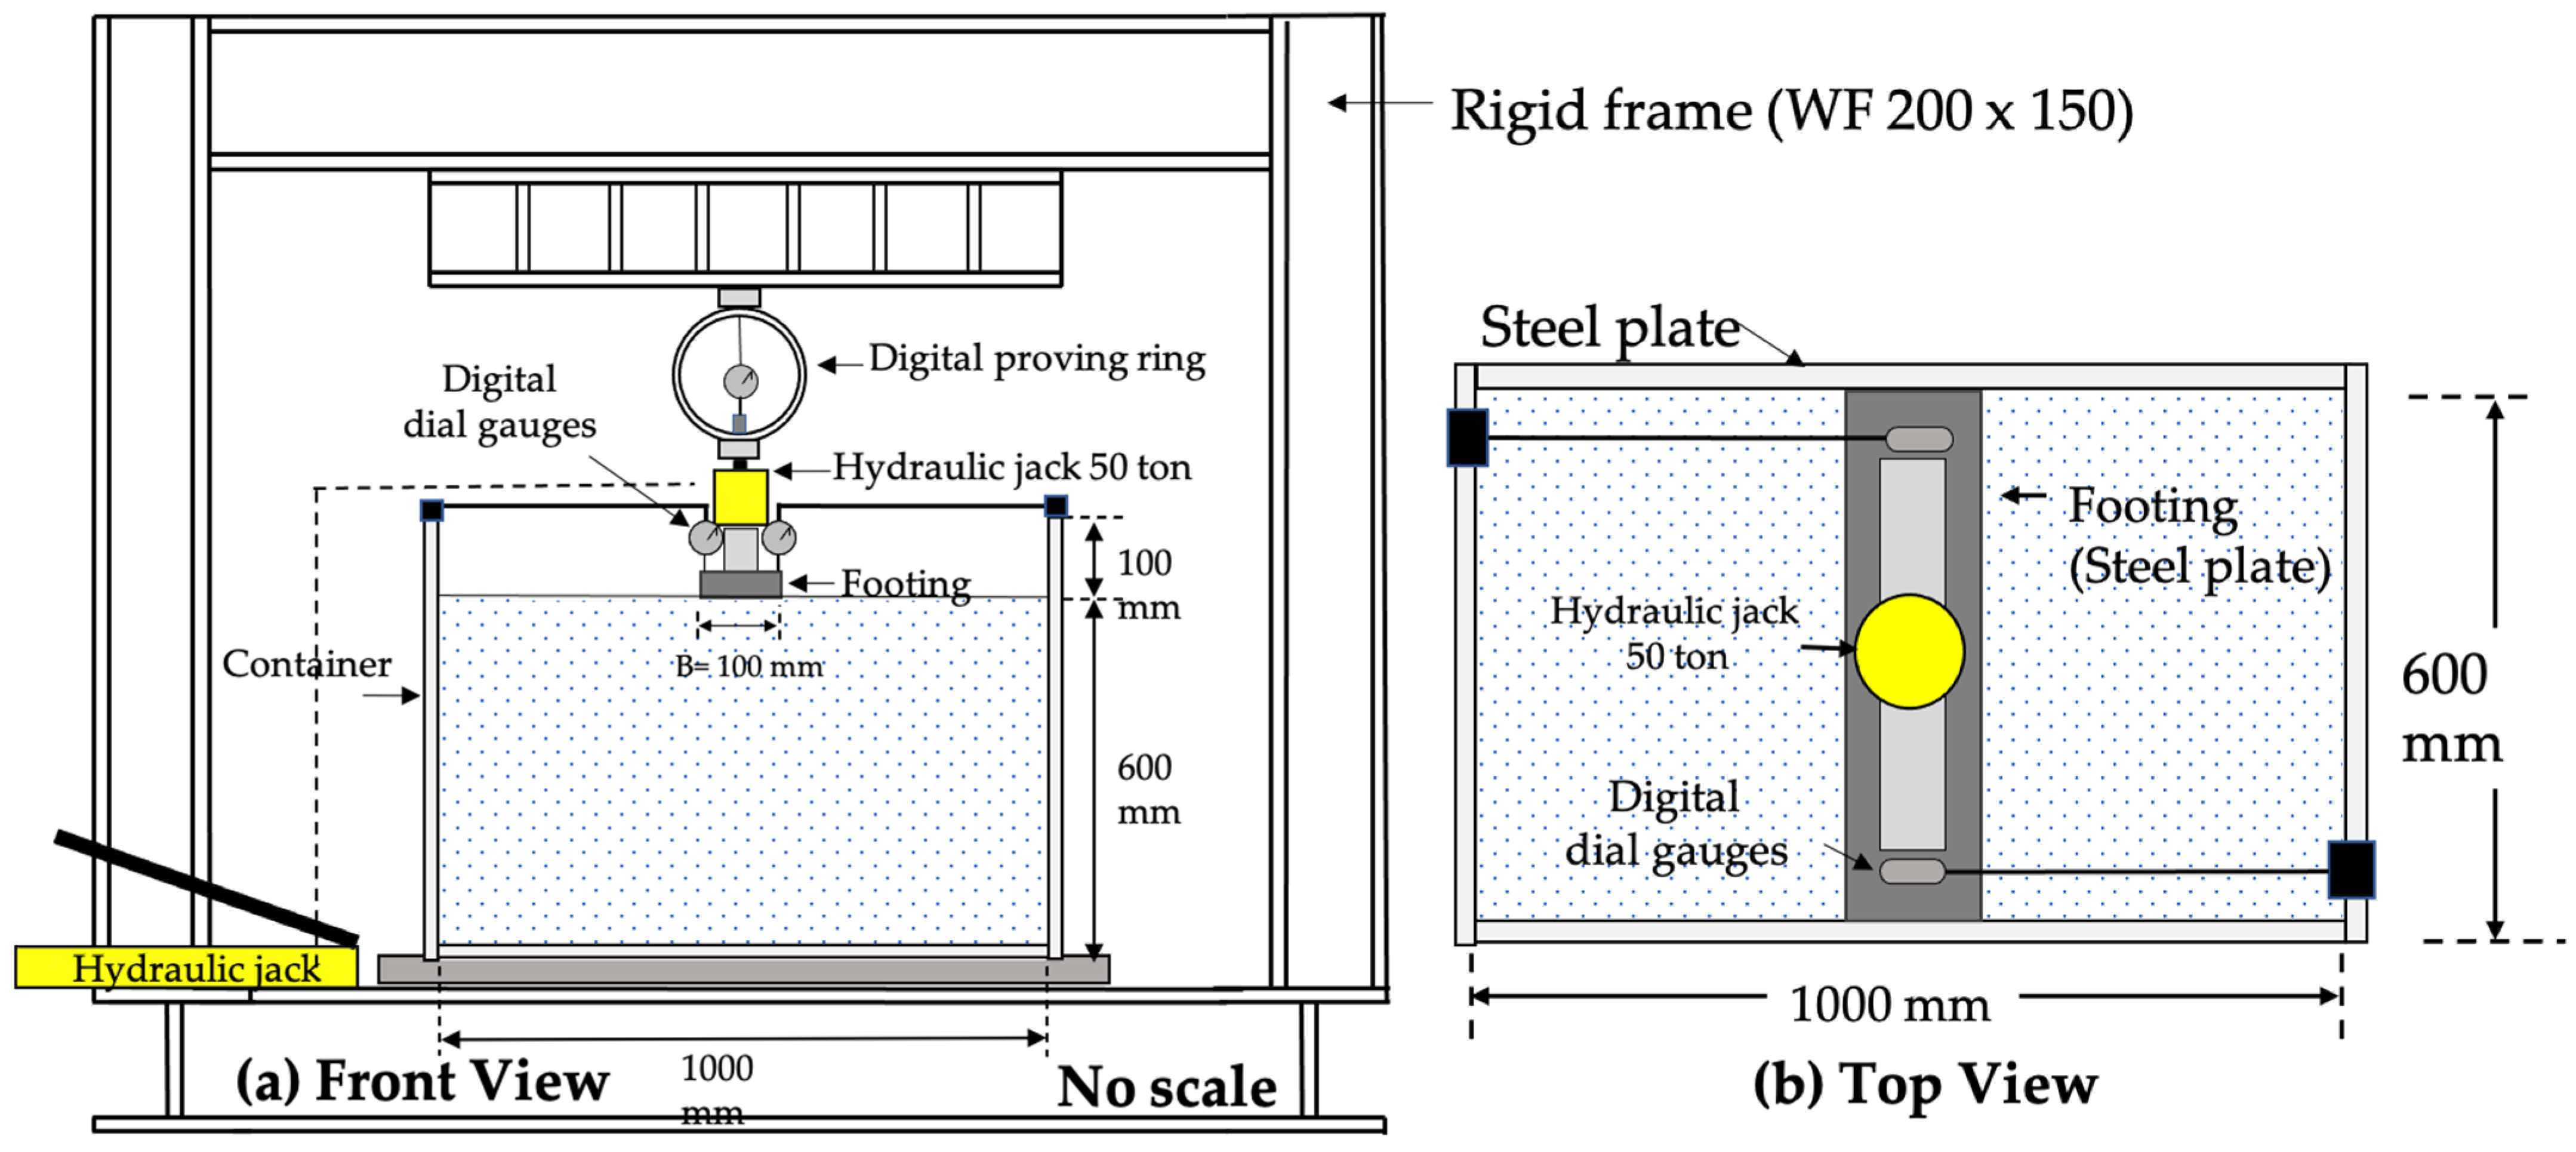
3.3. Load-Bearing Test Apparatus

Figure 3 illustrates the load-bearing model test apparatus. The rigid reaction frame was fabricated from a 200 mm × 150 mm wide steel flange beam. The 10-mm thick steel container had internal dimensions of 1000 mm length, 600 mm width, and 700 mm depth. The side of the container was strongly braced to prevent its lateral deformation from the soil compaction and load-bearing testing. The friction between the tested soils and the model container was minimized while using a smooth plate.
The model rigid footing was a strip footing made of 30 mm thick rigid plate with dimensions of 596 mm length and 100 mm width. The width of footing, B = 100 mm was fixed for all the tests. The base of footing was attached to the rough sandpaper by glue. The horizontal and vertical boundaries of model container were 10 times and six times of the footing width, respectively, in order to minimize boundary effects. The model tests were conducted under the plane-strain condition.

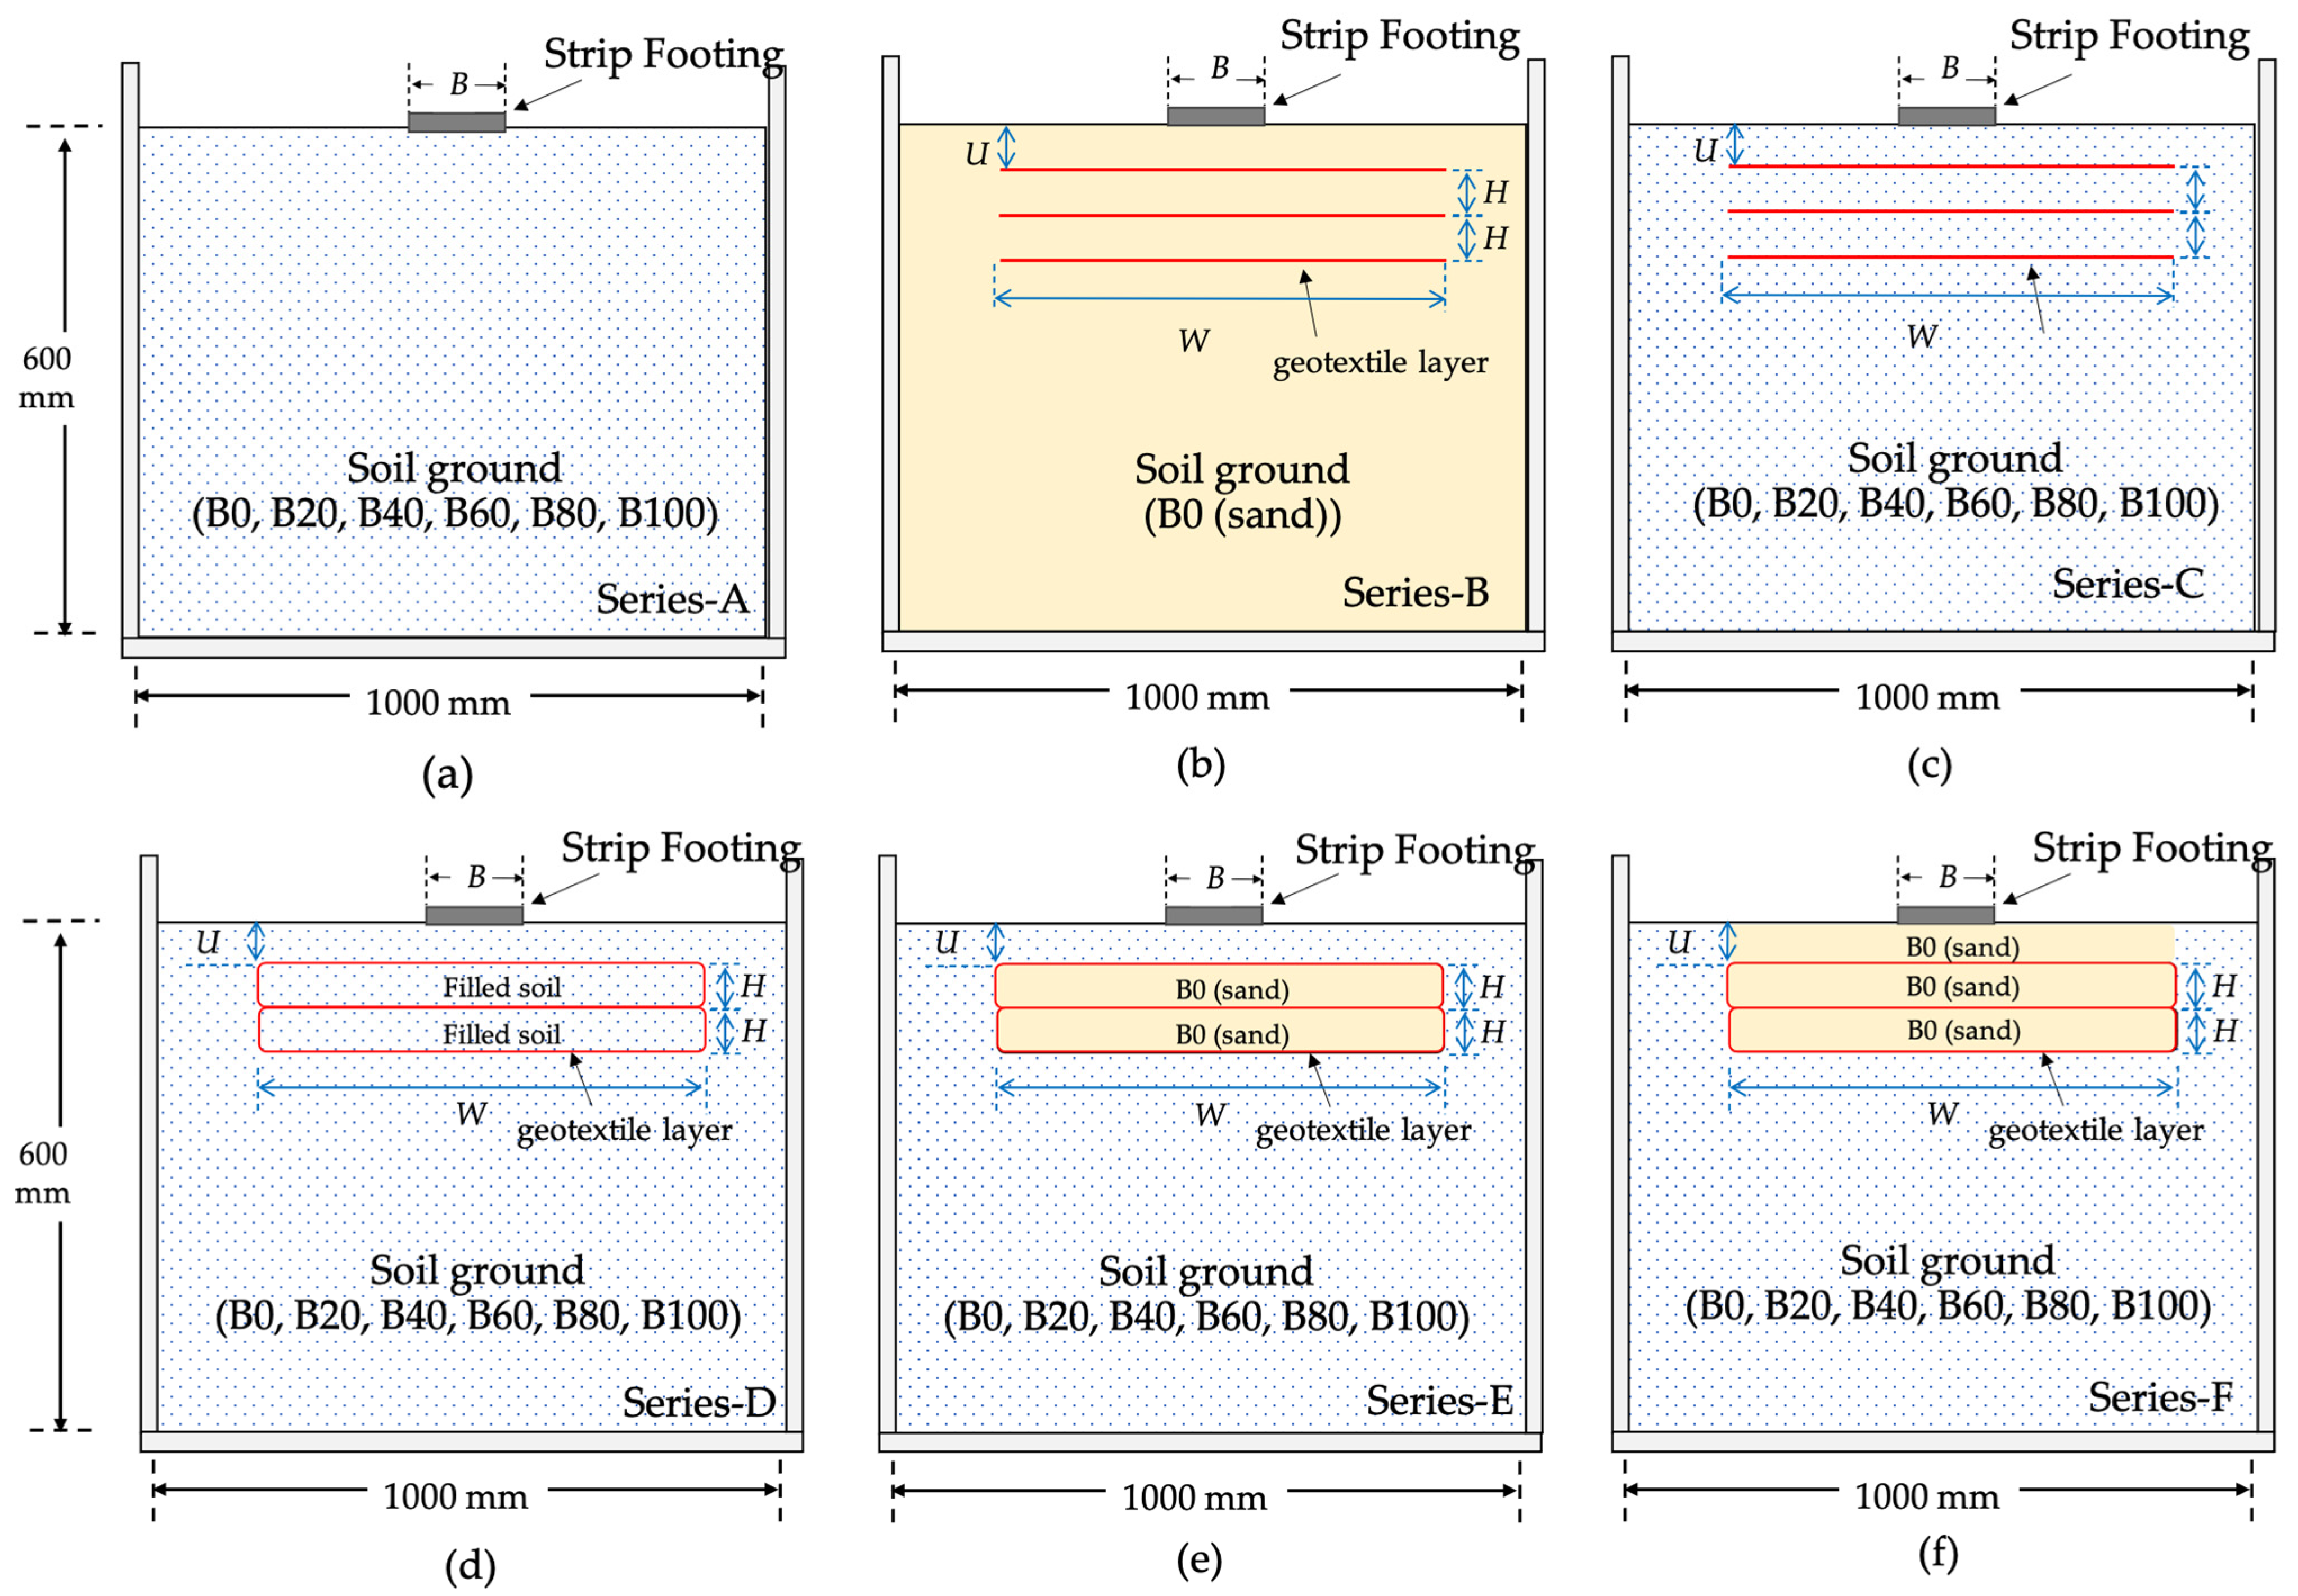
3.4. Experimental and Numerical Programs

This study was undertaken to investigate the relationship between bearing capacity of unreinforced soil and PI and obtain the most effective values of influence parameters for the studied RSF: the embedment depth of top reinforcement layer (U), width of horizontal planar reinforcement (W), the vertical spacing between reinforcement layers (H), and number of reinforcement layers (N).
To evaluate the development in bearing capacity of RSF with different geotextile reinforcement layout configurations, the number of reinforcement layers (N) were varied from 1 to 4. The bearing capacity development was analyzed in terms of a bearing improvement factor, a ratio of the bearing capacity of reinforced soils to the bearing capacity of unreinforced soil (qb/qb0). The numerical simulations were carried out to evaluate the performance of studied RSF. The simulated result was the stress distribution and soil movement underneath the rigid footing.
The numerical analysis was performed on the RSF with various reinforcement layout configurations, as shown in Figure 4, including Series A to F. The simulated results were then compared with the laboratory model test results. Figure 4a indicates the experimental model test of the strip footing on different unreinforced soil mixtures (Series A) to evaluate the effect of PI on its bearing capacities. The techniques of reinforcement were the horizontal planar reinforced soils (Figure 4b), the full-wraparound ends of geotextile with filled-in foundation soils (Figure 4d), the full wrapround ends of geotextile with filled-in sand (Figure 4e), and the full wraparound ends of geotextile with filled-in sand and sand backfill (Figure 4f). Table 2 provides the details of experimental and numerical programs.
Series B was conducted to determine the optimal U/B, W/B and H/B of the strip footing on sand (B0) reinforced with different number of horizontal layers of geotextile (N) (see Figure 4b). For a single horizontal reinforcement layer (N = 1), the U/B ratios were varied from 0.1 to 2.0 with a constant W/B ratio of 6.0. Subsequently, the optimum W/B ratio was obtained by varying W/B ratios from 2 to 6 with a constant optimal ratio of U/B. For N = 2, the optimum spacing value between reinforcement layers was obtained by varying H/B ratios from 0.1 to 0.7 at both optimum ratios of U/B and W/B. The optimum values of U/B, W/B and H/B ratios were selected for modeling Series C, D, E and F.
In the numerical analysis of Series C to F, the interaction factors (Rinter) between soil and geotextile reinforcement were required and they were determined from the back-analysis of test results of Series C. The Rinter value was varied until the simulated curves were in good agreement with the experimental curves. The Rinter relates the interface strength (friction resistance on the surface between geotextile and soil) to the soil strength (frictional angle and cohesion). The Rinter value is intermediate between smooth (Rinter = 0) and fully rough (Rinter = 1.0). Kazi et al. [6,7] and Shadi et al. [48,49] reported that the Rinter value of 0.66 can be used to simulate the interaction behavior of sandy soil that was reinforced with geotextile with different reinforcement configurations (with and without partial and full-wraparound geotextile).
The numerical results of Series C, D, E and F would illustrate the improvement of bearing capacity of RSF with different reinforcement configurations.

3.5. Construction and Test Methods

For series A, the soil was compacted in 50 mm height layers with a vibratory compactor until the maximum dry unit weight was attained. The total compacted soil thickness was 600 mm. The density tests were conducted after the end of construction to control the compaction quality and repeatability of the experiments. The results revealed that all test sections were reproducible.
After the soil foundation was compacted for the full depth, the compacted soil was excavated and the reinforced soil foundation (RSF) with various configurations (Series B to C) was constructed, as shown in Figure 4. The geotextile layers in the machine direction were placed parallel to the width of the footing at the desired magnitude of U, W, H and N according with the reinforcement layout configuration that is given in Table 2.
The footing was then placed on the RSF. The vertical loading was applied on the footing by a 50 kN capacity hydraulic jack that was supported by a digital proving ring and a rigid reaction frame. The bearing force was measured using a digital proving ring, which was installed between the rigid reaction frame and hydraulic jack (see Figure 3). The bearing force was applied at a constant rate of 0.5 mm/min. The vertical movement of the footing was monitored with two digital dial-gauges installed at the edge of each side of footing. The bearing force and vertical movement were recorded until the end of test at 15 mm settlement.

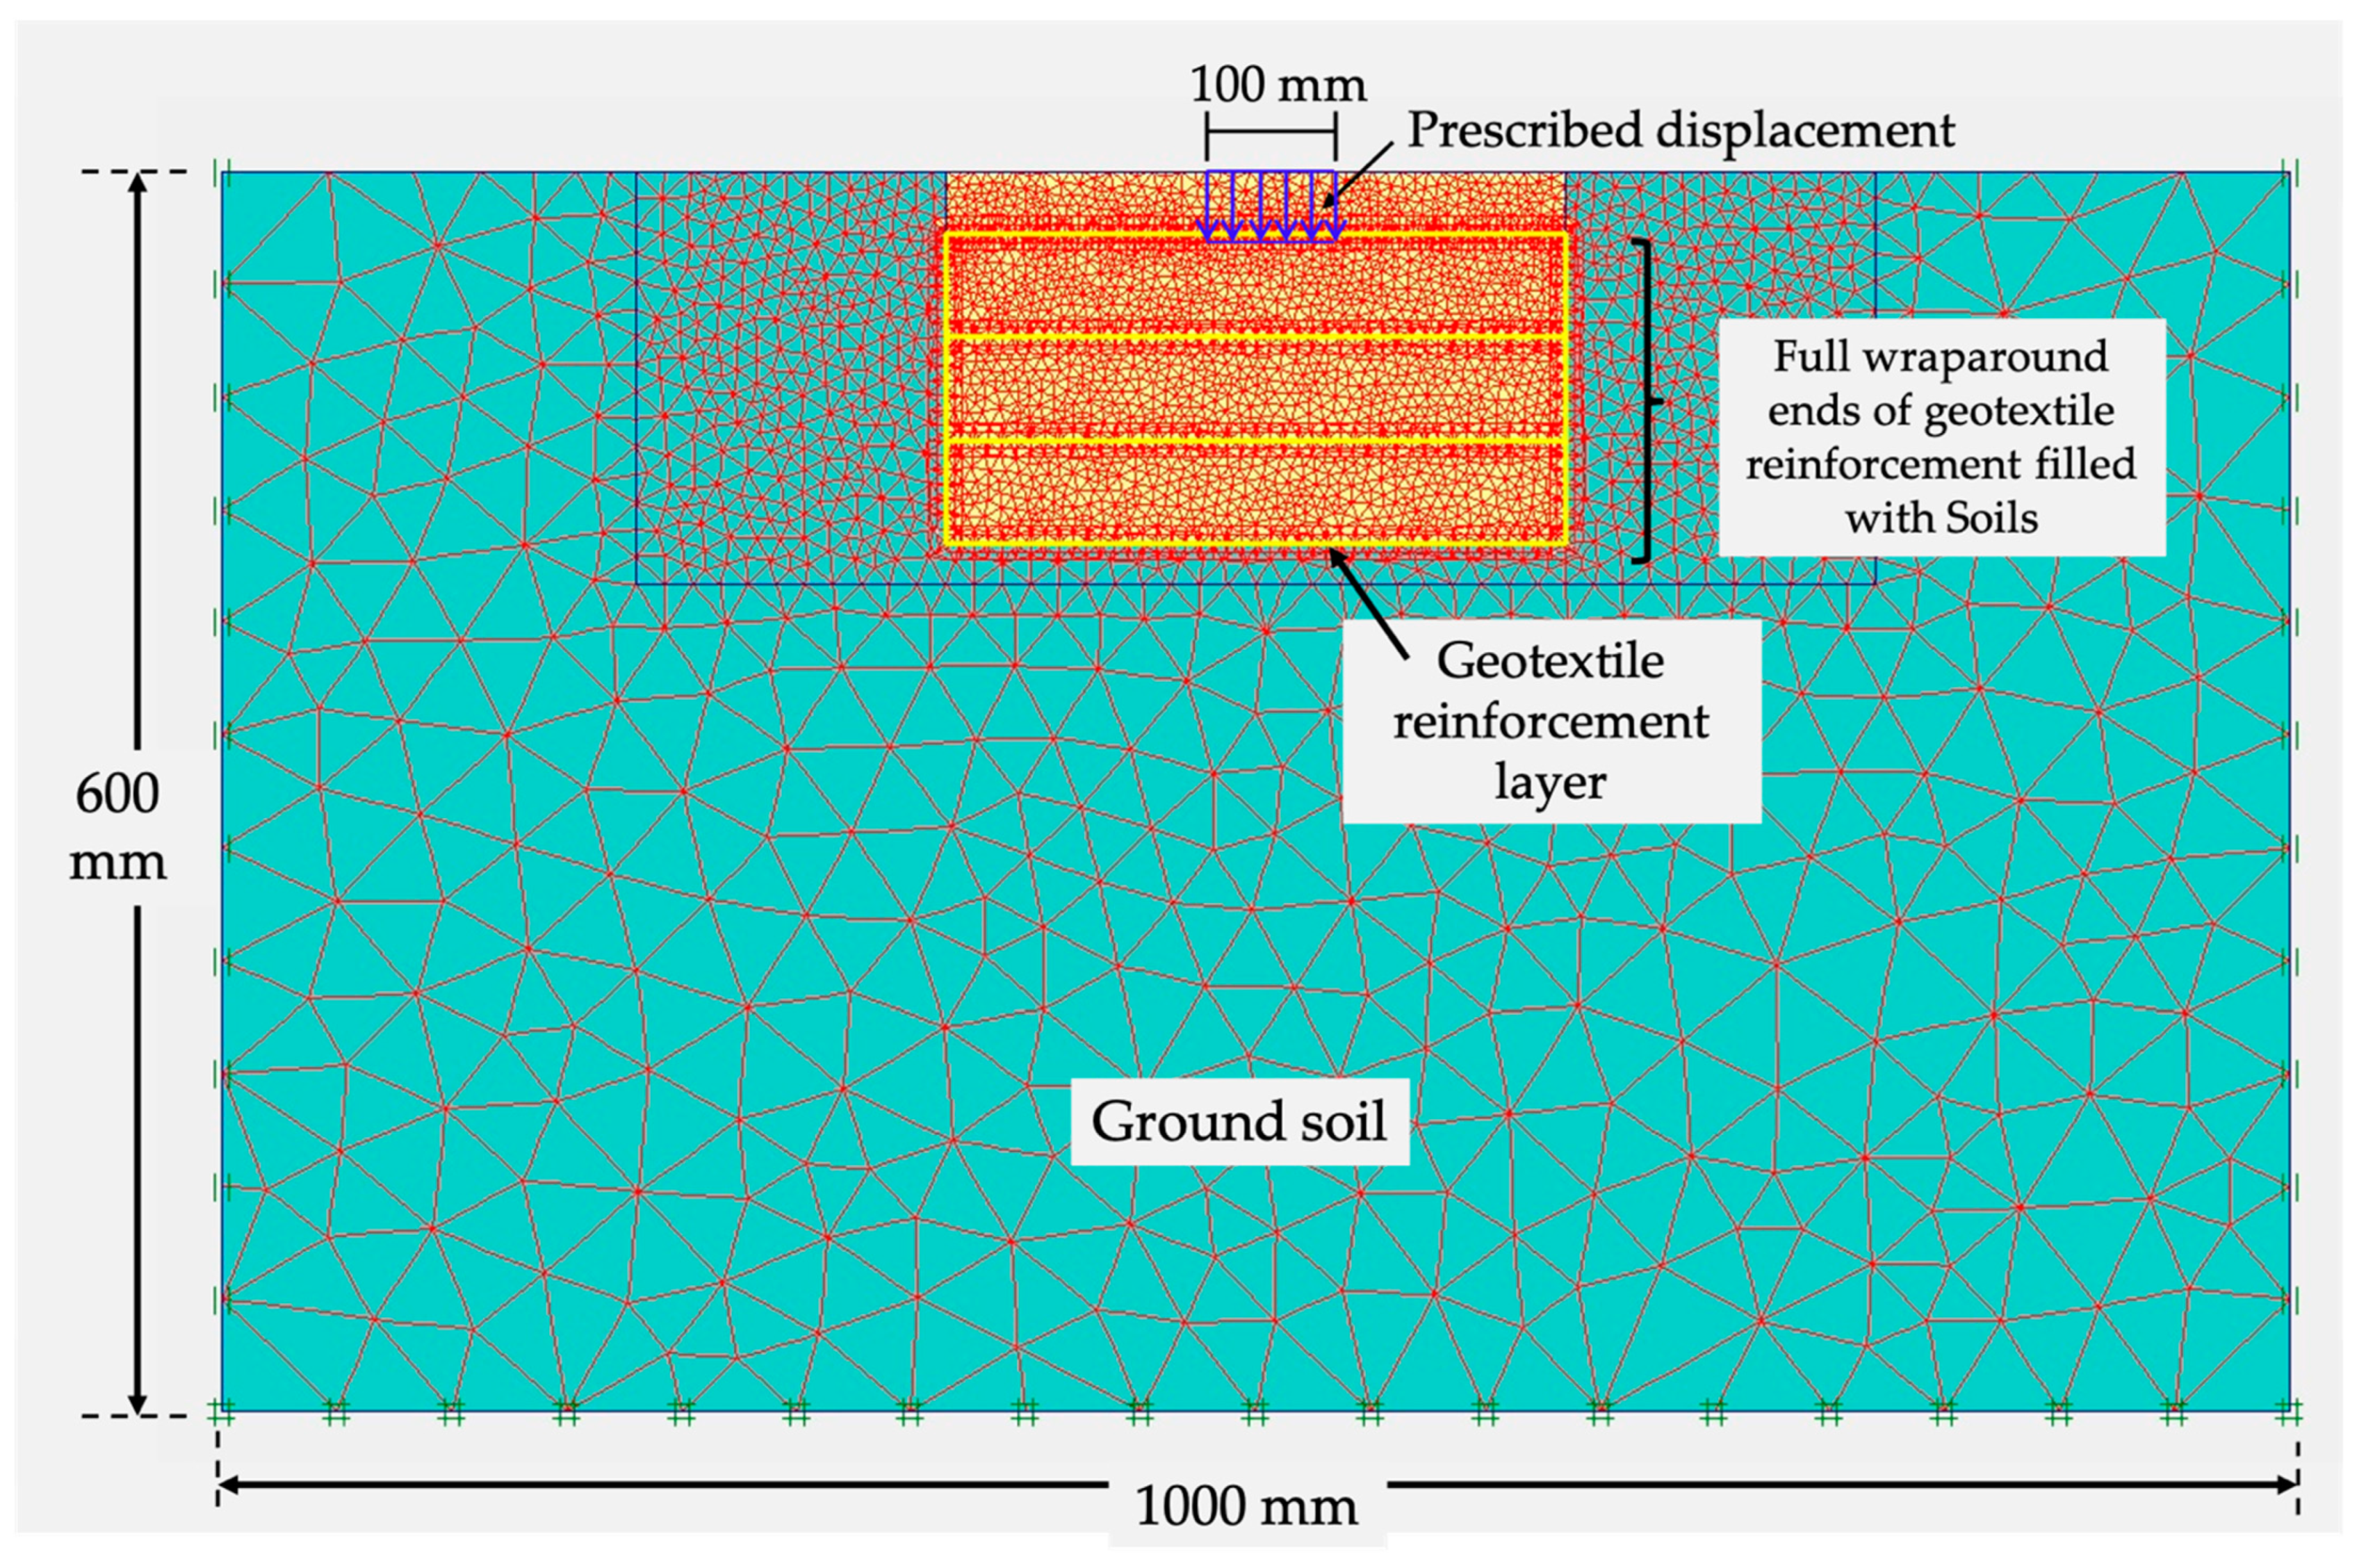
3.6. Numerical Modeling

The numerical simulation was conducted using a finite element program, PLAXIS 2D (Figure 5). The bottom boundary of the model was fixed against movement in all directions, while the vertical boundaries were free to move in the vertical direction but restricted in the horizontal direction. The soil elements were modeled using 15-noded triangular elements. Very fine meshes were used around the geometry line of footing and reinforcements to minimize the mesh size effect. The linear-elastic perfectly plastic Mohr-Coulomb (MC) model was utilized for soil and interface elements. Five basic parameters for MC-model, Young’s modulus (E), Poisson’s ratio (υ), cohesion (c), internal friction angle (ϕ), and dilation angle (ψ), were obtained from conventional laboratory tests. The coefficient of earth pressure at rest, K0 was calculated from (1−sinϕ). Table 3 summarizes the numerical soil parameters.
The geotextile material was modeled using a geogrid element (line elements), which is generally used to model geosynthetics reinforcement in the PLAXIS program. The geotextile was assumed as slender structures with a nonzero value of normal stiffness and zero bending stiffness, since it can only sustain tensile force, but not compression forces [50]. The elastic axial stiffness (EA) of geotextile material was equal to 200 kN/m obtained from the tensile strength test according to ASTM-D4595 [51]. The layout configuration of the geotextile reinforcement (Figure 4 and Table 2) and the material properties (Table 3) were simulated.
The interaction parameter (Rinter) was simulated with the interface elements that were located between the geotextile reinforcement and surrounding soils. The Rinter values for different configurations of geotextile reinforcement were summarized in Table 3.
The load was applied on the footing using the prescribed displacement method. The calculation was terminated when the final settlement reached 15 mm. The pressure (stress point; Sig-yy) and vertical settlement (displacement node; Uy) values under the center of strip footing were compared with the measured results. The bearing capacity ratio (qb/qb0) at the S/B ratio of 15% was used to illustrate the bearing capacity improvement due to the geotextile reinforcement, where qb = bearing capacity of RSF and qb0 = the bearing capacity of unreinforced soil. Table 2 summarizes the conditions of experimental model tests and numerical simulations.

4. Test Results and Discussion

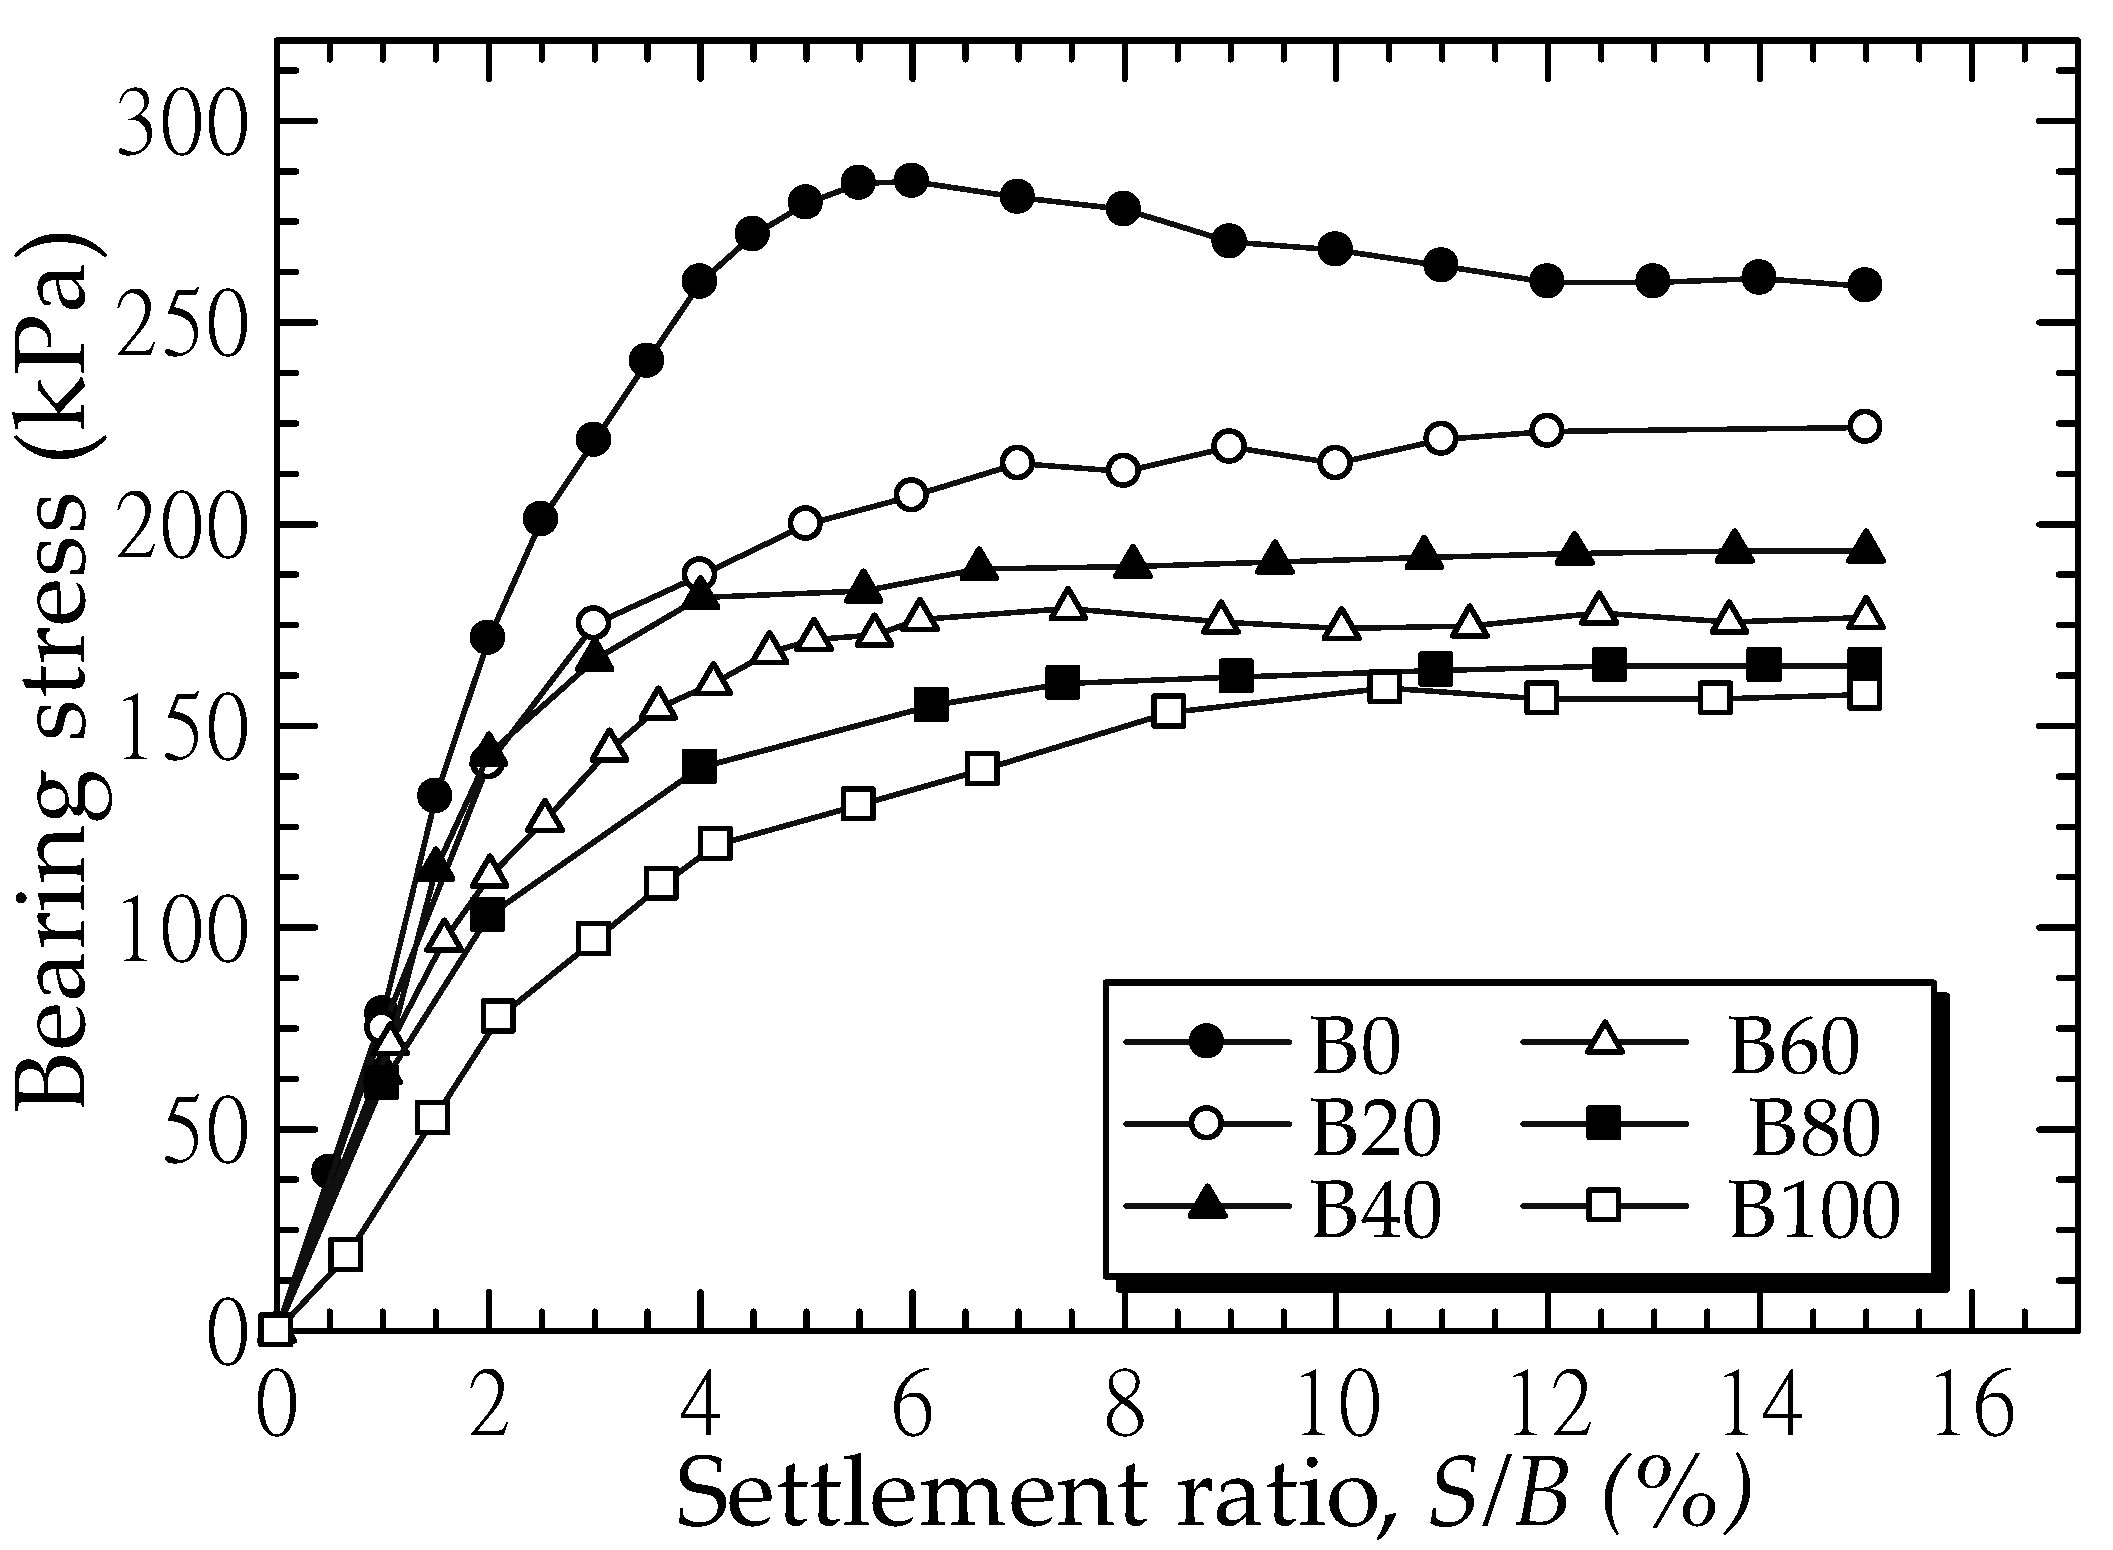
4.1. Load-Bearing Capacity of Unreinforced Soils (Series A)

Figure 6 shows the relationship between bearing stress (q) and settlement ratio of unreinforced soils with different PI: dense sand (B0) and stiff cohesive-frictional soils (B20, B40, B60, B80 and B100). The shear stress continued to increase as the soil deformed. For B0, q sharply increased with increasing the S/B ratio until the q was obtained at S/B ratio approximately equal to 5%, and then gradually decreased. For B20, B40, B60, B80 and B100, the q gradually increased with increasing the S/B ratio. After S/B > 10%, the q was almost constant without peak. The qb0 decreased as the bentonite content increased i.e., qb0 of B100 was the lowest, while qb0 of B0 was the highest. In other words, the qb0 decreased with the increase of PI. The soil surface on both sides of the foundation noticeably heaved, indicating the general shear failure, which is the common failure mode for a shallow foundation on the dense sand and stiff cohesive soils [4].
Figure 7 shows the relationship between qb0 and PI at S/B = 15%. The measured qb0 was compared with the calculated bearing capacity using Equations (1)–(5). The qb0 with various PI was satisfactorily predicted by Meyerhof (1963)’s equation. The qb0 decreased in a polynomial function as the PI increased:
qb0 = 0.0011 (PI)2 − 0.658 (PI) + 255.28 for 0% < PI < 314%

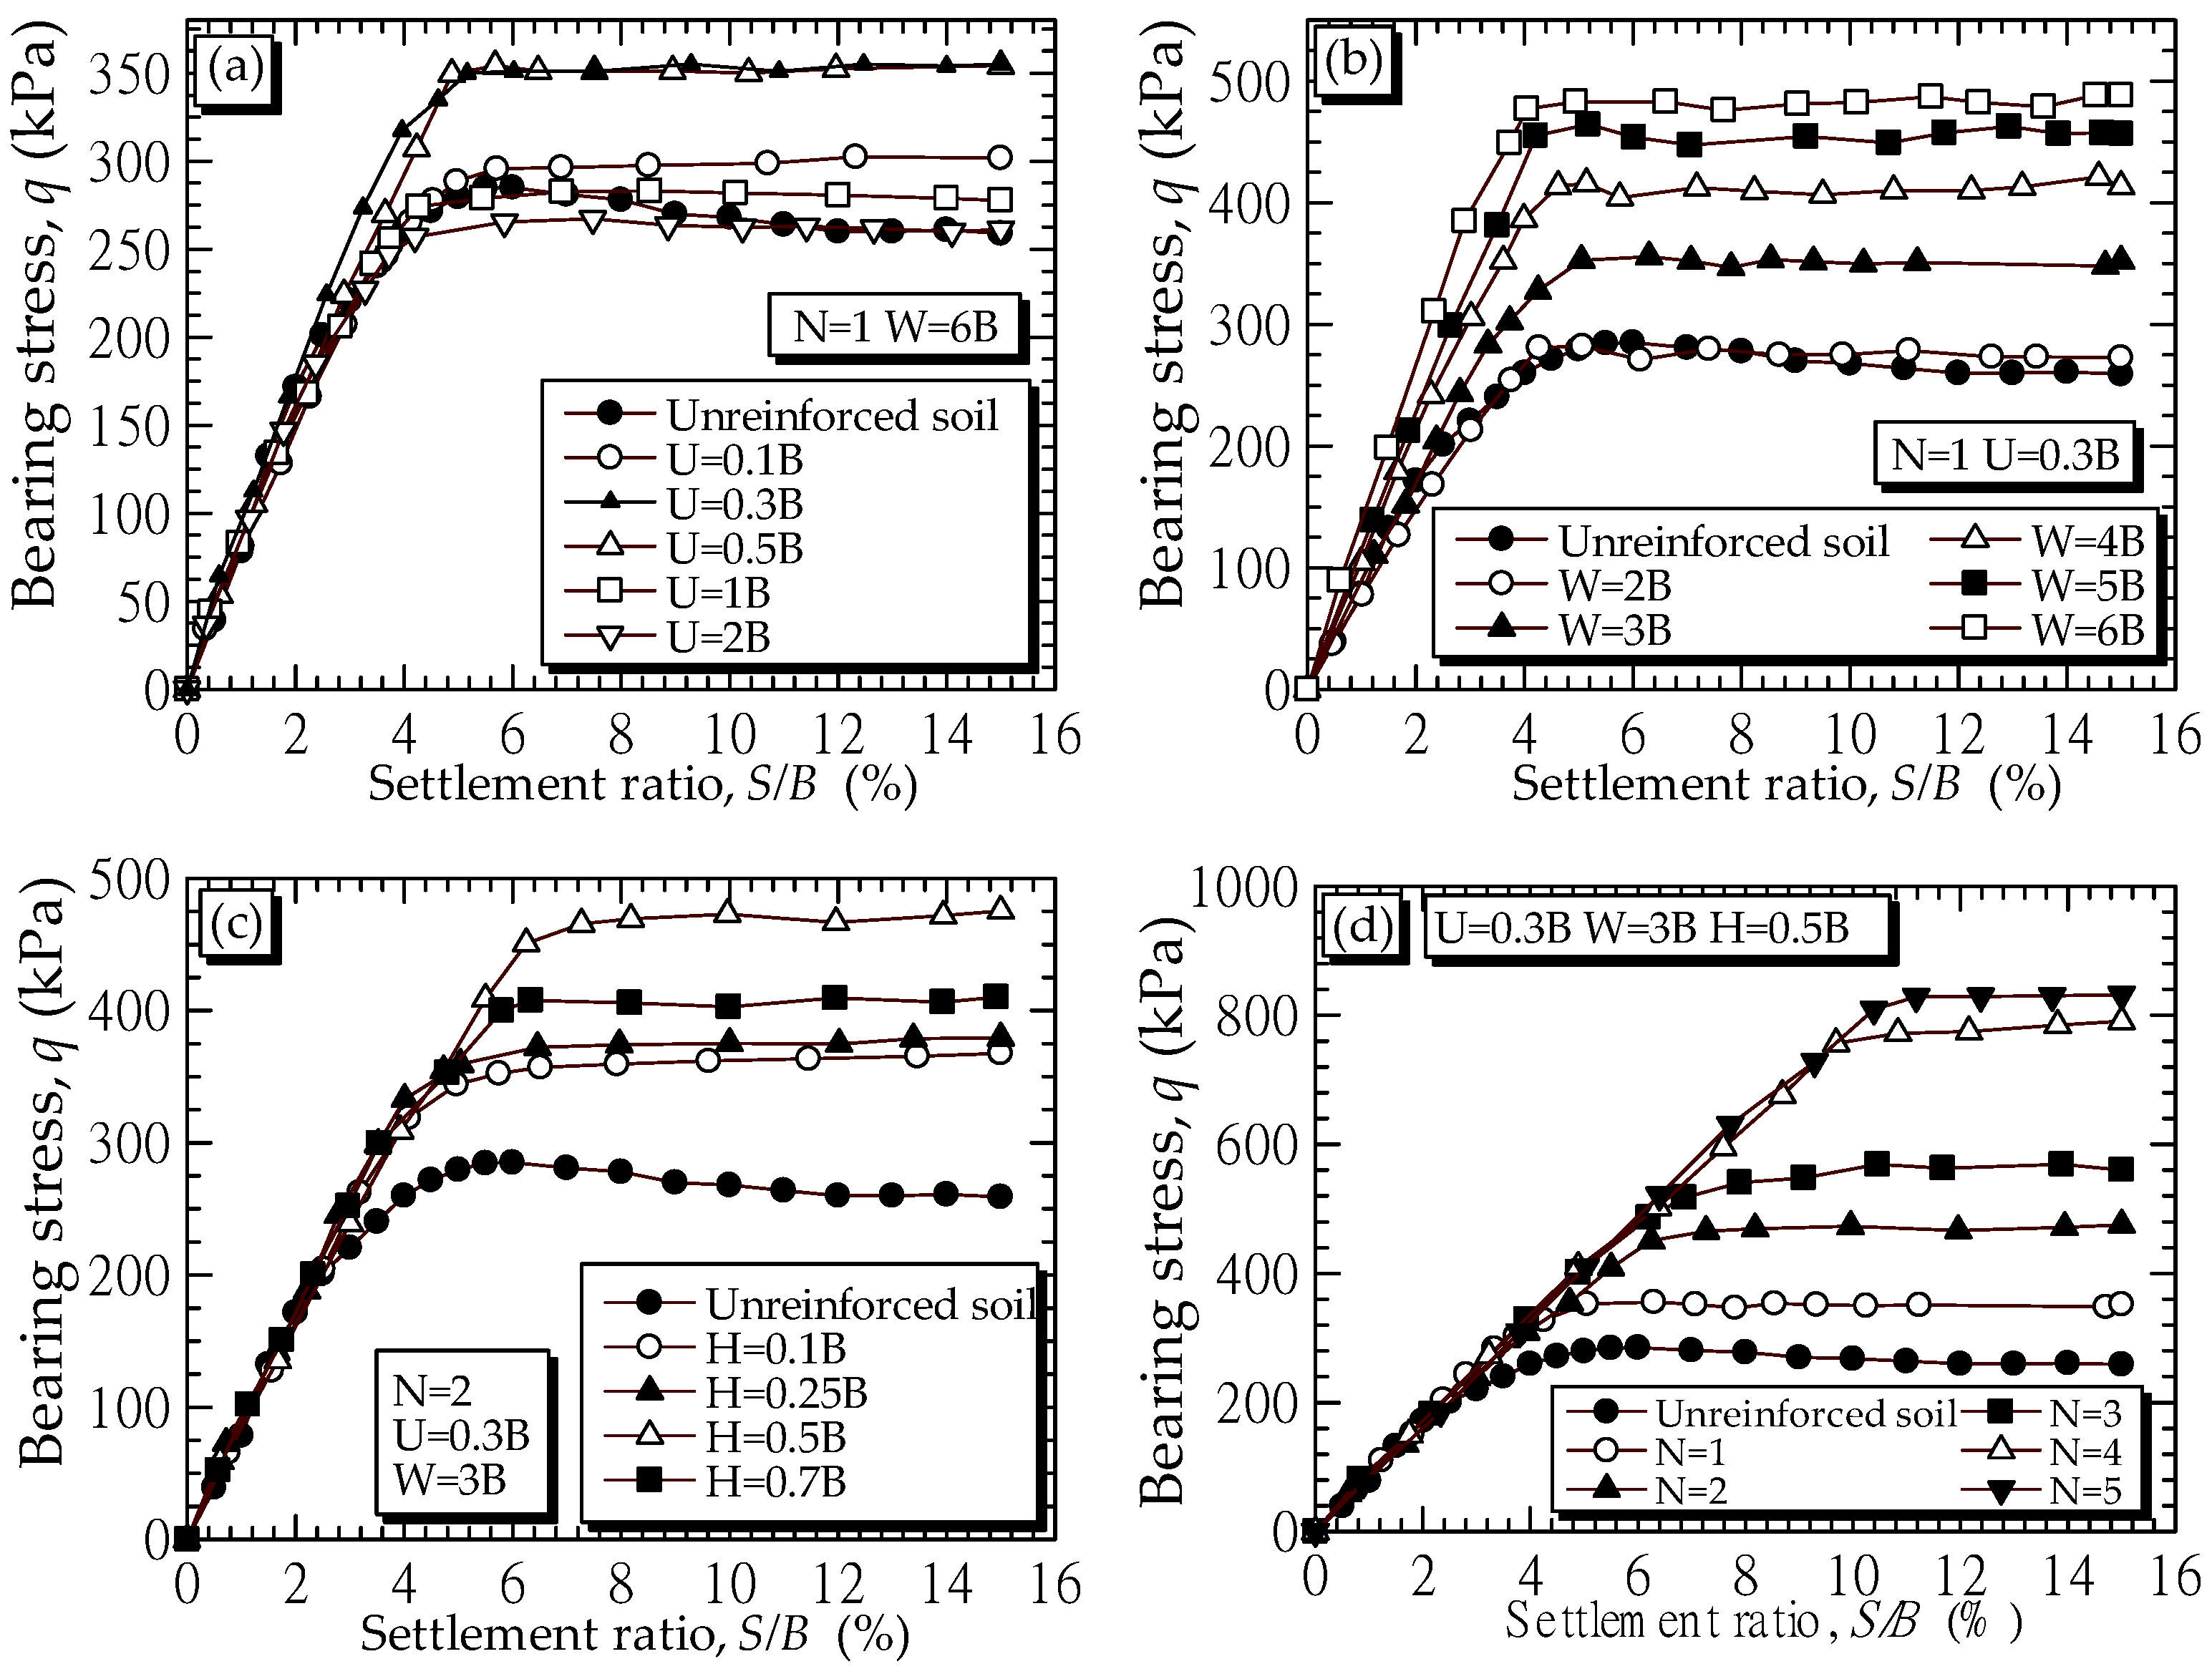
4.2. Load-Bearing Capacity of B0 Mixture Reinforced with Horizontal Planar Geotextile Reinforcement with N Layers (Series B)

Series B-1 to B-3 were carried out on the strip foundation on the B0 mixture reinforced with single horizontal planar layer (Series B-1 and B-2) and two horizontal planar layers (Series B-3) of geotextile reinforcement. The ratios of U/B, W/B and H/B were varied to obtain the optimum values. Series B-4 was for the B0 mixture reinforced with various layers of horizontal planar geotextile (N = 1 to 5) at constant ratio of U/B, W/B and H/B. Figure 8 shows the relationships between the qb and settlement ratio with various values of U/B, W/B, H/B and N. Figure 9 shows the variations of the qb/qb0.
For Series B-1, the measured qb of B0 reinforced with the single-layer planar geotextile at various U/B ratios and the W/B ratio of 6.0 is shown in Figure 8a. The bearing stress, q, increased when increasing the S/B ratio up to the S/B ratio of approximately 5% and then the qb was essentially constant with the increased S/B ratio. Figure 9a shows the qb/qb0 and U/B relationship. The maximum qb/qb0 ratio was 1.39 at the U/B = 0.30. When the U/B > 1, the qb/qb0 ratios were approximately equal to 1.0. In other words, the installation of reinforcement deeper than B did not improve the qb. Das et al. [2] stated that the decrease in qb when U/B < 0.3 was due to the lack of confinement for the top reinforcing layer. While, when U/B > 1, the failure surface in the soil is located above the top of reinforcement layer.
For Series B-2, Figure 8b and Figure 9b show the measured qb and qb/qb0 of B0 reinforced with N = 1 at a constant U/B ratio of 0.3 with various W/B ratios, respectively. For S/B = 0 to 5%, the slope of q versus S/B plots increased with the increased W/B (Figure 8b). The q of all the W/B ratios became approximately constant when S/B > 5%. Figure 9b revealed that the qb/qb0 increased as the W/B ratio increased. Khing et al. [40] suggested that the W/B ratio of 6.0 was optimal for a strip footing on sand supported by horizontal planar geosynthtic reinforcement, which is not applicable for the field projects, which with have a limited construction area. In this study, the full-wraparound geotextile reinforcement technique was investigated to reduce the reinforcement width. The W/B = 3.0 was therefore selected for Series C, D, E and F.
The qb and qb/qb0 of B0 reinforced with N = 2 at a constant ratio of U/B = 0.3 and W/B = 3.0 with various H/B ratios are shown in Figure 8c and Figure 9c (Series B-3). The qb/qb0 increased with the H/B increased from 0.1 to 0.5. Subsequently, the qb/qb0 decreased when H/B > 0.5.
Figure 8d and Figure 9d show the simulated result for Series B-4 with N =1 to 5, U/B = 0.3, W/B = 3.0, and H/B = 0.5. The S/B ratios at the failure increased from 4 to 10% for N increasing from 1 to 5, while the same gradient of q versus S/B relationship is noted (Figure 8d). Figure 9d shows that the qb value significantly increased with increasing the N value when N < 4. In other words, the most effective N was 4.
Based on Series B test results, the values of U/B = 0.3, W/B = 3.0, H/B = 0.5, and N = 4 were used for numerical studies of Series C, D, E and F.

4.3. Interface Factor

Figure 10 shows the laboratory (solid line) q of the RSF (Series C) on B0, B20, B40, B60, B80 and B100 reinforced with N = 1, U/B = 0.3, and W/B = 3.0. The Rinter values were determined by a trial and error method until the simulated q versus S/B curves were comparable with the measured q versus S/B curves.
Figure 11 shows the relationship between Rinter and PI. The Rinter value linearly decreased with the increase in PI due to the reduction in interface skin friction between soil and geotextile reinforcement:
Rinter = −0.0007 (PI) + 0.63 for 0% < PI < 314%

4.4. Performance of RSF with Different Reinforcing Techniques

Figure 12 shows the relationship between the simulated q and S/B of B20, B60 and B100 with the four configurations (Series C, D, E and F). For all cases, the q initially increased with the increase of S/B ratio up to a particular S/Bf. When S/B > S/Bf, the q value was slightly increased, and it can be assumed as achieving the failure state. For Series C, D and E, the S/Bf = 12, 8, 6, 5, and 5% for B20, B40, B60, B80 and B100, respectively, for N = 1–4. The q for Series F was fully developed at the S/Bf = 14% for N = 1 to 4. It was evident that the development of q in Series F was the highest when compared with other Series. The development of qb depended on not only the types of tested soil, but also the reinforcing techniques (planar and wraparound ends), which will be discussed in the next section.
Figure 13 shows the relationship between qb/q0 versus N for Series C, D, E and F. Figure 14, Figure 15, Figure 16, Figure 17, Figure 18 and Figure 19 show the simulated results of the total displacement vectors and stress distribution (Sig-yy) of B0, B20 and B100 at the S/B ratio of 15% for Series C, D, E and F with N = 4, respectively. When the unreinforced soil (Series A) was subjected to the vertical applied stresses, the soil particles beneath the footing moved downward to horizontal direction on both sides with large areas, as shown in Figure 14a, Figure 15a and Figure 16a for B0, B20 and B100, respectively. The triangular shaped wedge under the footing was clearly observed, as shown Figure 17a, Figure 18a and Figure 19a for B0, B20 and B100, respectively.
When PI < 30% (B0 and B20), the qb/q0 increased from 1.4 to 2.4 for B0 and 1.24 to 1.76 for B20 due to the increase in N from 1 to 4, as shown in Figure 13 (for Series C). On the other hand, when PI > 30% (B40, B60, B80 and B100), the qb/q0 development was comparatively low with the additional N. The qb/q0 ratio of B40, B60, B80 and B100 was approximately from 1.03 to 1.22 for N = 1 to 4. These results can be explained by Figure 14b and Figure 15b, in that the amount of horizontal displacement vectors at soil-geotextile interfaces of B0 and B20 densely occurred on all layers of geotextile reinforcement. However, the vectors of B100 mostly occurred only on the first layer while it lightly occurred on other layers, as shown in Figure 16b.
In general, the geotextile reinforcement can significantly increase the qb by its high tensile resistance and the soil-reinforcement interface shear resistance [3,40]. The soil particles under the footing moved along the geotextile in lateral direction, as shown in Figure 14b, Figure 15b and Figure 16b, while the high interface strength tried to prevent the movement of soil particles and, therefore, improved the qb. Moreover, the applied stress to the soil was lower when compared to unreinforced soil as some stresses were transferred to the geotextile. The deformed reinforcement can support the part of applied stress to the soil by developing upward force, as shown in Figure 17b, Figure 18b and Figure 19b.
The full-wraparound ends of geotextile filled with the foundation soil (Series D) can significantly improve the qb of B0, B20 and B40 (PI < 118%) with increasing the N layers, as shown in Figure 13. The qb/q0 was improved in a range of 1.77 to 3.30 for B0, 1.45 to 1.90 for B20, and 1.44 to 1.75 for B40 when the N value increased from 2 to 4. Most of the displacement vectors of soils appeared within the full-wraparound geotextile ends, as illustrated in Figure 14c and Figure 15c. When comparing Series D to Series C, the qb development in Series D was higher than that for Series C for the same foundation soils. Nevertheless, when PI > 118% (B60, B80 and B100), the qb/q0 was lower than 1.25 for all N values. The large soil movement between the footing and first layer of geotextile was observed (Figure 16c) when compared with soil with PI < 118% (Figure 14c and Figure 15c for B0 and B20, respectively). As such, this technique was recommended for foundation soil with PI < 118%.
The qb/q0 development for Series E (filled sand in wraparound geotextile) decreased with the increase in PI of foundation soils. The qb/q0 value increased from 1.70 to 2.84 for B20, 1.69 to 2.36 for B40, and 1.50 to 2.06 for B60, 1.40 to 1.62 for B80, and 1.2 to 1.60 for B100 when N increased from 2 to 4. For foundation soil with PI < 181% (B0, B20, B40 and B60), the applied stresses were transferred through foundation soil and distributed to wraparound geotextiles. The displacement vectors under the footing moved downward, as shown in Figure 14c and Figure 15d. The usage of high-quality soil (B0) as fill material can improve the stiffness of full-wraparound ends of geotextile. The applied stress distributed through the foundation soil under the footing to the top of geotextile layer and then the applied stress transferred to the bottom of geotextile layer, as shown in Figure 17c and Figure 18d. However, the stress distribution of foundation soil depended on its soil shear strength and stiffness.
With the low stiffness of soil with PI > 181% (B80 and B100) on the comparably stiffer RSF, the soil above the RSF largely deformed, as shown in Figure 16d. Therefore, the applied stresses could not be perfectly transferred to the other layers of geotextile; hence, the development of qb with the addition of N was insignificant (see Figure 13). In addition, the distributed stress in B0 inside full-wraparound layers was lower when compared to the case of foundation soil with PI < 181%, as illustrated in Figure 17c, Figure 18d and Figure 19d.
To improve the performance of qb for the wraparound ends technique with filled sand, the replacement of foundation soil above the RSF by B0 was studied in Series F. It was evident that the qb in Series F was the highest when compared with other Series (Figure 13). The qb/q0 increased linearly with the increased N = 2 to 4 and varied from 1.35 to 3.34 for B20, 1.86 to 2.87 for B40, 1.66 to 2.91 for B60, 1.67 to 3.03 for B80, and 1.15 to 2.61 for B100. Figure 14c, Figure 15e and Figure 16e show that, for all of the foundation soils, the displacement vectors were within the full-wraparound ends of geotextile. The applied stresses can distribute from footing to bottom geotextile reinforcement, as shown in Figure 17c, Figure 18d and Figure 19d. Accordingly, the qb development depended on the soil underneath the bottom layer. The qb development decreased with the increasing of PI. This technique changed the shallow foundation to deep foundation.
Based on the analysis of numerical results, the qb improvement depended on both the reinforcement configurations and the PI of foundation soil. The horizontal planar reinforced soils (Series C), the full-wraparound ends with filled-in foundation soil (Series D), and the full wrapround ends with filled-in sand (Series E) were recommended for foundation soil with PI < 30%, PI < 118%, and PI < 181%, respectively. The highest of qb/q0 ratio was achieved when using the full wrapround ends of geotextile with filled-in sand and replaced sand under footing (Series F).
The replacement method with cohesionless soil (high-quality soil), such as sand and gravel, is a classical technique for improving the bearing capacity of footing on cohesive-frictional soils (low-quality soil). The qb improvement is significantly dependent upon the depth of soil replacement. Numerical simulations were performed on the studied soils (B0 and B100) to compare the qb/q0 value from the replacement method with that from Series F of B100 with the same boundary condition (Figure 5). Based on the simulation, when the B0 with the replacement width of 3B was used to improve bearing capacity of footing on B100 at various replacement depth, the qb/q0 was equal to 1.05, 1.27, 1.54, 1.61 and 1.62 for the replacement depth of 0.5B, 1B, 1.5B, 2B and 3B, respectively. This implied that the suitable replacement depth was approximately 2B. When compared with results of Series F (see Figure 12c), the same qb/q0 can be achieved with only 0.8B replacement depth when N = 2 was implemented. Moreover, the greater qb improvement (qb/q0 > 1.62) was possible for Series F with the increased N (see Figure 13).

5. Conclusions

This paper investigated the effects of several types of cohesive-frictional soil and geotextile reinforcement configurations on the bearing capacity via a laboratory test and numerical simulation. The reinforcement used in this study was a woven geotextile that was manufactured from the high strength polyester (PET). The four reinforcement configurations studied were: (i) horizontal planar form of geotextile, (ii) full-wraparound ends of geotextile with foundation soils, (iii) full-wraparound ends of geotextile with filled-in sand, and (iv) full-wraparound ends of geotextile with filled-in sand and sand replaced foundation soil. The studied foundation soils were mixtures of fine sand and sodium bentonite at different replacement ratios of 0%, 20%, 40%, 60%, 80% and 100% by the dry weight of sand. The bearing capacity ratio (qb/q0) was used to illustrate the bearing capacity improvement due to the geotextile reinforcement, where qb = bearing capacity of RSF and qb0 = the bearing capacity of unreinforced soil. The following conclusions can be drawn from this study.
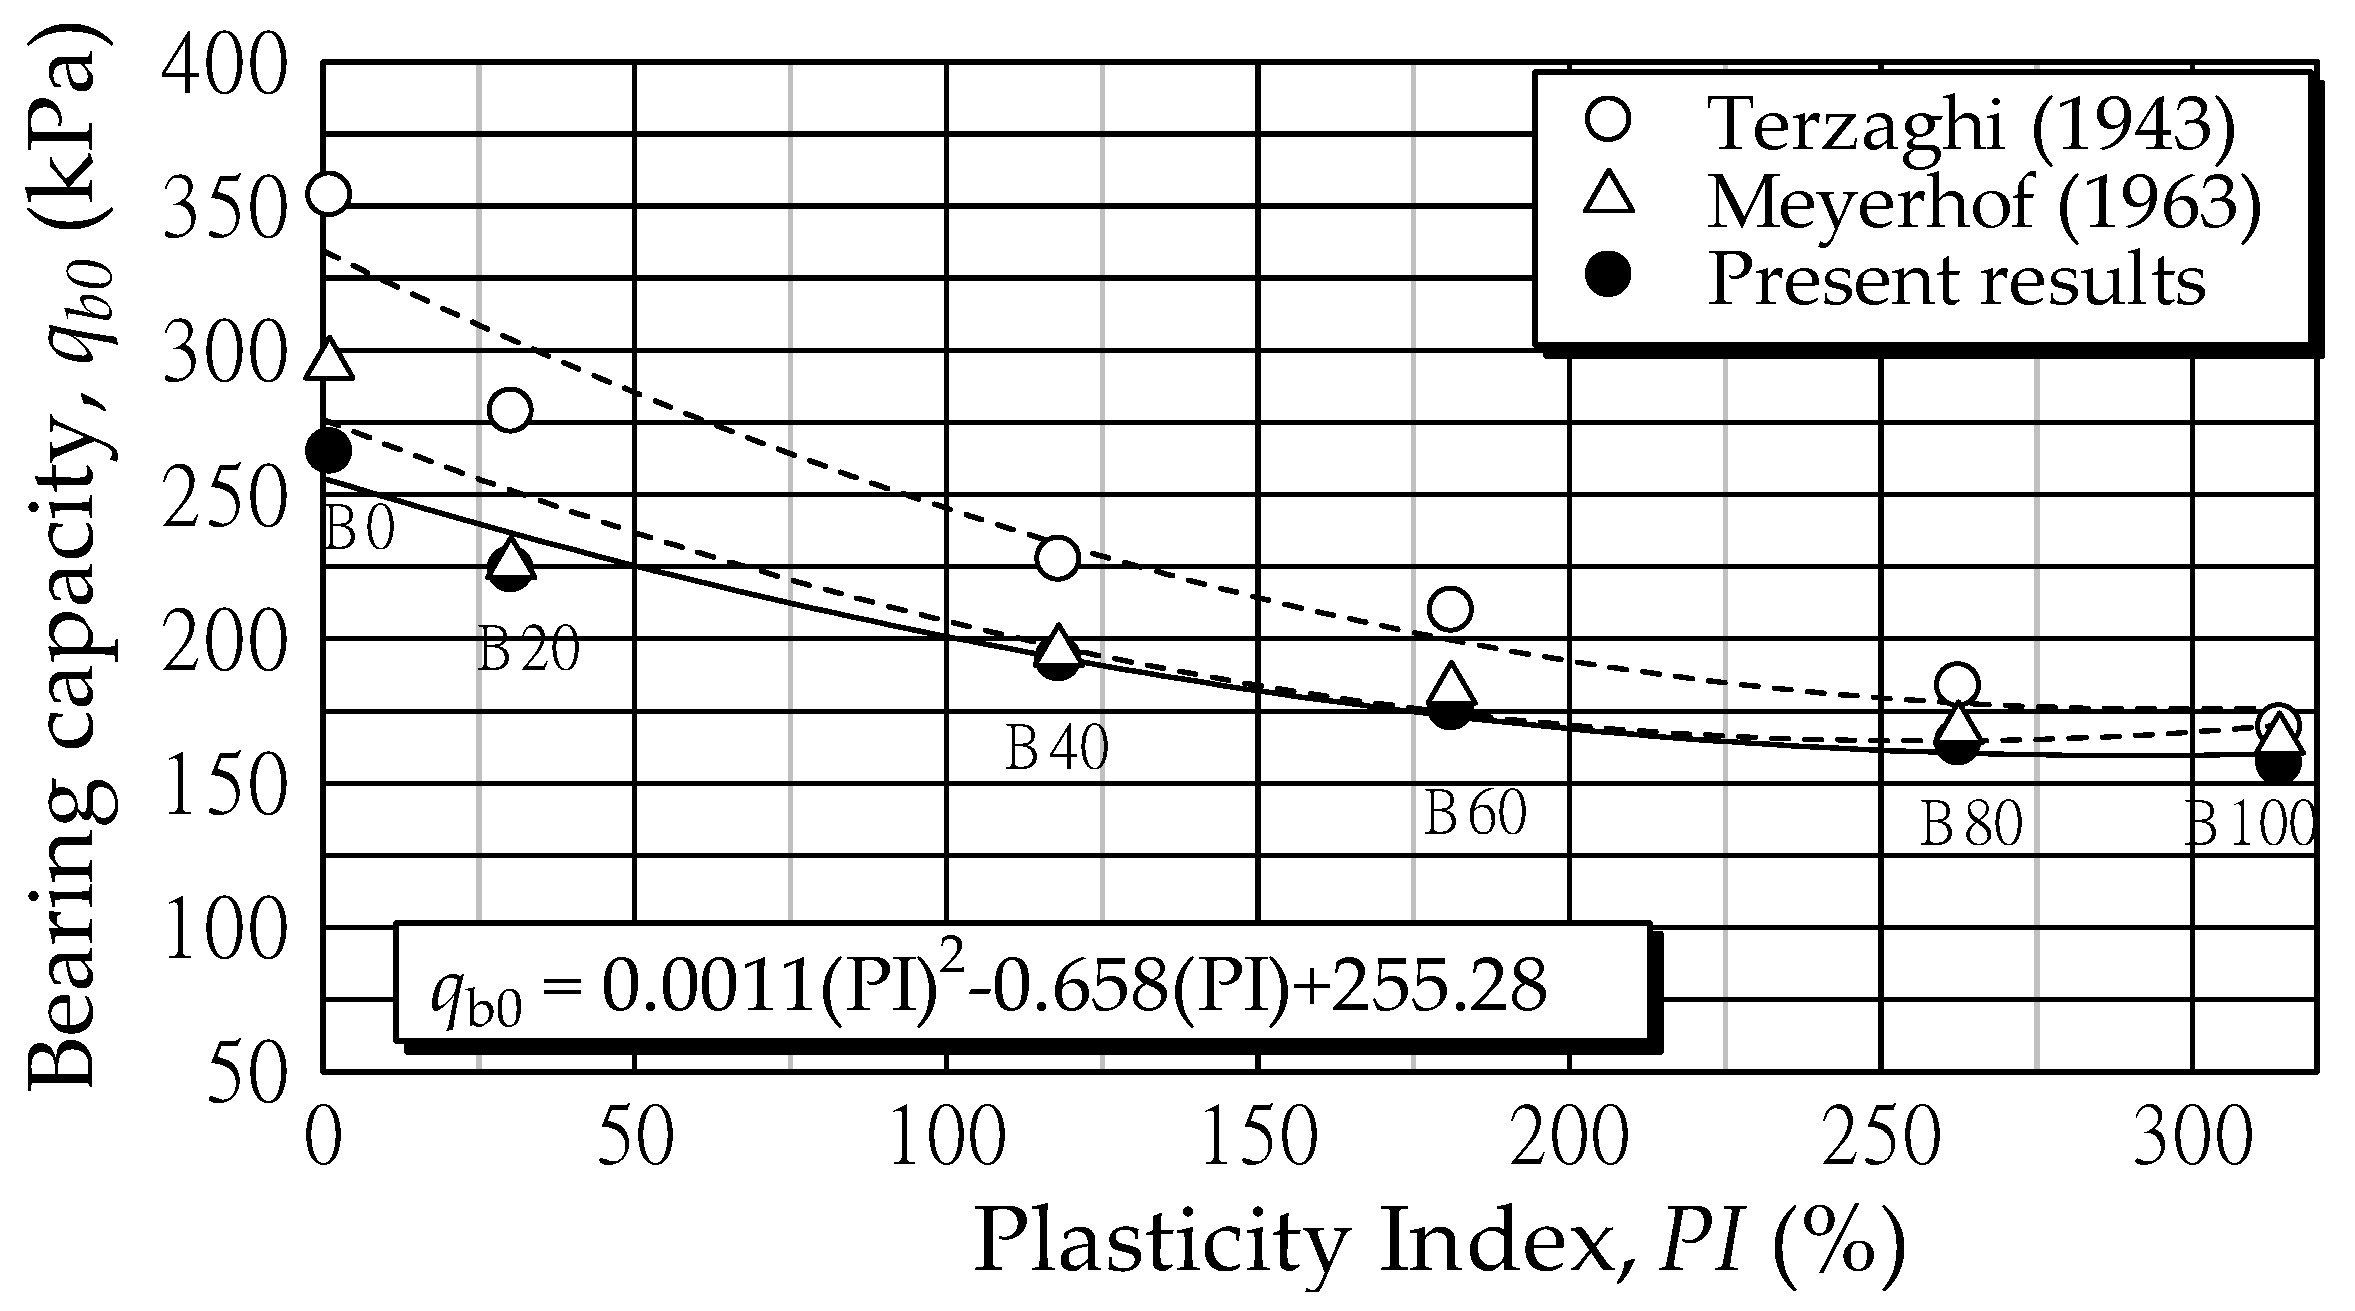
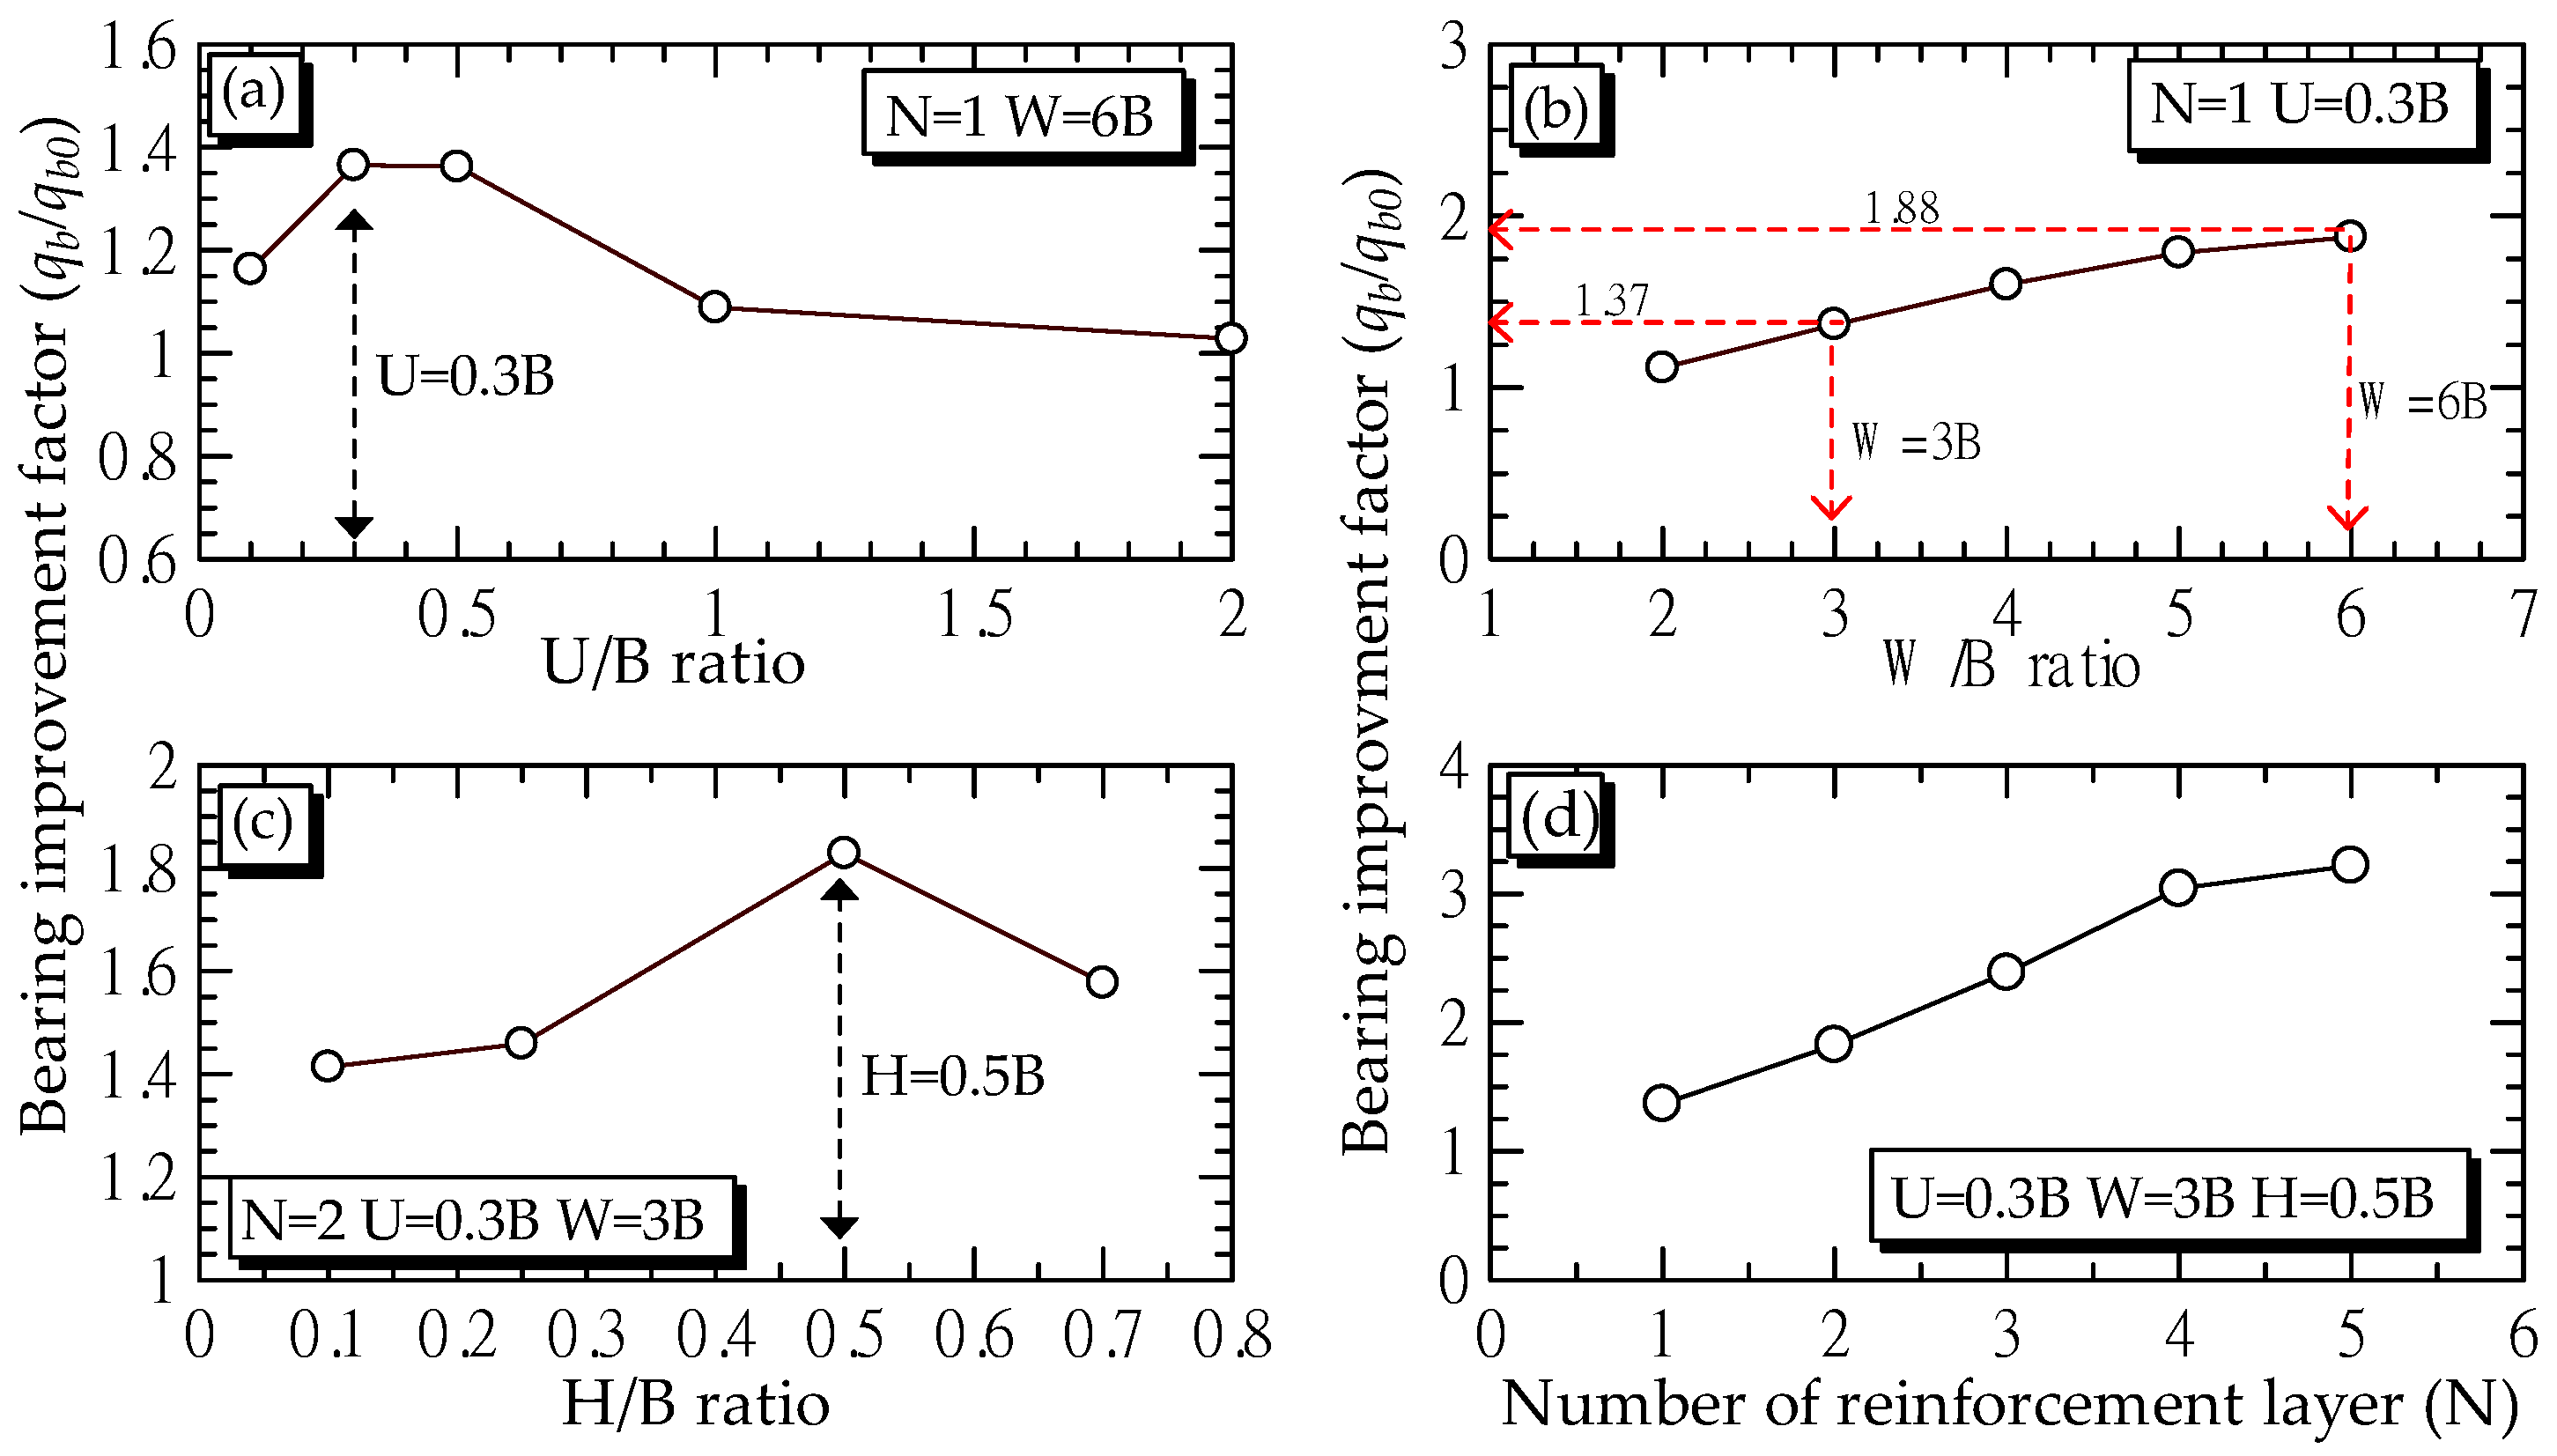
  • For unreinforced soil, the qb0 decreased as the PI increased because of the reduction of soil shear strength. The qb0 can be predicted in terms of PI using a polynomial function: qb0 = 0.0011(PI)2 − 0.658(PI) + 255.28 when 0% < PI < 314%. The qb0 with various PI is satisfactorily predicted by Meyerhof (1963)’s equation. The laboratory investigation showed that the effective values of influence parameters for planar geotextile reinforcement were U/B = 0.3, W/B = 3.0, H/B = 0.5, and N = 4.
  • For the horizontal planar form of geotextile reinforcement, when PI < 30, the qb/q0 increased with the increase in N from 1 to 4. The high soil-geotextile interface shear resistance tended to prevent the movement of soil particles and increased the bearing capacity. On the other hand, when PI > 30% (B40, B60, B80 and B100), the qb/q0 development was comparatively low with the additional N, because the soil movement highly occurred only on the first layer.
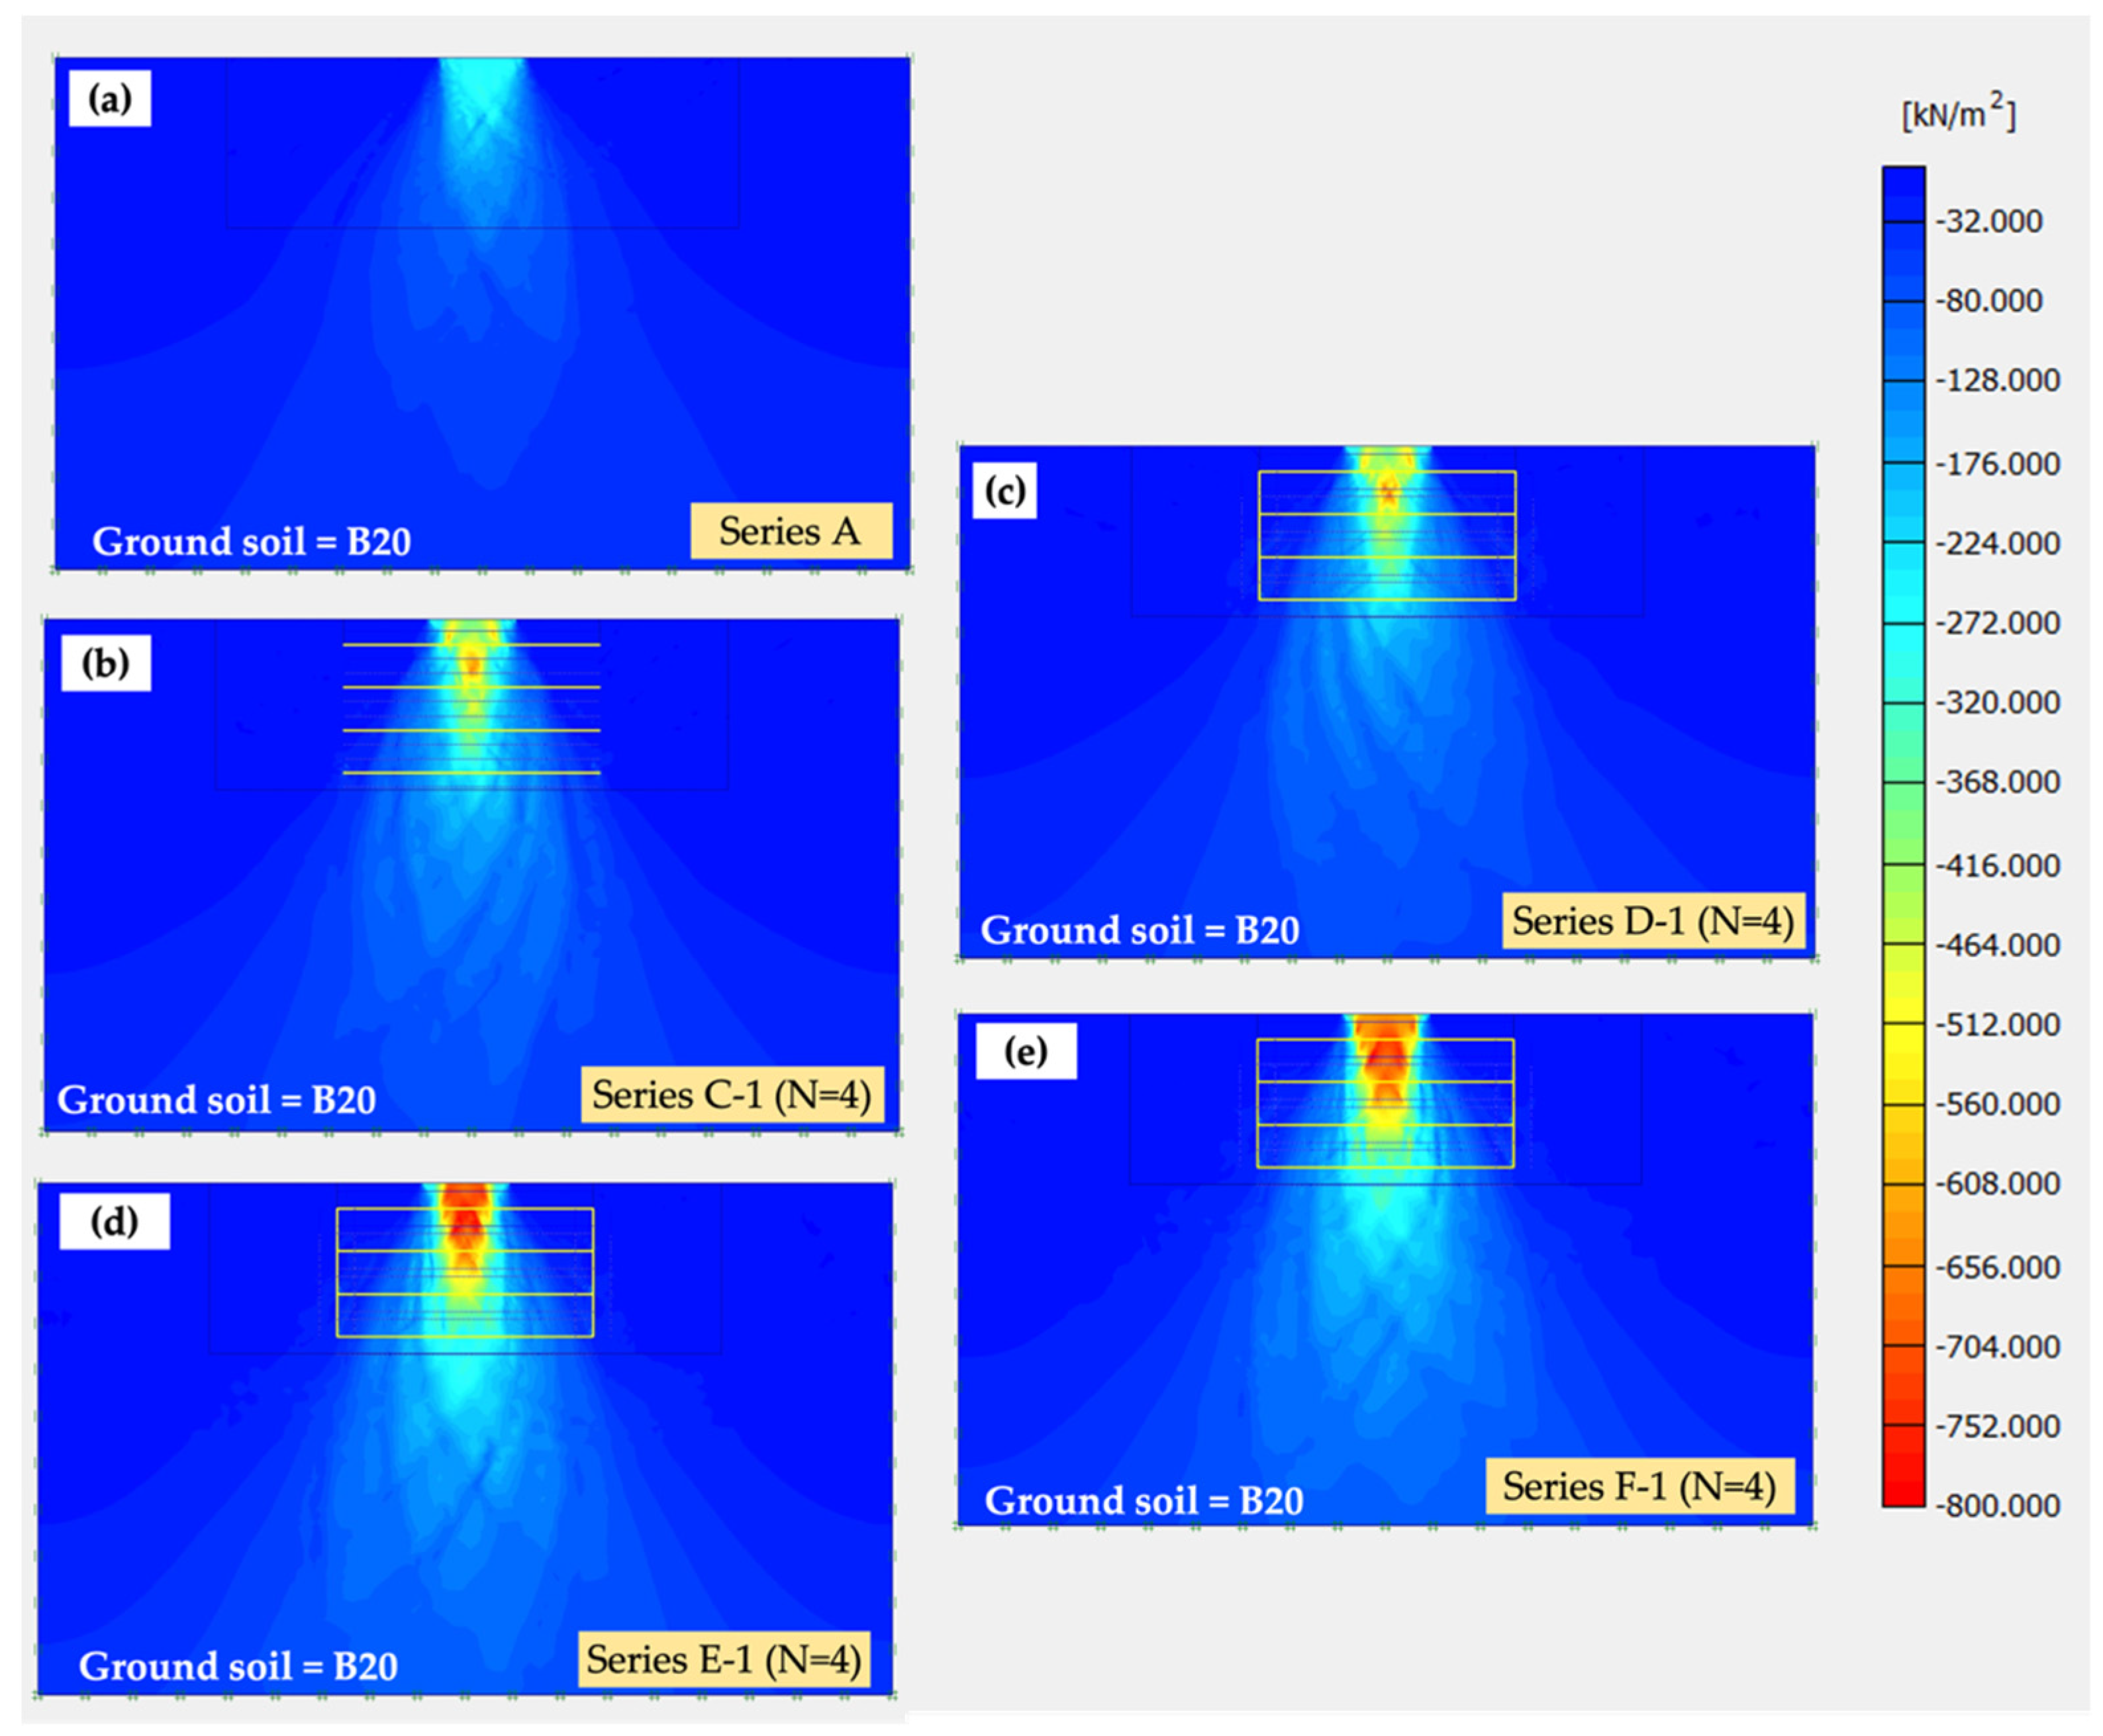
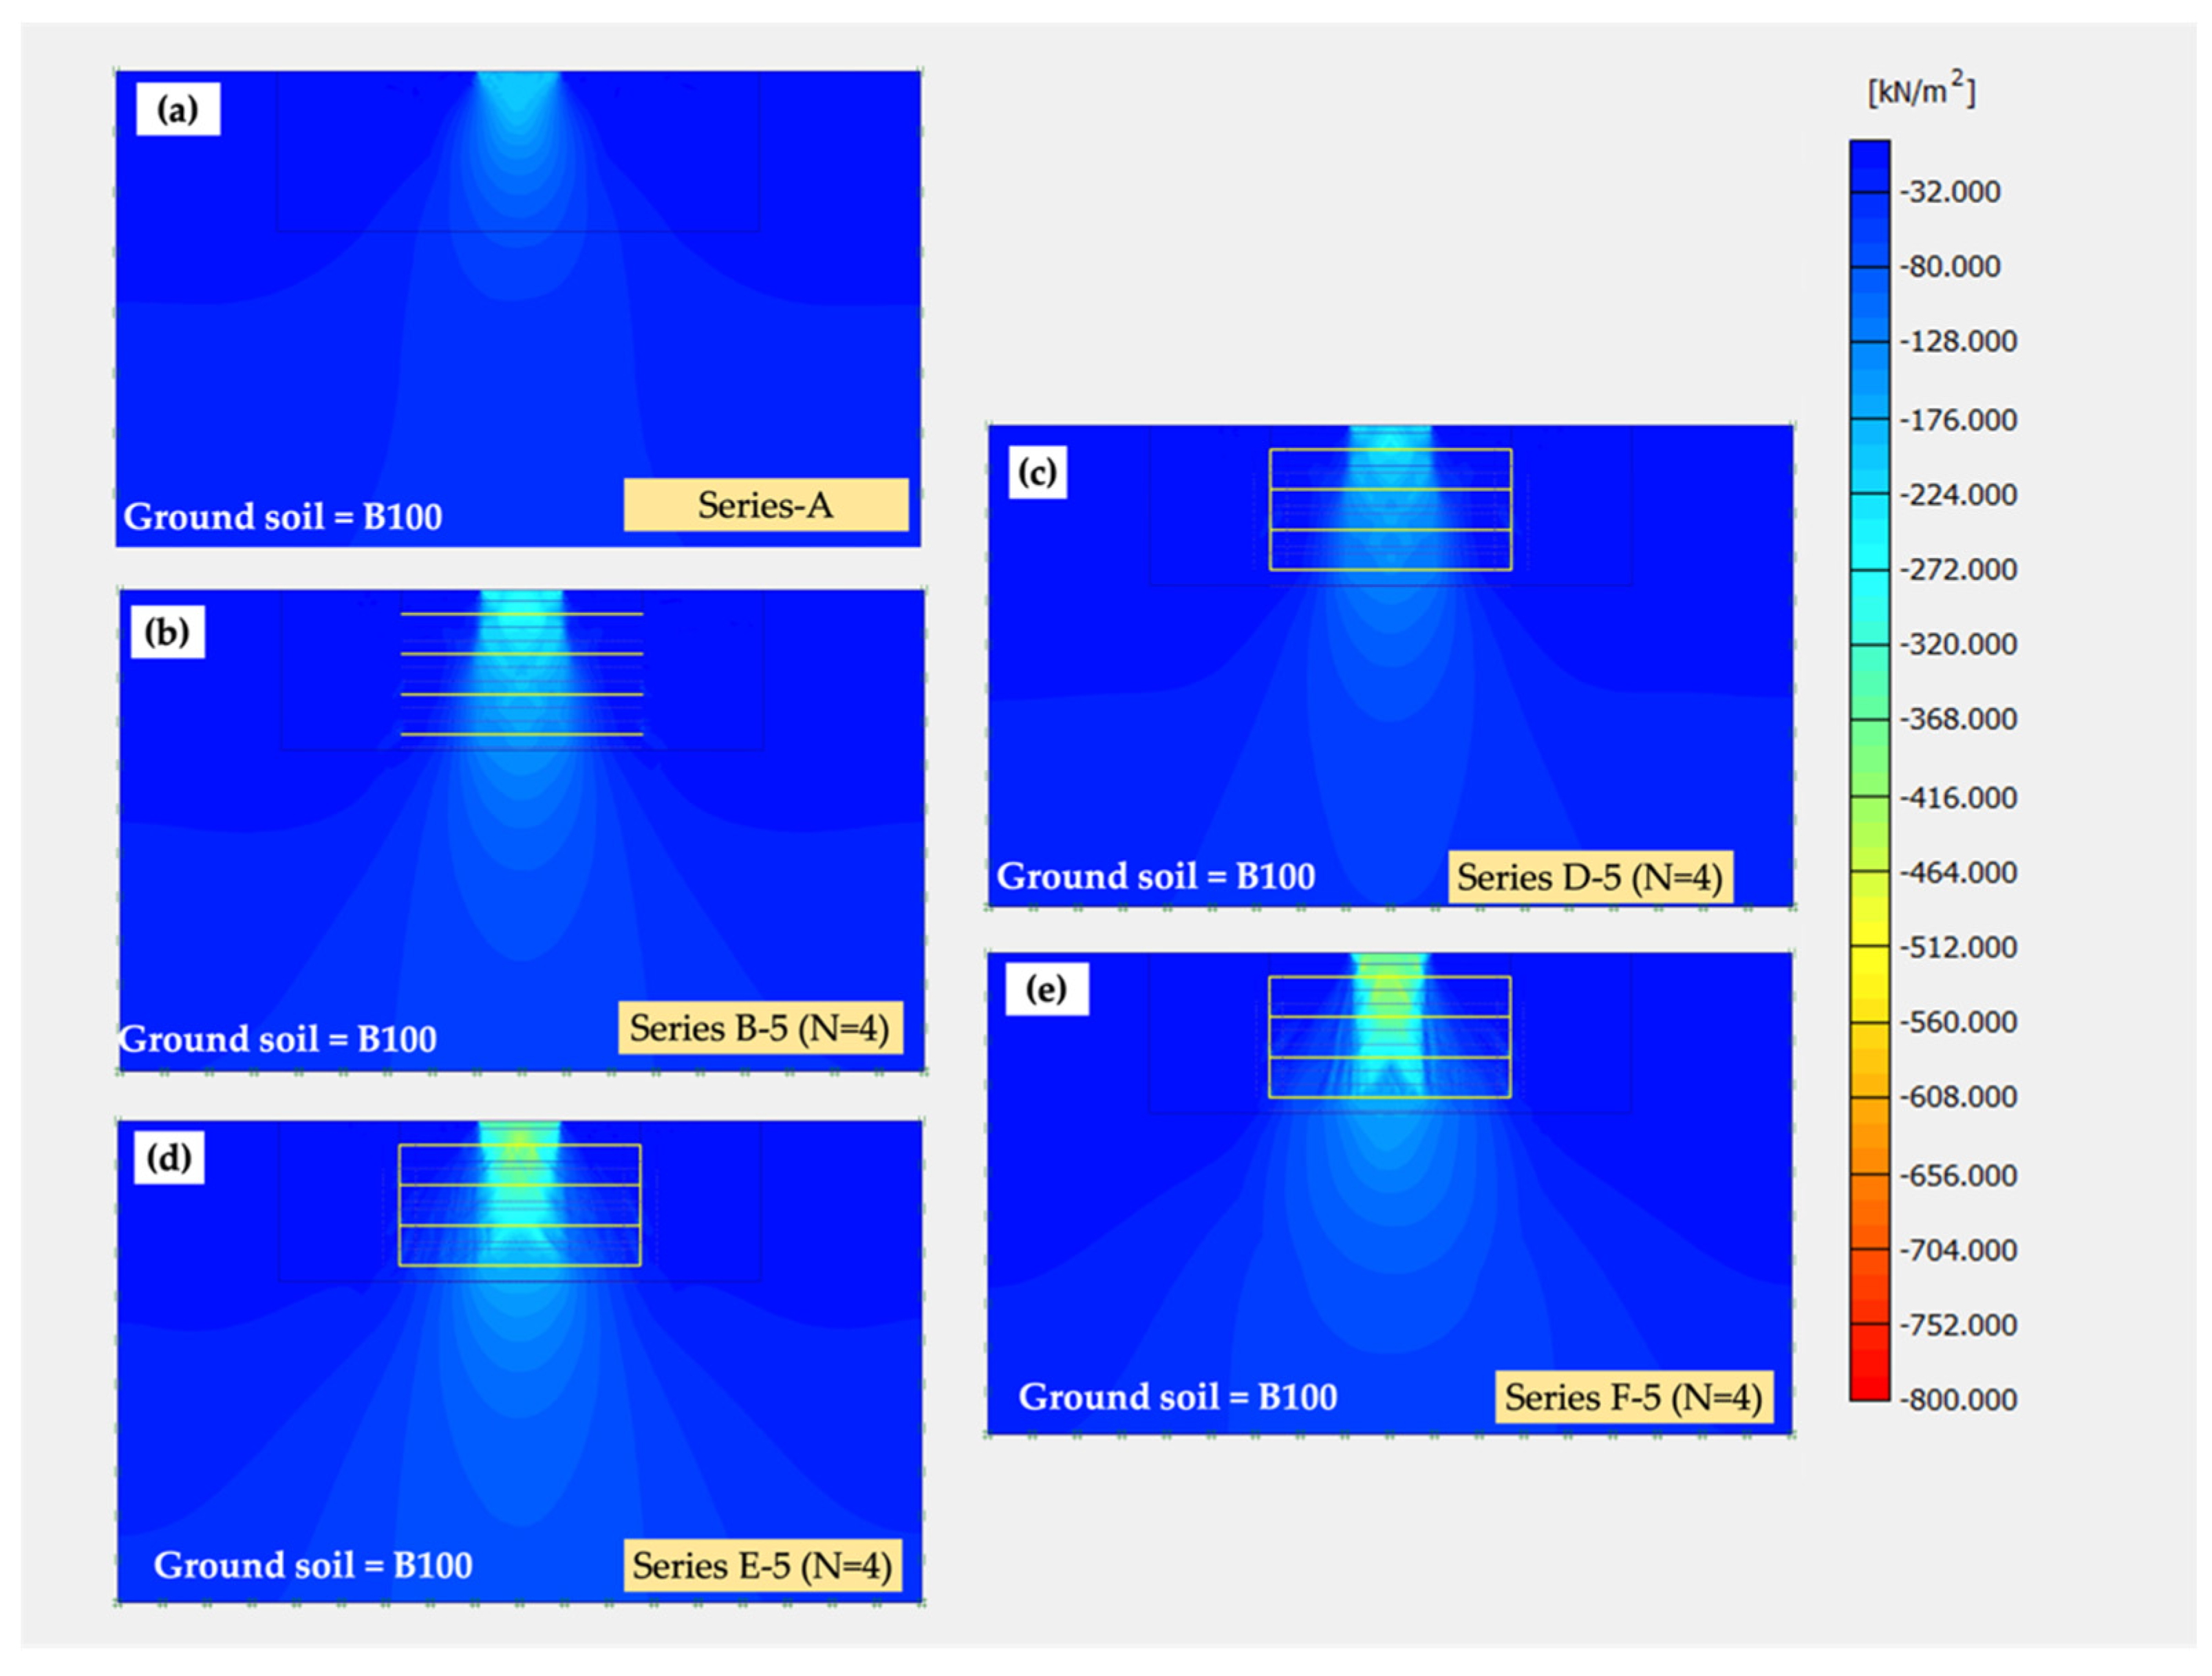
  • For the full-wraparound ends of geotextile with filled-in foundation soils, when PI < 118%, the qb/q0 was improved in a range of 1.77 to 3.30 for B0, 1.45 to 1.90 for B20, and 1.44 to 1.75 for B40 when the N value increased from 2 to 4. Nevertheless, when PI > 118%, the qb/q0 was lower than 1.25 for all N values. When compared to the horizontal planar form of geotextile, the qb development in full-wraparound ends of geotextile was higher for the same foundation soils.
  • For the full-wraparound ends of geotextile with filled-in sand, the qb/q0 value increased when the N increased from 2 to 4. For foundation soil with PI < 181%, the applied stress distributed through the foundation soil under the footing to the geotextiles effectively. However, the soil above the RSF was largely deformed with the low stiffness of soil with PI > 181% on the comparably stiffer RSF. With sand backfill under the footing, the qb/q0 increased linearly with the increase of N from 2 to 4. The qb/q0 varied from 1.35 to 3.34 for B20, 1.86 to 2.87 for B40, 1.66 to 2.91 for B60, 1.67 to 3.03 for B80, and 1.15 to 2.61 for B100.
  • The horizontal planar reinforced soils, the full-wraparound ends of geotextile with filled-in foundation soil, and the full wraparound ends of geotextile with filled-in sand, were recommended for foundation soils with PI < 30%, PI < 118%, and PI < 181%, respectively. The sand backfill above the full wraparound ends of geotextile with filled-in sand can help effectively transfer the applied stress to RSF, hence the significant improvement in qb.
  • It is kept in mind that the studied results are only valid for a woven geotextile. However, the knowledge gained from this research can be used as a guideline for further studies on different types of geosynthestics.

Author Contributions

Conceptualization and methodology, G.S. and P.S.; software and validation, G.S. and S.H.; writing—original draft preparation, G.S.; writing—review and editing, S.H., M.H. and A.A.; supervision, G.S. All authors have read and agreed to the published version of the manuscript.

Funding

This work is financially supported by the Walailak University, No. WU6223. The authors also acknowledge the support from the National Science and Technology Development Agency under the Chair Professor program [grant no P-19-52303].

Institutional Review Board Statement

Not applicable.

Informed Consent Statement

Not applicable.

Conflicts of Interest

The authors declare no competing interest.

References

  1. Chen, R.-H.; Wu, C.-P.; Huang, F.-C.; Shen, C.-W. Numerical analysis of geocell-reinforced retaining structures. Geotext. Geomembr. 2013, 39, 51–62. [Google Scholar] [CrossRef]
  2. Das, B.M.; Shin, E.C.; Omar, M.T. The bearing capacity of surface strip foundations on geogrid-reinforced sand and clay—A comparative study. Geotech. Geol. Eng. 1994, 12, 1–14. [Google Scholar] [CrossRef]
  3. Dash, S.K.; Krishnaswamy, N.R.; Rajagopal, K. Bearing capacity of strip footings supported on geocell-reinforced sand. Geotext. Geomembr. 2001, 19, 235–256. [Google Scholar] [CrossRef]
  4. Han, J. Principles and Practice of Ground Improvement; John Wiley & Sons, Inc: Hoboken, NJ, USA, 2015. [Google Scholar]
  5. Hegde, A.M.; Sitharam, T.G. Three-dimensional numerical analysis of geocell-reinforced soft clay beds by considering the actual geometry of geocell pockets. Can. Geotech. J. 2015, 52, 1396–1407. [Google Scholar] [CrossRef]
  6. Kazi, M.; Shukla, S.K.; Habibi, D. Behavior of embedded strip footing on sand bed reinforced with multilayer geotextile with wraparound ends. Int. J. Geotech. Eng. 2015, 9, 437–452. [Google Scholar] [CrossRef]
  7. Kazi, M.; Shukla, S.K.; Habibi, D. An Improved Method to Increase the Load-Bearing Capacity of Strip Footing Resting on Geotextile-Reinforced Sand Bed. Indian Geotech. J. 2015, 45, 98–109. [Google Scholar] [CrossRef]
  8. Shirazi, M.G.; Rashid, A.S.A.; Nazir, R.B.; Rashid, R.H.B.A.; Moayedi, H.; Horpibulsuk, S.; Samingthong, W. Sustainable soil bearing capacity improvement using natural limited life geotextile reinforcement—A review. Minerals 2020, 10, 479. [Google Scholar] [CrossRef]
  9. Rashid, A.S.A.; Shirazi, M.G.; Nazir, R.; Mohamad, H.; Sahdi, F.; Horpibulsuk, S. Bearing capacity performance of soft cohesive soil treated by kenaf limited life geotextile. Mar. Georesour. Geotechnol. 2020, 38, 755–760. [Google Scholar] [CrossRef]
  10. Chakraborty, M.; Kumar, J. Bearing capacity of circular foundations reinforced with geogrid sheets. Soils Found. 2014, 54, 820–832. [Google Scholar] [CrossRef] [Green Version]
  11. Chen, Q.; Abu-Farsakh, M. Ultimate bearing capacity analysis of strip footings on reinforced soil foundation. Soils Found. 2015, 55, 74–85. [Google Scholar] [CrossRef] [Green Version]
  12. Shahin, H.M.; Nakai, T.; Morikawa, Y.; Masuda, S.; Mio, S. Effective use of geosynthetics to increase bearing capacity of shallow foundations. Can. Geotech. J. 2017, 54, 1647–1658. [Google Scholar] [CrossRef]
  13. Benmebarek, S.; Djeridi, S.; Benmebarek, N.; Belounar, L. Improvement of bearing capacity of strip footing on reinforced sand. Int. J. Geotech. Eng. 2018, 12, 537–545. [Google Scholar] [CrossRef]
  14. Djeridi, S.; Benmebarek, N.; Benmebarek, S. Effect of Full Wrap-Around Ends of Geotextile on the Bearing Capacity of Sand. In Advances in Science, Technology & Innovation; IEREK Interdisciplinary Series for Sustainable Development; Springer: Berlin/Heidelberg, Germany, 2019; pp. 291–294. [Google Scholar] [CrossRef]
  15. Rao, P.; Liu, Y.; Cui, J. Bearing capacity of strip footings on two-layered clay under combined loading. Comput. Geotech. 2015, 69, 210–218. [Google Scholar] [CrossRef]
  16. Benmebarek, S.; Benmoussa, S.; Belounar, L.; Benmebarek, N. Bearing Capacity of Shallow Foundation on Two Clay Layers by Numerical Approach. Geotech. Geol. Eng. 2012, 30, 907–923. [Google Scholar] [CrossRef]
  17. Benmebarek, S.; Remadna, M.S.; Benmebarek, N.; Belounar, L. Numerical evaluation of the bearing capacity factor Nγ′ of ring footings. Comput. Geotech. 2012, 44, 132–138. [Google Scholar] [CrossRef]
  18. Conte, E.; Donato, A.; Troncone, A. Progressive failure analysis of shallow foundations on soils with strain-softening behaviour. Comput. Geotech. 2013, 54, 117–124. [Google Scholar] [CrossRef] [Green Version]
  19. Sukmak, K.; Sukmak, P.; Horpibulsuk, S.; Han, J.; Shen, S.-L.; Arulrajah, A. Effect of fine content on the pullout resistance mechanism of bearing reinforcement embedded in cohesive–frictional soils. Geotext. Geomembr. 2015, 43, 107–117. [Google Scholar] [CrossRef]
  20. Lupini, J.F.; Skinner, A.E.; Vaughan, P.R. The drained residual strength of cohesive soils. Géotechnique 1981, 31, 181–213. [Google Scholar] [CrossRef]
  21. Maio, C.D.; Fenellif, G.B. Residual strength of kaolin and bentonite: The influence of their constituent pore fluid. Géotechnique 1994, 44, 217–226. [Google Scholar] [CrossRef] [Green Version]
  22. Mesri, G.; Cepeda-Diaz, A.F. Residual shear strength of clays and shales. Géotechnique 1986, 36, 269–274. [Google Scholar] [CrossRef]
  23. Sridharan, A.; Rao, S.; Murthy, N. Liquid Limit of Montmorillonite Soils. Geotech. Test. J. 1986, 9, 156–159. [Google Scholar] [CrossRef]
  24. Tan, T.; Goh, T.; Karunaratne, G.; Lee, S. Shear Strength of Very Soft Clay-Sand Mixtures. Geotech. Test. J. 1994, 17, 27–34. [Google Scholar] [CrossRef]
  25. Bergado, D.T.; Youwai, S.; Teerawattanasuk, C.; Visudmedanukul, P. The interaction mechanism and behavior of hexagonal wire mesh reinforced embankment with silty sand backfill on soft clay. Comput. Geotech. 2003, 30, 517–534. [Google Scholar] [CrossRef]
  26. Khedkar, M.S.; Mandal, J.N. Pullout behaviour of cellular reinforcements. Geotext. Geomembr. 2009, 27, 262–271. [Google Scholar] [CrossRef]
  27. Suksiripattanapong, C.; Chinkulkijniwat, A.; Horpibulsuk, S.; Rujikiatkamjorn, C.; Tangsuttinon, T. Numerical Analysis of Bearing Reinforcement Earth (BRE) Wall. Geotext. Geomembr. 2012, 32, 28–37. [Google Scholar] [CrossRef] [Green Version]
  28. Sukmak, K.; Han, J.; Sukmak, P.; Horpibulsuk, S. Numerical parametric study on behavior of bearing reinforcement earth walls with different backfill material properties. Geosynth. Int. 2016, 23, 435–451. [Google Scholar] [CrossRef] [Green Version]
  29. Prandtl, L. Uber die eindringungstestigkeit plastisher baustoffe und die festigkeit von schneiden [in German]. Z. Fur Angew. Math. Mech. 1921, 1, 15–30. [Google Scholar] [CrossRef]
  30. Terzaghi, K. Theoretical Soil Mechanics; John Wiley & Sons, Inc.: Hoboken, NJ, USA, 1943. [Google Scholar]
  31. Meyerhof, G.G. Some recent research on the bearing capacity of foundations. Can. Geotech. J. 1963, 1, 16–26. [Google Scholar] [CrossRef]
  32. Burd, H.J.; Frydman, S. Bearing capacity of plane-strain footings on layered soils. Can. Geotech. J. 1997, 34, 241–253. [Google Scholar] [CrossRef]
  33. Hanna, A.M.; Meyerhof, G.G. Design charts for ultimate bearing capacity of foundations on sand overlying soft clay. Can. Geotech. J. 1980, 17, 300–303. [Google Scholar] [CrossRef]
  34. Ismail Ibrahim, K.M.H. Bearing capacity of circular footing resting on granular soil overlying soft clay. HBRC J. 2016, 12, 71–77. [Google Scholar] [CrossRef] [Green Version]
  35. Kumar, J.; Chakraborty, M. Bearing capacity of a circular foundation on layered sand–clay media. Soils Found. 2015, 55, 1058–1068. [Google Scholar] [CrossRef] [Green Version]
  36. Madhav Madhira, R.; Sharma, J.S.N. Bearing Capacity of Clay Overlain by Stiff Soil. J. Geotech. Eng. 1991, 117, 1941–1948. [Google Scholar] [CrossRef]
  37. Huang, C.-C.; Tatsuoka, F. Bearing capacity of reinforced horizontal sandy ground. Geotext. Geomembr. 1990, 9, 51–82. [Google Scholar] [CrossRef]
  38. Lovisa, J.; Shukla, S.K.; Sivakugan, N. Behaviour of prestressed geotextile-reinforced sand bed supporting a loaded circular footing. Geotext. Geomembr. 2010, 28, 23–32. [Google Scholar] [CrossRef]
  39. Yetimoglu, T.; Wu Jonathan, T.H.; Saglamer, A. Bearing Capacity of Rectangular Footings on Geogrid-Reinforced Sand. J. Geotech. Eng. 1994, 120, 2083–2099. [Google Scholar] [CrossRef]
  40. Khing, K.H.; Das, B.M.; Puri, V.K.; Cook, E.E.; Yen, S.C. The bearing-capacity of a strip foundation on geogrid-reinforced sand. Geotext. Geomembr. 1993, 12, 351–361. [Google Scholar] [CrossRef]
  41. Kumar, G.V.; Muir Wood, D. Fall cone and compression tests on clay-gravel mixtures. Geotechnique 1999, 49, 727–739. [Google Scholar] [CrossRef]
  42. Polidori, E. Relationship between the atterberg limits and clay content. Soils Found. 2007, 47, 887–896. [Google Scholar] [CrossRef] [Green Version]
  43. Skempton, A.W. The colloidal activity of clays. In Proceedings of the 3rd International Conference on Soil Mechanics and Foundation Engineering, Zurich, Switzerland, 16–27 August 1953; Volume 1, pp. 57–61. [Google Scholar]
  44. ASTM-D698 Standard Test. Methods for Laboratory Compaction Characteristics of Soil Using Standard Effort (12,400 ft-lbf/ft3 (600 kN-m/m3)); ASTM International: West Conshohocken, PA, USA, 2012.
  45. Al-Shayea, N.A. The combined effect of clay and moisture content on the behavior of remolded unsaturated soils. Eng. Geol. 2001, 62, 319–342. [Google Scholar] [CrossRef]
  46. Tiwari, B.; Marui, H. A New Method for the Correlation of Residual Shear Strength of the Soil with Mineralogical Composition. Geotech. Geol. Eng. 2005, 131, 1139–1150. [Google Scholar] [CrossRef]
  47. Wang, S.; Chan, D.; Lam, K.C. Experimental study of the effect of fines content on dynamic compaction grouting in completely decomposed granite of Hong Kong. Constr Build. Mater. 2009, 23, 1249–1264. [Google Scholar] [CrossRef]
  48. Shadi, A.; Sanjay, K.S.; Alireza, M. Behaviour of sandy soil reinforced with geotextile having partially and fully wrapped ends. Ground Improvement. 2021, 174, 29–41. [Google Scholar] [CrossRef]
  49. Shadi, A.; Sanjay, K.S.; Alireza, M. Numerical Investigation of Wraparound Geotextile Reinforcement Technique for Strengthening Foundation Soil. Int. J. Geomech. 2019, 19. [Google Scholar] [CrossRef]
  50. Brinkgreve, R.B.J.; Broere, W.; Waterman, D. PLAXIS 2D—Version 8 Tutorial Manual; Plaxisbv: Delft, The Netherlands, 2006. [Google Scholar]
  51. ASTM-D4595 Standard Test. Method for Tensile Properties of Geotextiles by the Wide-Width Strip Method; ASTM International: West Conshohocken, PA, USA, 2017.
Figure 1. (a) Grain size distribution curves of all soil mixtures; (b) liquid limit (LL), plastic limit (PL), and plasticity index (PI) of all soil mixtures.
Applsci 11 02973 g001
Figure 2. Relationship between soil strength parameters (internal friction angle and cohesion) and clay fraction content.
Applsci 11 02973 g002
Figure 3. A schematic view of the tests set up for load-bearing tests.
Applsci 11 02973 g003
Figure 4. Reinforcement layout configurations; (ac) for experimental and numerical investigations and (df) for numerical investigation.
Applsci 11 02973 g004
Figure 5. Finite-element model for load-bearing tests.
Applsci 11 02973 g005
Figure 6. Relationship between the bearing stress and settlement ration (S/B) of different unreinforced soils.
Applsci 11 02973 g006
Figure 7. Relationship between bearing capacity and plasticity index (PI) of tested soils.
Applsci 11 02973 g007
Figure 8. Relationship between bearing stress and S/B ratio with various parameters of (a) U/B; (b) W/B; (c) H/B; and (d) N.
Applsci 11 02973 g008
Figure 9. Relationship between bearing stress and S/B ratio with various parameters of (a) U/B; (b) W/B; (c) H/B; and (d) N.
Applsci 11 02973 g009
Figure 10. Measured and simulated bearing stress results of strip footing resting on different soils reinforced with single horizontal planar geotextile layer with U/B = 0.3 and W/B = 3.0.
Applsci 11 02973 g010
Figure 11. Relationship between the soil-reinforcement interface and plasticity index (PI).
Applsci 11 02973 g011
Figure 12. Simulated bearing stress results of strip footing resting on different soils reinforced with different reinforcing techniques.
Applsci 11 02973 g012aApplsci 11 02973 g012b
Figure 13. Relationship between bearing improvement factor and number of reinforcement layer of soils reinforced with different Reinforcement layout configurations (series C, D, E and F).
Applsci 11 02973 g013
Figure 14. Simulated results of total displacement vectors of: (a) unreinforced B0 Soil; (b) B0 reinforced by series C; and, (c) B0 reinforced by series D for N = 4 at the S/B ratio of 15%.
Applsci 11 02973 g014
Figure 15. Simulated results of total displacement vectors of: (a) unreinforced B20; (b) B20 reinforced by series C; (c) B20 reinforced by series D; (d) B20 reinforced by series E; and (e) B20 reinforced by series F for N = 4 at the S/B ratio of 15%.
Applsci 11 02973 g015
Figure 16. Simulated results of total displacement vectors of: (a) unreinforced B100; (b) B100 reinforced by series C; (c) B100 reinforced by series D; (d) B100 reinforced by series E; and (e) B100 reinforced by series F for N = 4 at the S/B ratio of 15%.
Applsci 11 02973 g016
Figure 17. Simulated results of stress distribution (sig-yy) of: (a) unreinforced B0 Soil; (b) B0 reinforced by series C; and (c) B0 reinforced by series-D for N = 4 at the S/B ratio of 15%.
Applsci 11 02973 g017
Figure 18. Simulated results of stress distribution (sig-yy) of: (a) unreinforced B20; (b) B20 reinforced by series C; (c) B20 reinforced by series D; (d) B20 reinforced by series E; and (e) B20 reinforced by series-F for N = 4 at the S/B ratio of 15%.
Applsci 11 02973 g018
Figure 19. Simulated results of stress distribution (sig-yy) of: (a) unreinforced B100; (b) B100 reinforced by series C; (c) B100 reinforced by series D; (d) B100 reinforced by series E; and (e) B100 reinforced by series-F for N = 4 at the S/B ratio of 15%.
Applsci 11 02973 g019
Table 1. Physical and engineering properties of soils.
Soil MixturesTotal Unit Weight (kN/m3)Dry Unit Weight (kN/m3)Optimum Water Content (%)Liquid Limit LL (%)Plastic Limit PL (%)Plasticity Index (PI) (%)Internal Friction Angle (Degree)Cohesion (kPa)
B017.6617.143.0---402.8
B2018.6916.8710.8491930307
B4017.4015.0116.0138201181221
B6016.1713.3221.420726181923
B8015.8112.6525.029028262525
B10014.1710.9929.034733314033
Table 2. Details of experimental and numerical programs.
Investigation CasesReinforcement Layout ConfigurationsTest SeriesSoil GroundFilled SoilReinforcement Layout ConfigurationsTest Series
Experimental and numerical investigationsUnreinforced soilAB0, B20, B40, B60, B80, B100---
Horizontal planar reinforced soilsB-1B0-N = 1, W/B = 6U/B = 0.1, 0.3, 0.5, 1 and 2
B-2-N = 1, U/B = 0.3W/B = 2, 3, 4, 5 and 6
B-3-N = 2, U/B = 0.3, W/B = 3H/B = 0.1, 0.25, 0.5, 0.7
B-4-U/B = 0.3, W/B = 3, H/B = 0.5N = 1, 2, 3 and 4
Horizontal planar reinforced soilsC-1B0-U/B = 0.3, W/B = 3, N = 1, 2, 3 and 4Rinter= 0 to 1.0
C-2B20
C-3B40
C-4B60
C-5B80
C-6B100
Numerical investigationsFull wraparound ends of geotextile D-1B0B0U/B = 0.3, W/B = 3, H/B = 0.5N = 2, 3 and 4
D-2B20B20
D-3B40B40
D-4B60B60
D-5B80B80
D-6B100B100
Full wraparound ends of geotextile with filled-in sandE-1B20B0U/B = 0.3, W/B = 3, H/B = 0.5N = 2, 3 and 4
E-2B40
E-3B60
E-4B80
E-5B100
Full wraparound ends of geotextile reinforcement with filled-in sand and sand backfillF-1B20B0U/B = 0.3, W/B = 3, H/B = 0.5N = 2, 3 and 4
F-2B40
F-3B60
F-4B80
F-5B100
Table 3. The soil parameters used in numerical analysis.
Soil MixturesE (kN/m2)υϕ (Degree)c (kPa)ψ (Degree)Rinter
B020,0000.3402100.66
B2017,0000.330900.59
B4015,0000.35121800.54
B6013,0000.492000.48
B8080000.452500.45
B10050000.403300.42
Publisher’s Note: MDPI stays neutral with regard to jurisdictional claims in published maps and institutional affiliations.

