Featured Application
Authors are encouraged to provide a concise description of the specific application or a potential application of the work. This section is not mandatory.
Abstract
Statins are widely used as an effective therapy for ischemic vascular disorders and employed for primary and secondary prevention in cardiac and cerebrovascular diseases. Their hemostatic mechanism has also been shown to induce changes in cerebral blood flow that may result in neurocognitive improvement in subjects with Major Depressive Disorder. Behavioral data, various blood tests, and resting-state brain perfusion data were obtained at the start of this study and three months post-therapy from a small cohort of participants diagnosed with Major Depressive Disorder. Subjects received either rosuvastatin (10 mg) or placebo with their standard selective serotonin reuptake inhibitors therapy. At the end of the study, patients using rosuvastatin reported more positive mood changes than placebo users. However, standard statistical tests revealed no significant differences in any non-behavioral variables before and after the study. In contrast, feature selection techniques allowed identifying a small set of variables that may be affected by statin use and contribute to mood improvement. Classification models built to assess the distinguishability between the two groups showed an accuracy higher than 85% using only five selected features: two peripheral platelet activation markers, perfusion abnormality in the left inferior temporal gyrus, Attention Switching Task Reaction latency, and serum phosphorus levels. Thus, using machine learning tools, we could identify factors that may be causing self-reported mood improvement in patients due to statin use, possibly suggesting a regulatory role of statins in the pathogenesis of clinical depression.
1. Introduction
Statins are a group of medications that help reduce cholesterol production in the liver by inhibiting the hydroxy-3 methyl-glutaryl-coenzyme A (HMG-CoA) reductase protein. As a result of their role in regulating cholesterol synthesis and cellular cholesterol homeostasis, they are widely employed as medications for dyslipidemia and cardiovascular diseases. Statins are also being explored as a secondary treatment for stroke [1,2,3]; they have shown to enhance regional cerebral blood flow (rCBF) [4] and to have anti-inflammatory properties [5]. Major depressive disorder (MDD) has been shown to present impairments in rCBF where recovery reflects an increase in some brain regions and a diminution in others [6,7,8,9,10]. Furthermore, vascular diseases appear to influence symptoms and progression in MDD [11]. There is also evidence suggesting the involvement of inflammation in depressive disorders [12]. Consequently, statins are also being studied as a potential treatment for MDD [13].
According to the World Health Organization (WHO), depressive disorders affect over 300 million people, making up 4.4% of the world’s population, with the numbers increasing every year. Moreover, it often occurs as a comorbidity in other illnesses such as diabetes, cardiovascular disease, and stroke [14]. Effective treatments currently include psychological therapies or anti-depressant medication (tricyclic anti-depressants, selective serotonin reuptake inhibitors (SSRIs), and norepinephrine reuptake inhibitors). SSRIs exert their anti-depressant effect by regulating several molecular and signaling pathways in astrocytes [15]. Anti-depressants, while effective, can show possible adverse effects. Moreover, it is common for 50 to 60% of the patients receiving them to be treatment-resistant [16,17,18]. Hence, new biomarkers [19,20,21,22,23], including neuroimaging, as well as new pharmacological interventions [24], such as statins [25,26], are being tested.
While there is evidence that simvastatin, used as a hypolipemiant, slightly increases negative mood in non-depressed individuals [27,28], it was also shown to alleviate depression symptoms after 12 weeks in treatment-resistant MDD patients when administered along with their usual treatment [13]. Notably, a systematic review and meta-analysis evaluated ten studies to conclude that statins had no significant effect on mood in non-depressed subjects while improving depressive symptoms in clinically depressed individuals [29]. Another meta-analysis evaluating three large studies suggested that adding statins to ongoing treatment could improve depressive symptoms [30]. Statins used as hypolipemiant in primary and secondary prevention have demonstrated some controversial results in patients with depression or anxiety [31,32,33]. Recent experimental animal results demonstrate the involvement of agmatine and imidazoline receptors in the antidepressant-like effect of statins, suggesting a potential target for MDD therapy [34]. Furthermore, diverse new approaches for MDD mechanisms and therapy are being developed [35]. Yet, more studies are needed to solidify the role of statins in elevating mood in subjects with MDD, especially focusing on the underlying mechanism of their mood-improving effect.
In this study, we not only attempt testing rosuvastatin’s effect, a statin medication, on the mood of patients with MDD, but also studying the medication’s action on rCBF and its effect on cognitive performance, platelet activation, and endothelial dysfunction as well as on inflammatory and oxidative stress. To this aim, resting-state perfusion levels for various brain regions, several blood tests, and circulating biomarkers were obtained for a limited number of subjects, leading to a dataset with 160 variables. Such datasets, i.e., high-dimension low-sample size (HDLSS), are very common in clinical settings [36], [37] and are known to present several statistical challenges [38,39,40,41]. Machine learning (ML) techniques offer several tools to handle these challenges and have been used extensively for high-dimensionality problems [42,43,44,45,46,47]. When the sample size is small, feature selection is a crucial data preprocessing step that allows choosing the variables that contribute the most to the target effect while minimizing possible redundancies. Moreover, it enables improving the accuracy of ML classifiers [48].
In this study, we apply feature selection techniques followed by ML classifiers and identify variables that may be affected by rosuvastatin usage and might be able to explain its effect on mood.
2. Materials and Methods
2.1. Participants
Thirty-six patients diagnosed with MDD (through a structured interview by a psychiatrist using DSM IV criteria and a score ≥ 14 on the 17-item Hamilton Depression Rating Scale (HAM-D)) were recruited for the study. One female participant was excluded due to pregnancy during the follow-up. Three participants did not begin therapy due to subclinical hypothyroidism and were sent to endocrinology; 11 additional participants did not complete the treatment and/or did not appear for a follow-up at the end of the study after three months. Thus, the final subject cohort had 21 participants (59% females; median age 34 years). Participants were assigned to two experimental groups: one received 10 mg of rosuvastatin (n = 11), and the other received placebo (n = 10). The assignment was done using the block randomization method to enforce a balance in each therapeutic group’s number of patients. All subjects simultaneously received standard SSRI therapy throughout the study and were free of any other specific anti-depressant therapy. Participants were not substance abusers and did not present any other psychiatric comorbidities, which was determined by a psychiatrist through a structured interview using DSM IV criteria. A summary of the characteristics of the participants is presented in Table 1.

Table 1.
Characteristics of the participants.
2.2. Experimental Procedure
Prior to any test or intervention and before being evaluated for the study’s inclusion criteria, all participants signed a written informed consent approved by the University of Chile Clinical Hospital Scientific Ethical Committee (Acta 019/2016). Data were collected at the beginning of the study and then again at the end of the study (see Figure 1).
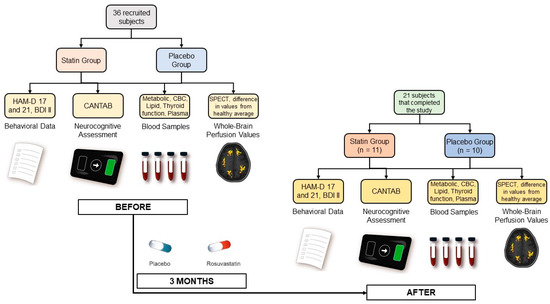
Figure 1.
Experimental procedure for data collection.
Participants provided behavioral and mood information through 3 clinical questionnaires: the HAM-D Scale [49] with 17 and 21 items, administered by a psychiatrist, and the self-reported Beck Depression Inventory-II (BDI-II) [50]. Additionally, neurocognitive parameters, including working memory, attention, information processing, reaction time, social and emotion recognition, and decision-making, were evaluated for all subjects using the commercial Cambridge Neuropsychological Test Automated Battery (CANTAB).
Blood samples were also collected from all subjects for a metabolic panel, a complete blood count (CBC), erythrocyte sedimentation rate (ESR), lipid profiles, thyroid function test, and activation of hemostasis and inflammation plasma markers. This included assessing platelet activation by measuring plasma levels of soluble CD40 ligand (sCD40L), Regulated upon Activation, Normal T Cell Expressed and Presumably Secreted (RANTES), Neutrophil-Activating Peptide-2 (NAP-2), and P-Selectin using commercial reagents and standards and the Enzyme-Linked Immunosorbent Assay (ELISA) kit. Levels of circulating endothelial cells (CECs) and soluble plasma markers were measured for evaluating endothelial dysfunction. CECs were isolated from peripheral blood using immunomagnetic beads coated with anti-CD146, stained for CD45 and Ulex Europaeus lectin, and counted under fluorescence microscopy. Plasma levels for soluble Intercellular Cell Adhesion Molecule (sICAM), Vascular Cell Adhesion Molecule (VCAM), Monocyte Chemoattractant Protein 1 (MCP-1), Vascular Endothelial Growth Factor (VEGF), and free Brain-Derived Neurotrophic Factor (BDNF) were also measured by using commercial reagents and the ELISA kit. Interleukin-6 (IL-6), Tumor Necrosis Factor alfa (TNFα), and high sensitivity C Reactive Protein (hsCRP) were also measured by ELISA. Rho-kinase activity was assessed by the levels of phosphorylated-to-total myosin light chain phosphatase 1 (MYPT1-P/T) in circulating leukocytes. Plasma Malondialdehyde (MDA) levels for oxidative stress were also quantified [51].
Finally, resting-state perfusion values for all brain regions using Single Photon Emission Tomography (SPECT) with 99mTc-ethylcysteinate dimer (99mTc-ECD) were also obtained. ‘Abnormal’ perfusion values were calculated for all brain regions using the Neurostat iSSP3.5 program provided online by Dr. Satoshi Minoshima (https://neurostat.neuro.utah.edu/, accessed on 7 May 2019). These particular values represented the difference between the individual perfusion for participants and the control average provided by the software obtained from a group of healthy adults matched for age with values outside ±2 standard deviation flagged as ‘abnormal’.
2.3. Statistical Analyses
The extensive data collection procedure resulted in 160 variables obtained at the start of the study and after three months for a total of 21 subjects. Out of these, three variables (both HAM-D scales and BDI-II) that represent mood were evaluated separately to test the hypothesis that statin use improves mood in individuals with MDD. Using GraphPad Prism Software (Version 8.0, La Jolla, California, US), the normality of the data was confirmed using the Kolmogorov–Smirnov test (placebo group p > 0.1, statin group p > 0.1). A Sidak’s multiple comparison’s test (α = 0.05) was performed as reported in the Results section.
To consider the variance in the population at the start of the study, the statistical differences between the two groups were evaluated for delta (∆) variables calculated by subtracting each variable’s initial values from their values at three months. The percentage of missing data was calculated and variables with more than 30% missing data were rejected from the analysis since data imputation for larger amounts of missingness may become very imprecise [52]. Using MATLAB version 2019b (The MathWorks, Inc., Natick, MA, USA), missing data for the remaining variables were imputed by the k-nearest neighbors technique using k = 3 [53]. Each ∆ variable was normalized with respect to its absolute maximum value. The high number of ∆ variables for a small number of subjects presented a challenge in detecting, with sufficient power, the variables that might be participating in a perfusion-related mechanism for mood improvement due to statin use. To handle this, machine learning techniques were applied as described in the following sections and depicted in Figure 2.
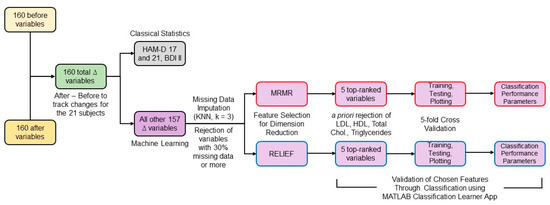
Figure 2.
Block diagram of the data analysis workflow.
2.4. Feature Selection
Considering HDLSS data, reducing the number of features is crucial to perform non-overparameterized classification-based analyses [54]. Feature selection techniques can be classified into filter, wrapper, and embedded methods [53]. Filter methods can be combined with any machine learning model and are much faster and less prone to overfitting than wrapper and embedded methods [55]. However, no feature selection method outperforms all the others for all tasks [56]. Two widely used filter methods [57], minimum redundancy maximum relevance (mRMR) and ReliefF, were chosen and combined with different classification methods to assess the selected features’ predictive performance. mRMR ranked all the ∆ features by calculating redundancy between features and relevance between features and the response vector, composed of zeros for the rosuvastatin group and ones for the placebo group [58]. ReliefF algorithm uses nearest neighbors’ concept to derive feature statistics that indirectly account for interactions [56,59]. Considering the low total n of the dataset, a low value of nearest neighbors (k = 3) was selected [60]. MathWorks MATLAB version 2019b implementation of both algorithms was used.
Out of the features selected by both techniques, we rejected variables such as low-density lipoprotein (LDL), high-density lipoprotein (HDL), total cholesterol, and triglycerides that were expected to change due to rosuvastatin’s direct action. Considering that the data were for only 21 subjects and the classification model may overfit when using a high number of features, we selected the top 5 ranked features by both algorithms.
2.5. ML Classification
The selected features’ relevance was assessed by training classifiers to test whether they provided a distinction between the rosuvastatin and the placebo group. Since specific knowledge about which ML classifier would perform better on the data at hand is lacking, we used the Classification Learner application in the Statistics and Machine Learning Toolbox of the MATLAB software to train 25 different classifiers for each set of features. These classifiers belong to seven different categories:
- Decision trees;
- Discriminant analysis;
- Logistic regression;
- Naïve Bayes;
- Support vector machines (SVM);
- K-nearest neighbors (KNN);
- Ensemble methods.
A description of each method can be found in the literature [61,62].
Given the small size of the sample, deep learning algorithms were not tested, since they require relatively large datasets to work well [63,64]. It should also be noted that the two groups (placebo and rosuvastatin) have almost the same number of patients, which avoids data imbalance issues when training ML classifiers that are very common in clinical settings [65].
For all training sessions, we used k-fold cross-validation with k = 5. We trained these 25 classifiers for 20 iterations to report a more reliable accuracy value, since each cross-validation may have very different training and testing sets created for classification [66]. The training of 25 classifiers through 20 iterations was done twice separately for the five features selected by each algorithm. The best classification performances as an average for the 20 iterations are reported in the Results section. We also obtained confusion matrices (using the number of true positives (TP), false positives (FP), true negatives (TN), and false negatives (FN)) and area under curve (AUC) values for the receiver operating characteristic (ROC) curve. The format of the confusion matrix can be seen in Figure 3. To add a more detailed understanding of the classifier’s performance, values for sensitivity, specificity, precision, false omission rates (FOR), and the Matthews correlation coefficient (MCC) were also calculated. We report the confusion matrix and the ROC curves for the iteration with the closest accuracy value to the average value in the Results section. The formulas used for calculating these performance indices are shown in Table 2.
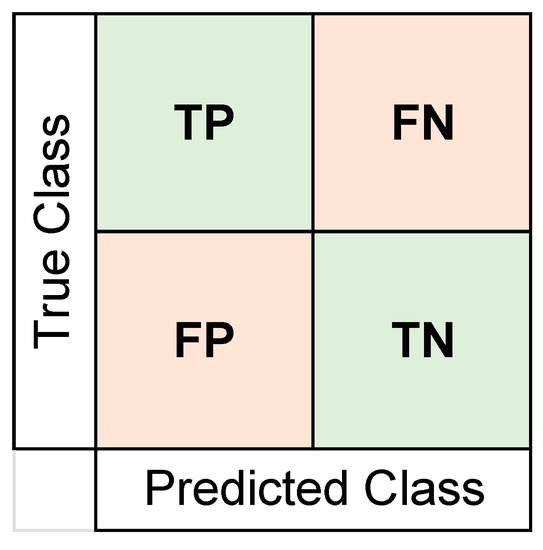
Figure 3.
Format of the confusion matrix format used to report results. Number of true positives (TP), true negatives (TN), false positives (FP), and false negatives (FN) were represented and used to calculate other performance metrics. The placebo group was arbitrarily taken as the “positive” class.
Table 2.
Formulas for the classification performance indices.
3. Results
No serious adverse effects were observed in participants with rosuvastatin use. A Sidak’s multiple comparisons test (Table 3) revealed significant differences between HAM-D ratings collected at the start of the study and after three months for both groups. On the other hand, the difference between BDI-II ratings at the beginning and the end of the study were only significant for the statin group. The BDI-II ratings for the statin group significantly decreased compared to their initial values (p < 0.0001), suggesting improvement in perceived mood due to stain use. No significant difference in BDI-II ratings before and after placebo administration was observed.
Table 3.
Statistical differences in mood before and after the study.
The variable with the highest percentage of missing data was the ∆ of urea levels in the blood with 28.6%, while 4.8% of the data was missing for ∆ variables with information of levels of lactate dehydrogenase, alkaline phosphatase, total bilirubin, total protein, albumin, blood urea nitrogen (BUN), uric acid, calcium, and phosphorous in the blood, and from ∆ variables of MDA, IL-6, TNFα, and Rho-kinase activity factors from hemostasis data. Meanwhile, 9.5% of data was missing from levels of glycemia and 4 CANTAB variables, all from the spatial span (longest sequence recalled by subject) or spatial working memory tasks. The rest of the CANTAB variables had 4.8% of data missing. All perfusion data, absolute and “abnormal”, had no missing data.
Multiple comparison tests revealed no significant differences in any non-behavioral variables before and after the study in either group. In contrast, feature selection techniques ranked several notable non-behavioral variables as the ones that changed most differently after three months due to statin use compared to placebo. The five features selected by the mRMR and ReliefF algorithms are shown in Table 4.
Table 4.
Five most distinct placebo vs. rosuvastatin non-behavioral features selected by the two feature selection techniques.
According to the mRMR algorithm, the top five features that contributed to the distinction of the two groups included perfusion abnormality in left middle temporal gyrus, perfusion abnormality in the left temporal pole, perfusion abnormality in the right Brodmann Area (BA) 6 located in the frontal lobe, perfusion abnormality in right BA 23 located in the medial region of the posterior cingulate gyrus, and plasmatic levels of thyroid-stimulating hormone (TSH).
On the other hand, the features chosen by the ReliefF algorithm included levels of sCD40L and NAP-2 (both peripheral platelet activation markers), perfusion abnormality in the left inferior temporal gyrus, ASTLCMD (a CANTAB variable that measures the median latency of response from stimulus appearance to button press in the system’s attention switching task), and serum phosphorus levels.
The highest average accuracy obtained by training classifiers over 20 iterations with the mRMR algorithm’s selected features was 78.33% with the coarse tree classifier. The confusion matrix and the ROC curve (AUC value = 0.75) for one of the 20 iterations of the coarse tree classifier is shown in Figure 4a,b, respectively. This iteration was the closest to the average in terms of its accuracy value of 76.19%. Additionally, the percentage values of sensitivity, specificity, precision, FOR, and MCC for this iteration are shown in Table 5.
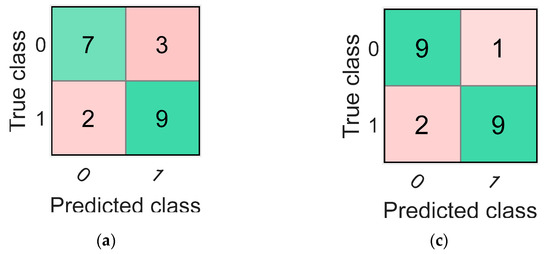
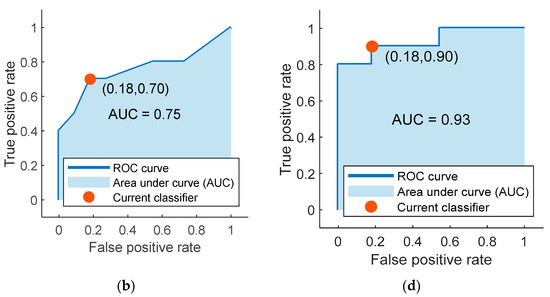
Figure 4.
The confusion matrices and the receiver operating characteristic (ROC) curves for the best classifiers trained separately using the best five features identified using mRMR (a,b) and ReliefF (c,d). Class “0” is the placebo group, arbitrarily taken as the “positive” group, and class “1” is the rosuvastatin group, taken as the “negative” group.
Table 5.
Performances of classifiers built with features selected through both techniques.
Finally, the highest accuracy obtained by training the 25 different classifiers over 20 iterations with the features selected by the ReliefF algorithm was 86.67%. The classifier that reported this accuracy was the weighted KNN classifier. The iteration for the weighted KNN classifier closest to the average value had an accuracy of 85.71%, and its confusion matrix with the ROC curve (AUC value = 0.93) are shown in Figure 4c,d, respectively. Values for other parameters evaluating classification performance including sensitivity, specificity, precision, FOR, and MCC for this particular iteration are also reported in Table 5.
4. Discussion
4.1. Related Work
Rosuvastatin is a widely employed statin in clinical practice with particularly strong inhibitory effects on hepatic cholesterol synthesis. Its effects are comparable to other statins in reducing cholesterol levels and diminishing atherothrombotic events [67,68]. Of all statin drugs employed in the current practice, rosuvastatin and fluvastatin are more hydrophilic than other statins such as atorvastatin, lovastatin, and simvastatin, which are lipophilic. It is yet not clear whether hydrophilic or lipophilic statins could have a greater effect on depression based on their ability to cross the blood-brain barrier easily or not, respectively [69]. However, recent work demonstrated no difference in the risk of depression when comparing hydrophilic and lipophilic statin compounds [70], suggesting that the actions could be at peripheral levels, independent of their brain affinity.
In general, statins present diverse immunomodulating anti-inflammatory effects in animal models. These effects could be relevant not only at the cardiometabolic level but also at the central nervous system and the immune system levels. Various neurobiological effects on factors including glucocorticoids, serotonin, glutamatergic N-methyl-D-aspartate (NMDA) receptors, BDNF, and dopamine receptors have been reported due to statin use, which may be related to the response in MDD patients with statin use [69]. Different studies using lovastatin, simvastatin, and atorvastatin compared to placebo have safely demonstrated their positive effects on depressive symptoms [71,72,73]. A recent multicenter study in younger depressive adults (15–25 years) under SSRIs therapy reported that rosuvastatin was more effective than aspirin in improving secondary outcomes on the Montgomery–Åsberg Depression Rating Scale at week 12 [74,75]. Still, systematic reviews necessitate improvement of the evidence with larger randomized trials [69].
In the already mentioned studies, attempts at understanding whether statins can help improve mood were mainly undertaken. In this work, we not only evaluate mood changes, but also test to see if rosuvastatin caused any additional changes in rCBF, peripheral endothelial dysfunction, or inflammation to have a better approach to the underlying pathophysiological mechanisms involved in MDD.
4.2. Mood Improvement
Our results support the hypothesis that rosuvastatin administration will help improve mood in patients diagnosed with Major Depressive Disorder (MDD) compared to placebo. According to both HAM-D scales, baseline mood improved significantly after three months for both placebo and rosuvastatin groups. It is important to say that since there was a comparable improvement in mood in both groups, and considering the small n of the study, no significant differences were found in HAM-D scores after the study between the two groups. The average HAM-D scores for the rosuvastatin group were observed to be improved more than the placebo group after three months of administration.
On the other hand, significant differences in BDI-II scores before and after the study were only found in the rosuvastatin group. The global mood improvement may be explained by the fact that subjects were being treated simultaneously with SSRIs on standard doses. Then again, the differences in results for the BDI-II scores may be due to rosuvastatin action. Here, it is worth noting that while HAM-D questionnaires are handled by professionals, BDI-II is a self-reported questionnaire. The differences in the BDI-II scores between placebo and rosuvastatin groups mean that the subjects’ own perception of mood was different between groups especially considering that all participants were blinded to the kind of extra medication they received. It can be argued that the significant improvement in the self-reported BDI-II scores of participants in the rosuvastatin group may be pointing at its effect of improving an individual’s own perceived mood. This effect failed to manifest in our cohort of placebo-administered subjects. These results support previous works that demonstrate statins’ ability to improve mood in depressed cohorts.
4.3. Feature Selection
For the second part of the study, we took an exploratory approach to identify what factors may be contributing to rosuvastatin’s action of mood improvement. As previously mentioned, statins have been shown to bring changes in inflammatory responses and in rCBF. To further test the involvement of these factors narrowed down to their components becomes especially important. As a result, we compiled a large amount of information pertaining to these changes. We collected resting-state perfusion data from 45 distinct brain regions, including major gyri in the four major gyri as well as 32 different Brodmann Areas (BA) known to be affected in MDD. In parallel, we performed extensive blood tests to evaluate several circulating markers of inflammation and hemostasis in addition to other standard blood tests. We also tested the subjects’ cognitive abilities before and after the study. Using the CANTAB test, we could curate scores representing a wide range of cognitive abilities such as attention, emotional processing, planning, visual processing, verbal memory, and spatial working memory. Using proven tools to handle a large number of variables for a relatively small study cohort, we identified ten unique variables (Table 4) that contributed the most to the differences between both groups.
Initially, both the mRMR and ReliefF techniques identified LDL cholesterol levels in the blood as the most distinct feature between groups. The ReliefF algorithm also identified total cholesterol level as the fourth most distinct feature. This can be expected due to rosuvastatin’s target application. Statins are prescribed not only due to their action on hyperlipemia and cholesterol production but also due to their role in diminishing cardiovascular events and stroke. As mentioned in the Results section, due to the expected action of stain use, these factors were excluded a priori, and the best five features were selected after this exclusion. Thus, the most distinct features between groups correspond to rCBF abnormalities in the left temporal lobe, and right BA 6 and right BA 23. Along with perfusion abnormalities in these regions, we found distinct changes between groups in levels of phosphorous and thyroid-stimulating hormone (THS), as well as circulating inflammatory markers such as NAP-2 and sCD40L. Notably, the median latency of response (from stimulus appearance to button press) on congruent trials measured through the CANTAB environment’s attention switching task was also found to be distinct between groups.
Feature selection tools provide information about the differences between groups, but they do not indicate the direction of these differences. Our analyses observed that there were no significant statistical differences between groups in any of the ∆ variables. Even so, it is relevant to consider the average ∆ values for both groups to understand the “direction” of the change occurring in these features for both groups. The perfusion “abnormality” in the left temporal pole decreased in the rosuvastatin group but increased in the placebo group. On the other hand, perfusion abnormalities increased in both the left middle and inferior temporal gyri as well as BA 6 in the rosuvastatin group, while it decreased in the placebo group. Additionally, perfusion abnormality in BA 23 increased in both groups but more in the placebo group. In one of our previous studies published recently, a significant association between endothelial dysfunction markers and changes in rCBF was observed in another group of MDD patients not taking any specific medication [76]. This suggests that the systematic damage or activation of the endothelium may be contributing to the observed perfusion abnormality.
Interestingly, TSH levels in the blood decreased in the rosuvastatin group, while they increased in the placebo group. The same was observed for phosphorous levels in the blood. The significance of this non-metal element in the pathophysiology of MDD is not yet clear. However, it may be related to the calcium-phosphorus homeostasis and Vitamin D metabolism involved in abnormal parathyroid function observed in mood disorders [77,78]. Moreover, levels of sCD40L decreased for the rosuvastatin group and increased for the placebo group. On the other hand, levels of NAP-2 decreased for both groups, with a larger decrease in the rosuvastatin group. Finally, the response latency during an attention switching task measured by the CANTAB software increased after rosuvastatin intake. On the other hand, the same metric in the placebo cohort decreased.
4.4. ML Classification
The classifiers trained using the best five features selected by each feature selection technique provided high accuracy values (78.33% and 85.71%). A higher accuracy of the classifier means a higher distinguishability between groups for the features used. Different classifier types trained with these features had high accuracy values. This may be pointing at these features’ possible roles in the mechanism of rosuvastatin’s observed effect on mood. The accuracy value may not always be a complete indicator of the classifier’s performance. Hence, we also calculated other parameters for the classifiers. For classifiers using both feature groups, we obtained high values of sensitivity, specificity, and precision, as can be seen in Table 5. On the other hand, FOR values are ideally as low as possible. Both our classifiers obtained sufficiently low FOR values (25% and 10%). Finally, MCC values are between −1 and 1, with 1 representing perfect classification, 0 representing randomness, and −1 representing complement disagreement between observations and predictions. MCC values are computed to represent a balance between TP, TN, FP, and FN values to ensure the classifier is not biased toward only one of the classes. Our classifiers obtained decent values of +0.52 and +0.72, further consolidating the respectable performance of our classifiers.
5. Conclusions
The present study shows that rosuvastatin may be contributing to the mood improvement in depressed participants, especially enhancing their own mood perception. Due to the low power of the dataset, classical statistics were not successful in discerning the subtle changes brought on by rosuvastatin. This was especially true for its effect on cholesterol levels; no significant statistical differences in LDL or total cholesterol levels were observed between the rosuvastatin and placebo groups despite rosuvastatin being widely used as a cholesterol-reducing medication. In contrast, differences in LDL cholesterol levels between groups were very clearly captured by the ML-based feature selection methods. The role of rosuvastatin on certain brain perfusion changes, in diminishing platelet activation, and changes in neurocognitive parameters was also identified by the combination of feature selection techniques and ML classifiers. These results demonstrate the efficacy of ML tools, especially for clinical HDLSS datasets.
A larger sample size may result in a higher power and possible significant statistical differences, presenting a clearer picture of the underlying mechanism for rosuvastatin’s positive effect on mood. Hence, larger studies are needed to establish these results further. Meanwhile, for studies with limited subject recruitment, ML is a powerful tool that aids in discovering subtle but crucial experimental effects. This makes the data analysis workflow proposed here a convenient set of techniques that can prove indispensable in shedding light on new clinical discoveries.
Author Contributions
Conceptualization, I.T., T.M., J.P., L.R., C.G.S. and M.R.-F.; Methodology, I.T., T.M., J.P., J.C.Q., L.R., C.G.S., S.C., J.S., N.O., G.V., G.C., D.V., C.V., B.R., D.M. and M.R.-F.; Software, I.T., J.C.Q., S.C., R.L. and M.R.-F.; Validation, T.M. and M.R.-F.; Formal Analysis, I.T., T.M., J.P., J.C.Q., C.G.S., S.C., J.S., D.V. and M.R.-F.; Investigation, T.M., J.P., J.C.Q., L.R., C.G.S., S.C., J.S., N.O., G.V., G.C., D.V., C.V., B.R. and D.M.; Resources, T.M. and M.R.-F.; Data Curation, T.M., J.C.Q. and C.G.S.; Writing—Original Draft Preparation, I.T., T.M. and M.R.-F.; Writing—Review and Editing, all authors; Visualization, T.M., J.C.Q., C.G.S. and D.V.; Supervision, T.M. and J.P.; Project Administration, T.M.; Funding Acquisition, T.M. and J.P. All authors have read and agreed to the published version of the manuscript.
Funding
This research was funded by the FONDECYT-REGULAR grant no. 1160885, 1181094, by the 2020 ANID doctoral scholarship grant no. 21201983, and by CONICYT PIA ACT 172121.
Institutional Review Board Statement
The study was conducted according to the guidelines of the Declaration of Helsinki and approved by the Ethics Committee of University of Chile Clinical Hospital (Acta 019/2016) on 4 May 2016.
Informed Consent Statement
Informed consent was obtained from all subjects involved in the study.
Acknowledgments
The authors acknowledge David Necuñir for the design of the graphical abstract (necuseban@gmail.com). I. Thakkar thanks Martín Irani for his feedback.
Conflicts of Interest
The authors declare no conflict of interest.
References
- Giannopoulos, S.; Katsanos, A.H.; Tsivgoulis, G.; Marshall, R.S. Statins and cerebral hemodynamics. J. Cereb. Blood Flow Metab. 2012, 32, 1973–1976. [Google Scholar] [CrossRef] [PubMed]
- Endres, M. Statins and stroke. J. Cereb. Blood Flow Metab. 2005, 25, 1093–1110. [Google Scholar] [CrossRef] [PubMed]
- Law, M.R.; Wald, N.J.; Rudnicka, A.R. Quantifying effects of statins on low density lipoprotein cholesterol, ischaemic heart disease, and stroke: Systematic review and meta-analysis. Vasc. Med. 2003, 8, 289–290. [Google Scholar] [CrossRef] [PubMed]
- Carod-Artal, F.J. Statins and cerebral vasomotor reactivity: Implications for a new therapy? Stroke 2006, 37, 2446–2448. [Google Scholar] [CrossRef] [PubMed]
- Devaraj, S.; Rogers, J.; Jialal, I. Statins and biomarkers of inflammation. Curr. Atheroscler. Rep. 2007, 9, 33–41. [Google Scholar] [CrossRef]
- Kanaya, T.; Yonekawa, M. Regional cerebral blood flow in depression. Jpn. J. Psychiatry Neurol. 1990, 44, 571–576. [Google Scholar] [CrossRef] [PubMed]
- Wang, Y.; Zhang, H.; Tang, S.; Liu, X.; O’Neil, A.; Turner, A.; Chai, F.; Chen, F.; Berk, M. Assessing Regional Cerebral Blood Flow in Depression Using 320-Slice Computed Tomography. PLoS ONE 2014, 9, e107735. [Google Scholar] [CrossRef] [PubMed]
- Bench, C.J.; Frackowiak, R.S.; Dolan, R.J. Changes in regional cerebral blood flow on recovery from depression. Psychol. Med. 1995, 25, 247–261. [Google Scholar] [CrossRef] [PubMed]
- Zhang, K.; Zhu, Y.; Zhu, Y.; Wu, S.; Liu, H.; Zhang, W.; Xu, C.; Zhang, H.; Hayashi, T.; Tian, M. Molecular, functional, and structural imaging of major depressive disorder. Neurosci. Bull. 2016, 32, 273–285. [Google Scholar] [CrossRef]
- Li, J.; Yang, Y.; Zhu, Y.; Zhou, L.; Han, Y.; Yin, T.; Cheng, Z.; Zhang, G.; Shen, Y.; Chen, J. Towards characterizing the regional cerebral perfusion in evaluating the severity of major depression disorder with SPECT/CT. BMC Psychiatry 2018, 18, 1–8. [Google Scholar] [CrossRef] [PubMed]
- Taylor, W.D.; Aizenstein, H.J.; Alexopoulos, G.S. The vascular depression hypothesis: Mechanisms linking vascular disease with depression. Mol. Psychiatry 2013, 18, 963–974. [Google Scholar] [CrossRef] [PubMed]
- Miller, A.H.; Raison, C.L. The role of inflammation in depression: From evolutionary imperative to modern treatment target. Nat. Rev. Immunol. 2016, 16, 22–34. [Google Scholar] [CrossRef] [PubMed]
- Husain, M.I.; Chaudhry, I.B.; Khoso, A.B.; Husain, M.O.; Rahman, R.R.; Hamirani, M.M.; Hodsoll, J.; Carvalho, A.F.; Husain, N.; Young, A.H. Adjunctive simvastatin for treatment-resistant depression: Study protocol of a 12-week randomised controlled trial. BJPsych Open 2019, 5, 1–7. [Google Scholar] [CrossRef] [PubMed]
- Kang, H.J.; Kim, S.Y.; Bae, K.Y.; Kim, S.W.; Shin, I.S.; Yoon, J.S.; Kim, J.M. Comorbidity of Depression with Physical Disorders: Research and Clinical Implications. Chonnam Med. J. 2015, 51, 8. [Google Scholar] [CrossRef]
- Chen, B.; Zhang, M.; Ji, M.; Gong, W.; Chen, B.; Zorec, R.; Stenovec, M.; Verkhratsky, A.; Li, B. The Association Between Antidepressant Effect of SSRIs and Astrocytes: Conceptual Overview and Meta-analysis of the Literature. Neurochem. Res. 2021, 1–15. [Google Scholar] [CrossRef]
- Fava, M. Diagnosis and definition of treatment-resistant depression. Biol. Psychiatry 2003, 53, 649–659. [Google Scholar] [CrossRef]
- Dodd, S.; Bauer, M.; Carvalho, A.F.; Eyre, H.; Fava, M.; Kasper, S.; Kennedy, S.H.; Khoo, J.P.; Lopez Jaramillo, C.; Malhi, G.S.; et al. A clinical approach to treatment resistance in depressed patients: What to do when the usual treatments don’t work well enough? World J. Biol. Psychiatry 2020, 1–20. [Google Scholar] [CrossRef] [PubMed]
- Kaur, M.; Sanches, M. Experimental Therapeutics in Treatment-Resistant Major Depressive Disorder. J. Exp. Pharmacol. 2021, 13, 181. [Google Scholar] [CrossRef] [PubMed]
- Kennis, M.; Gerritsen, L.; van Dalen, M.; Williams, A.; Cuijpers, P.; Bockting, C. Prospective biomarkers of major depressive disorder: A systematic review and meta-analysis. Mol. Psychiatry 2020, 25, 321–338. [Google Scholar] [CrossRef]
- Carboni, L.; McCarthy, D.J.; Delafont, B.; Filosi, M.; Ivanchenko, E.; Ratti, E.; Learned, S.M.; Alexander, R.; Domenici, E. Biomarkers for response in major depression: Comparing paroxetine and venlafaxine from two randomised placebo-controlled clinical studies. Transl. Psychiatry 2019, 9, 1–12. [Google Scholar] [CrossRef]
- Woods, A.G.; Wormwood, K.L.; Iosifescu, D.V.; Murrough, J.; Darie, C.C. Protein Biomarkers in Major Depressive Disorder: An Update. Adv. Exp. Med. Biol. 2019, 1140, 585–600. [Google Scholar]
- Malik, S.; Singh, R.; Arora, G.; Dangol, A.; Goyal, S. Biomarkers of Major Depressive Disorder: Knowing is Half the Battle. Clin. Psychopharmacol. Neurosci. 2021, 19, 12. [Google Scholar] [CrossRef]
- Kang, S.-G.; Cho, S.-E. Neuroimaging Biomarkers for Predicting Treatment Response and Recurrence of Major Depressive Disorder. Int. J. Mol. Sci. 2020, 21, 2148. [Google Scholar] [CrossRef] [PubMed]
- Nemeroff, C.B. The state of our understanding of the pathophysiology and optimal treatment of depression: Glass half full or half empty? Am. J. Psychiatry 2020, 177, 671–685. [Google Scholar] [CrossRef] [PubMed]
- Zuzarte, P.; Duong, A.; Figueira, M.L.; Costa-Vitali, A.; Scola, G. Current therapeutic approaches for targeting inflammation in depression and cardiovascular disease. Curr. Drug Metab. 2018, 19, 674–687. [Google Scholar] [CrossRef] [PubMed]
- Singh, D.; Lippmann, S. Can statins diminish depression? Prim. Care Companion CNS Disord. 2018, 20. [Google Scholar] [CrossRef] [PubMed]
- Hyyppä, M.T.; Kronholm, E.; Virtanen, A.; Leino, A.; Jula, A. Does simvastatin affect mood and steroid hormone levels in hypercholesterolemic men? A randomized double-blind trial. Psychoneuroendocrinology 2003, 28, 181–194. [Google Scholar] [CrossRef]
- Morales, K.; Wittink, M.; Datto, C.; DiFilippo, S.; Cary, M.; TenHave, T.; Katz, I.R. Simvastatin Causes Changes in Affective Processes in Elderly Volunteers. J. Am. Geriatr. Soc. 2006, 54, 70–76. [Google Scholar] [CrossRef] [PubMed]
- Yatham, M.S.; Yatham, K.S.; Ravindran, A.V.; Sullivan, F. Do statins have an effect on depressive symptoms? A systematic review and meta-analysis. J. Affect. Disord. 2019, 257, 55–63. [Google Scholar] [CrossRef]
- Salagre, E.; Fernandes, B.S.; Dodd, S.; Brownstein, D.J.; Berk, M. Statins for the treatment of depression: A meta-analysis of randomized, double-blind, placebo-controlled trials. J. Affect. Disord. 2016, 200, 235–242. [Google Scholar] [CrossRef]
- Molero, Y.; Cipriani, A.; Larsson, H.; Lichtenstein, P.; D’Onofrio, B.M.; Fazel, S. Associations between statin use and suicidality, depression, anxiety, and seizures: A Swedish total-population cohort study. Lancet Psychiatry 2020, 7, 982–990. [Google Scholar] [CrossRef]
- Ljung, R.; Köster, M.; Björkenstam, E.; Salmi, P. Associations between statin use and suicidality, depression, anxiety, and seizures. Lancet Psychiatry 2021, 8, e2. [Google Scholar] [CrossRef]
- Lee, M.C.; Peng, T.R.; Lee, C.H.; Wang, J.Y.; Lee, J.A.; Chen, S.M.; Shiang, J.C. Statin Use and Depression Risk: A Systematic Review and Meta-Analysis. J. Affect. Disord. 2020, 282, 308–315. [Google Scholar] [CrossRef] [PubMed]
- Rahangdale, S.; Fating, R.; Gajbhiye, M.; Kapse, M.; Inamdar, N.; Kotagale, N.; Umekar, M.; Taksande, B. Involvement of agmatine in antidepressant-like effect of HMG-CoA reductase inhibitors in mice. Eur. J. Pharmacol. 2021, 892, 173739. [Google Scholar] [CrossRef] [PubMed]
- Li, Z.; Ruan, M.; Chen, J.; Fang, Y. Major Depressive Disorder: Advances in Neuroscience Research and Translational Applications. Neurosci. Bull. 2021, 1–18. [Google Scholar] [CrossRef]
- Wang, W.; Krishnan, E. Big data and clinicians: A review on the state of the science. JMIR Med. Inf. 2014, 2, e1. [Google Scholar] [CrossRef] [PubMed]
- Dash, S.; Shakyawar, S.K.; Sharma, M.; Kaushik, S. Big data in healthcare: Management, analysis and future prospects. J. Big Data 2019, 6, 54. [Google Scholar] [CrossRef]
- Johnstone, I.M.; Titterington, D.M. Statistical challenges of high-dimensional data. Philos. Trans. R. Soc. A Math. Phys. Eng. Sci. 2009, 367, 4237–4253. [Google Scholar] [CrossRef]
- Pastorino, R.; De Vito, C.; Migliara, G.; Glocker, K.; Binenbaum, I.; Ricciardi, W.; Boccia, S. Benefits and challenges of Big Data in healthcare: An overview of the European initiatives. Eur. J. Public Health 2019, 29 (Suppl. 3), 23–27. [Google Scholar] [CrossRef]
- Fan, J.; Li, R. Statistical challenges with high dimensionality: Feature selection in knowledge discovery. Int. Congr. Math. ICM 2006, 3, 595–622. [Google Scholar]
- Shen, L.; Yin, Q. The classification for High-dimension low-sample size data. arXiv 2020, arXiv:2006.13018. [Google Scholar]
- Chen, M.; Hao, Y.; Hwang, K.; Wang, L.; Wang, L. Disease Prediction by Machine Learning Over Big Data From Healthcare Communities. IEEE Access 2017, 5, 8869–8879. [Google Scholar] [CrossRef]
- Geurkink, Y.; Boone, J.; Verstockt, S.; Bourgois, J.G. Machine Learning-Based Identification of the Strongest Predictive Variables of Winning and Losing in Belgian Professional Soccer. Appl. Sci. 2021, 11, 2378. [Google Scholar] [CrossRef]
- Liu, R.; Wei, L.; Zhang, P. A deep learning framework for drug repurposing via emulating clinical trials on real-world patient data. Nat. Mach. Intell. 2021, 3, 68–75. [Google Scholar] [CrossRef]
- Khan, M.A.; Kim, J. Toward Developing Efficient Conv-AE-Based Intrusion Detection System Using Heterogeneous Dataset. Electronics 2020, 9, 1771. [Google Scholar] [CrossRef]
- Russak, A.J.; Chaudhry, F.; De Freitas, J.K.; Baron, G.; Chaudhry, F.F.; Bienstock, S.; Paranjpe, I.; Vaid, A.; Ali, M.; Zhao, S.; et al. Machine Learning in Cardiology—Ensuring Clinical Impact Lives Up to the Hype. J. Cardiovasc. Pharmacol. Ther. 2020, 25, 379–390. [Google Scholar] [CrossRef]
- Antonelli, J.; Claggett, B.L.; Henglin, M.; Kim, A.; Ovsak, G.; Kim, N.; Deng, K.; Rao, K.; Tyagi, O.; Watrous, J.D.; et al. Statistical Workflow for Feature Selection in Human Metabolomics Data. Metabolites 2019, 9, 143. [Google Scholar] [CrossRef]
- Jo, I.; Lee, S.; Oh, S. Improved measures of redundancy and relevance for mRMR feature selection. Computers 2019, 8, 42. [Google Scholar] [CrossRef]
- Hamilton, M. A rating scale for depression. J. Neurol. Neurosurg. Psychiatry 1960, 23, 56–62. [Google Scholar] [CrossRef]
- Beck, A.T.; Steer, R.A.; Brown, G.K. Beck depression inventory-II. San Antonio 1996, 78, 490–498. [Google Scholar]
- Urquiaga, I.; Ávila, F.; Echeverria, G.; Perez, D.; Trejo, S.; Leighton, F. A Chilean berry concentrate protects against postprandial oxidative stress and increases plasma antioxidant activity in healthy humans. Oxid. Med. Cell. Longev. 2017, 2017, 8361493. [Google Scholar] [CrossRef]
- Beretta, L.; Santaniello, A. Nearest neighbor imputation algorithms: A critical evaluation. BMC Med. Inform. Decis. Mak. 2016, 16, 74. [Google Scholar] [CrossRef]
- Liu, C.-H.; Tsai, C.-F.; Sue, K.-L.; Huang, M.-W. The Feature Selection Effect on Missing Value Imputation of Medical Datasets. Appl. Sci. 2020, 10, 2344. [Google Scholar] [CrossRef]
- Jeon, H.; Oh, S. Hybrid-Recursive Feature Elimination for Efficient Feature Selection. Appl. Sci. 2020, 10, 2344. [Google Scholar] [CrossRef]
- Bommert, A.; Sun, X.; Bischl, B.; Rahnenführer, J.; Lang, M. Benchmark for filter methods for feature selection in high-dimensional classification data. Comput. Stat. Data Anal. 2020, 143, 106839. [Google Scholar] [CrossRef]
- Urbanowicz, R.J.; Meeker, M.; la Cava, W.; Olson, R.S.; Moore, J.H. Relief-based feature selection: Introduction and review. J. Biomed. Inform. 2018, 85, 189–203. [Google Scholar] [CrossRef]
- Feng, S.; Chen, J.; Tang, Y. Identification of Low Frequency Oscillations Based on Multidimensional Features and ReliefF-mRMR. Energies 2019, 12, 2762. [Google Scholar] [CrossRef]
- Ding, C.; Peng, H. Minimum redundancy feature selection from microarray gene expression data. J. Bioinform. Comput. Biol. 2005, 3, 185–205. [Google Scholar] [CrossRef]
- Robnik-Šikonja, M.; Kononenko, I. Theoretical and empirical analysis of ReliefF and RReliefF. Mach. Learn. 2003, 53, 23–69. [Google Scholar] [CrossRef]
- Qamar, A.M.; Gaussier, E. RELIEF Algorithm and Similarity Learning for k-NN. Int. J. Comput. Inf. Syst. Ind. Manag. Appl. 2012, 4, 445–458. [Google Scholar]
- James, G.; Witten, D.; Hastie, T.; Tibshirani, R. An Introduction to Statistical Learning; Springer: New York, NY, USA, 2013; Volume 103. [Google Scholar]
- Malvoni, M.; Chaibi, Y. Machine Learning Based Approaches for Modeling the Output Power of Photovoltaic Array in Real Outdoor Conditions. Electronics 2020, 9, 315. [Google Scholar]
- Raschka, S. Model evaluation, model selection, and algorithm selection in machine learning. arXiv 2018, arXiv:1811.12808. [Google Scholar]
- Lin, W.; Hasenstab, K.; Cunha, G.M.; Schwartzman, A. Comparison of handcrafted features and convolutional neural networks for liver MR image adequacy assessment. Sci. Rep. 2020, 10, 20336. [Google Scholar] [CrossRef] [PubMed]
- Frésard, M.E.; Erices, R.; Bravo, M.L.; Cuello, M.; Owen, G.I.; Ibáñez, C.; Rodriguez-Fernandez, M. Multi-objective optimization for personalized prediction of venous thromboembolism in ovarian cancer patients. IEEE J. Biomed. Heal. Inf. 2019, 24, 1500–1508. [Google Scholar] [CrossRef]
- Kim, J. Estimating classification error rate: Repeated cross-validation, repeated hold-out and bootstrap. Comput. Stat. Data Anal. 2009, 53, 3735–3745. [Google Scholar] [CrossRef]
- Shuhaili, M.F.R.M.A.; Samsudin, I.N.; Stanslas, S.H.J.; Thambiah, S.C. Effects of different types of statins on lipid profile: A perspective on Asians. Int. J. Endocrinol. Metab. 2017, 15, e43319. [Google Scholar]
- Efthimiadis, A. Rosuvastatin and cardiovascular disease: Did the strongest statin hold the initial promises? Angiology 2008, 59, 62S–64S. [Google Scholar] [CrossRef] [PubMed]
- Köhler-Forsberg, O.; Otte, C.; Gold, S.M.; Østergaard, S.D. Statins in the treatment of depression: Hype or hope? Pharmacol. Ther. 2020, 215, 107625. [Google Scholar] [CrossRef]
- Dave, C.V.; Winterstein, A.G.; Park, H.; Cook, R.L.; Hartzema, A.G. Comparative risk of lipophilic and hydrophilic statins on incident depression: A retrospective cohort study. J. Affect. Disord. 2018, 238, 542–546. [Google Scholar] [CrossRef]
- Ghanizadeh, A.; Hedayati, A. Augmentation of fluoxetine with lovastatin for treating major depressive disorder, a randomized double-blind placebo controlled-clinical trial. Depress. Anxiety 2013, 30, 1084–1088. [Google Scholar] [CrossRef]
- Gougol, A.; Zareh-Mohammadi, N.; Raheb, S.; Farokhnia, M.; Salimi, S.; Iranpour, N.; Yekehtaz, H.; Akhondzadeh, S. Simvastatin as an adjuvant therapy to fluoxetine in patients with moderate to severe major depression: A double-blind placebo-controlled trial. J. Psychopharmacol. 2015, 29, 575–581. [Google Scholar] [CrossRef] [PubMed]
- Haghighi, M.; Khodakarami, S.; Jahangard, L.; Ahmadpanah, M.; Bajoghli, H.; Holsboer-Trachsler, E.; Brand, S. In a randomized, double-blind clinical trial, adjuvant atorvastatin improved symptoms of depression and blood lipid values in patients suffering from severe major depressive disorder. J. Psychiatr. Res. 2014, 58, 109–114. [Google Scholar] [CrossRef] [PubMed]
- Berk, M.; Mohebbi, M.; Dean, O.M.; Cotton, S.M.; Chanen, A.M.; Dodd, S.; Ratheesh, A.; Amminger, G.P.; Phelan, M.; Weller, A.; et al. Youth Depression Alleviation with Anti-inflammatory Agents (YoDA-A): A randomised clinical trial of rosuvastatin and aspirin. BMC Med. 2020, 18, 16. [Google Scholar] [CrossRef]
- Yatham, M.S.; Yatham, S.S. Should aspirin be tested for secondary prevention of depression? Bipolar Disord. 2020. [Google Scholar] [CrossRef] [PubMed]
- Massardo, T.; Quintana, J.C.; Jaimovich, R.; Sáez, C.G.; Risco, L.; Liberman, C.; Araya, A.V.; Galleguillos, T.; Castro-Mora, G.; Pereira, J. Regional Brain Perfusion Is Associated with Endothelial Dysfunction Markers in Major Depressive Disorder. Neuropsychobiology 2020, 1–11. [Google Scholar] [CrossRef] [PubMed]
- Jamilian, H.; Bagherzadeh, K.; Nazeri, Z.; Hassanijirdehi, M. Vitamin D, parathyroid hormone, serum calcium and phosphorus in patients with schizophrenia and major depression. Int. J. Psychiatry Clin. Pract. 2013, 17, 30–34. [Google Scholar] [CrossRef] [PubMed]
- Al-Dujaili, A.H.; Al-Hakeim, H.K.; Twayej, A.J.; Maes, M. Total and ionized calcium and magnesium are significantly lowered in drug-naïve depressed patients: Effects of antidepressants and associations with immune activation. Metab. Brain Dis. 2019, 34, 1493–1503. [Google Scholar] [CrossRef] [PubMed]
Publisher’s Note: MDPI stays neutral with regard to jurisdictional claims in published maps and institutional affiliations. |
© 2021 by the authors. Licensee MDPI, Basel, Switzerland. This article is an open access article distributed under the terms and conditions of the Creative Commons Attribution (CC BY) license (http://creativecommons.org/licenses/by/4.0/).