
Effects of Low-Intensity Resistance Exercise with Slow Movement and Tonic Force Generation on Short-Term Glycemic Variability in Healthy Subjects: A Randomized Controlled Study


Abstract
1. Introduction
2. Materials and Methods
2.1. Study Subjects
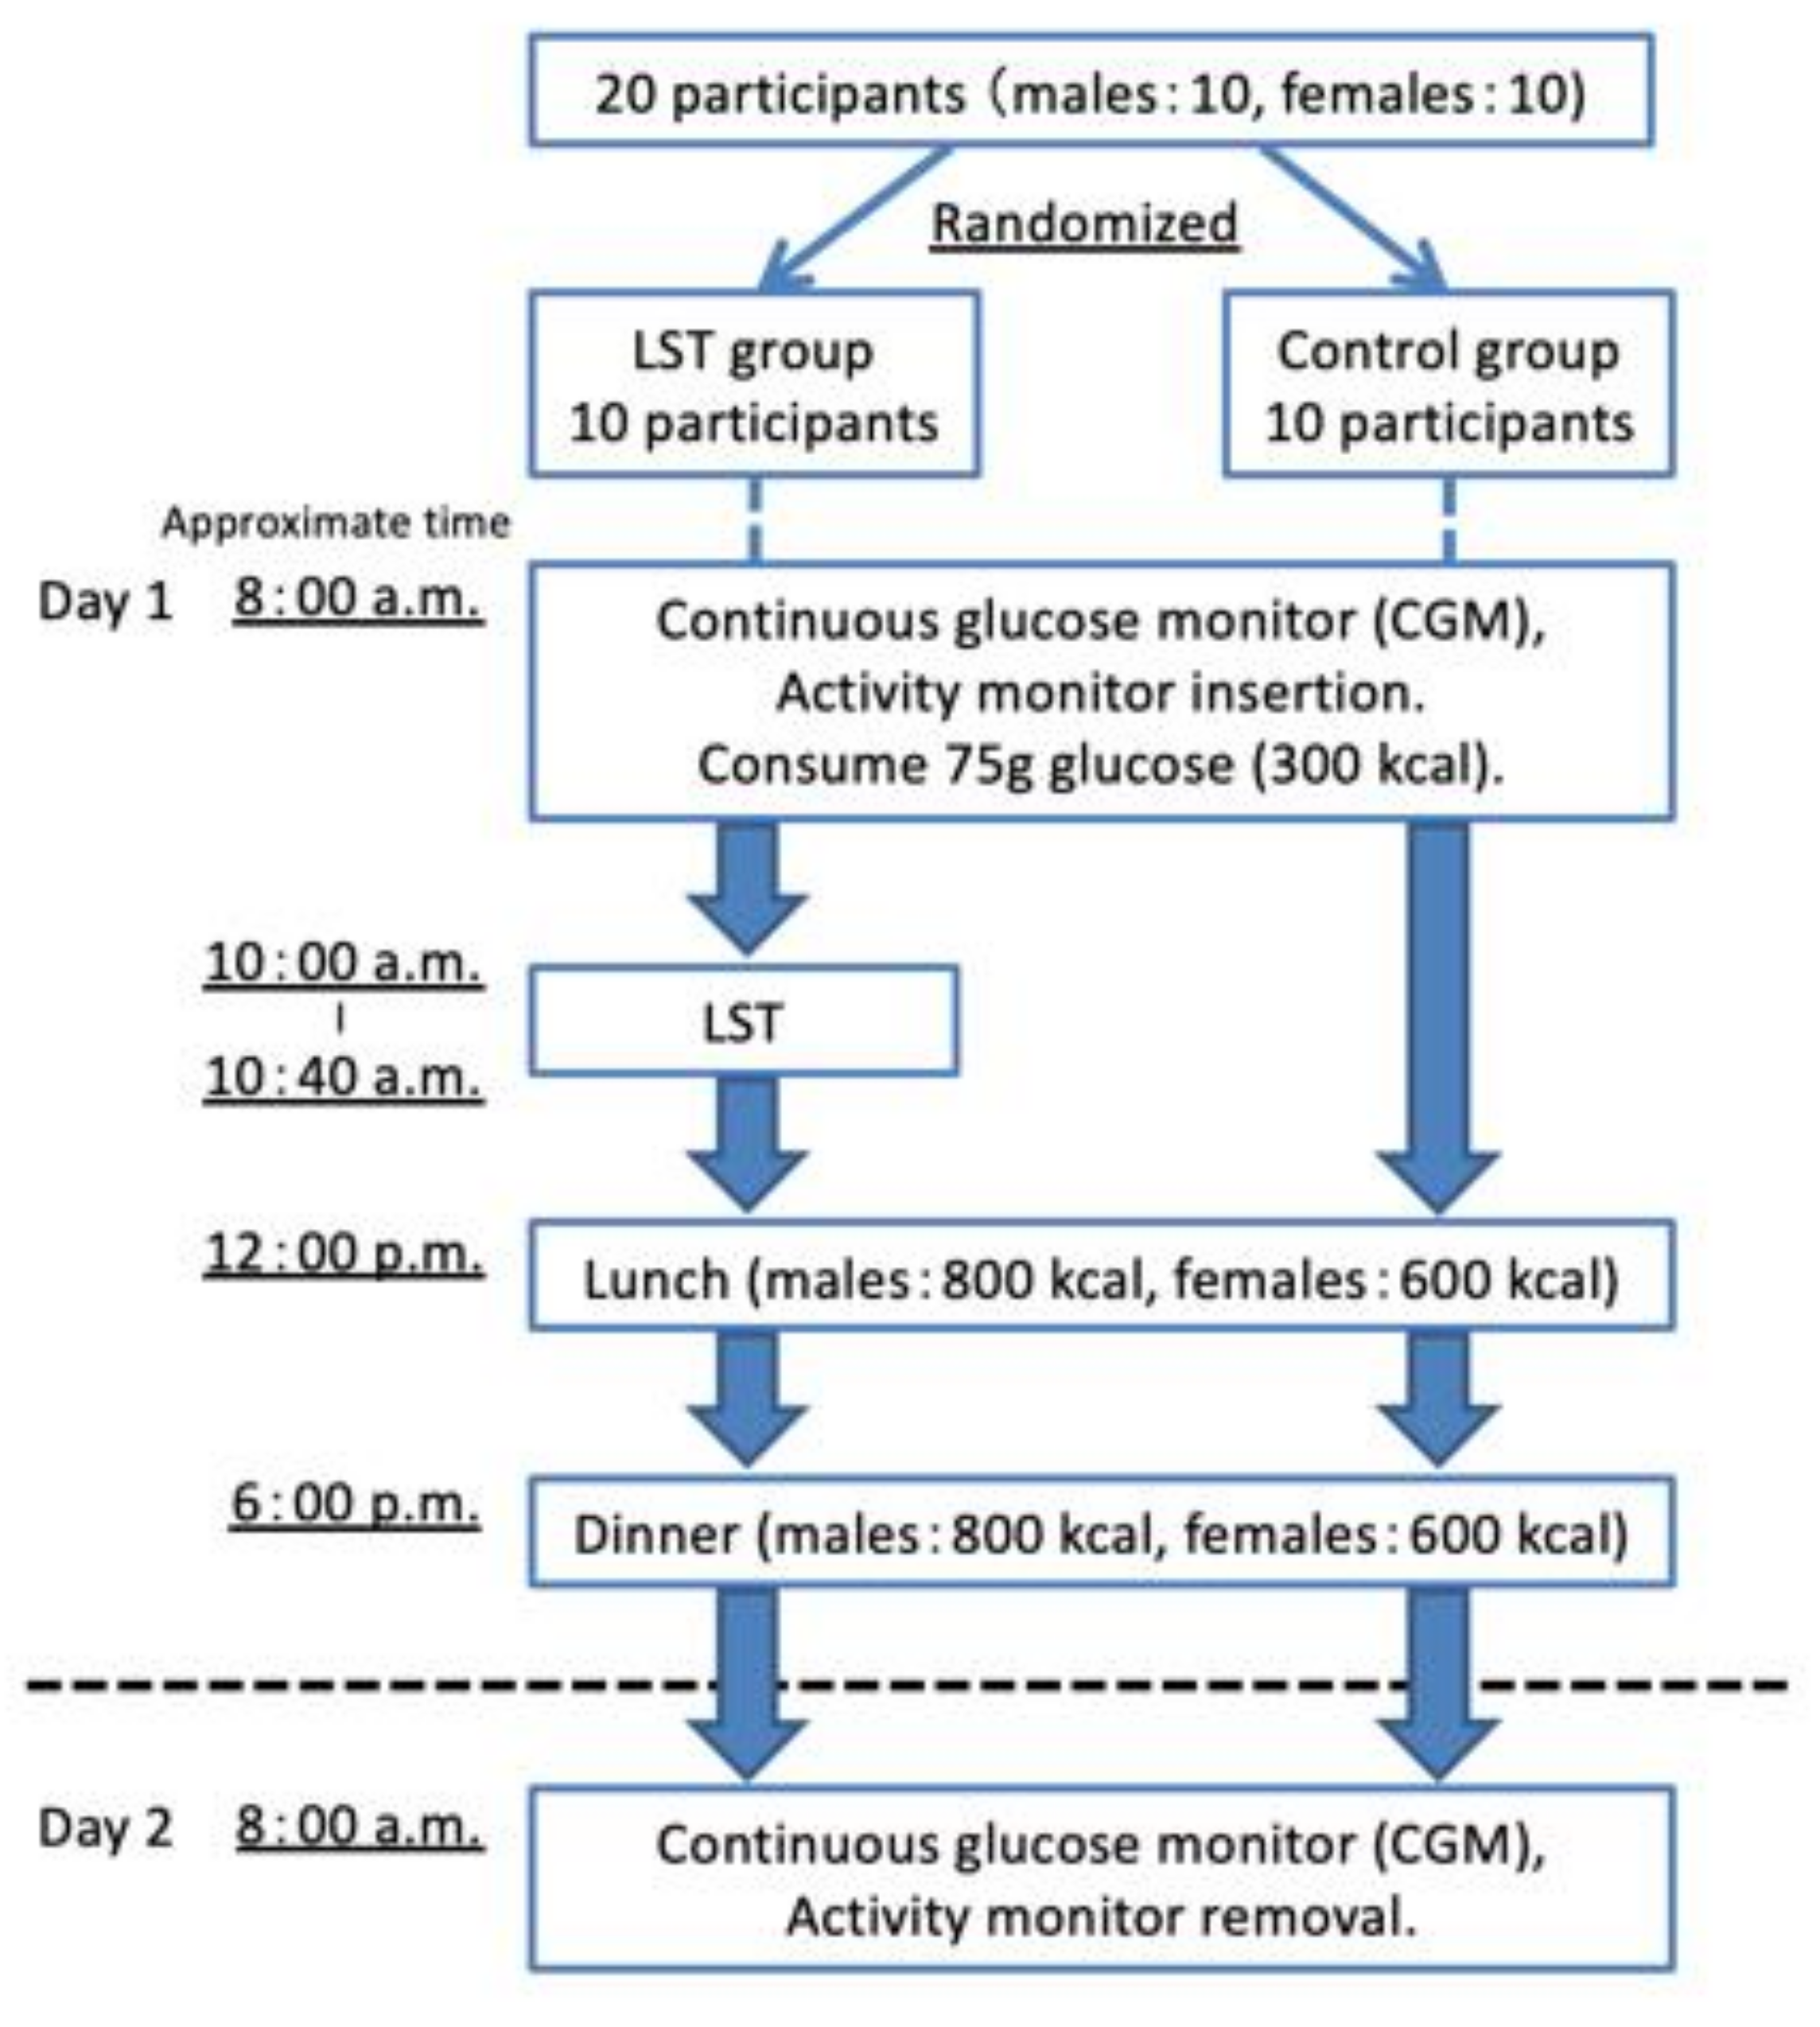
2.2. Study Protocol
- Randomization
- Day 0
- Day 1
- Day 2
2.3. Continuous Glucose Monitoring System
2.4. Physical Activity Assessment
2.5. Statistical Analysis
3. Results
3.1. Characteristics of the Study Subjects
3.2. Comparison between Pre- and Post-LST
4. Discussion
Supplementary Materials
Author Contributions
Funding
Institutional Review Board Statement
Informed Consent Statement
Data Availability Statement
Acknowledgments
Conflicts of Interest
References
- Monnier, L.; Mas, E.; Ginet, C.; Michel, F.; Villon, L.; Cristol, J.P.; Colette, C. Activation of Oxidative Stress by Acute Glucose Fluctuations Compared With Sustained Chronic Hyperglycemia in Patients With Type 2 Diabetes. JAMA 2006, 295, 1681–1687. [Google Scholar] [CrossRef] [PubMed]
- Abbatecola, A.M.; Rizzo, M.R.; Barbieri, M.; Grella, R.; Arciello, A.; Laieta, M.T.; Acampora, R.; Passariello, N.; Cacciapuoti, F.; Paolisso, G. Postprandial plasma glucose excursions and cognitive functioning in aged type 2 diabetics. Neurology 2006, 67, 235–240. [Google Scholar] [CrossRef] [PubMed]
- Xu, F.; Zhao, L.H.; Su, J.B.; Chen, T.; Wang, X.Q.; Chen, J.F.; Wu, G.; Jin, Y.; Wang, X.H. The relationship between glycemic variability and diabetic peripheral neuropathy in type 2 diabetes with well-controlled HbA1c. Diabetol. Metab. Syndr. 2014, 6, 139. [Google Scholar] [CrossRef]
- Hsu, C.R.; Chen, Y.T.; Sheu, W.H. Glycemic variability and diabetes retinopathy: A missing link. J. Diabetes Complicat. 2015, 29, 302–306. [Google Scholar] [CrossRef]
- Torimoto, K.; Okada, Y.; Mori, H.; Tanaka, Y. Relationship between fluctuations in glucose levels measured by continuous glucose monitoring and vascular endothelial dysfunction in type 2 diabetes mellitus. Cardiovasc. Diabetol. 2013, 12. [Google Scholar] [CrossRef] [PubMed]
- Hanefeld, M.; Cagatay, M.; Petrowitsch, T.; Neuser, D.; Petzinna, D.; Rupp, M. Acarbose reduces the risk for myocardial infarction in type 2 diabetic patients: Meta-analysis of seven long-term studies. Eur. Heart J. 2004, 25, 10–16. [Google Scholar] [CrossRef]
- Schnell, O.; Barnard, K.; Bergenstal, R.; Bosi, E.; Garg, S.; Guerci, B.; Haak, T.; Hirsch, I.B.; Ji, L.; Joshi, S.R.; et al. Role of Continuous Glucose Monitoring in Clinical Trials: Recommendations on Reporting. Diabetes Technol. Ther. 2017, 19, 391–399. [Google Scholar] [CrossRef]
- Yardley, J.E.; Kenny, G.P.; Perkins, B.A.; Riddell, M.C.; Balaa, N.; Malcolm, J.; Boulay, P.; Khandwala, F.; Sigal, R.J. Resistance versus aerobic exercise: Acute effects on glycemia in type 1 diabetes. Diabetes Care 2013, 36, 537–542. [Google Scholar] [CrossRef] [PubMed]
- Cruz, L.; Teixeira-Araujo, A.A.; Passos Andrade, K.T.; Rocha, T.; Puga, G.M.; Moreira, S.R. Low-Intensity Resistance Exercise Reduces Hyperglycemia and Enhances Glucose Control Over a 24-Hour Period in Women With Type 2 Diabetes. J. Strength Cond. Res. 2019, 33, 2826–2835. [Google Scholar] [CrossRef]
- McDonagh, M.J.; Davies, C.T. Adaptive response of mammalian skeletal muscle to exercise with high loads. Eur. J. Appl. Physiol. Occup. Physiol. 1984, 52, 139–155. [Google Scholar] [CrossRef]
- Fleck, S.J. Cardiovascular adaptations to resistance training. Med. Sci. Sports Exerc. 1988, 20, S146–S151. [Google Scholar] [CrossRef] [PubMed]
- MacDougall, J.D.; Tuxen, D.; Sale, D.G.; Moroz, J.R.; Sutton, J.R. Arterial blood pressure response to heavy resistance exercise. J. Appl. Physiol. 1985, 58, 785–790. [Google Scholar] [CrossRef]
- Tanimoto, M.; Ishii, N. Effects of low-intensity resistance exercise with slow movement and tonic force generation on muscular function in young men. J. Appl. Physiol. 2006, 100, 1150–1157. [Google Scholar] [CrossRef] [PubMed]
- Burd, N.A.; Andrews, R.J.; West, D.W.; Little, J.P.; Cochran, A.J.; Hector, A.J.; Cashaback, J.G.; Gibala, M.J.; Potvin, J.R.; Baker, S.K.; et al. Muscle time under tension during resistance exercise stimulates differential muscle protein sub-fractional synthetic responses in men. J. Physiol. 2012, 590, 351–362. [Google Scholar] [CrossRef] [PubMed]
- Watanabe, Y.; Tanimoto, M.; Ohgane, A.; Sanada, K.; Miyachi, M.; Ishii, N. Increased muscle size and strength from slow-movement, low-intensity resistance exercise and tonic force generation. J. Aging Phys. Act. 2013, 21, 71–84. [Google Scholar] [CrossRef]
- Kanda, K.; Yoda, T.; Suzuki, H.; Okabe, Y.; Mori, Y.; Yamasaki, K.; Kitano, H.; Kanda, A.; Hirao, T. Effects of low-intensity bodyweight training with slow movement on motor function in frail elderly patients: A prospective observational study. Environ. Health Prev. Med. 2018, 23, 4. [Google Scholar] [CrossRef] [PubMed]
- MacDougall, J.D.; McKelvie, R.S.; Moroz, D.E.; Sale, D.G.; McCartney, N.; Buick, F. Factors affecting blood pressure during heavy weight lifting and static contractions. J. Appl. Physiol. 1992, 73, 1590–1597. [Google Scholar] [CrossRef]
- Hamasaki, H.; Kawashima, Y.; Tamada, Y.; Furuta, M.; Katsuyama, H.; Sako, A.; Yanai, H. Associations of Low-Intensity Resistance Training with Body Composition and Lipid Profile in Obese Patients with Type 2 Diabetes. PLoS ONE 2015, 10, e0132959. [Google Scholar] [CrossRef]
- Bianchi, L.; Volpato, S. Muscle dysfunction in type 2 diabetes: A major threat to patient’s mobility and independence. Acta Diabetol. 2016, 53, 879–889. [Google Scholar] [CrossRef]
- Service, F.J.; Molnar, G.D.; Rosevear, J.W.; Ackerman, E.; Gatewood, L.C.; Taylor, W.F. Mean amplitude of glycemic excursions, a measure of diabetic instability. Diabetes 1970, 19, 644–655. [Google Scholar] [CrossRef]
- Schilichtkrull, J.; Munck, O.; Jersild, M. The M-Value, an Index of Blood-sugar Control in Diabetics. Acta Med. Scand. 1965, 177, 95–102. [Google Scholar] [CrossRef] [PubMed]
- David, M.D. The Challenges of Measuring Glycemic Variability. J. Diabetes Sci. Technol. 2012, 712–715. [Google Scholar] [CrossRef]
- Oshima, Y.; Kawaguchi, K.; Tanaka, S.; Ohkawara, K.; Hikihara, Y.; Ishikawa-Takata, K.; Tabata, I. Classifying household and locomotive activities using a triaxial accelerometer. Gait Posture 2010, 31, 370–374. [Google Scholar] [CrossRef] [PubMed]
- Ohkawara, K.; Oshima, Y.; Hikihara, Y.; Ishikawa-Takata, K.; Tabata, I.; Tanaka, S. Real-time estimation of daily physical activity intensity by a triaxial accelerometer and a gravity-removal classification algorithm. Br. J. Nutr. 2011, 105, 1681–1691. [Google Scholar] [CrossRef]
- Ganpule, A.A.; Tanaka, S.; Ishikawa-Takata, K.; Tabata, I. Interindividual variability in sleeping metabolic rate in Japanese subjects. Eur. J. Clin. Nutr. 2007, 61, 1256–1261. [Google Scholar] [CrossRef]
- WHO. Energy and Protein Requirements. In Report of a Joint FAO/WHO/UNU Expert Consultation; World Health Organization Technical Report Series; WHO: Geneva, Switzerland, 1985; Volume 724, pp. 1–206. [Google Scholar]
- Bando, H.; Ebe, K.; Muneta, T.; Bando, M.; Yonei, Y. Effect of low carbohydrate diet on type 2 diabetic patients and usefulness M-value. Diabetes Res. Open 2017, 3, 9–16. [Google Scholar] [CrossRef]
- Krinsley, J.S. Glycemic variability: A strong independent predictor of mortality in critically ill patients. Crit. Care Med. 2008, 36, 3008–3013. [Google Scholar] [CrossRef]
- Egi, M.; Bellomo, R.; Stachowski, E.; French, C.J.; Hart, G. Variability of blood glucose concentration and short-term mortality in critically ill patients. Anesthesiology 2006, 105, 244–252. [Google Scholar] [CrossRef]
- Matsutani, D.; Sakamoto, M.; Iuchi, H.; Minato, S.; Suzuki, H.; Kayama, Y.; Takeda, N.; Horiuchi, R.; Utsunomiya, K. Glycemic variability in continuous glucose monitoring is inversely associated with baroreflex sensitivity in type 2 diabetes: A preliminary report. Cardiovasc. Diabetol. 2018, 17, 36. [Google Scholar] [CrossRef] [PubMed]
- Bragd, J.; Adamson, U.; Bäcklund, L.B.; Lins, P.E.; Moberg, E.; Oskarsson, P. Can glycaemic variability, as calculated from blood glucose self-monitoring, predict the development of complications in type 1 diabetes over a decade? Diabetes Metab. 2008, 34, 612–616. [Google Scholar] [CrossRef] [PubMed]
- Bussau, V.A.; Ferreira, L.D.; Jones, T.W.; Fournier, P.A. A 10-s sprint performed prior to moderate-intensity exercise prevents early post-exercise fall in glycaemia in individuals with type 1 diabetes. Diabetologia 2007, 50, 1815–1818. [Google Scholar] [CrossRef]
- Bussau, V.A.; Ferreira, L.D.; Jones, T.W.; Fournier, P.A. The 10-s maximal sprint: A novel approach to counter an exercise-mediated fall in glycemia in individuals with type 1 diabetes. Diabetes Care 2006, 29, 601–606. [Google Scholar] [CrossRef] [PubMed]
- Guelfi, K.J.; Jones, T.W.; Fournier, P.A. The decline in blood glucose levels is less with intermittent high-intensity compared with moderate exercise in individuals with type 1 diabetes. Diabetes Care 2005, 28, 1289–1294. [Google Scholar] [CrossRef] [PubMed]
- Tanimoto, M.; Madarame, H.; Ishii, N. Muscle oxygenation and plasma growth hormone consentration during and after resistance exercise: Comparison between “KAATSU” and other types of regimen. Int. J. KAATSU Train. Res. 2005, 1, 51–56. [Google Scholar] [CrossRef]
- Percheron, G.; Hogrel, J.Y.; Denot-Ledunois, S.; Fayet, G.; Forette, F.; Baulieu, E.E.; Fardeau, M.; Marini, J.F. Effect of 1-year oral administration of dehydroepiandrosterone to 60- to 80-year-old individuals on muscle function and cross-sectional area: A double-blind placebo-controlled trial. Arch. Intern. Med. 2003, 163, 720–727. [Google Scholar] [CrossRef]
- Flack, K.D.; Davy, K.P.; Hulver, M.W.; Winett, R.A.; Frisard, M.I.; Davy, B.M. Aging, resistance training, and diabetes prevention. J. Aging Res. 2010, 127315. [Google Scholar] [CrossRef] [PubMed]
- Tanimoto, M.; Sanada, K.; Yamamoto, K.; Kawano, H.; Gando, Y.; Tabata, I.; Ishii, N.; Miyachi, M. Effects of whole-body low-intensity resistance training with slow movement and tonic force generation on muscular size and strength in young men. J. Strength Cond. Res. 2008, 22, 1926–1938. [Google Scholar] [CrossRef] [PubMed]


| (Index) | LST Group | Control Group | p-Value | |
|---|---|---|---|---|
| Participants | 10 | 10 | ||
| Males | 5 | 5 | ||
| Females | 5 | 5 | ||
| Age † | (year) | 28.6 ± 3.9 | 27.2 ± 4.21 | 0.449 |
| (range) | 22–34 | 23–36 | ||
| Height † | (cm) | 163.3 ± 12.3 | 167.4 ± 8.9 | 0.408 |
| (range) | 149.4–177.5 | 156.9–181.0 | ||
| Weight † | (kg) | 60.8 ± 15.6 | 59.6 ± 10.8 | 0.841 |
| (range) | 44.5–93.0 | 41.0–79.0 | ||
| BMI † | (kg/m2) | 22.5 ± 3.3 | 21.1 ± 2.6 | 0.331 |
| (range) | 19.0–31.1 | 16.0–24.1 |
| (Index) | LST Group | Control Group | Group × Time | Group | Time | ||||
|---|---|---|---|---|---|---|---|---|---|
| F | p-Value | F | p-Value | F | p-Value | ||||
| 0.152 | 0.860 | 0.053 | 0.820 | 17.477 | <0.001 | ||||
| Glucose before measurement | (mg/dL) | 94.7 ± 6.2 | 96.5 ± 12.1 | ||||||
| OGTT 1 h | (mg/dL) | 140.7 ± 50.8 | 134.7 ± 28.7 | ||||||
| OGTT 2 h | (mg/dL) | 117.2 ± 30.6 | 114.3 ± 25.4 | ||||||
| (Index) | LST Group | Control Group | p-Value | |
|---|---|---|---|---|
| CGMS data | ||||
| OGTT 1 h baseline † | (mg/dL) | 46.0 ± 49.1 | 38.2 ± 27.0 | 0.665 |
| OGTT 2 h baseline † | (mg/dL) | 22.5 ± 28.1 | 17.8 ± 26.5 | 0.705 |
| 24 h average glucose levels † | (mg/dL) | 93.8 ± 9.8 | 99.0 ± 9.9 | 0.259 |
| Glucose SD † | (mg/dL) | 19.5 ± 7.9 | 15.9 ± 5.6 | 0.262 |
| High blood sugar integration time (>140 mg/dL) ‡ | (%) | 0.8 ± 1.6 | 0.1 ± 0.3 | 0.684 |
| Low blood sugar integration time (<70 mg/dL) ‡ | (%) | 11.0 ± 12.8 | 4.9 ± 12.8 | 0.481 |
| Range of the target (70~140 mg/dL) ‡ | (%) | 88.2 ± 12.5 | 95.0 ± 12.7 | 0.353 |
| Total area under the curve † | 128,797.0 ± 13,510.7 | 135,860.8 ± 13,425.0 | 0.256 | |
| Area under the curve >140 mg/dL ‡ | 371.8 ± 784.6 | 11.0 ± 34.8 | 0.684 | |
| Area under the curve <70 mg/dL ‡ | 1269.5 ± 1623.1 | 604.0 ± 1798.5 | 0.353 | |
| Mean amplitude of glycemic excursions ‡ | (mg/dL) | 39.5 ± 13.3 | 48.1 ± 39.0 | 0.579 |
| M-value 120 † | 5.3 ± 3.4 | 2.9 ± 3.7 | 0.152 | |
| M-value 100 ‡ | 2.1 ± 1.4 | 1.1 ± 1.5 | 0.190 | |
| Physical activity | ||||
| Basal metabolic rate † | (kcal) | 1346.8 ± 292.0 | 1361.6 ± 219.4 | 0.899 |
| Total energy expenditure † | (kcal) | 3982.5 ± 945.4 | 4316.5 ± 974.5 | 0.447 |
| Walking † | 348.5 ± 204.7 | 304.9 ± 169.0 | 0.630 | |
| Daily living activities † | (METs) | 491.8 ± 178.7 | 505.7 ± 92.4 | 0.830 |
| Physical activities (walking and daily activities) † | (METs) | 840.3 ± 341.4 | 810.6 ± 231.7 | 0.822 |
| Number of steps † | (steps) | 12,281.2 ± 6755.9 | 10,329.3 ± 5303.2 | 0.482 |
| Physical activity level ‡ | 3.0 ± 0.2 | 3.2 ± 0.5 | 0.579 |
| (Index) | LST Group | Control Group | |||||
|---|---|---|---|---|---|---|---|
| Pre | Post | p-Value | Pre | Post | p-Value | ||
| Average glucose levels | (mg/dL) | 135.3 ± 41.9 | 97.0 ± 19.7 | 0.007 | 124.1 ± 16.2 | 91.8 ± 10.4 | 0.005 |
| Glucose SD | (mg/dL) | 11.8 ± 7.0 | 6.0 ± 4.4 | 0.022 | 9.0 ± 4.9 | 6.6 ± 4.7 | 0.114 |
| In target range (70~140 mg/dL) | (%) | 69.2 ± 47.8 | 93.3 ± 21.1 | 0.066 | 76.7 ± 37.6 | 99.2 ± 2.6 | 0.068 |
| High blood sugar frequency (>140 mg/dL) | (times/day) | 4.1 ± 6.2 | 0.9 ± 2.8 | 0.066 | 1.8 ± 3.6 | 0 ± 0 | 0.109 |
| Low blood sugar frequency (<70 mg/dL) | (times/day) | 0 ± 0 | 0 ± 0 | 1.000 | 0 ± 0 | 0.1 ± 0.3 | 0.317 |
| Total area under the curve | 8149.8 ± 2549.4 | 5864.8 ± 1183.9 | 0.007 | 7444.8 ± 969.8 | 5490.0 ± 629.8 | 0.005 | |
| Total area under the curve >140 mg/dL | 946.8 ± 1775.7 | 44.8 ± 141.5 | 0.068 | 175.8 ± 379.5 | 0 ± 0 | 0.109 | |
| Total area under the curve <70 mg/dL | 0 ± 0 | 0 ± 0 | 1.000 | 0 ± 0 | 0.3 ± 0.8 | 0.317 | |
| M-value 120 | 3.5 ± 6.2 | 2.7 ± 2.7 | 0.575 | 0.4 ± 0.7 | 2.7 ± 2.0 | 0.017 | |
| M-value 100 | 7.9 ± 14.1 | 0.9 ± 1.3 | 0.508 | 1.9 ± 2.9 | 0.5 ± 0.4 | 0.114 | |
Publisher’s Note: MDPI stays neutral with regard to jurisdictional claims in published maps and institutional affiliations. |
© 2021 by the authors. Licensee MDPI, Basel, Switzerland. This article is an open access article distributed under the terms and conditions of the Creative Commons Attribution (CC BY) license (http://creativecommons.org/licenses/by/4.0/).
Share and Cite
Shoji, T.; Hamasaki, H.; Kawaguchi, A.; Waragai, Y.; Yanai, H. Effects of Low-Intensity Resistance Exercise with Slow Movement and Tonic Force Generation on Short-Term Glycemic Variability in Healthy Subjects: A Randomized Controlled Study. Appl. Sci. 2021, 11, 1536. https://doi.org/10.3390/app11041536
Shoji T, Hamasaki H, Kawaguchi A, Waragai Y, Yanai H. Effects of Low-Intensity Resistance Exercise with Slow Movement and Tonic Force Generation on Short-Term Glycemic Variability in Healthy Subjects: A Randomized Controlled Study. Applied Sciences. 2021; 11(4):1536. https://doi.org/10.3390/app11041536
Chicago/Turabian StyleShoji, Takuro, Hidetaka Hamasaki, Akiko Kawaguchi, Yoko Waragai, and Hidekatsu Yanai. 2021. "Effects of Low-Intensity Resistance Exercise with Slow Movement and Tonic Force Generation on Short-Term Glycemic Variability in Healthy Subjects: A Randomized Controlled Study" Applied Sciences 11, no. 4: 1536. https://doi.org/10.3390/app11041536
APA StyleShoji, T., Hamasaki, H., Kawaguchi, A., Waragai, Y., & Yanai, H. (2021). Effects of Low-Intensity Resistance Exercise with Slow Movement and Tonic Force Generation on Short-Term Glycemic Variability in Healthy Subjects: A Randomized Controlled Study. Applied Sciences, 11(4), 1536. https://doi.org/10.3390/app11041536