1. Introduction
Space debris is composed of manmade objects, once part of spacecraft, that orbit the Earth. These objects have ceased to function and represent a critical risk for active satellites and space missions [
1,
2]. Actually, such a risk has a twofold nature: on one hand, the orbiting debris may collide with each other or with an active spacecraft, and, on the other hand, the orbital life of a piece of debris may come to an end, causing the reentry of the object in the atmosphere. In the first case, since debris travels at typical speed of about tens of km/s in near orbit (Low Earth Orbit—LEO), a possible impact is likely to cause a fragmentation event that would increase the debris population [
3]. This cascading process is also known as Kessler syndrome [
4]. In the second case, very large debris, which cannot be entirely vaporized by friction with the atmosphere during the reentry process, has a very small but definitely not negligible probability of reaching a populated area.
Given these hazards represented by the debris, worldwide space agencies have mobilized in order to set up a monitoring program and define the so-called mitigation procedures, namely the body of countermeasures employed to contain the risk. This is the main mission of the Space Situational Awareness (SSA) program. Ground-based radars, optical telescopes and laser systems are employed to detect, track and catalogue objects larger than 5–10 cm in the Low Earth Orbit (LEO), the most populated one, and those larger than 0.3–1.0 m at greater altitudes (Medium and Geostationary Earth Orbits—MEO and GEO) [
4]. Starting from this assumption it does not come as a surprise that countless space surveillance sites are scattered all over the globe, composing a dense network that acts as a massive ever-watching “eye” on the space environment. Undoubtedly, the United States (US) is the most exhaustive source of information about orbital debris. Thanks to the Space Surveillance Network (SSN), a large-scale network of optical and radar sensors, the United States Strategic Command (USSTRATCOM) is able to hold and maintain the largest database of catalogued objects in LEO [
4,
5,
6]. The US Combined Space Operations Center (CSpOC, former known as JSpOC) acts as coordinator for the large amount of data coming from the SSN, elaborating the orbital parameters and making them available in a suitable format, i.e., a two-line element set (TLE). Following the steps taken by the US, other countries have started space surveillance programs, coordinated by their respective space agencies, like Roscosmos for Russia, the Japan Aerospace Exploration Agency (JAXA), and the European Space Agency (ESA) for the European countries, just to name some prominent examples [
5,
6,
7]. It is worth clarifying that the data collected from space debris measurements are usually not the prerogative of a single country but are shared for the sake of international cooperation. However, since space debris is a relatively new topic in the field of research, there are very few works in the scientific literature that address results deriving from a space debris campaign, and most of them are conference papers. As a consequence, an extensive and complete review of the measurement campaigns performed by the space surveillance sensors is still missing from the open literature.
Since it would be overly complicated considering every type of sensor for space debris detection, i.e., radar, optical and laser, this review aims to accomplish at least part of this task, taking into account only the radar sensors. An overview of radar principles and configurations typically used in space debris monitoring and tracking is reported in
Section 2.
This review paper aims to gather information about the radar measurements of space debris performed by worldwide space agencies, and make them available in a coherent and comprehensible manner, focusing on the characteristics of the radar sensors and on the key results of the measurement campaign. The results are divided in three major categories, based on the volume of the available material in literature, the first one being devoted to the US SSN, the second one to the European countries’ radar measurements, and the third and last one to the efforts made by other countries. This classification choice aims to identify a specific sensor within a wider network, and to highlight its belonging to the local space agency and/or government organization, thus helping the reader to understand the operating context of these sensors.
3. US SSN Radar Measurements
A first glimpse on the US space debris surveillance activity that can be found in the literature dates back to the 90s, when the Reagan Test Site (RTS) sensors were involved in the 1991 NASA Multifrequency Space Debris Radar Tests (MSDRT). The RTS is a former missile testing facility located on Kwajalein Atoll (central western Pacific) [
11] and the home of one of the most important US radar sites, the Kiernan Reentry Measurements Site (KREMS). The KREMS is one of the collateral sensors of the US SSN, meaning that its primary mission is not related to space debris monitoring, but includes the SSA program as a secondary objective [
12]. The heart of the KREMS are the four powerful radar systems: the Advanced Research Projects Agency (ARPA)-Lincoln C-band Observables Radar (ALCOR), the ARPA Long-Range Tracking and Instrumentation Radar (ALTAIR), the Target Resolution and Discrimination Experiment (TRADEX), and the Millimeter-Wave (MMW) system. In 1991, during NASA MSDRT experiment, the TRADEX was employed in beam park mode or stare mode; that indicates an operational mode in which the pointing direction of the radar is fixed and the antenna is capable of detecting objects passing through its beam. TRADEX is a monostatic 25 m parabolic dish equipped with a dual-frequency feed. It is able to transmit right circular polarization in both the L-band (1.320 GHz) with an average power of 300 kW and the S-band (2.950 GHz) with an average power of 60 kW, and receive either right and left circular polarization signals [
11,
13]. The azimuth and elevation maximum speeds are equal to 12.5 deg/sec allowing also a tracking mode. During the 4.4 h of 1991 campaign, the TRADEX was able to detect a total of 19 objects with estimated size of 3–4 cm [
13]. The positive outcome of this campaign led to another experiment in 1994, this time involving all the KREMS sensors. In particular, TRADEX was employed in stare-and-chase mode (or mixed mode), which is a combination of beam park mode and tracking mode (where the sensor actively follows the target), ALTAIR was used in tracking mode and for a multispectral debris characterization, and all the KREMS sensors were combined in a multisensor session performed in tracking mode [
11,
14].
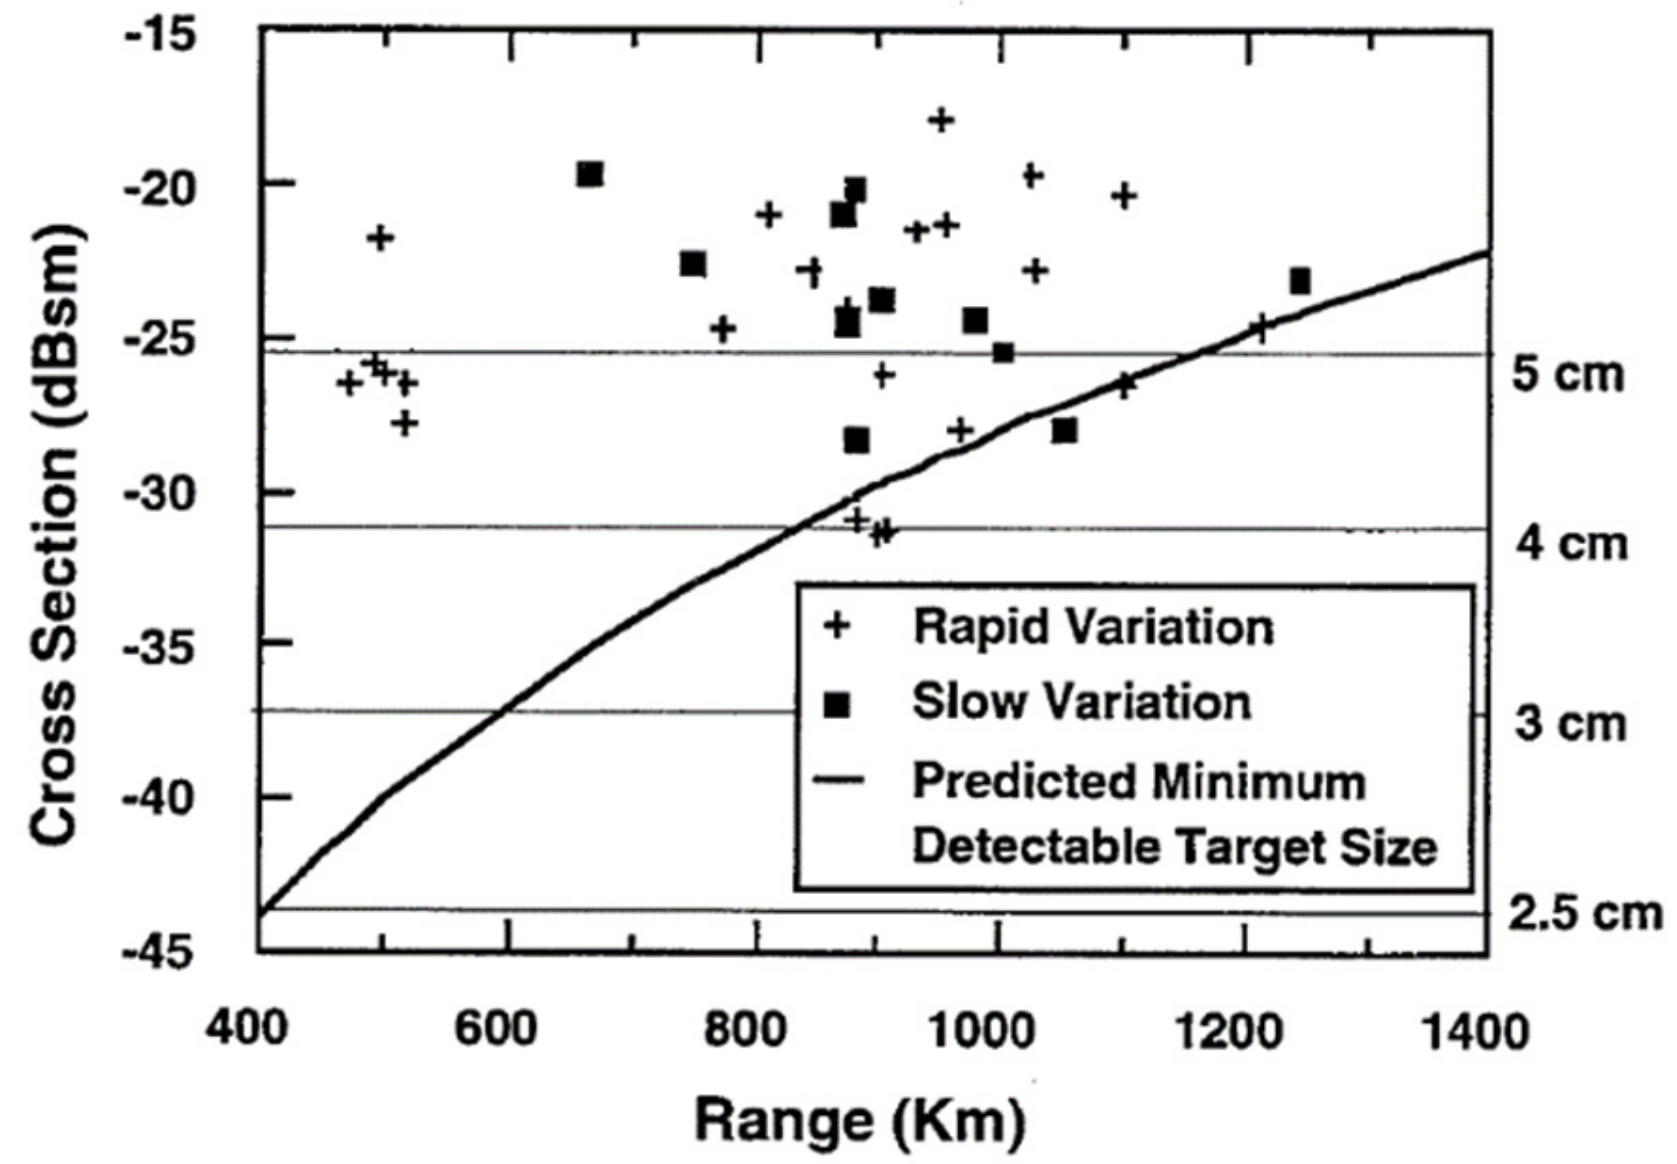
The TRADEX was used in stare-and-chase mode for about 40 h during the 1994 campaign, with the purpose of detecting and tracking uncatalogued objects between 300 and 1200 km of altitude. Thanks to its sensitivity (it is capable of detecting an object with a radar cross section (RCS) of approximately 3 cm (−40 dBsm) at 500 km range) the TRADEX was able to detect and track 77 objects, 39 of which were uncorrelated with the SSN catalog.
Figure 1 shows the summary of the radar measurements of the TRADEX during the 1994 debris campaign [
14].
Most of the detections are grouped in a range between 750 and 1200 km, with a secondary cluster at 500 km.
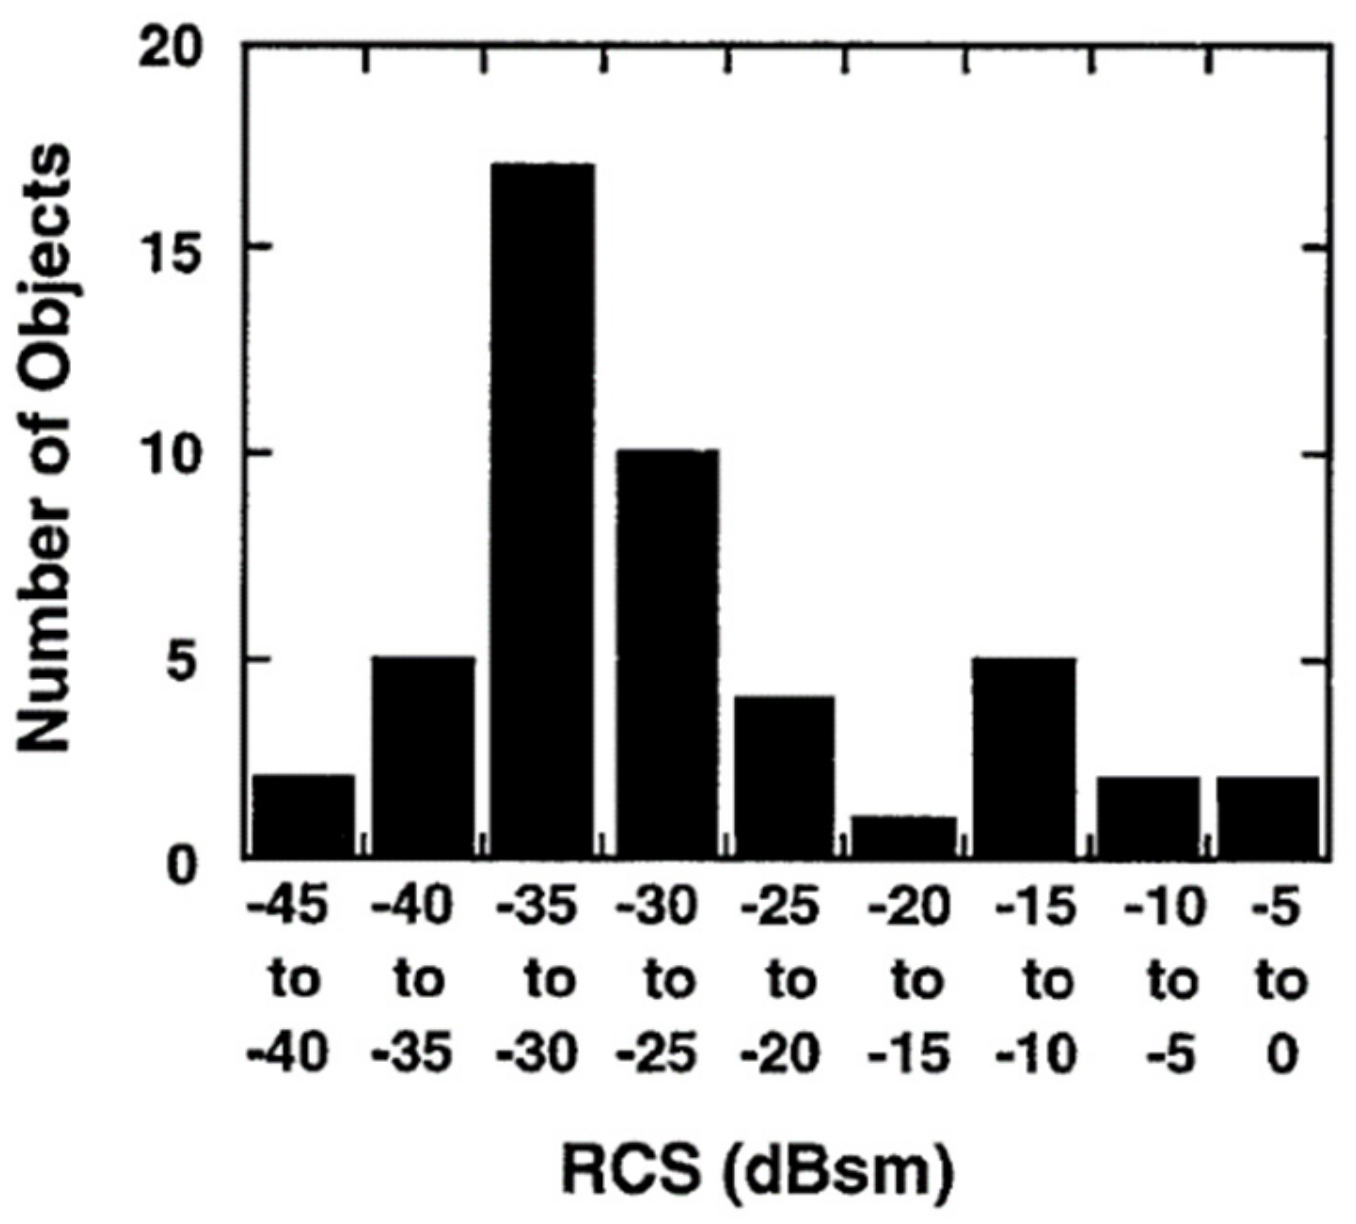
ALTAIR is a 46 m steerable parabolic antenna with dual-frequency operation capabilities, at VHF (0.162 GHz) and UHF (0.422 GHz), able to transmit right circular polarized signal with an average power of 120 kW [
15]. It is more sensitive than TRADEX, being capable of detecting an object with 3 cm RCS at 1000 km range. During the 1994 debris campaign, ALTAIR was able to track at least 100 object, 51 of which were uncatalogued. A total of 120 tracks were performed on these new objects, gathering information about RCS, inclination and eccentricity [
14]. A summary of the radar measurements performed by ALTAIR is reported in
Figure 2.
The distribution has its peak at around −31 dBsm RCS, which corresponds to a sphere of about 8.5 cm diameter.
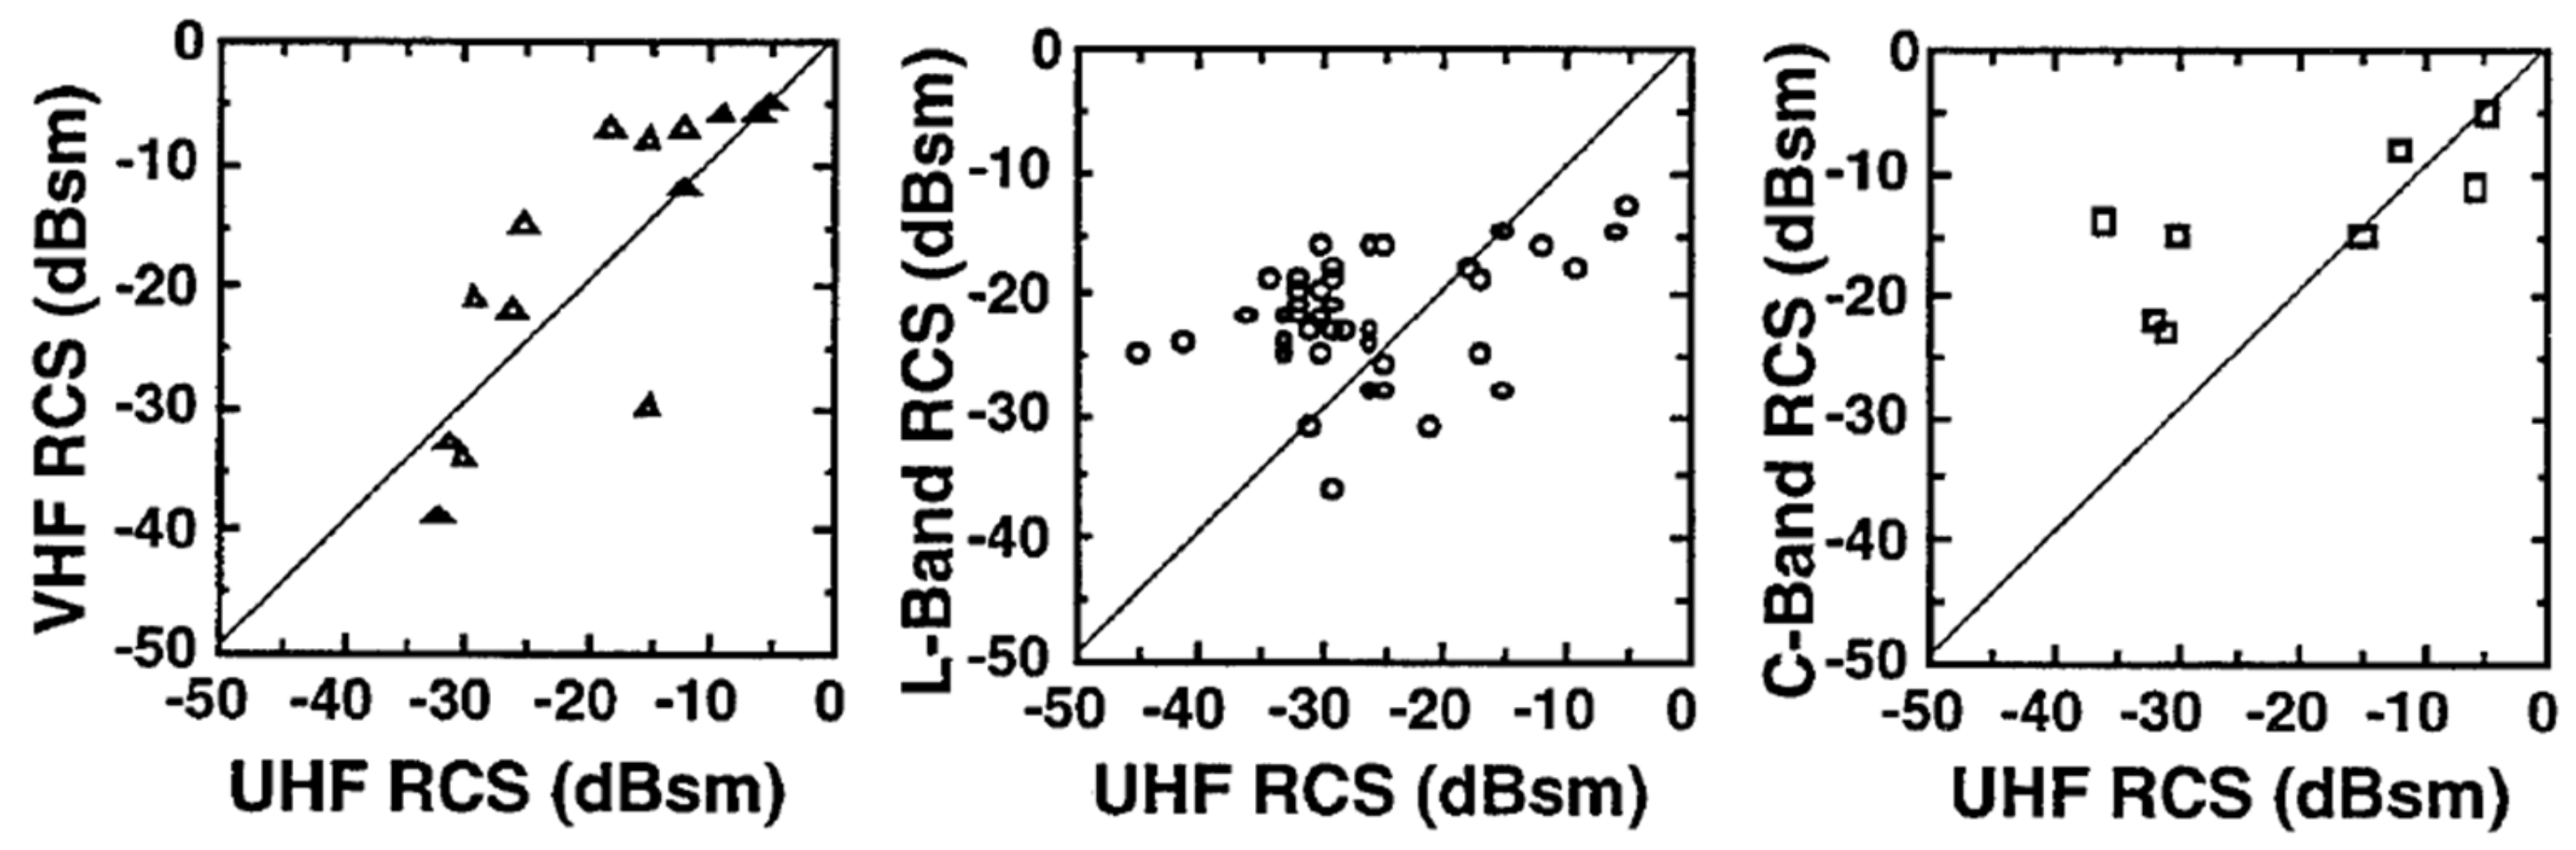
Finally, the multisensor activity, involving all the KREMS sensors (also optical), was organized into six different evening sessions for a joint campaign of about 21.5 h of tracking time. A total of 55 objects were tracked using two or more sensors and 5 piece of debris were jointly tracked by radar and optics [
14]. Interestingly enough, the radar measurements of the smallest debris tracked were used to demonstrate the non-spherical shape of the debris by comparing the detected RCS at different frequencies, as shown in
Figure 3. As can be seen from the figure, the RCS of the object scales with the frequency.
Another important US SSN facility, with plenty of information published in the open literature, is the Haystack radar. As for the KREMS radars, the Haystack is a collateral sensor within the SSN [
12]. The Haystack radar is a monopulse X-band (10 GHz) 36 m diameter tracking radar located in Tyngsboro, MA [
16,
17]. It can operate in two different modes based on the waveform code, with a peak power of 400 kW, and it is able to detect a piece of debris as small as 1 cm diameter in beam park mode at ranges greater than 1000 km [
16,
17]. Between 1990 and 1994, the Haystack radar was employed to collect data from space debris for nearly 2500 h [
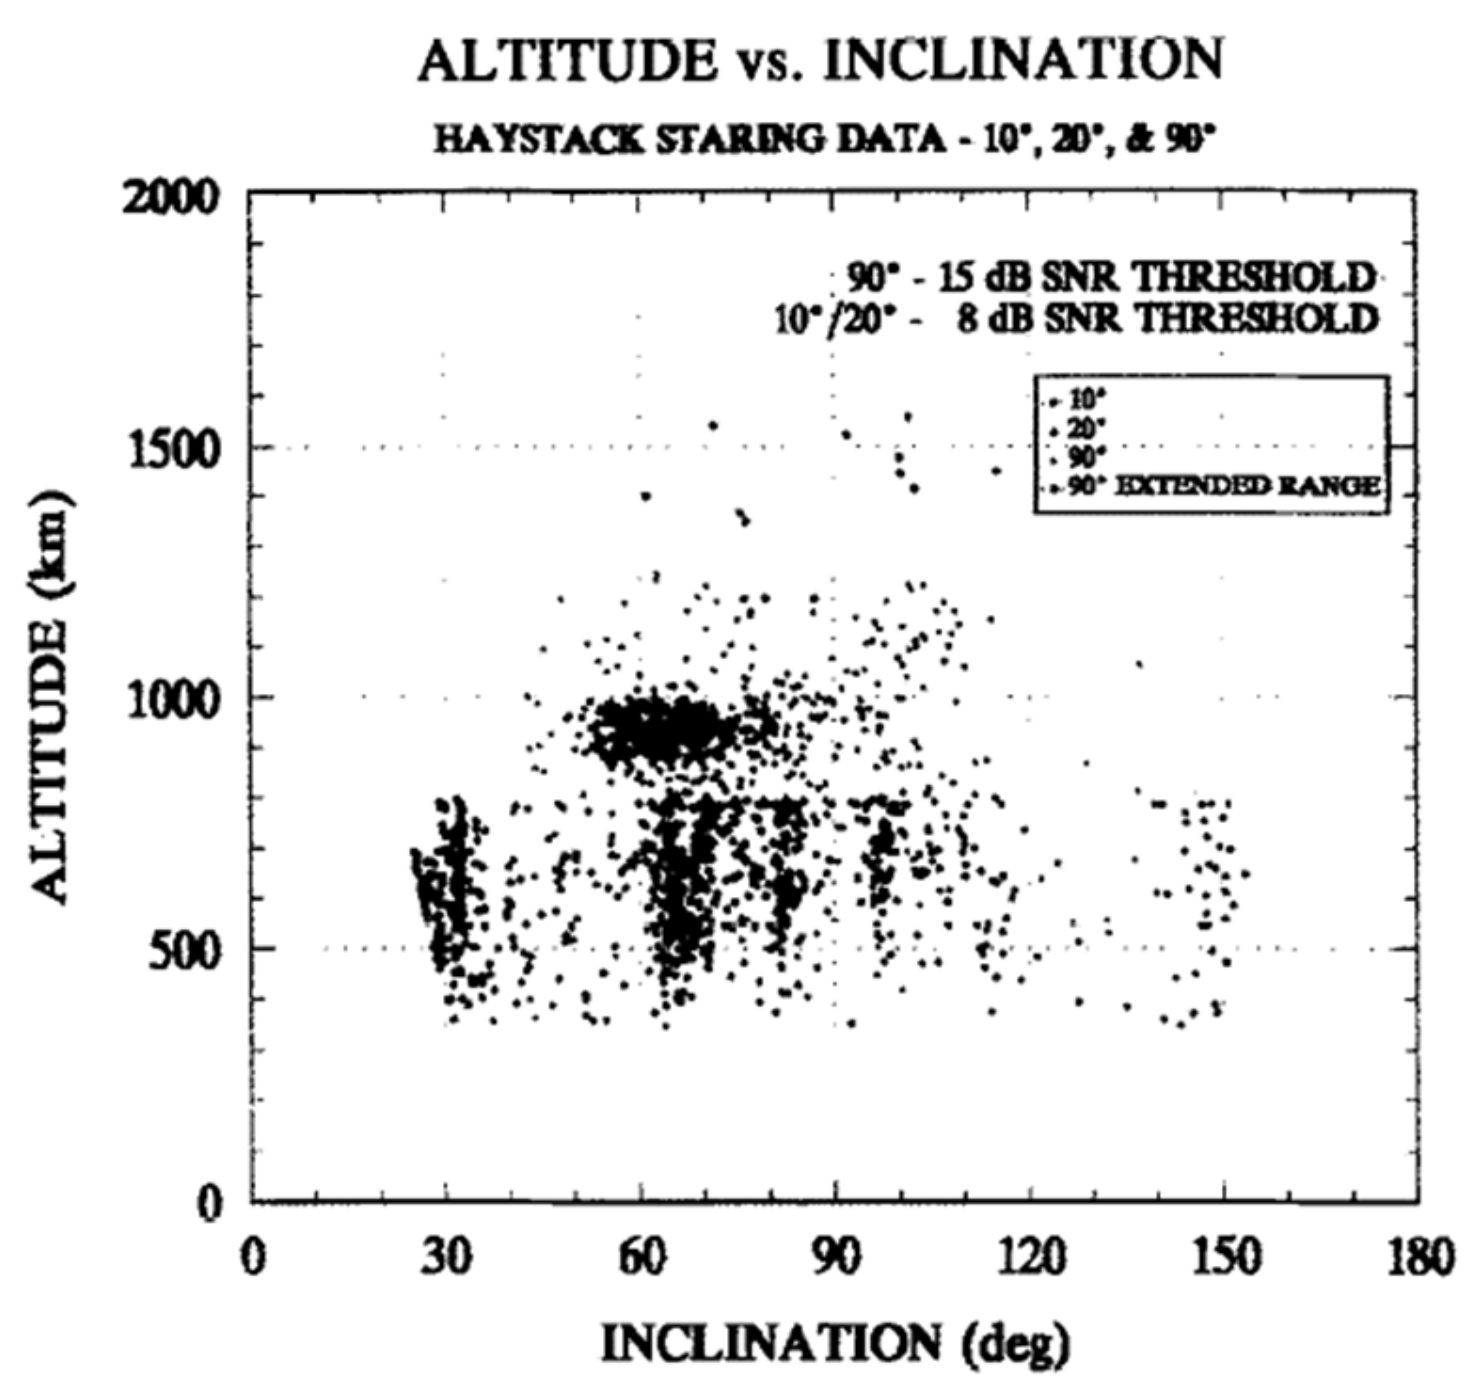
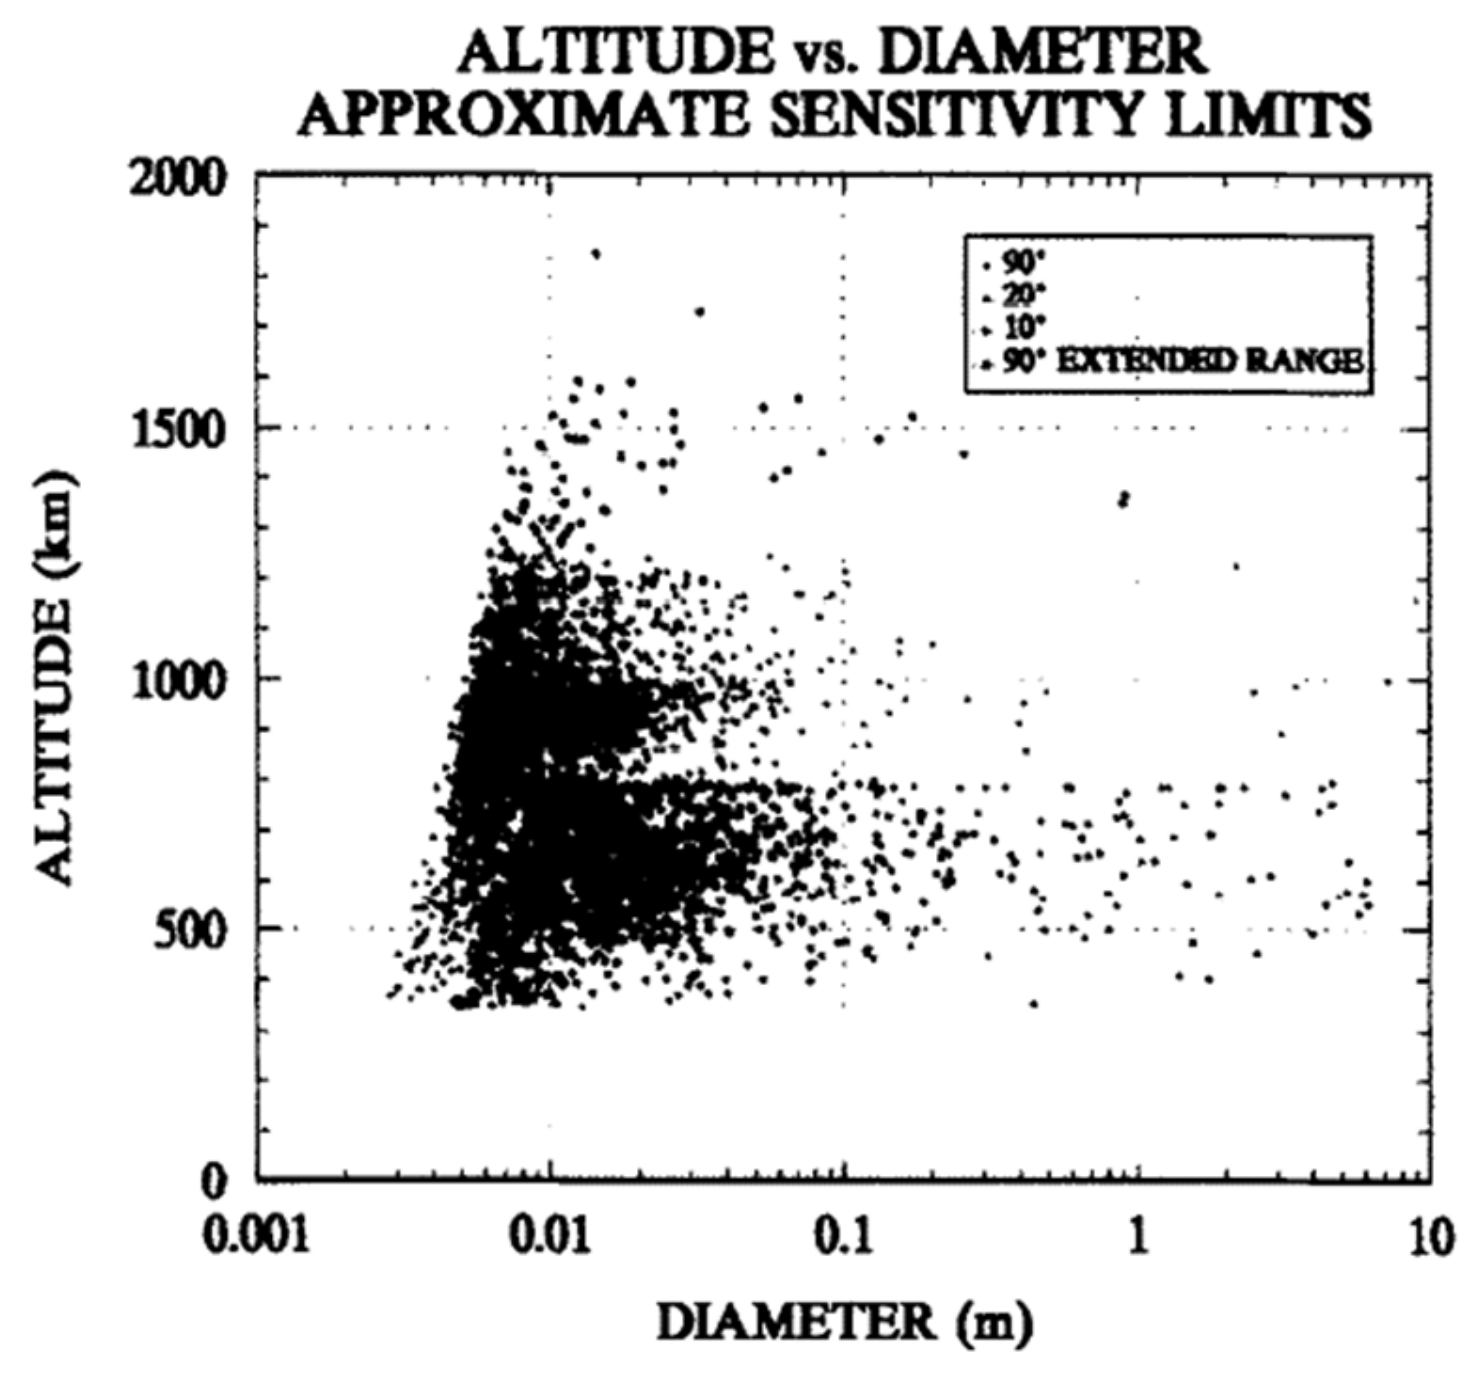
16]. The data were collected taking into account different elevation (el)/azimuth (az) angles: 90° el, 20° el/180° az, and 10° el/180° az. In 1993, two more staring angles were added: 20° el/90° az, and 90° with extended range.
Figure 4 and
Figure 5 show the results of the debris campaign in terms of altitude vs. inclination and altitude vs. diameter. The debris are clustered between 350 and 1600 km altitude, with diameters between 0.003 m and 7 m.
Data from the latter measurement campaign, after the insertion of the two additional staring angles, were integrated with the debris population detected by the Haystack Auxiliary radar (HAX), after 1993. The HAX is a 12 m parabolic dish also located in Tyngsboro [
18]. Its operating frequency is higher than the Haystack, at 16.7 GHz, and it is able to transmit a circularly polarized signal with a peak power of 40 kW [
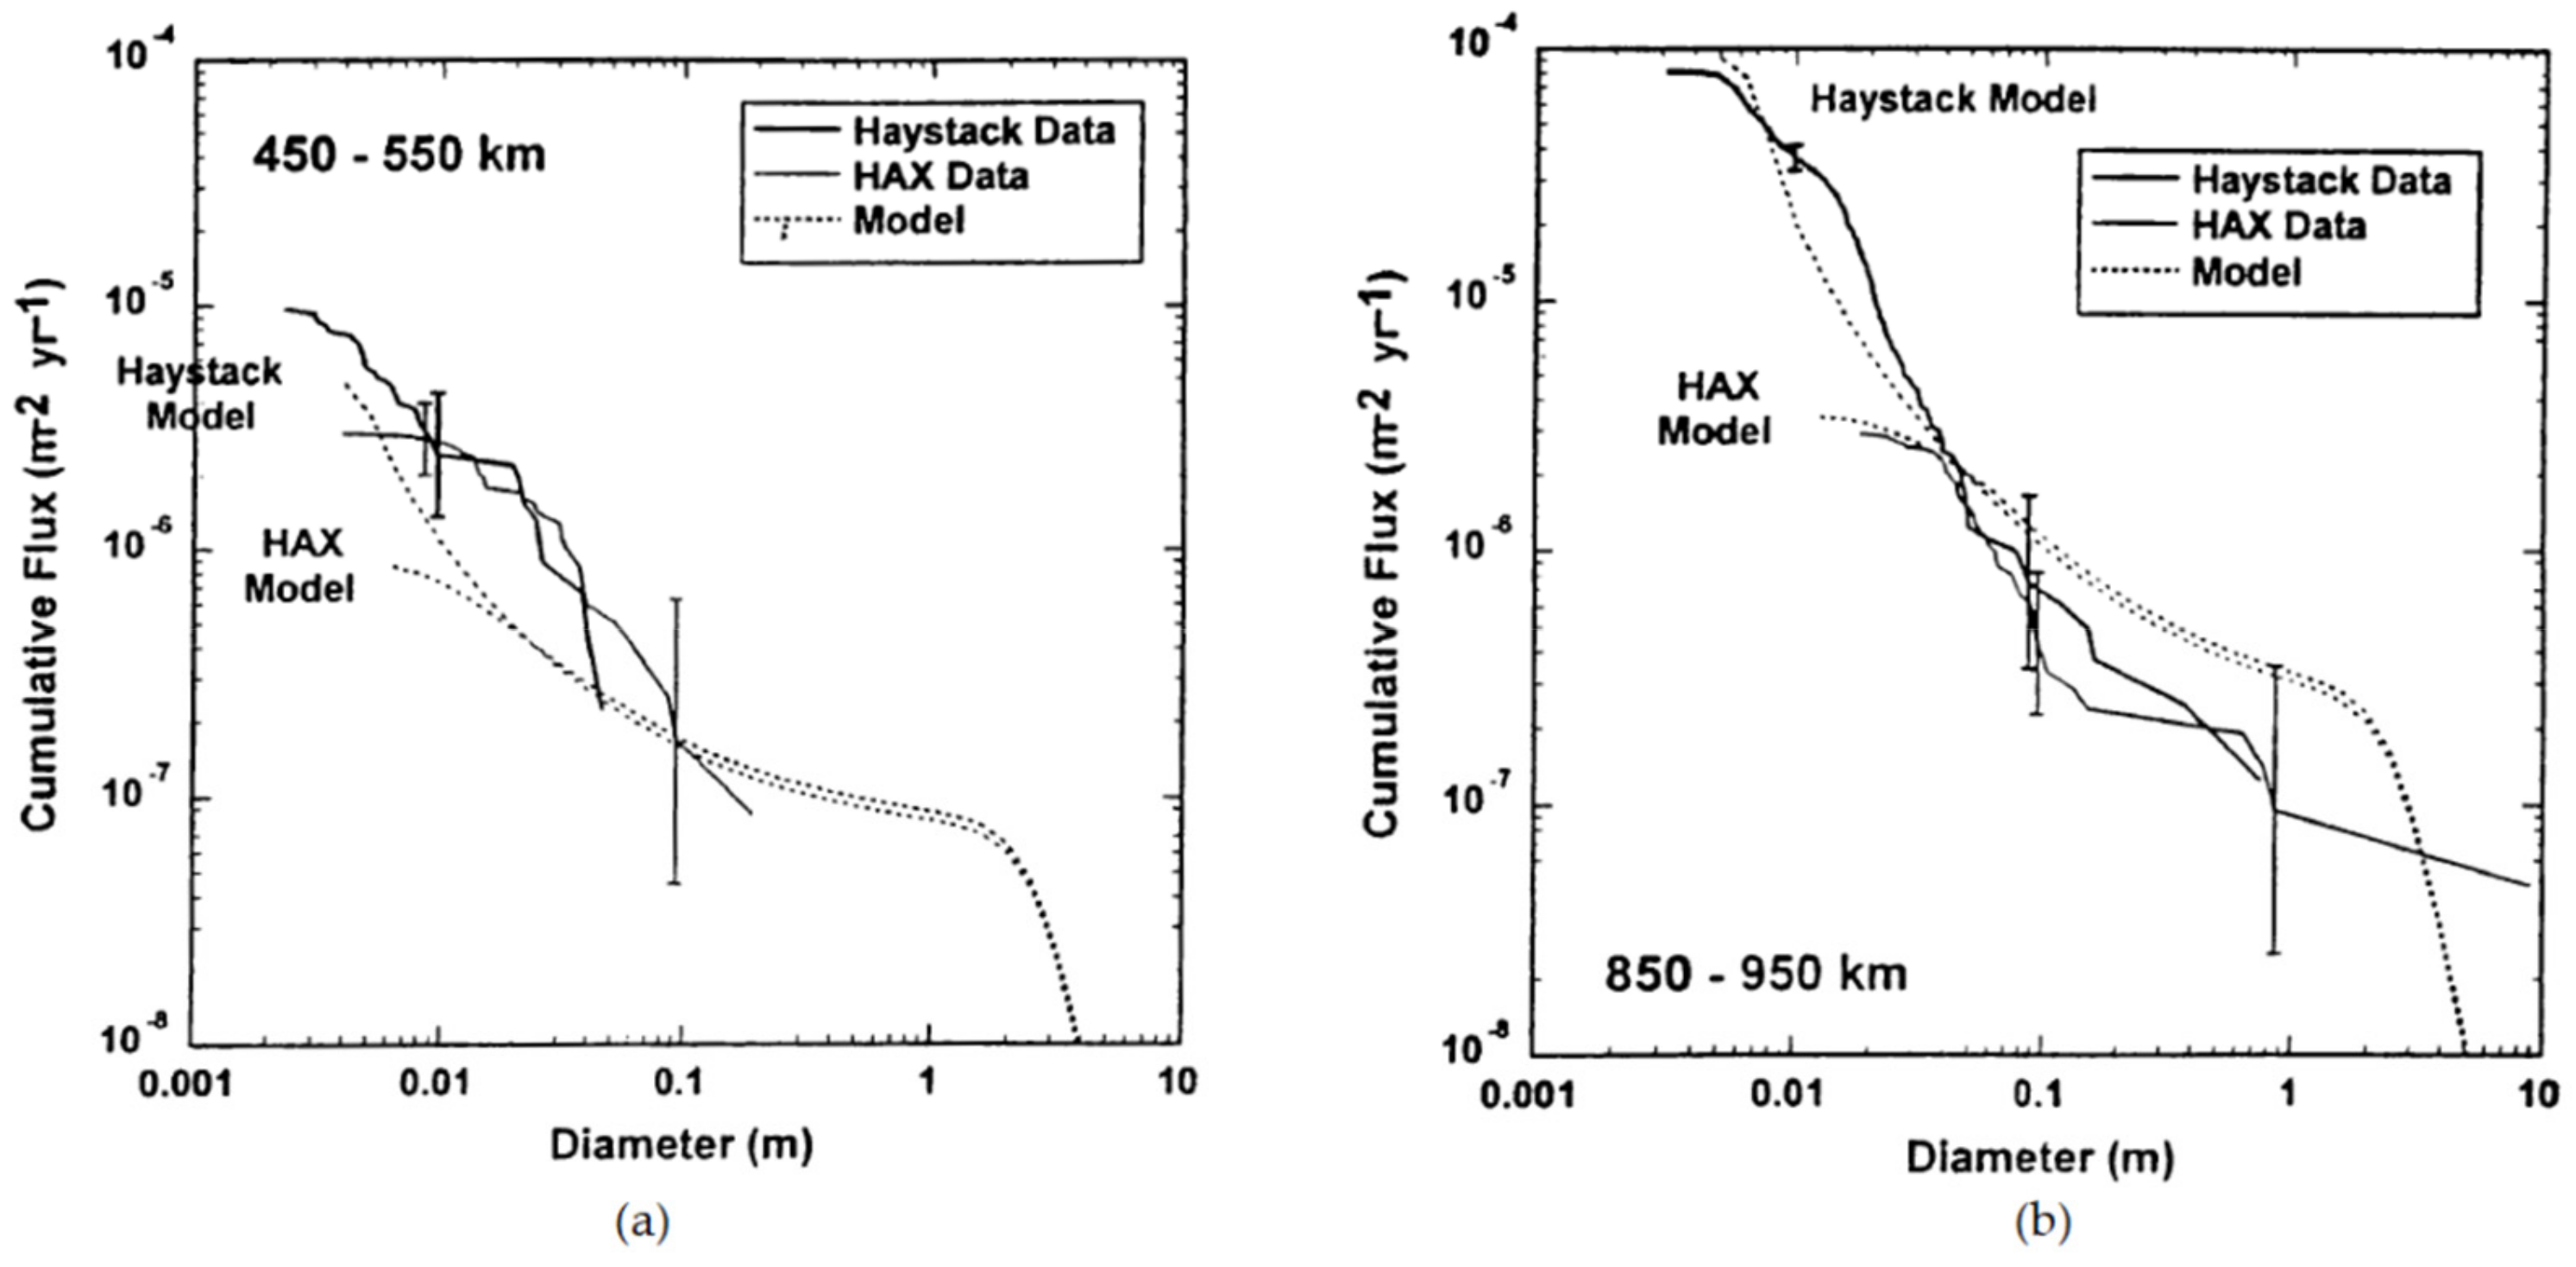
18]. The HAX is complementary to the Haystack radar, having a wider field of view but less sensitivity. An aggregate of 263.1 h of data collected by the Haystack radar (with 75° el/90° az pointing angle) and 372.1 h of data collected by the HAX in 1994, were compared in terms of debris flux and discrimination from altitude intervals. In
Figure 6, the debris flux measurement comparison between the two collected populations is shown as a function of debris diameter.
The model reported in these figures refers to ORDEM96 and the old NASA debris environmental model. Specifically,
Figure 6a shows an overlap of the Haystack and HAX curves for sizes from about 1 to 4 cm; however, below 1 cm the HAX curve starts to flatten (which indicates a zero detection probability), whereas the Haystack curve maintains its slope until 3–4 mm. On the other hand, in
Figure 6b, the overlap occurs for diameters from about 4 to 70 cm.
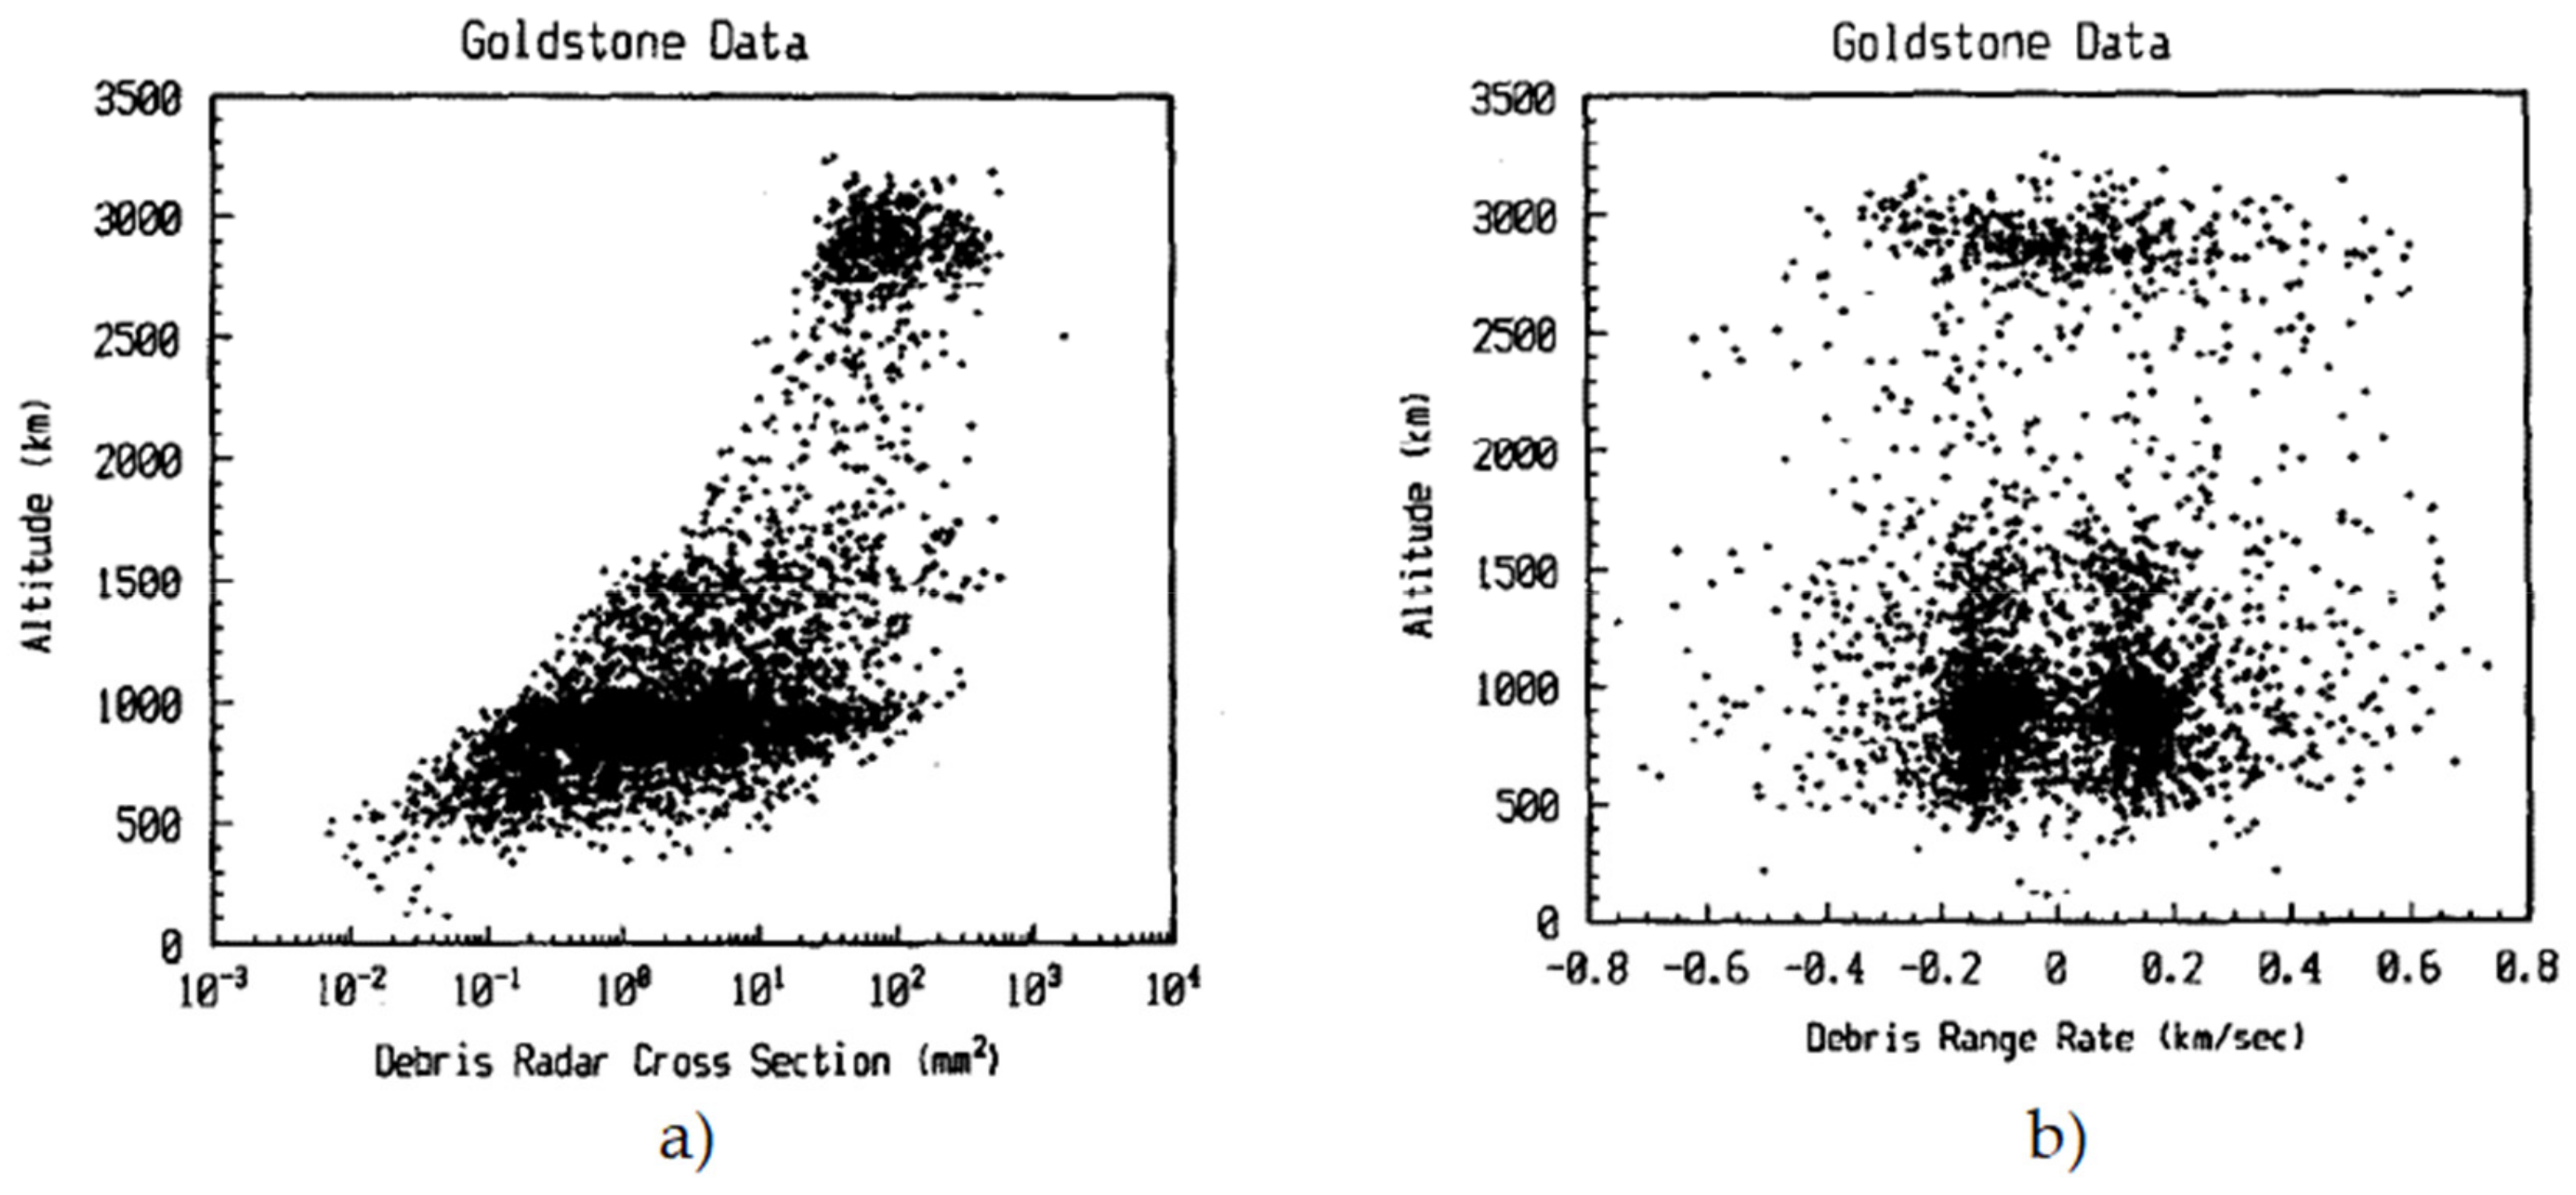
The radar measurements from the Haystack and HAX radars have been compared with those from a facility that is not canonically recognized to be part of the debris SSN: the Goldstone radar. The Goldstone radar has already been employed for several debris campaigns. The Goldstone observatory consists of several parabolic dish antennas, the most relevant of which is the Goldstone Solar System Radar (GSSR), a powerful 70 m dish transmitter working in X-band (8.56 GHz) that provides a circularly polarized signal with a peak power of about 500 kW [
19]. Between October 1994 and May 1997, using the GSSR and a 35 m parabolic antenna as a receiver (one of the receivers located at Goldstone complex) in beam-park mode, about 110 h of observation and 3476 detections were collected [
20,
21]. The results of the campaign, in terms of debris RCS and debris range rate vs. altitude, are summarized in
Figure 7. It can be noted that there is a lack of sensitivity of the bistatic configuration below a 300 km altitude. This is due to the geometry of the intersecting beams; in fact, the overlapping of the latter starts from a 280 km altitude [
21].
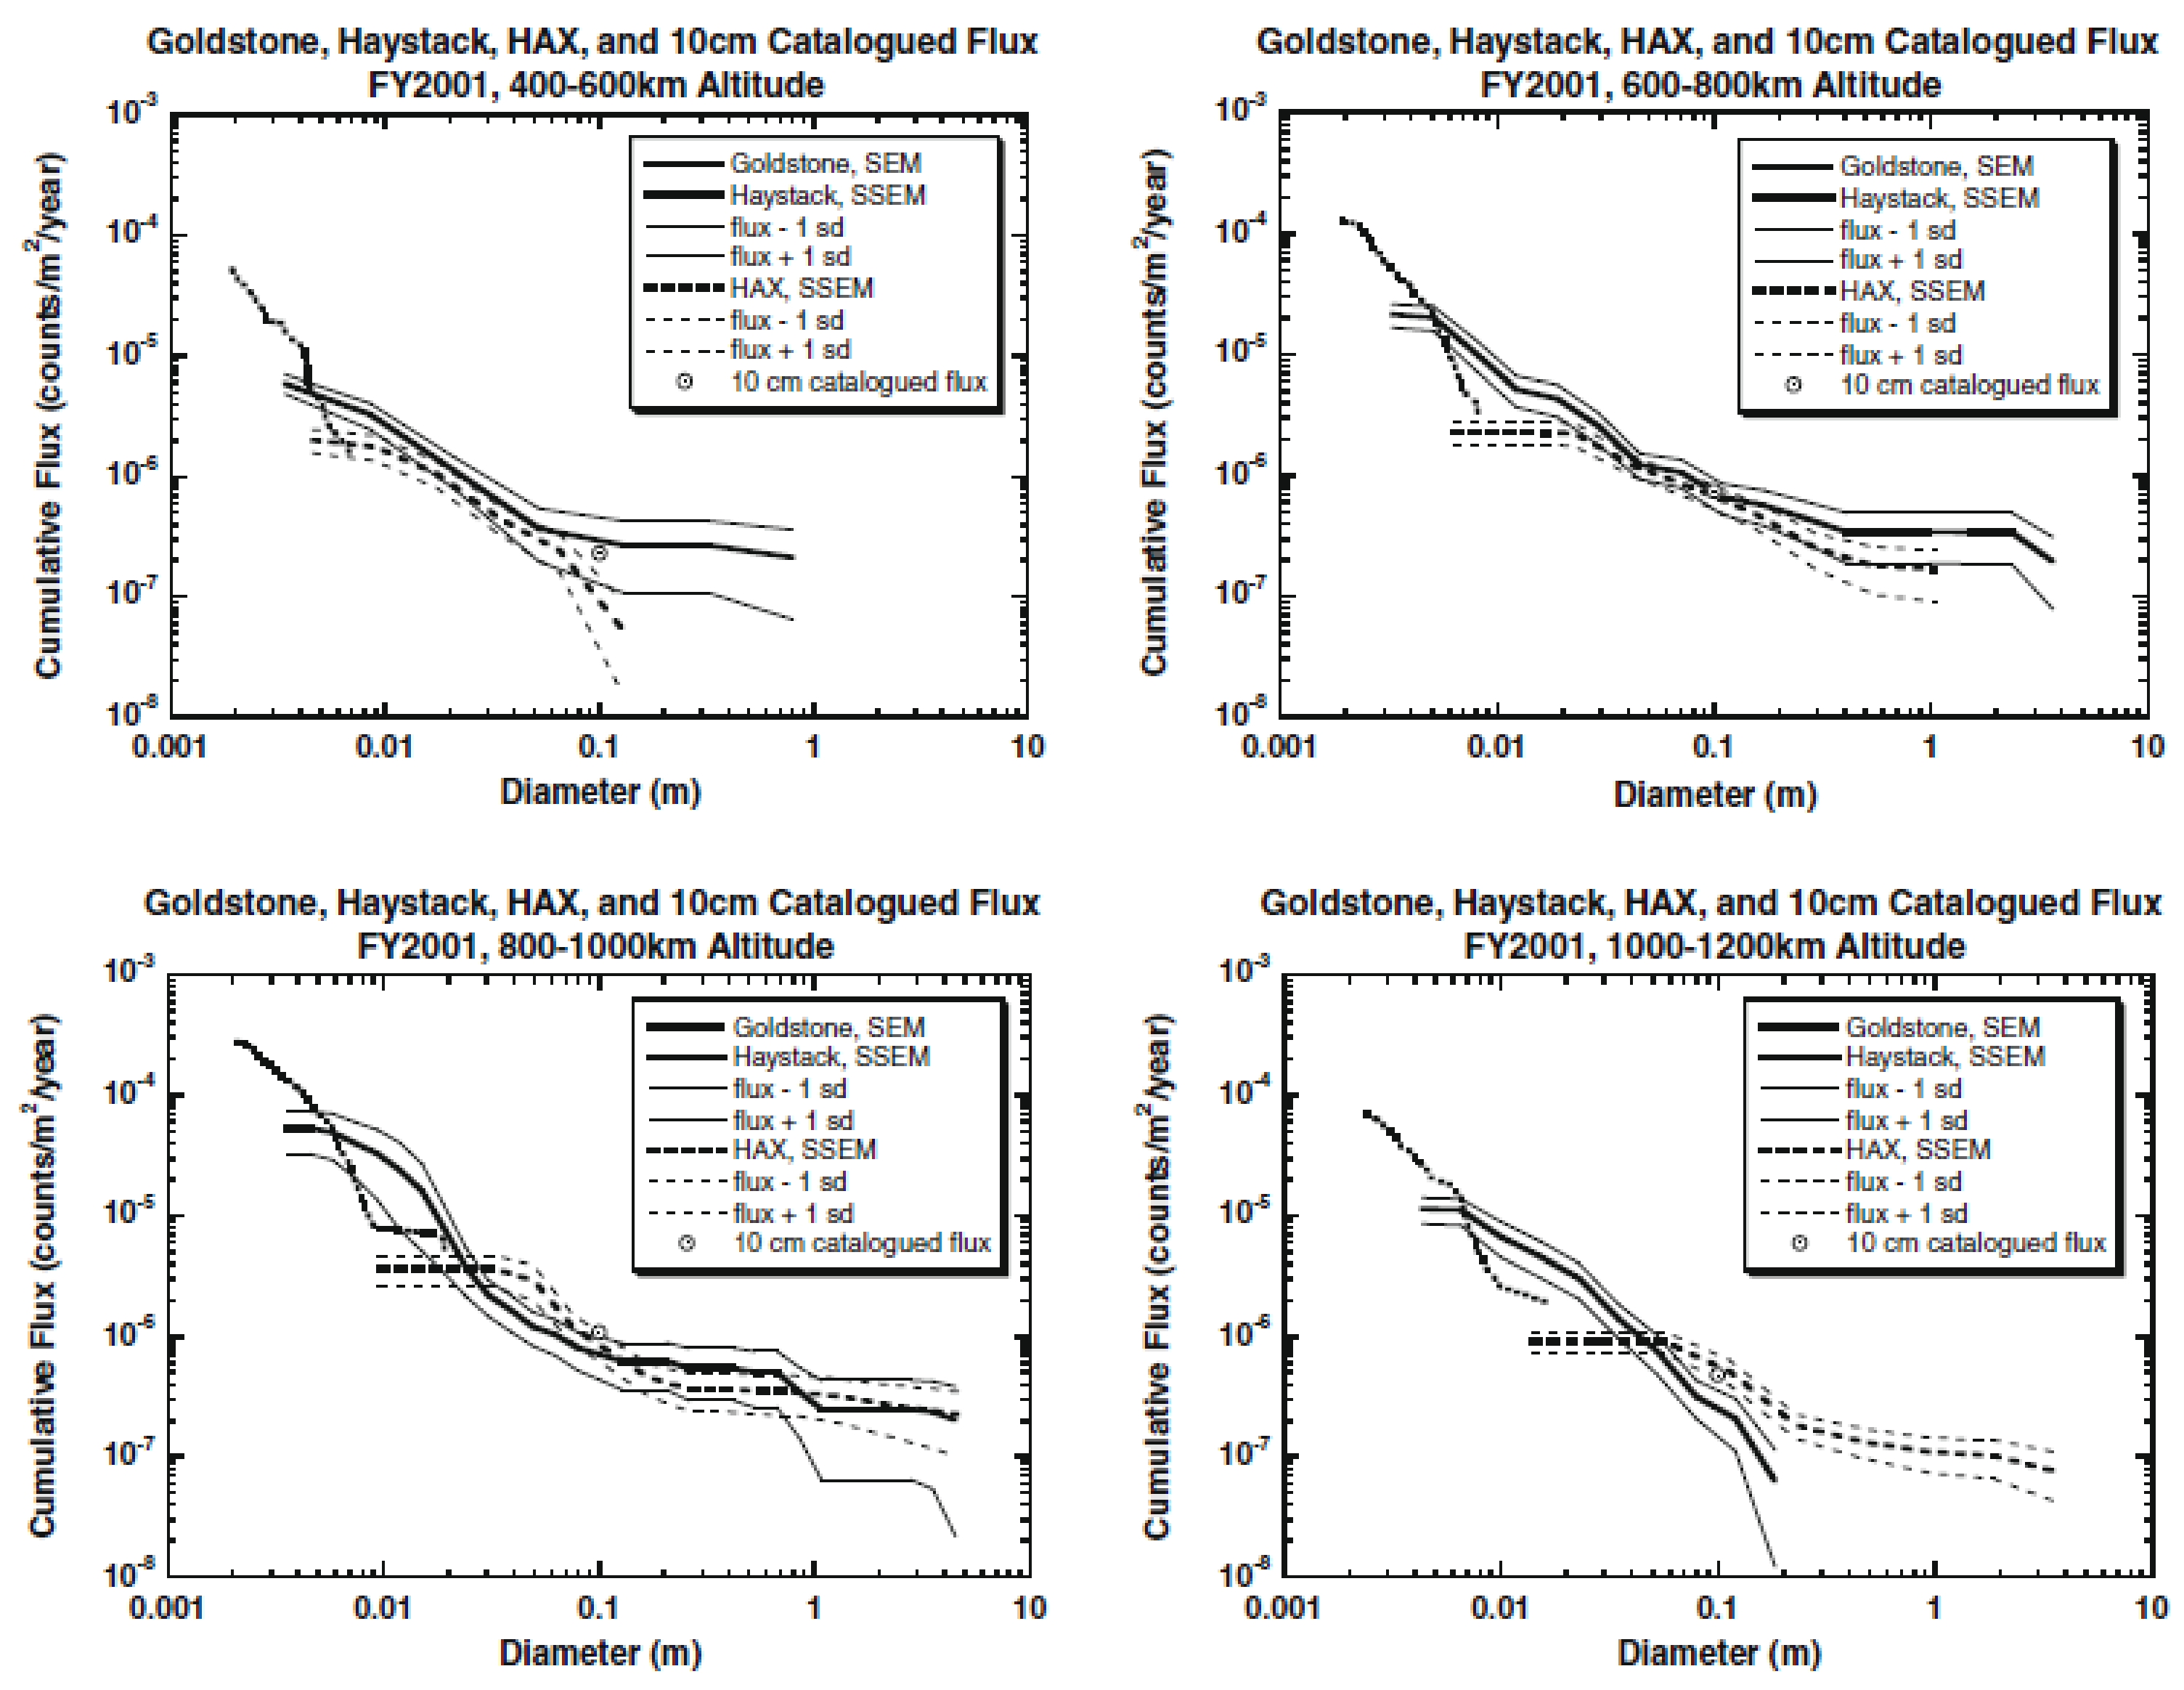
A similarity with a family of debris detected also by the Haystack radar was spotted near a 900 km altitude. This probably led to the following comparison between the Haystack radar, HAX, and Goldstone radar debris measurements, proposed in [
22]. The three radars cover different debris size intervals with partial superposition: the Haystack radar generally detects debris in the size range of 5 mm to several meters, the HAX radar from 2 cm to several meters, and finally the Goldstone radar observes objects between 2 mm and 1 cm [
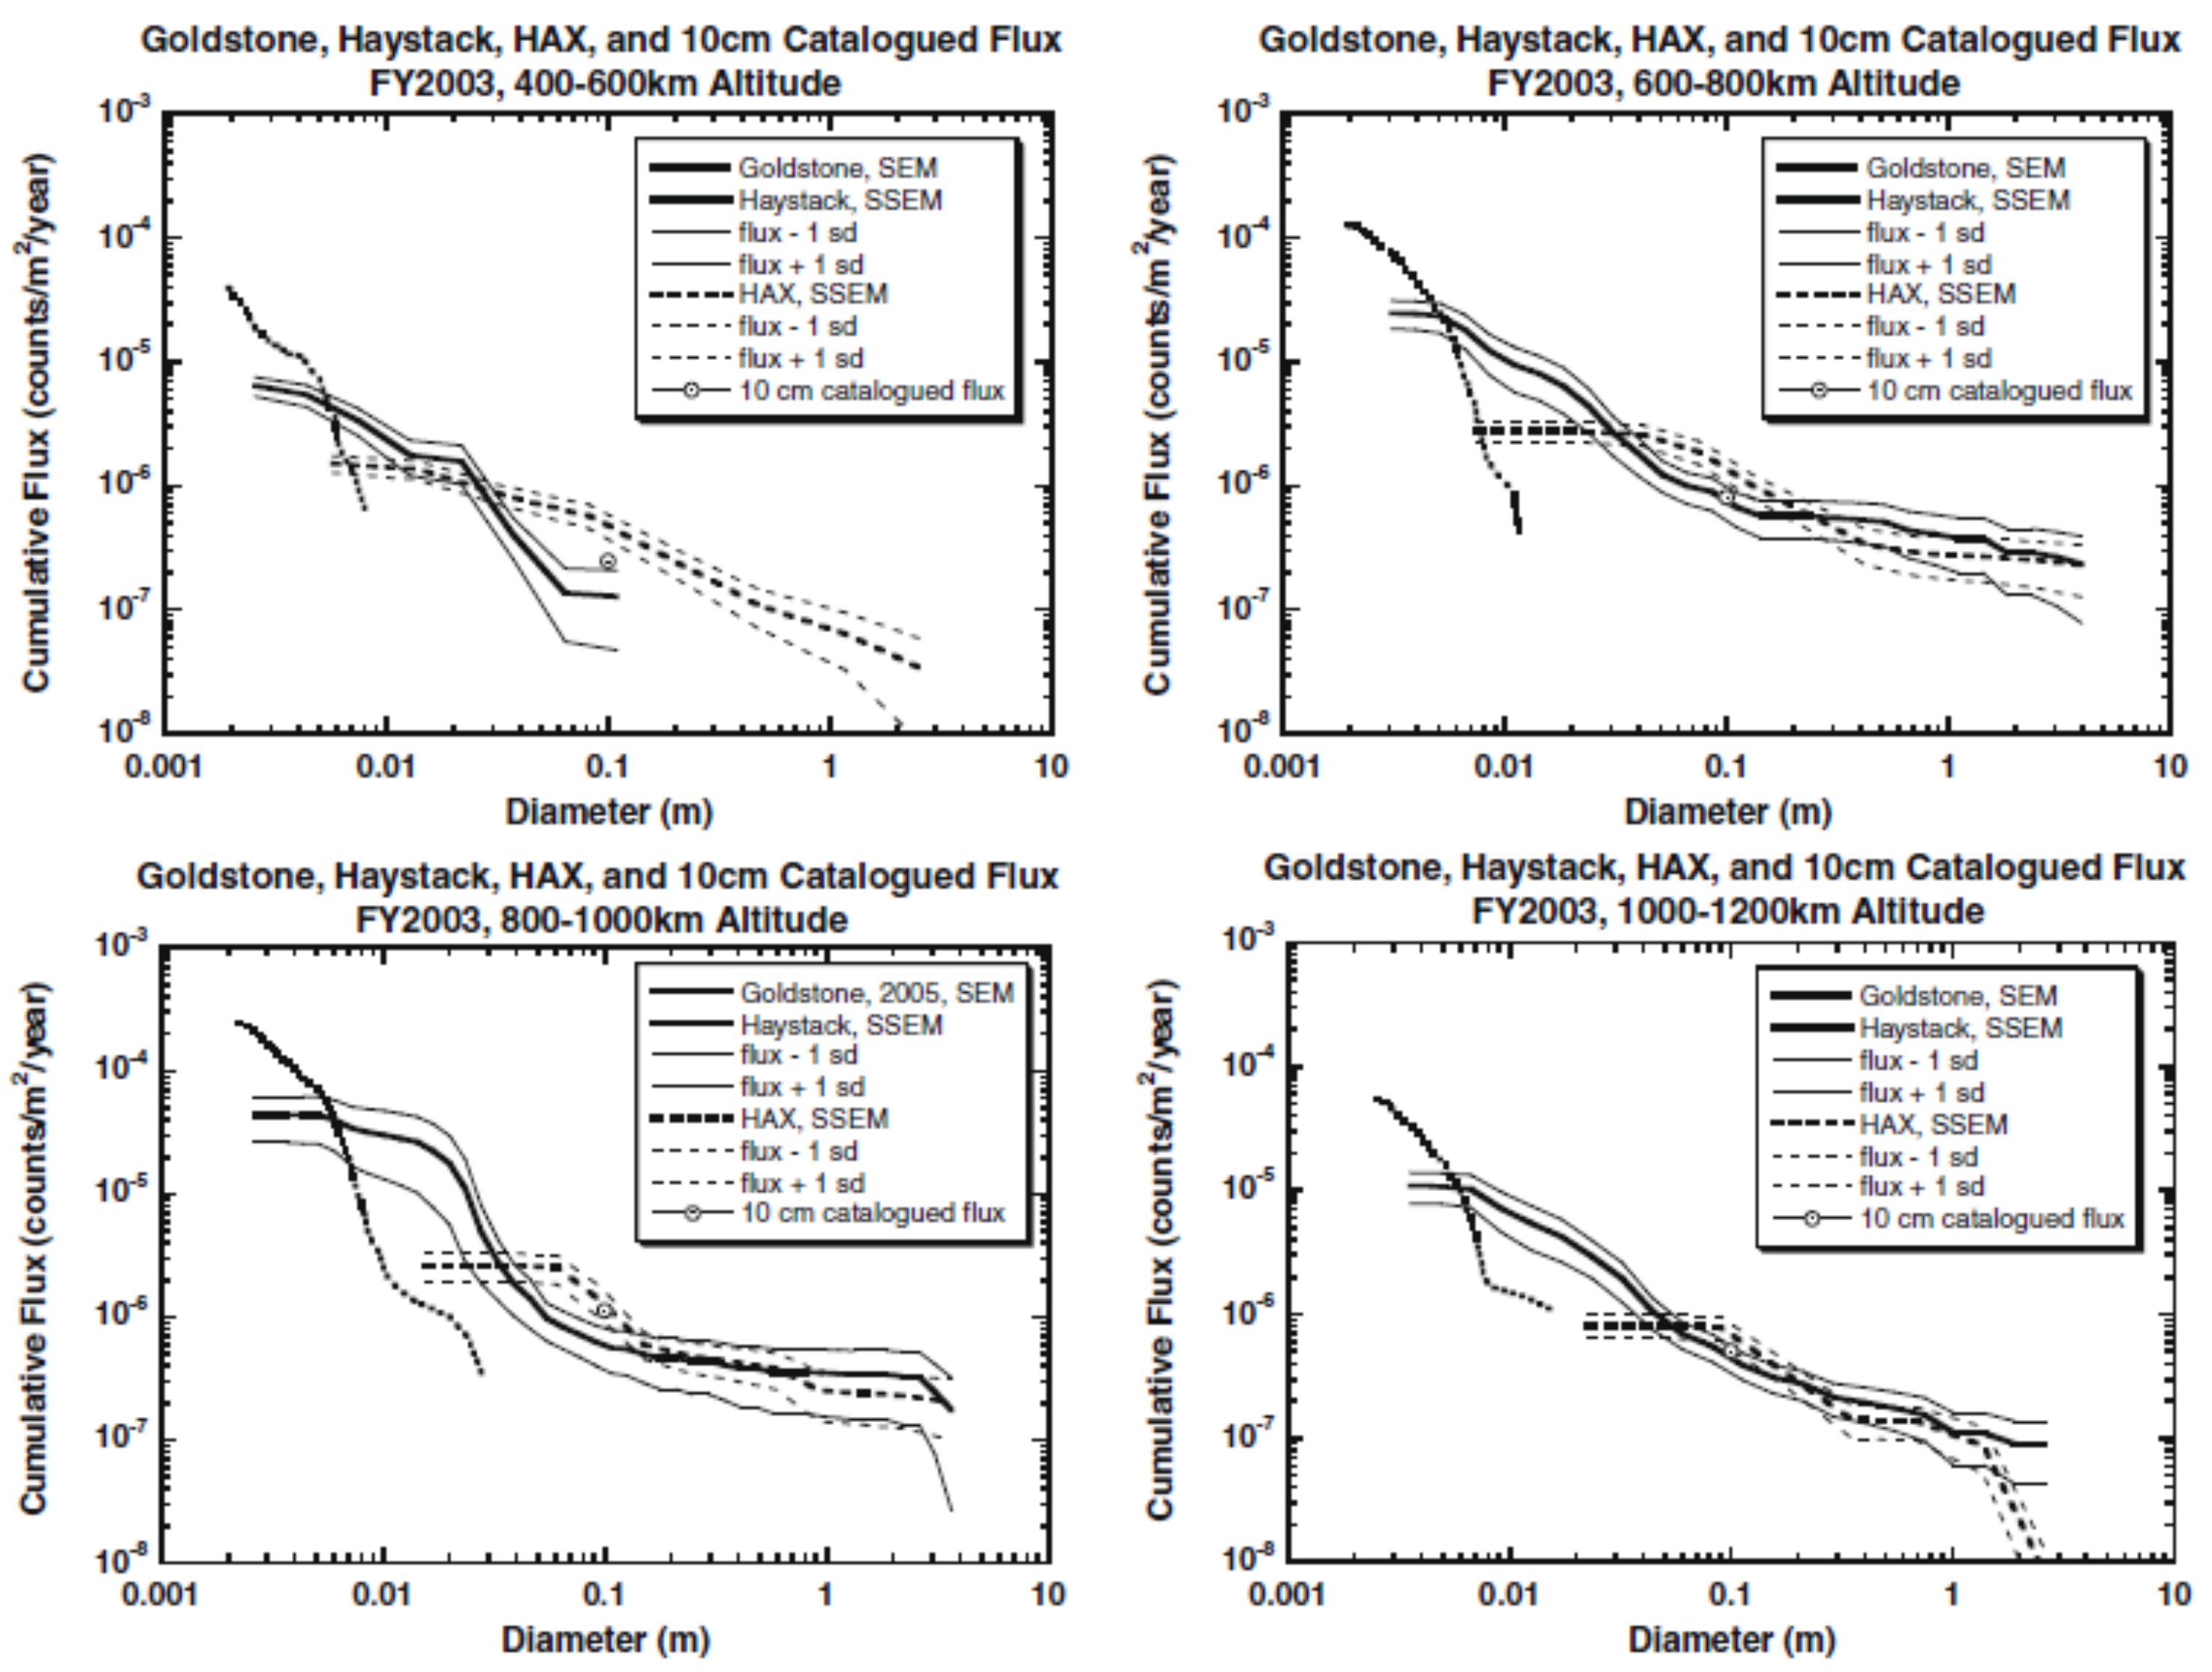
22]. The debris flux over the debris diameter for all three radars during three different years tied to solar activity (1998, 2001, and 2003) is presented.
Solar activity is believed to play an important role in the reentry of orbital debris resident in LEO due to its influence on atmospheric drag [
22]. All the measurements were performed in beam-park mode, with Haystack and HAX radar pointing east at 75° elevation, and the Goldstone radar pointing near the zenith. The results of the joint campaign are reported in
Figure 8,
Figure 9 and
Figure 10.
There are some clarifications to be made. Since there is no data derivable from Goldstone radar from 2002 to 2004, in
Figure 10 the Haystack and HAX radars’ data are compared with 2005 Goldstone data. The global data is also compared with the 10 cm catalogued population provided by the US SSN. Moreover, despite the premise, the data of the fiscal year 1998 from HAX radar was collected from a point near the zenith. This explains the lack of detections by HAX radar between 400 and 800 km altitude. A lower sensitivity in detecting small objects can be noticed for all radars; however, a major impact is observable for the Goldstone radar data above 8 mm when compared to the Haystack. This is due to a signal saturation problem. It must also be taken into account that there is a reduced capability to detect objects smaller than 1 cm and 4 cm, respectively, for the Haystack and HAX radars in 2003 data, due to some malfunction in the data acquisition system (which the two facilities share).
Further important joint campaigns involving the US SSN sensors were organized by the Inter-Agency Space Debris Coordination Committee (IADC), an international association that includes the most important space agencies of the world with the common goal of facing the debris problem [
23]. Some of them involved the AN/FPS-108, also known as Cobra Dane. Cobra Dane is a phased array radar, part of the US SSN as a collateral sensor [
24], located on Shemya Island (Alaska) [
25]. The radar operates in the L-band (1.215–1.400 GHz). It is capable of transmitting a peak power signal of 15.4 MW (0.92 MW average) through its 15,360 active elements. These features allow the detection of a number of objects ranging from 100 to 1000 in 24 h [
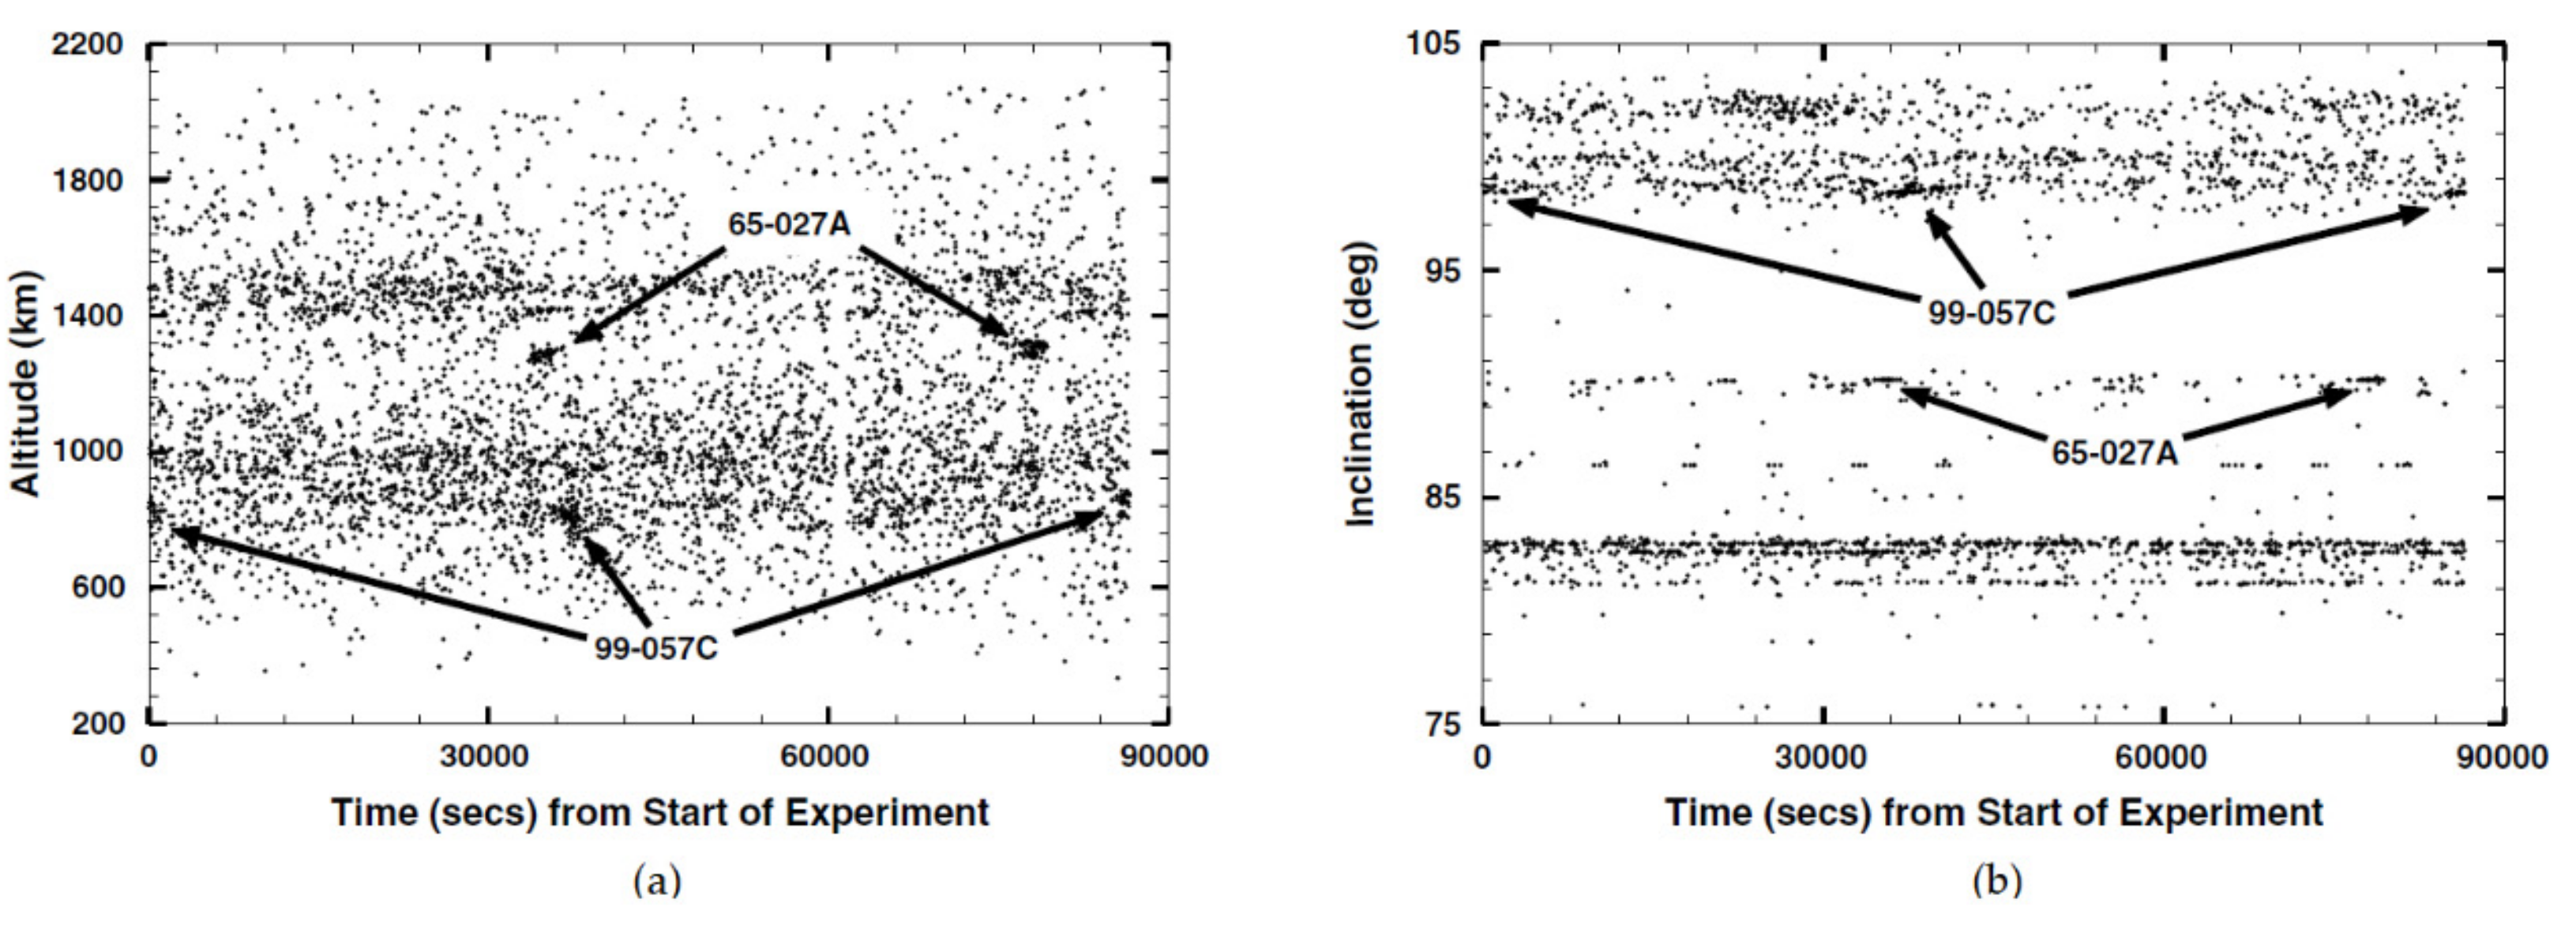
26]. Cobra Dane was employed in the US 2000 Beam Park Experiment (BPE), together with the TRADEX and a Ground Base Radar-Prototype (GBR-P) at KREMS, and the Haystack and HAX radars at Lincoln Space Surveillance Complex, for 24 h in stare-and-chase mode, and it was able to detect, among other objects, two specific families of debris [
26]. The results of the 2000 BPE Cobra Dane campaign are reported in
Figure 11 in terms of the altitude and inclination of the debris as a function of the duration of the experiment. In these images, the debris clusters belonging to the families 65-027A and 99-057C are clearly visible, originating, respectively, from the 1965-027A rocket “Snapshot”, and from the third stage of a rocket that launched the satellite CZ-4 R/B. Another 24 h campaign, also hosted by the IADC, was performed in September 2004 [
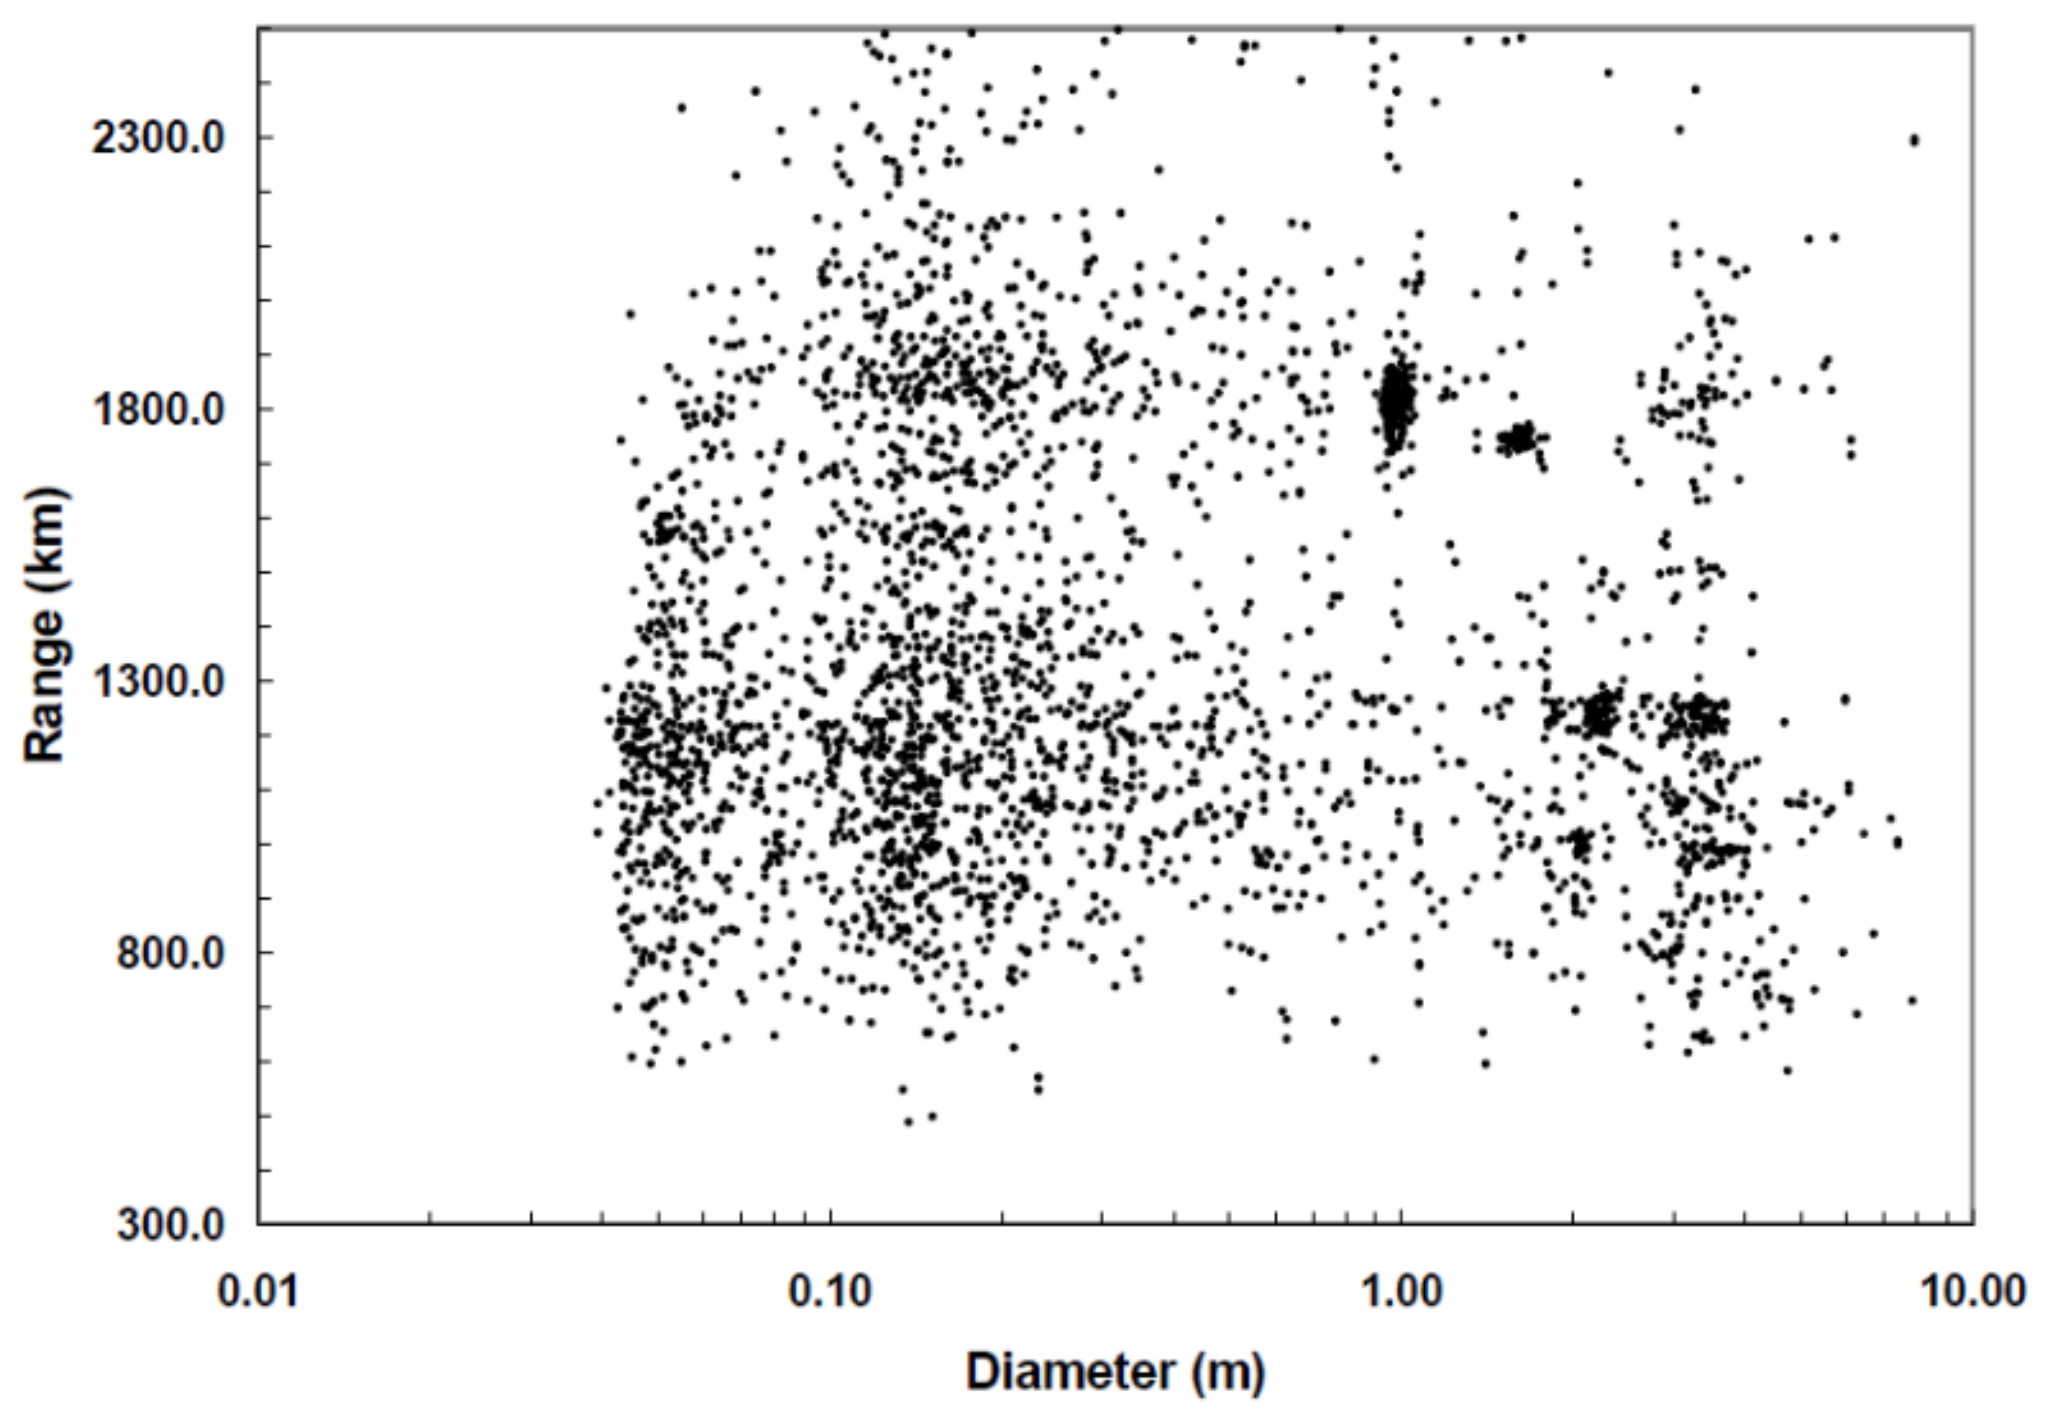
25]. This time Cobra Dane was able to detect 3400 objects (some with multiple detections). The results of the 2004 campaign are reported in
Figure 12, which shows the range vs. diameter of the debris. In this figure, a dense cluster of debris is noticeable around 1800 km range, which includes fairly large objects (1 m diameter).
All the above facilities can be considered as collateral sensors. On the other hand, there is not much available material in the open literature regarding the debris radar measurements performed by the dedicated sensors of the US SSN. One of the few works that provides clear and readable results is focused on the AN/FPS-85 multifunction bistatic phased array radar, located at Eglin Air Force Base in northwest Florida [
27,
28]. The transmit array of the AN/FPS-85 works in the UHF-band at an operative frequency of 442 MHz with 10 MHz bandwidth. It is composed of 5184 identical transmitter modules lined up in a 72 × 72 grid. Its main characteristics include a peak power of 30 MW and average power of 10 kW, a 1.4° beamwidth at boresight, and a variable pulse length (1, 5, 10, 25, 125, and 250 µs) in various burst waveforms. The transmitting element is a shortened dipole antenna with parasitic element director. Its receiving counterpart consists of 19,500 crossed dipoles arranged in a square grid, connected to 4660 active, identical receiver modules (the inactive elements that act as dummies are terminated). The rest of the receiving chain includes the calibration beam-steering and Local Oscillator (LO), the distribution assemblies, the calibration equipment, and the beam-forming network [
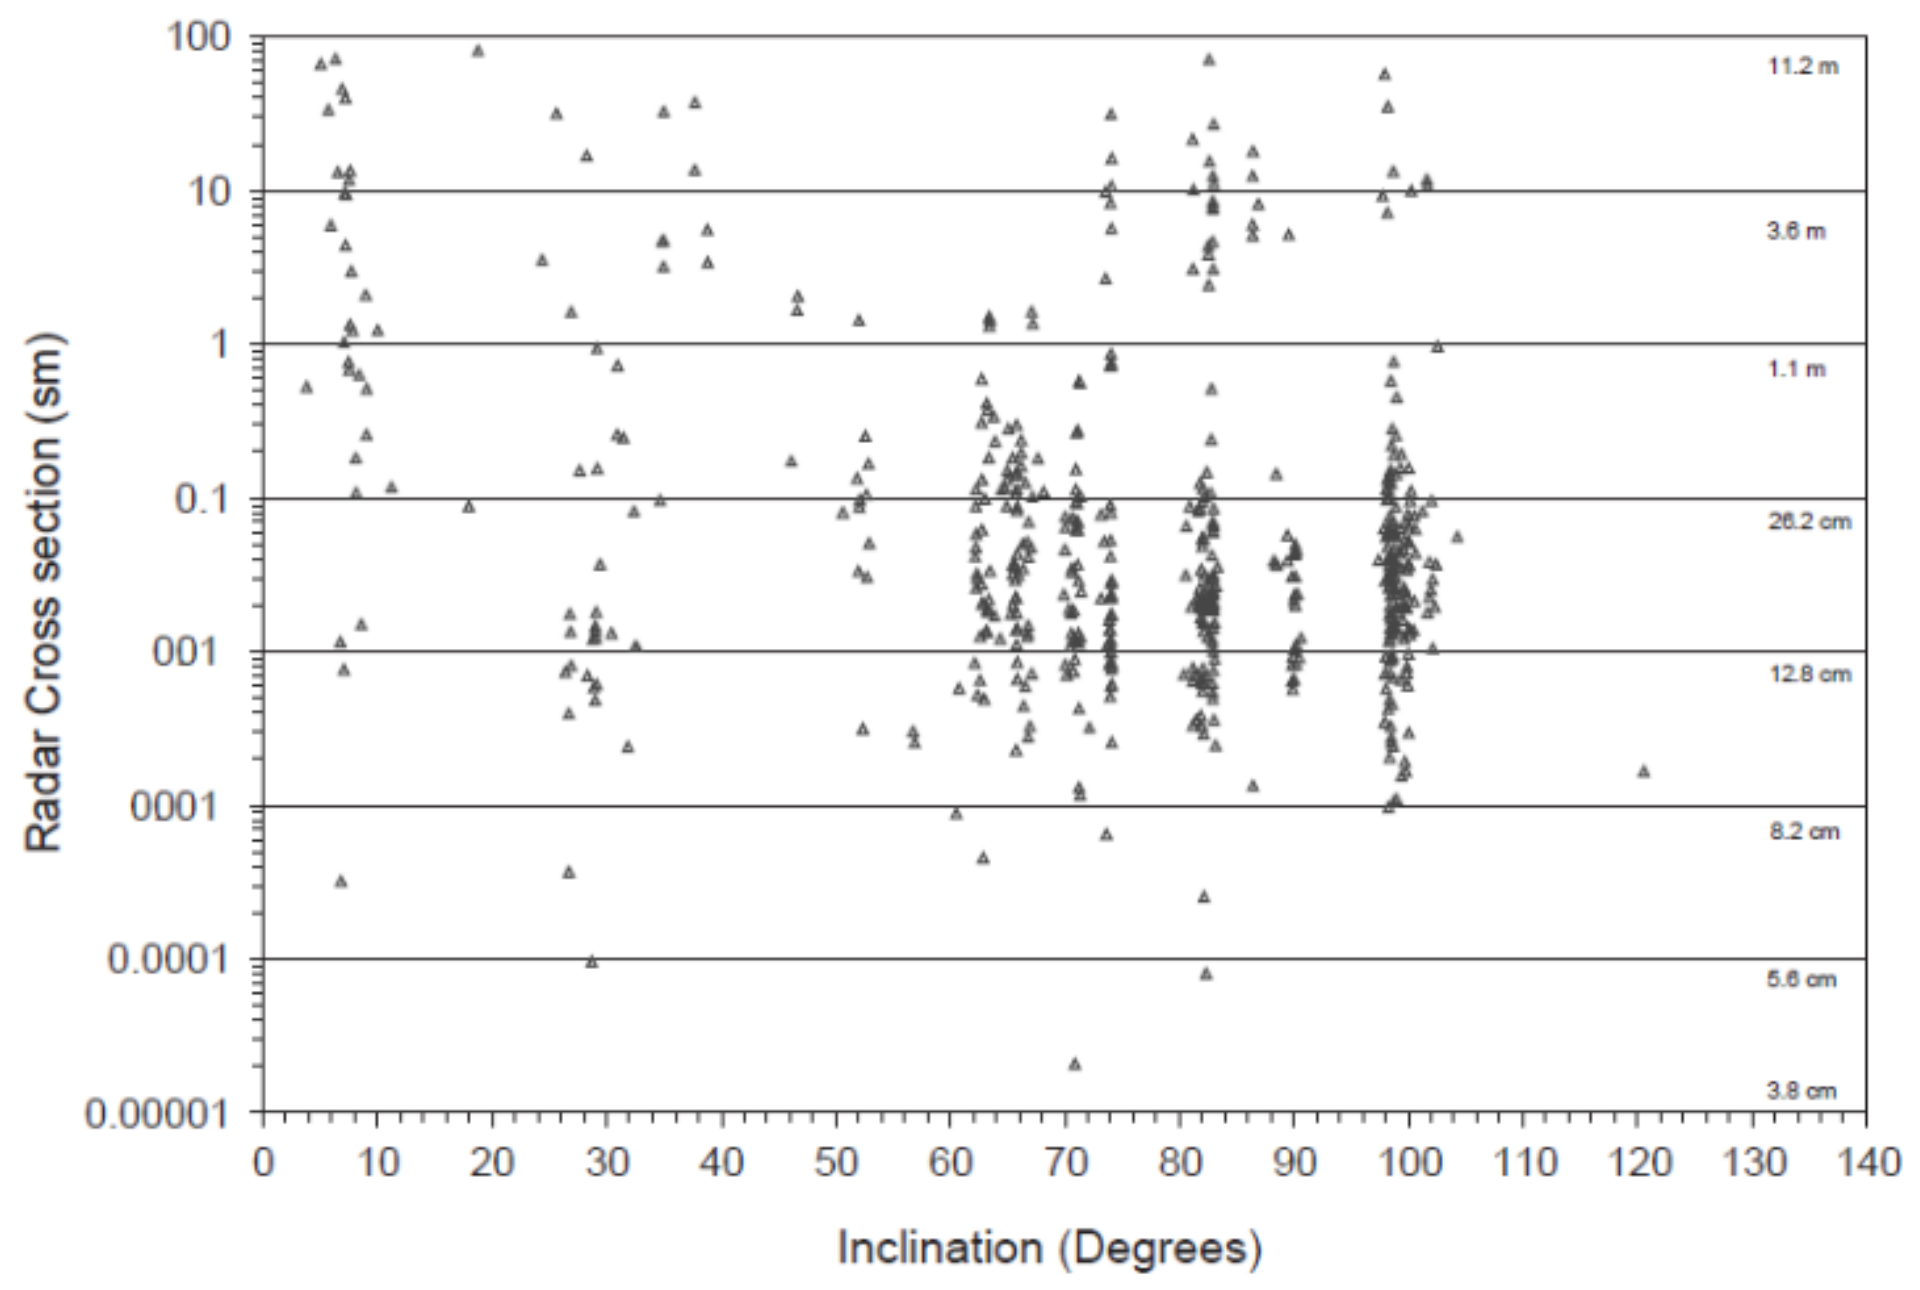
27]. On May 2000, taking advantage of the ground testing of a new software that allowed higher elevation angles, the AN/FPS-85 was employed for a two-day campaign (11 and 12 May). During this time, the phased array radar was able to detect more than 80,000 objects. With the information gathered, 599 element sets were generated, increasing the available material on catalogued objects. For the all the uncatalogued objects detected during the campaign,
Figure 13 shows RCS vs. inclination. A further analysis of the size of the objects confirmed that most debris families created from breakup events shared similar profiles [
28].
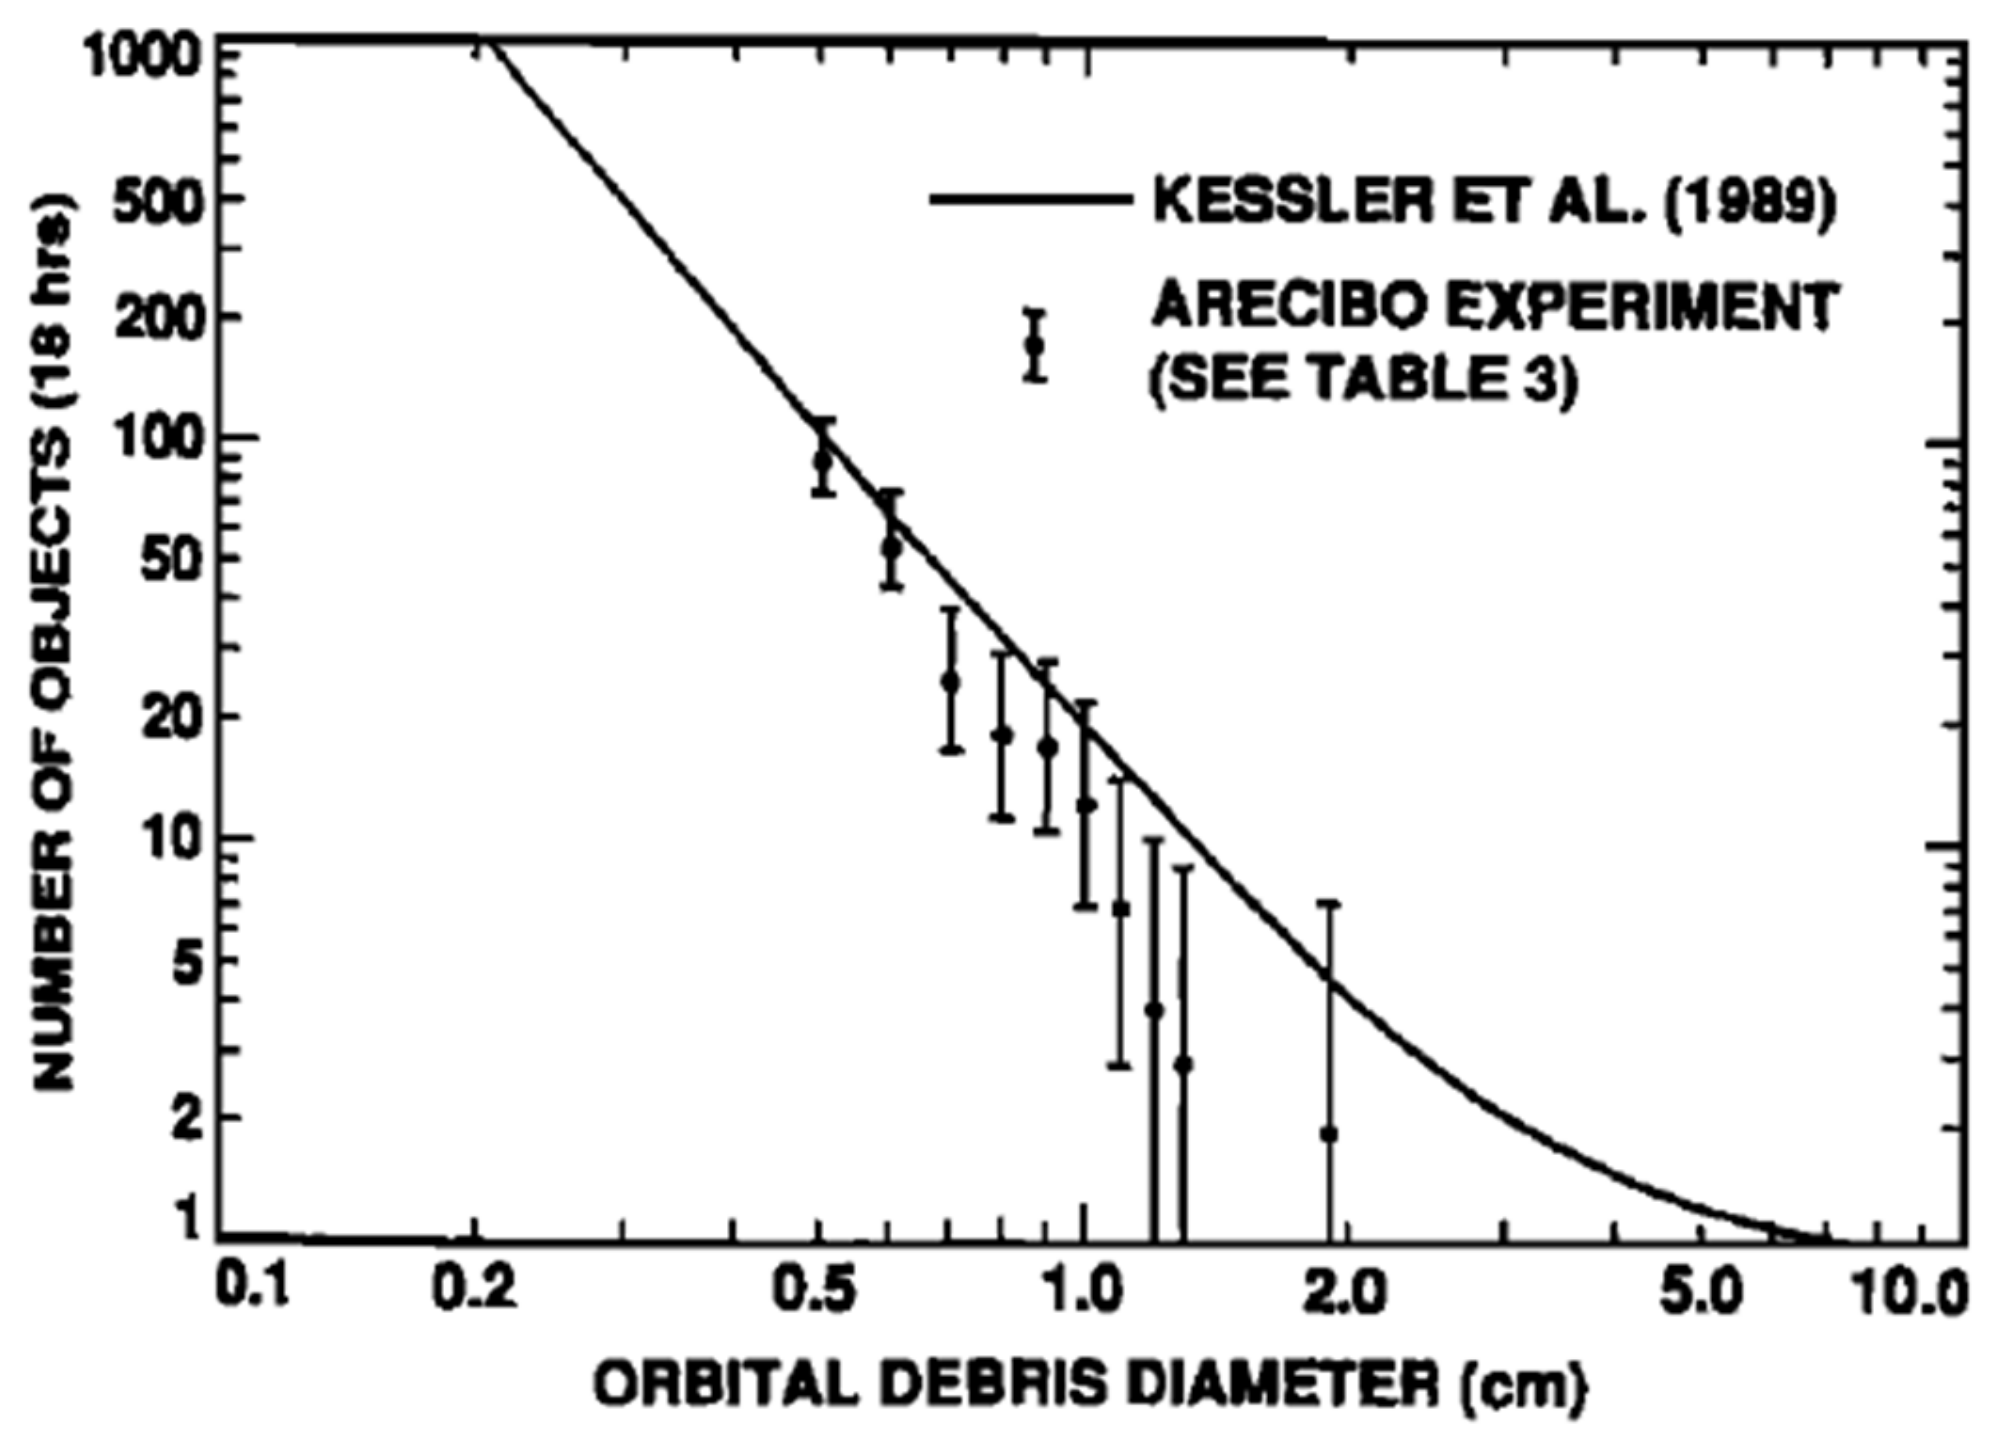
Outside of the canonical US SSN network, some experiments have been performed using radar sensors belonging to a different US government organization, the National Science Foundation (NSF), in particular. An old preliminary test on the radar detection of centimeter-sized orbital debris was made using the Arecibo Observatory radar. The Arecibo Radio Telescope is a 305 m dish located in Arecibo, on the island of Puerto Rico [
29]. The massive antenna (for years the largest in the world), mainly employed for radioastronomical research in the ionosphere, is characterized by a huge spherical Gregorian primary reflector hanging above the parabolic dish. The radar works in UHF at 430 MHz and can transmit a pulsed signal with a peak power of 2.5 MW. In late June-early July 1989, during a debris radar experiment, the Arecibo observatory collected nearly 19 h of data and detected a total amount of 90 objects with variable size between 5 and 20 mm diameter [
30]. The experiment involved the Arecibo radar as the transmitting antenna and a 3.5 m reflector auxiliary antenna (located near the main one) with a baseline of about 10 km. Transmitting and receiving antenna stared at a common point at 575 km altitude. A plot with a comparison with a prediction model of the smallest objects detected (between 0.5 and 2 cm) during the experiment is presented in
Figure 14 [
30]. Sadly, in late 2020, the NSF declared the Arecibo Radio Telescope closed due to some structural flaws. As if that were not enough, the antenna structure dramatically collapsed on itself on December 2020.
The other notable radar for space debris form NSF is the Advanced Modular Incoherent Scatter Radar (AMISR). The AMISR system is a modular, remotely operated, UHF phased array radar built in a panel-like fashion that is deployed in various locations: one of them operates at the Poker Flat Research Range in Alaska (it is named the Poker Flat Incoherent Scatter Radar of PFISR); two systems are located in Resolute Bay in Canada; and smaller AMISR are used in Gakona (Alaska) and at the Jicamarca Radio Observatory (Peru) [
31,
32]. The AMISR systems are highly modular; each panel is composed of 32 Antenna Element Units (AEUs), in the form of resonant crossed-dipoles, and is connected to Panel Control Unit (PCU) for state control and monitoring. For every 16 panels within the system, the feeding power is provided through a Utility Distribution Unit (UDU), so that the peak power scales with the number of panels used. The whole system is controlled via an Operation and Control Center (OCC) that houses data acquisition channels, transmission waveform generators and RF signal receivers. The AMISR system works in UHF in the 430–450 MHz range, each panel is characterized by a 16 kW peak power, a 5.6 m
2 antenna aperture, and a 20-dBi gain, and it is capable of detecting a 13 m object at 500 km range. A standard AMISR face is comprised of 128 panels and its detection capabilities are enhanced to a 3 cm object at 500 km range [
31,
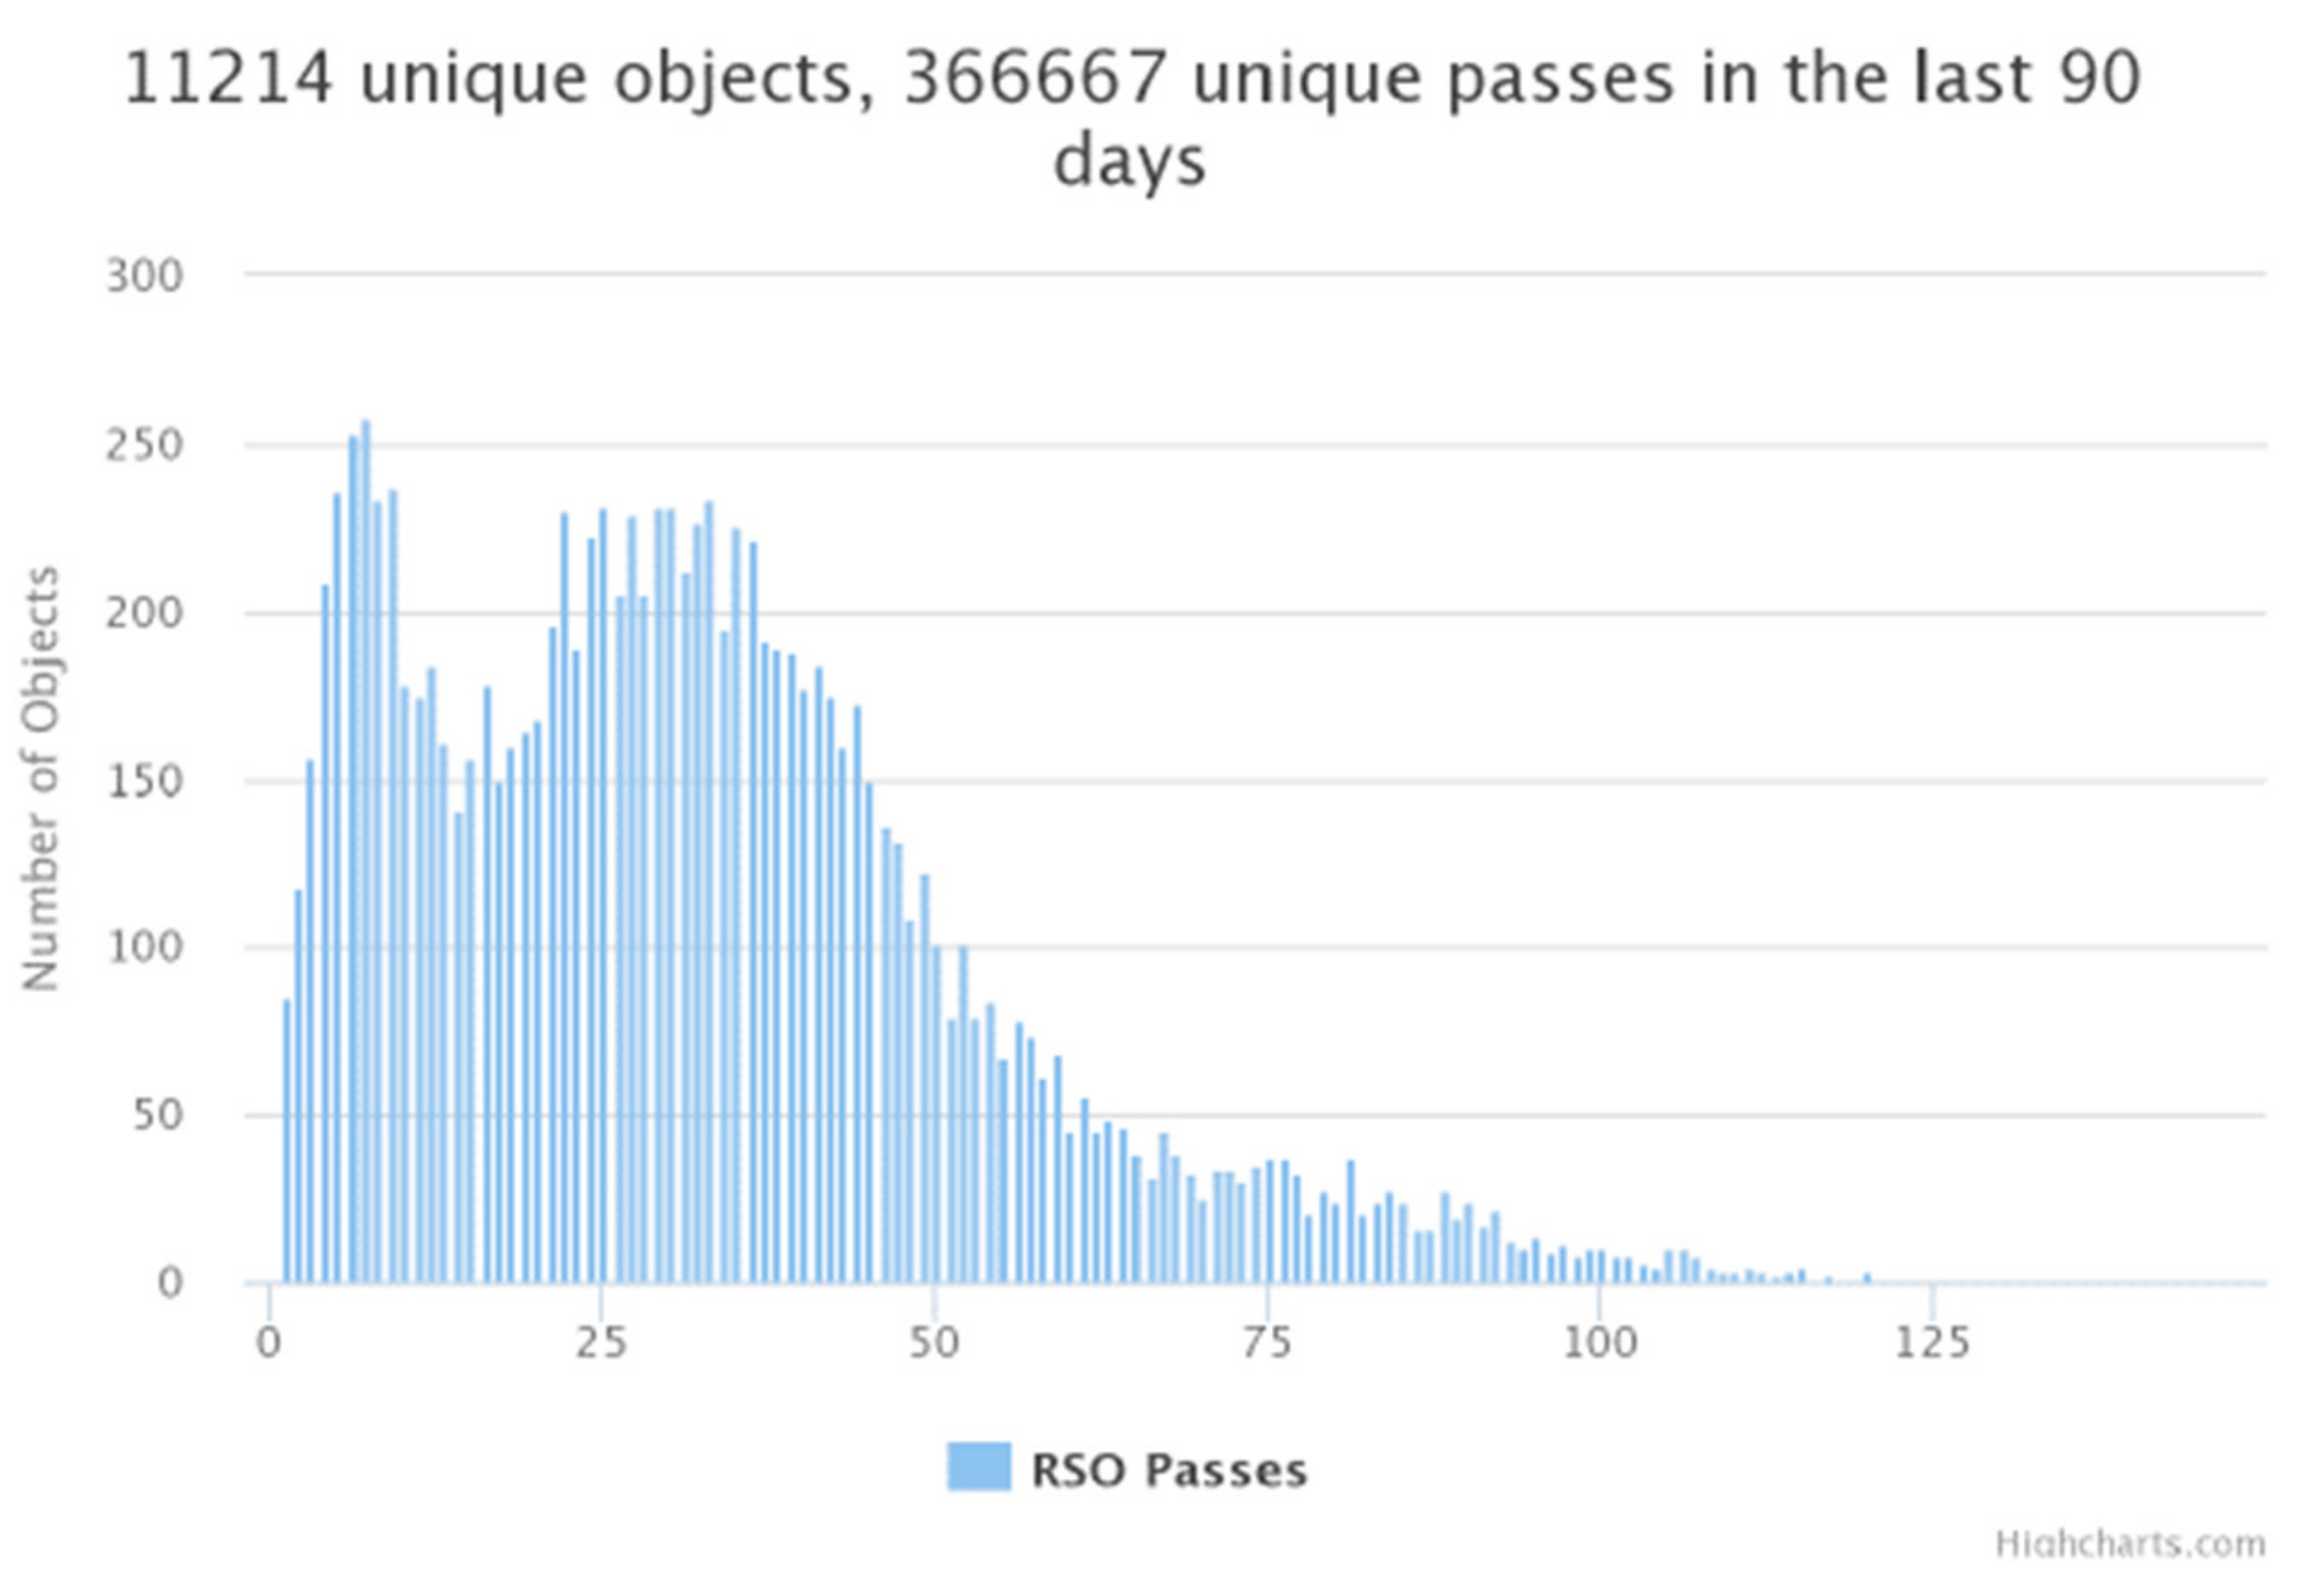
32]. To demonstrate the modular radar capabilities of the AMISR, the 128-panel PFISR was employed on July and August 2005 for a brief debris campaign. Operating for an average time of 2 h per day, the radar was able to acquire 10,000–15,000 tracks per day, with a final tracking rate of more than 305,000 tracks per month and a total amount of 12,000 space objects detected. Among them, 11,200 were unique objects.
Figure 15 summarizes the number of tracks for every unique object detected during the campaign [
32].
4. European Countries’ Radar Measurements
After US radar sensors, the most significant amount of work retrievable in the open literature about radar measurements of space debris is unquestionably related to the European countries. The European Incoherent Scatter Scientific Association (EISCAT) system is the primary source of this material. The EISCAT consists of three separate radars: the monostatic VHF radar, located near Tromsø (Norway); the monostatic VHF double antenna EISCAT Svalbard Radar (ESR) located in Longyearbyen, Svalbard; and the tristatic EISCAT UHF radar with transmitter located in Tromsø; and receivers located in Tromsø, Kiruna (Sweden), and Sodankylä (Finland) [
33]. Among these three radars, the most used for space debris activities are the ESR and the EISCAT UHF radar. The ESR consists of two parabolic dishes, a steerable 32 m and a fixed 42 m antenna with gains of 42.5 and 45.3 dBi, respectively [
34,
35]. The radar, operating at 500 MHz, is characterized by a single transmission system with a peak power of 1 MW and a duty cycle of 25%, and it can be switched to either of the two antennas on a pulse-to-pulse basis. The ESR was employed for a two-year campaign during the International Polar Year (IPY) from March 2007 to March 2009, attempting to increase the canonical 2000 h per year dedicated to space debris observation to a continuous coverage [
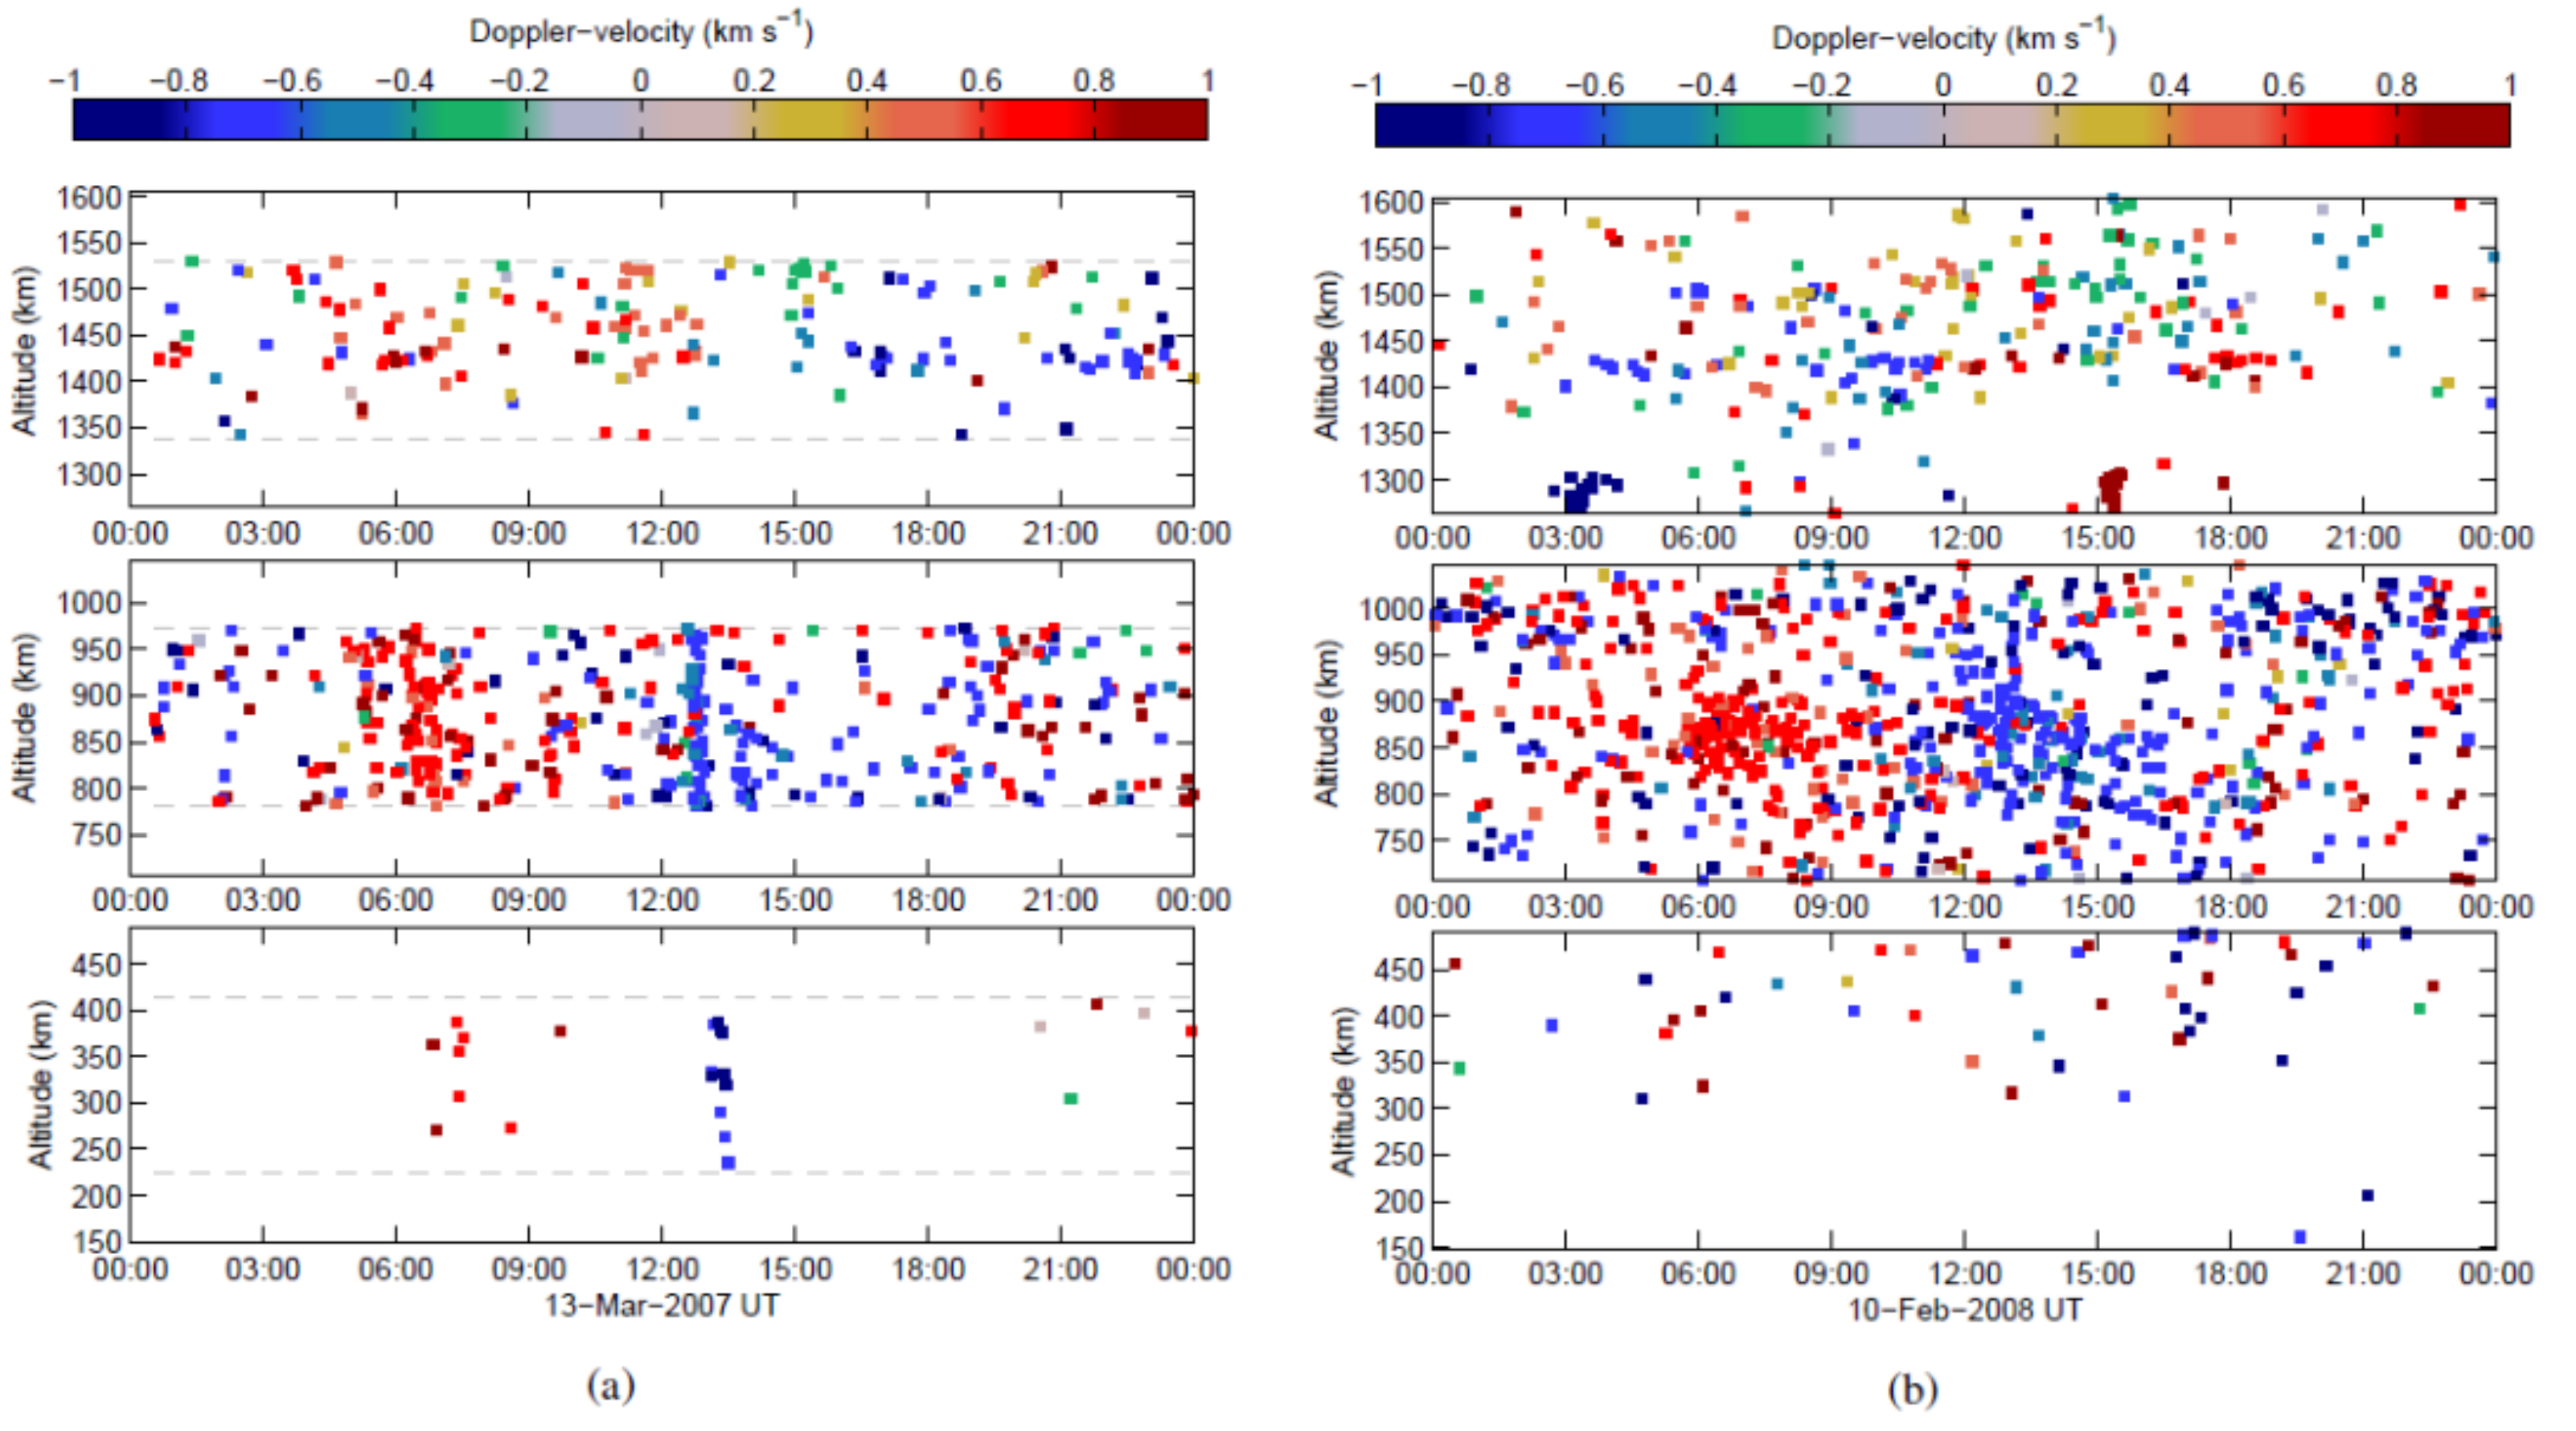
34]. Within this campaign, the EST was able to record 5060 h detecting 23,9000 events. From this huge pool of events, a Quality Set (QS) was extracted, consisting of 101 complete 24 h debris observations in beam-park mode. The QS was comprised of measurements made from March 2007 to February 2008, including 95,000 events. The effective sensitivity of the ESR within the QS is indicated by the smallest objects detected at various altitudes, in this case 3.5 cm-sized debris in the 700–1000 km altitude range, and 5 cm-sized debris in the 1300–1600 km altitude range. A time–altitude distribution of the events at the beginning and at the end of the QS during the IPY campaign is given in
Figure 16 [
34]. Two big clusters can be seen in
Figure 16b at about a 1300 km altitude, characterized by a day to day drifting, as they do not represent a sun-synchronous ring [
34].
The EISCAT UHF radar, in contrast, is characterized by a 32 m diameter fully steerable parabolic dish working at 929 MHz, with Cassegrain optics, which represents the transmitting segment [
33,
35]. The EISCAT UHF transmitter consists of a programmable radar controller that generates the pulse patterns at DC level, later converted in RF signals and amplified by two klystrons to reach a peak power of 2.5 MW. However, space debris measurements’ power supply is usually in the range of 1–2 MW [
33,
35]. The receiver used for space debris measurement is also connected to the EISCAT UHF radar (in this case the radar consists solely of the monostatic parabolic antenna in Tromsø), and is a special digital receiver back-end capable of capturing a large and complex amount of analog IF data via a single digital stream [
33,
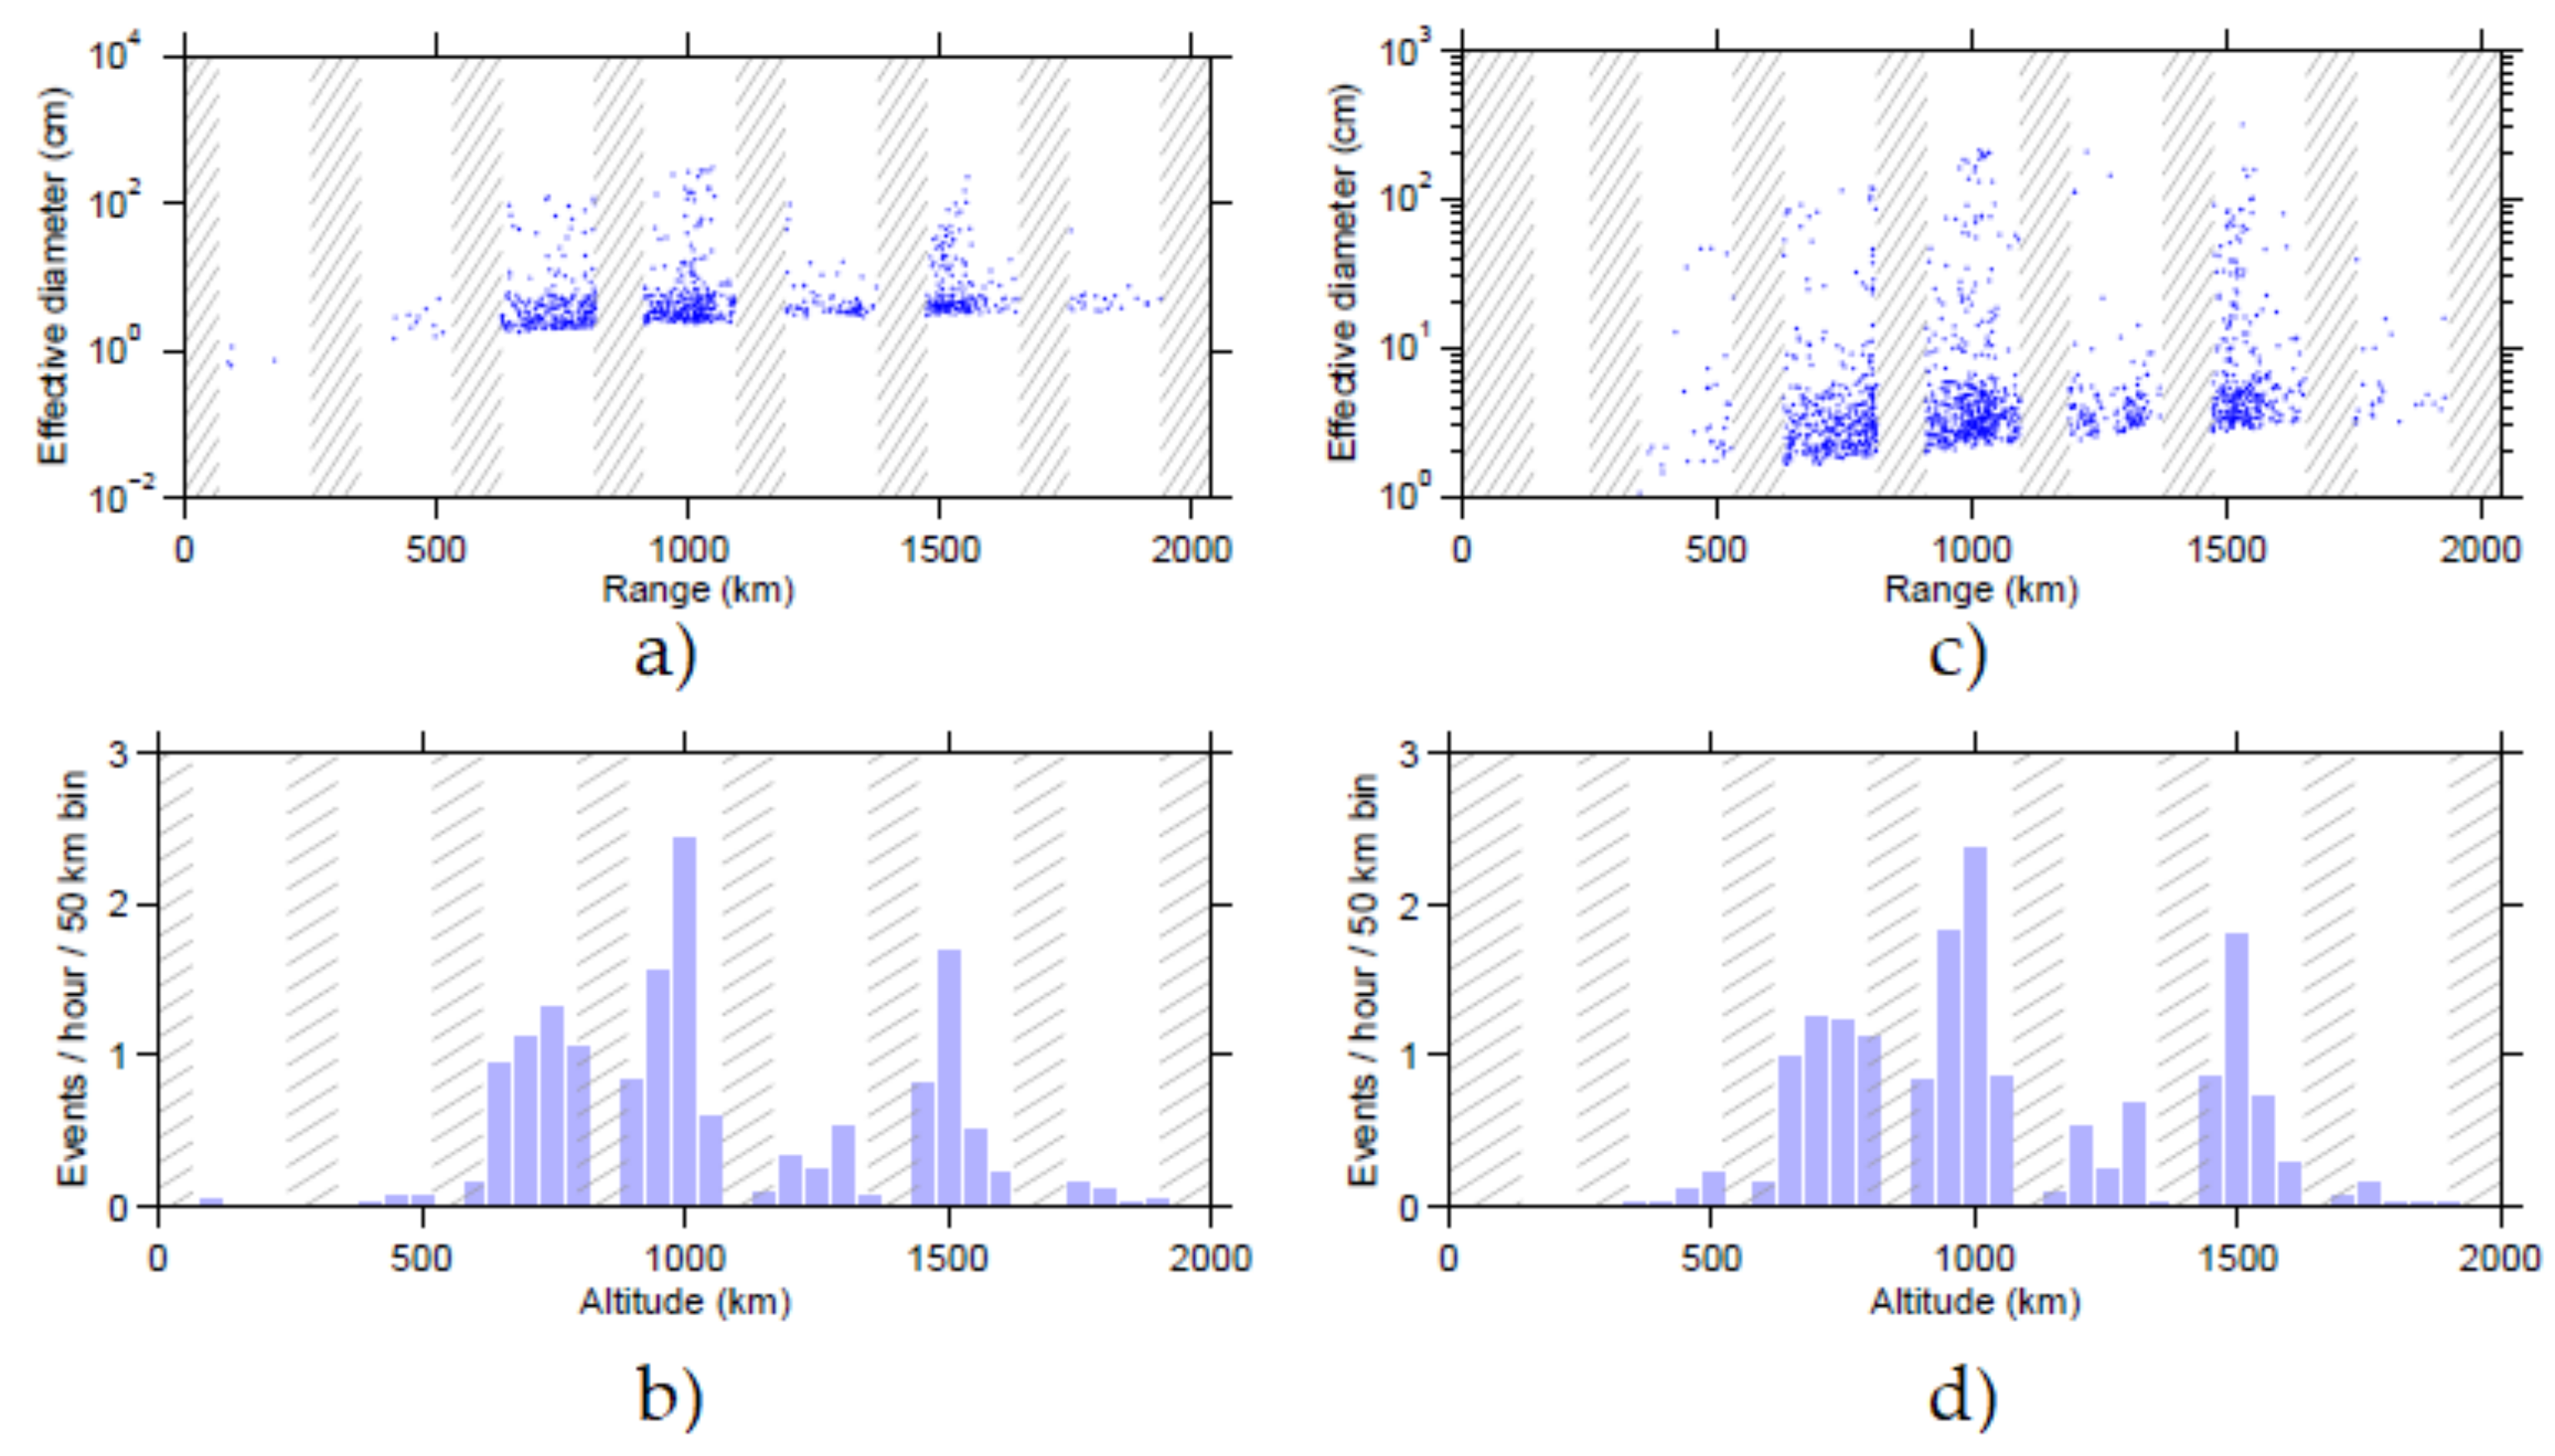
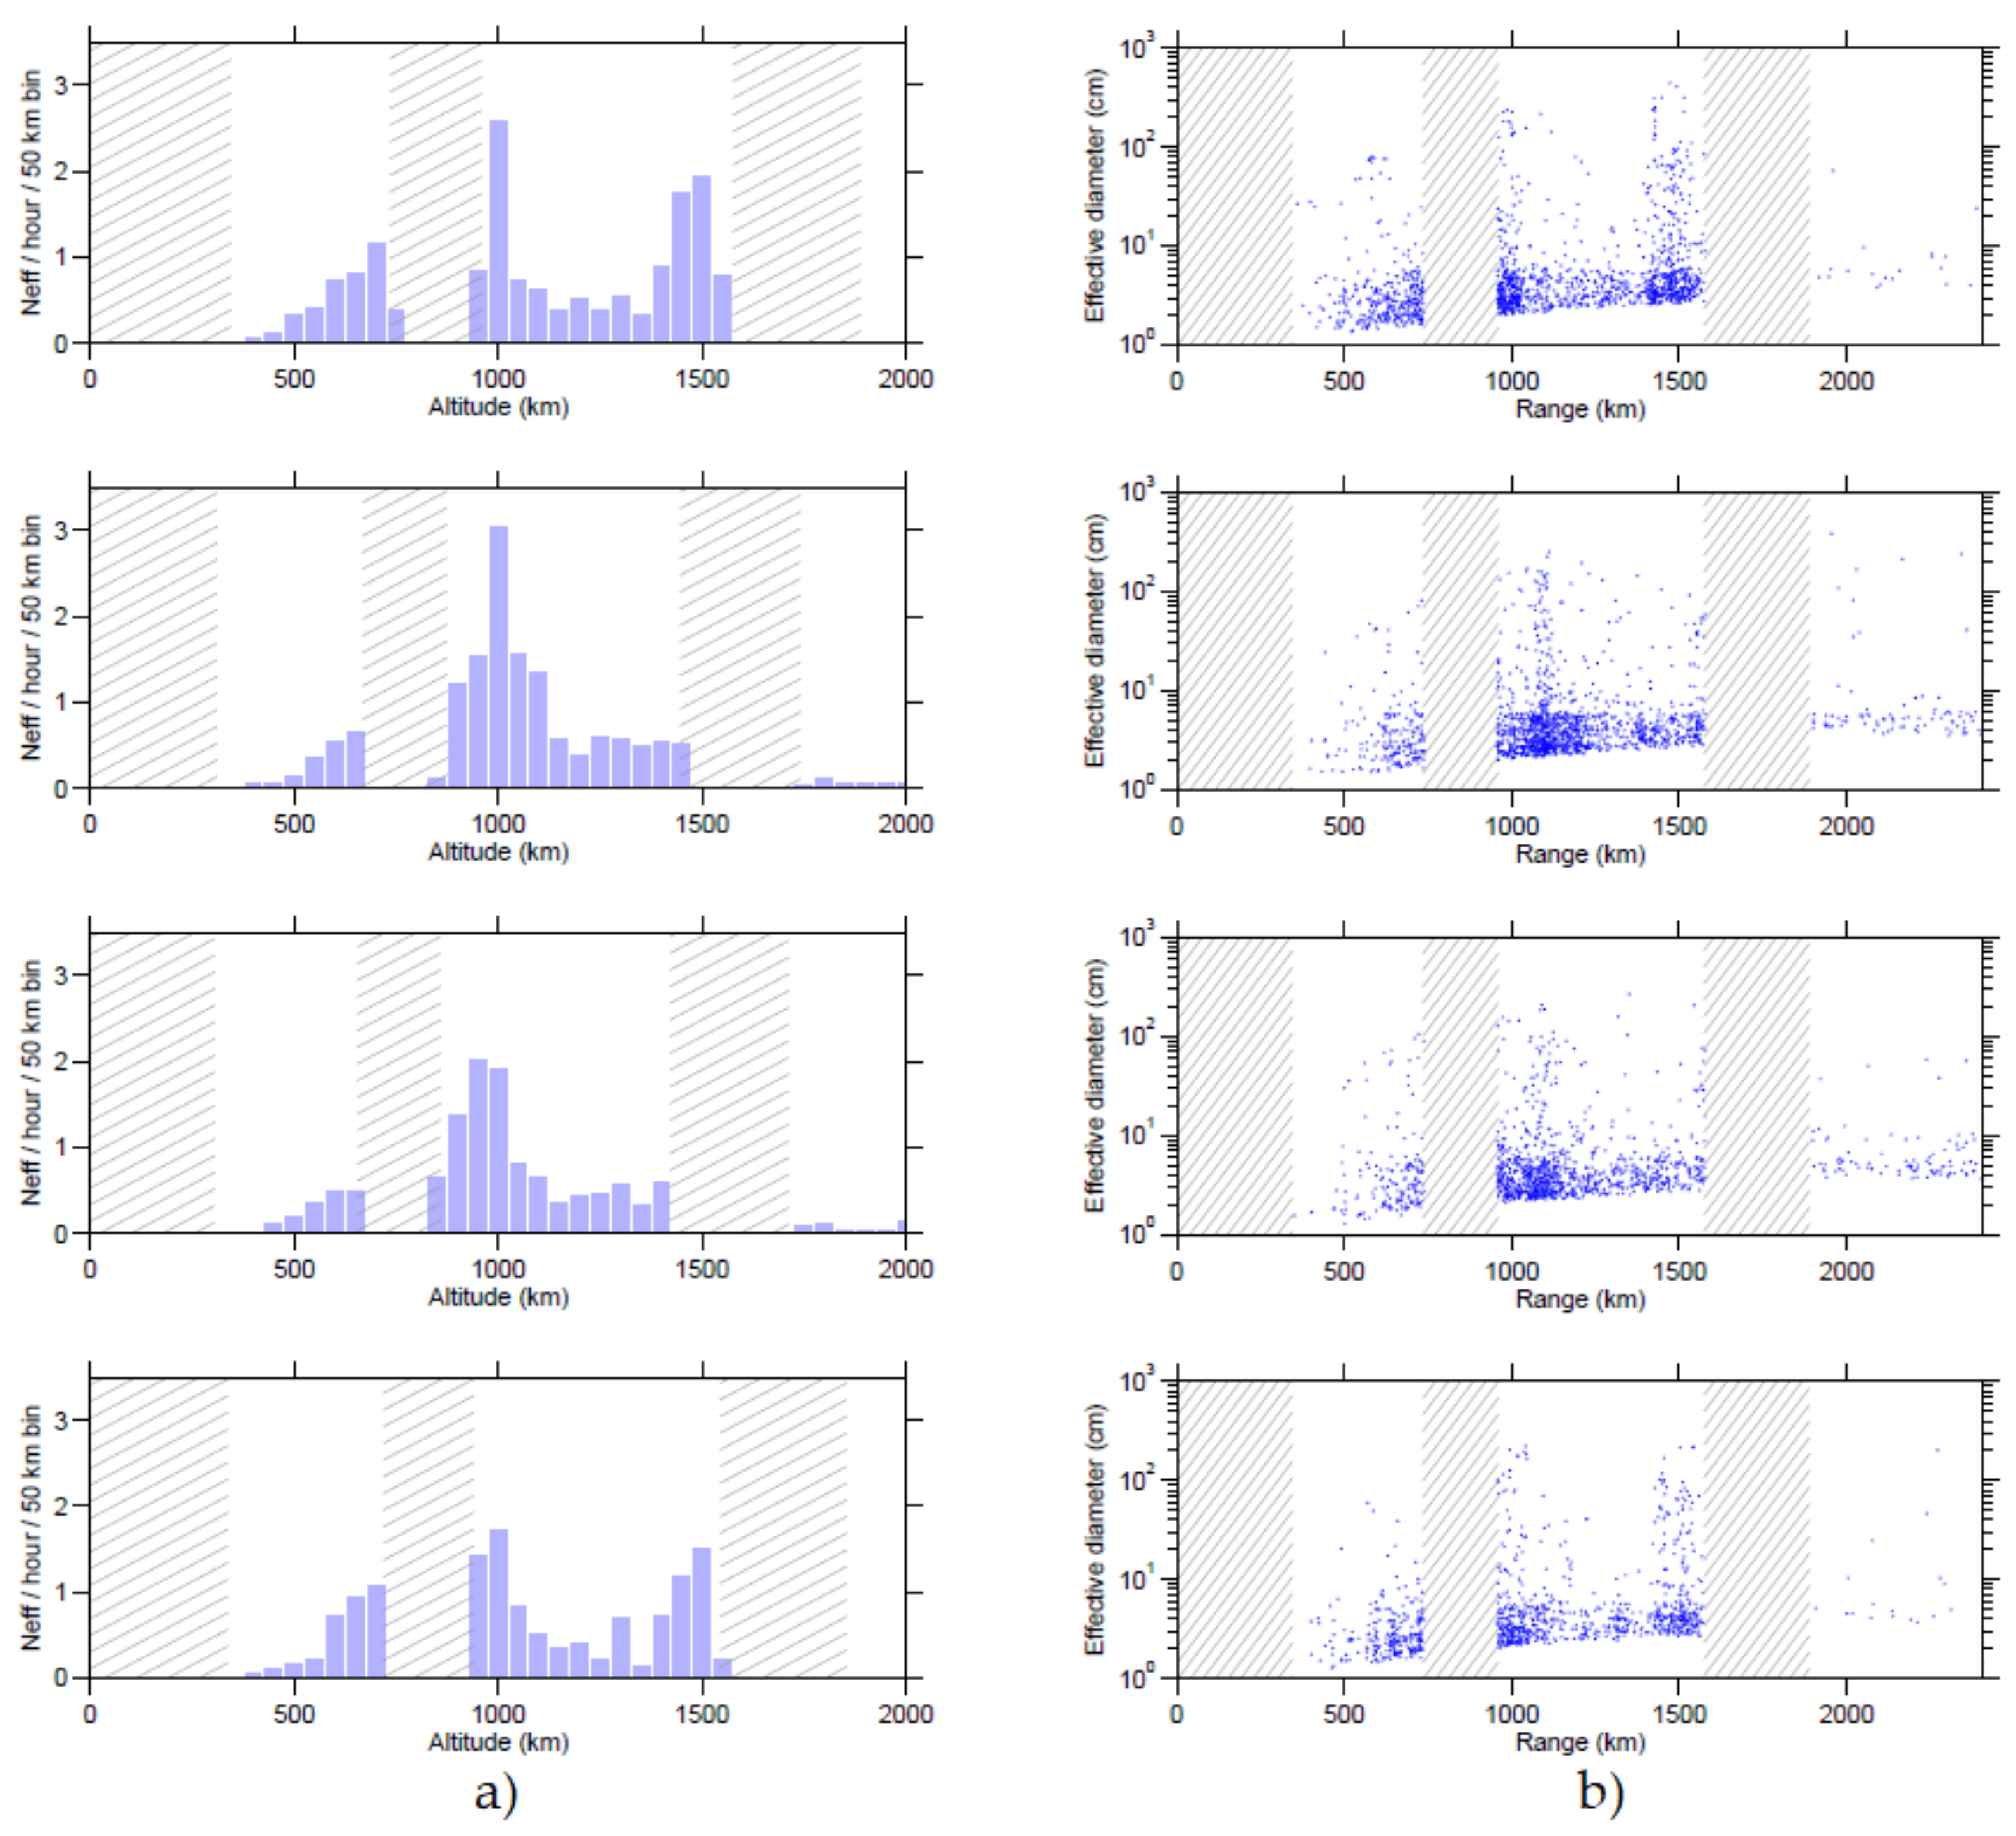
35]. In this configuration, the EISCAT UHF radar was employed in 2005 in two different campaigns, for an ESA contract: the Manda campaign, 11–13 August and 17–20 November 2005, and the Cp2 campaign, 7–29 September 2005. The radar collected almost 700 h of measurements, detecting about 800 debris events [
35]. Both campaigns were performed in beam-park mode.
Figure 17 and
Figure 18 show the results of the double 2005 campaign. The blind zones at various LEO altitudes correspond to areas where at least some part of the returning echo was blocked due to the pointing geometry of the radar. Both campaigns’ results show interesting peaks of detection at 1000 and 1500 km altitudes.
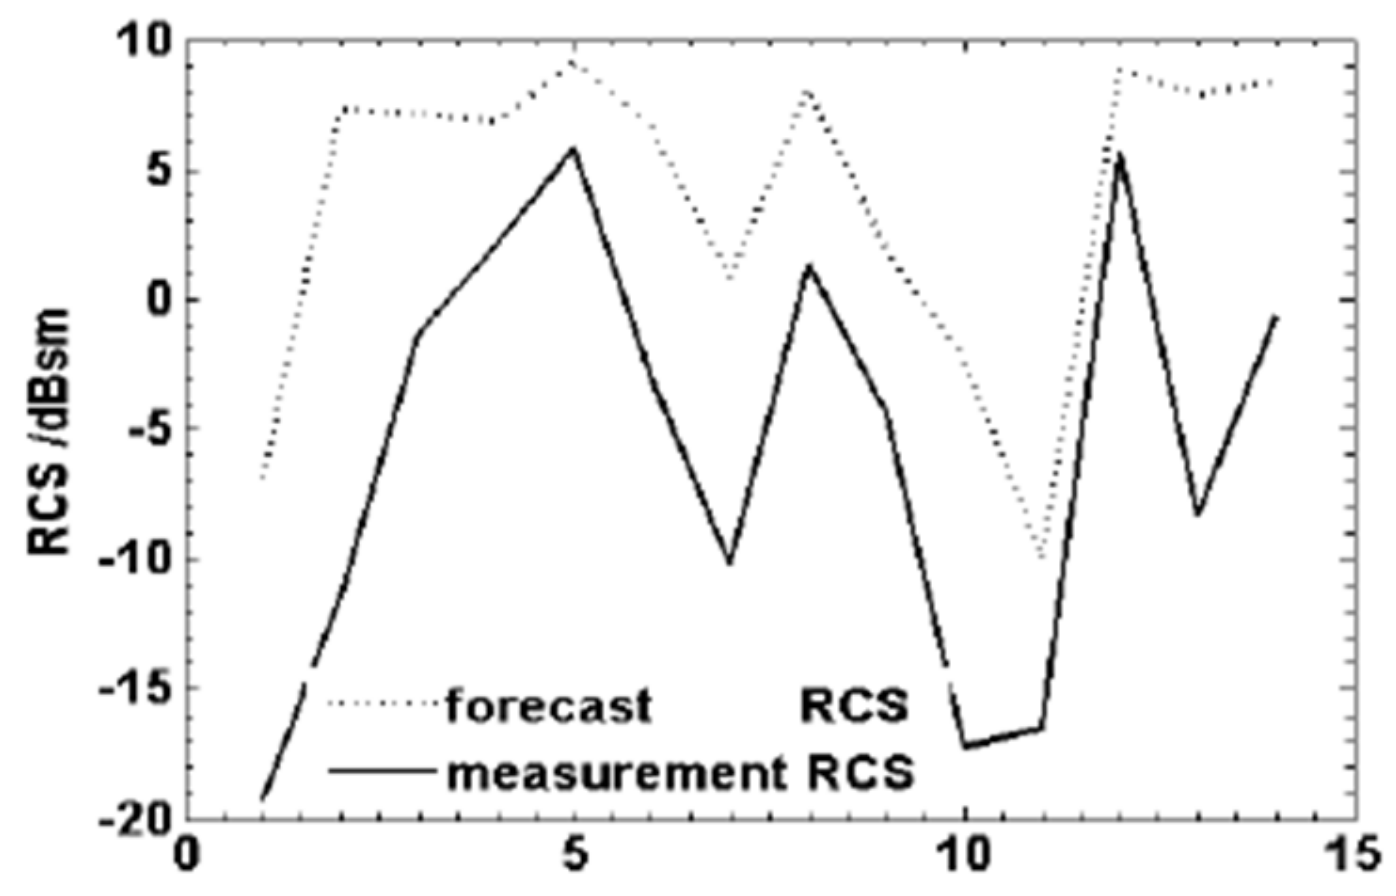
Actually, the EISCAT UHF radar was also recently employed in its tristatic configuration. The tristatic radar was used for a brief 15 h campaign on 25 May 2010, detecting 14 events [
36]. The raw sample data were recorded from the three receiving sites in Tromsø, Kiruna, and Sodankylä. For this particular space debris measurement, the tau1 transmission was employed, which consists of alternating codes spaced by 1160 µs with duty cycle equal to 8.6%. The operating frequency transmission was 930 MHz, the peak power 2 MW, and the measurement was performed in beam-park mode [
36]. The RCS of the detected objects is reported in
Figure 19 and compared with the results predicted by the US satellite catalog.
An important binomial in European radar debris measurements is the TIRA-Effelsberg bistatic system. The Research Establishment for Applied Science (FGAN) Tracking and Imaging Radar (TIRA) is a 34 m fully computer controlled parabolic antenna with Cassegrain optics located in Wachtberg, Germany. It can operate both in L-band (1.33 GHz) as a narrow-band monopulse tracking radar and Ku-band (16.7 GHz) as a high range resolution imaging radar [
37,
38]. The L-band transmitter of the TIRA is able to generate high frequency pulses, typically from 1 to 2 MW peak power, in Right-Handed Circular Polarization (RHCP) [
37,
38]. Used as a monostatic radar, the TIRA is capable of detecting 2 cm-sized objects at 1000 km range. However, when combined with the Max-Planck-Institute of Radio Astronomy (MPIfR) Effelsberg radio telescope, a 100 m diameter parabolic dish located in Bad Münstereifel (Germany), as a receiver, the size of detectable objects reaches 0.9 cm. By virtue of a contract with ESA/European Space Operation Center (ESOC), TIRA was employed for three beam-park experiments in 1993, 1994, and 1996. On all three occasions, the radar was operating in monostatic configuration. However, in 1996, a second data collection was recorded at Effelsberg. This last campaign is known as Cooperative Beam-Park Mode 1996 (COBEAM-1/96) or, simply, the COBEAM experiment. It was a 24 h campaign undertaken on 25 November 1996, with an overall number of detections equal to 499 [
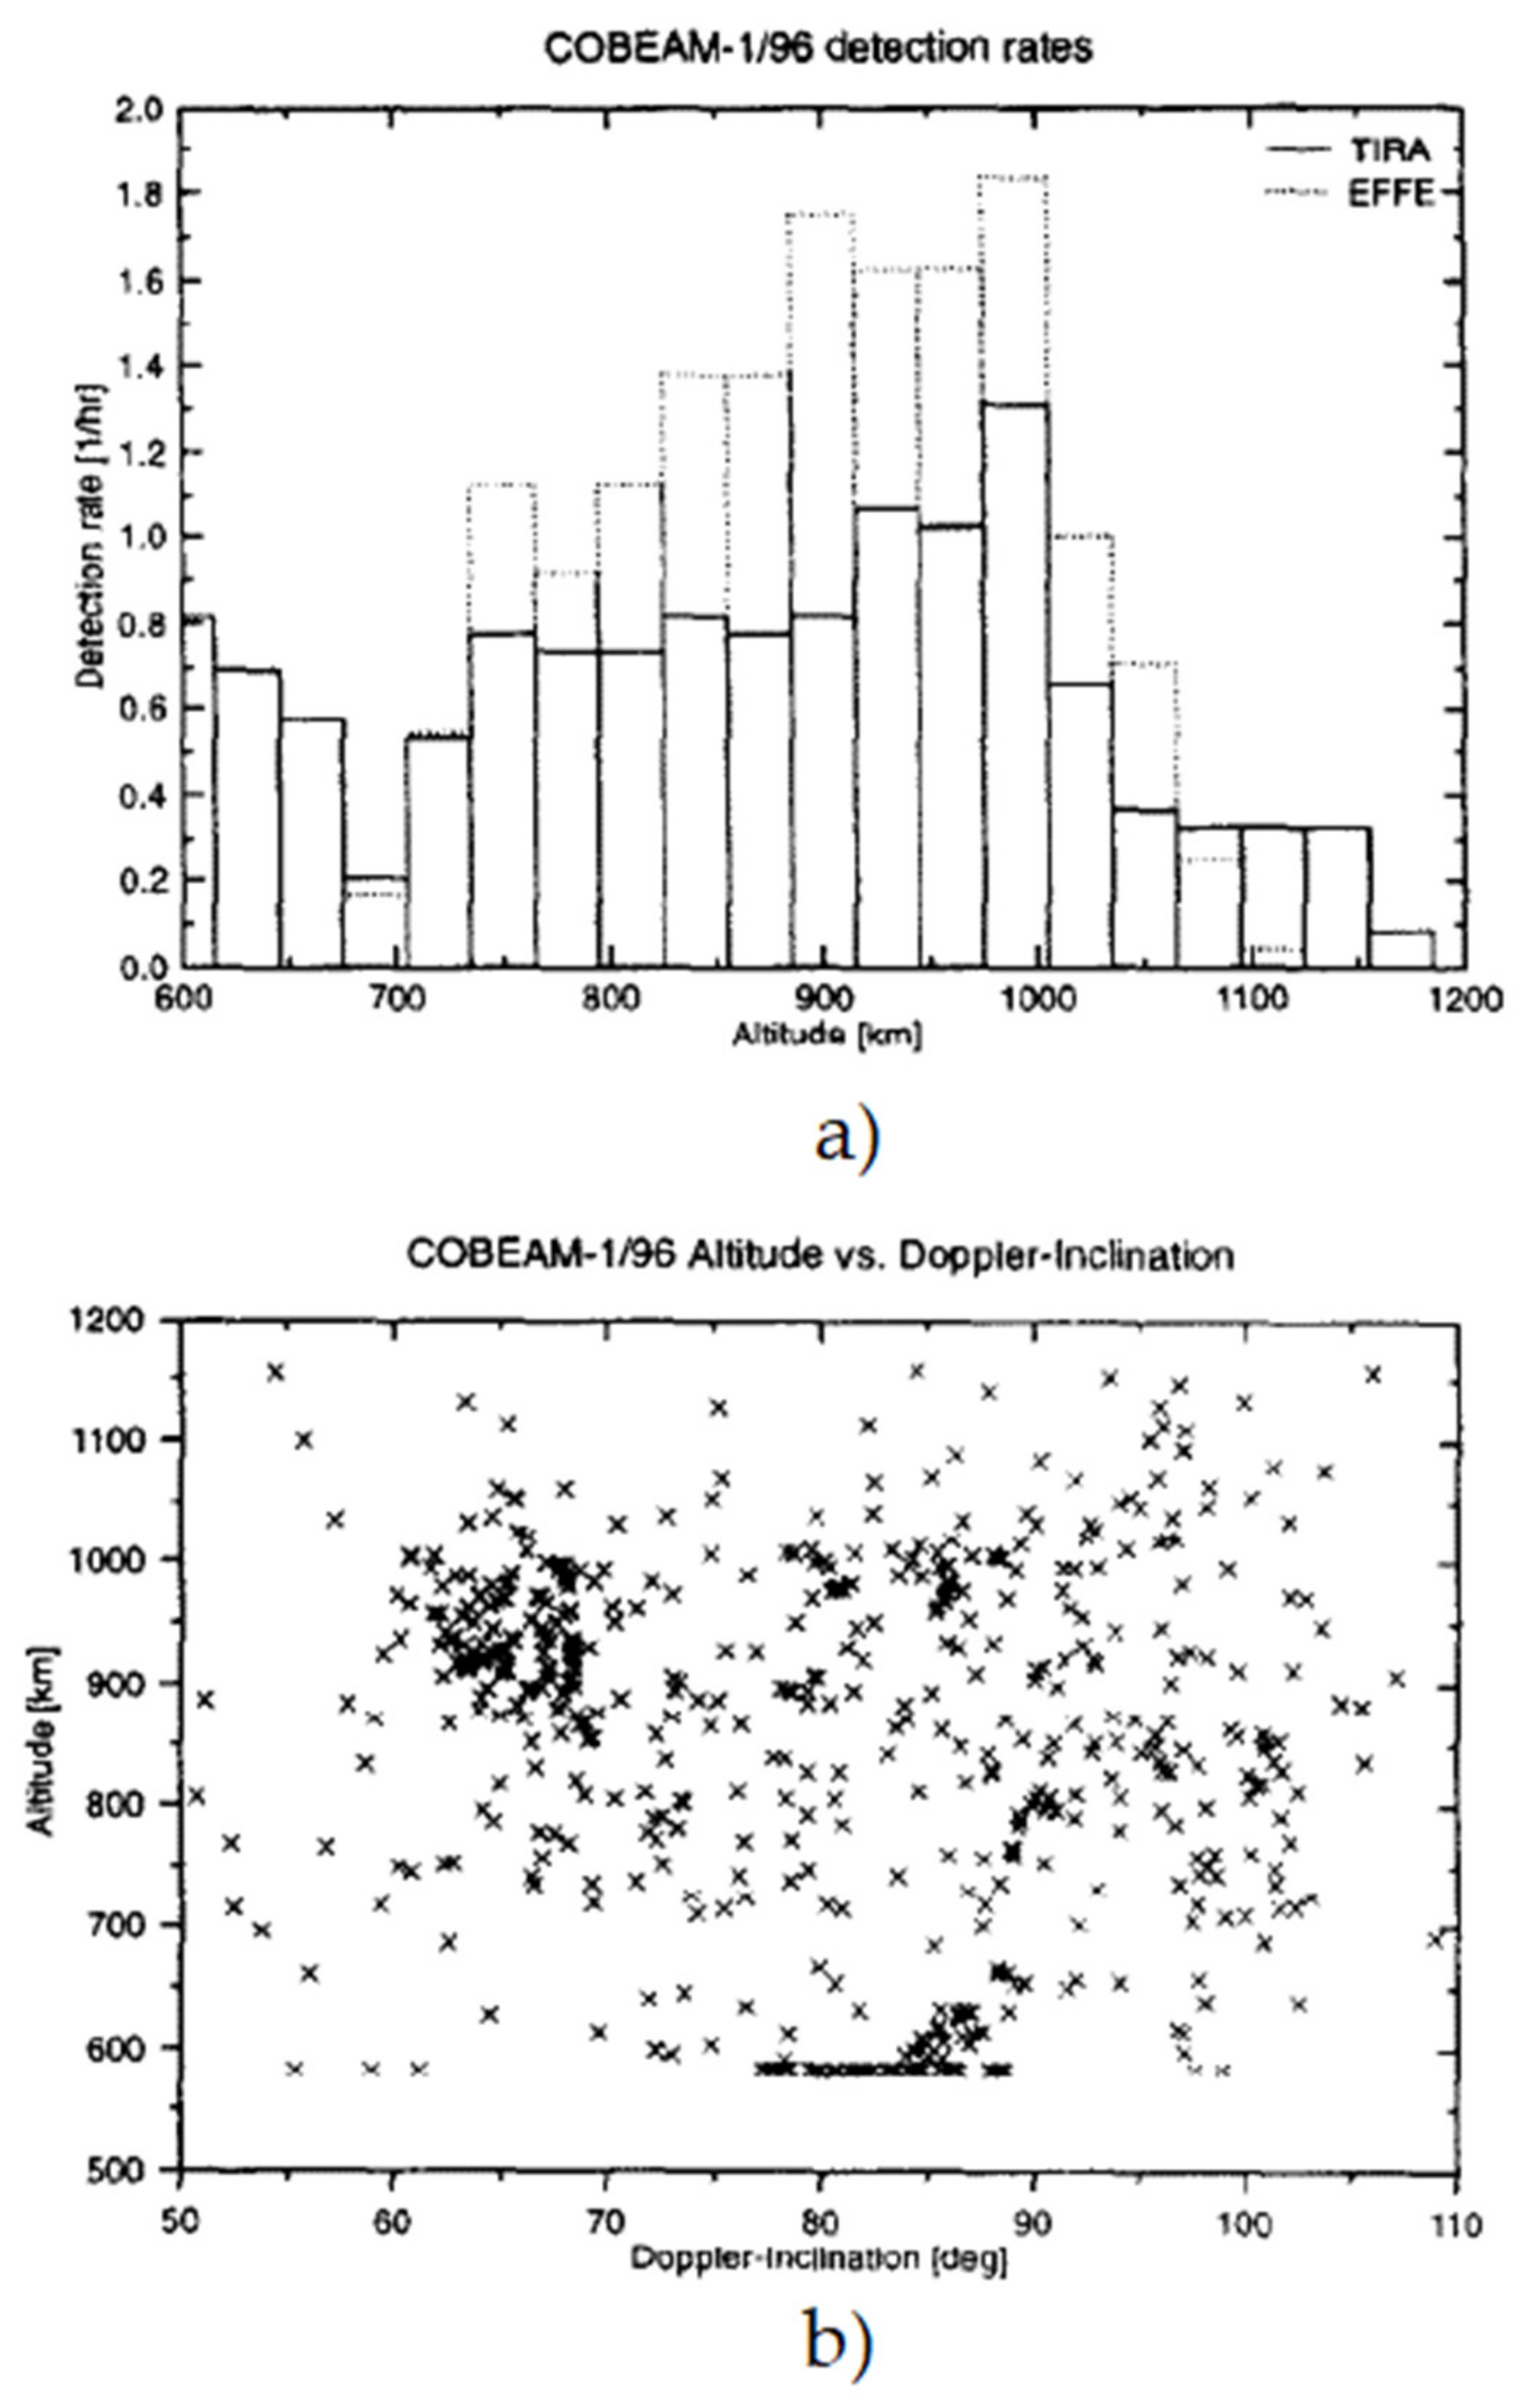
38]. The experiment was focused on covering a region of the space which was believed to be populated by NaK droplets leaking from the reactor of the Russian satellite RORSAT. The debris detection rate vs. altitude is reported in
Figure 20a, for the TIRA in monostatic configuration and with the Effelsberg radio telescope as a receiver, showing that in the 750–1050 km altitude interval the detection rate of the bistatic configuration is much higher.
Figure 20b shows the complete data set with the altitude as a function of the Doppler inclination. The main cluster around 900 km corresponds to a 65° inclination which indicates the RORSAT orbit; thus, it was probably an indication of the NaK droplets.
New campaigns were planned and undertaken in 2000 and 2001, this time with improved data-processing capabilities thanks to the extension in the observation windows of the radar, covering altitudes from 350 to 2000 km [
39]. During the 24 h 2000 campaign, nearly 500 objects were detected. The results of the campaign, in terms of altitude vs. Doppler inclination, are reported in
Figure 6 of [
39]. In that figure, the very same cluster of NaK droplets detected in the 1996 COBEAM experiment can be spotted at 900 km altitude, and, in addition, the Globalstar constellation (a satellite constellation for mobile phone and low-speed data communications), can be spotted at 1400 km altitude. The TIRA-Effelsberg system is one of the major staples in space debris monitoring for Europe and for Germany, and it will be soon joined by the German Experimental Space Surveillance and Tracking Radar (GESTRA), a dedicated L-band phased-array radar capable of detecting small objects at altitudes below 3000 km [
40].
In recent times, the European space debris network has been enhanced by the addition of two new radar sensors located in Italy: the Bistatic Radar for LEO Survey (BIRALES) and the Bistatic Radar for LEO Tracking (BIRALET). The two systems share the same transmitter, the Radio Frequency Transmitter (TRF), a 7 m dish wheel-and-track steerable parabolic antenna, located in the Italian Joint Test Range in the region “Salto di Quirra” (Cagliari, Sardinia, Italy) [
41]. The transmitter can supply a peak power of 10 kW within the bandwidth 410-415 MHz. The receiver of the BIRALES system is the Northern Cross, a UHF (408 MHz) T-shaped array transit antenna composed of two major branches. The East/West (E/W) branch is 564 m long and it is composed of a single 35 m wide cylindrical antenna, whereas the North/South (N/S) branch consists of 64 parallel antennas, each one characterized by a total length of 23.5 m and width equal to 7.5 m [
41,
42]. The actual portion of the overall antenna which is devoted to the BIRALES system includes 16 parabolic cylindrical antennas of the N/S branch, renamed BEST-2, that provides a collecting area of about 2800 m
2 and a Field of View (FoV) of 6.6° × 2.2° [
41]. The Northern Cross is located at the Medicina Radioastronomical Station, near Bologna (Italy). The first experiment with the BIRALES was conducted in 2014, when the bistatic radar was able to spot around 20 objects in the altitude range 300–850 km. The observations were made in a sort of beam-parking mode, meaning that the list of objects to detect was predetermined (and provided by the Italian Air Force) and each time the antenna was pointed at the object coordinates waiting for its passage [
43].
Table 1 shows a summary of the experimental measurements performed by the BIRALES in 2014, reporting altitude, slant range, RCS, and measured Doppler frequency. Thanks to its ability to rapidly switch from multibeaming observation mode to ranging mode, the Northern Cross is able to refine orbital parameters of known objects or to perform a preliminary orbit determination [
44,
45]. The Northern Cross is not the only antenna located at the Medicina Facility. A fully steerable 32 m dish parabolic antenna is also present, equipped to operate in L-, S-, C-, X-, and K-band, and it is part of the European Very Long Base-line Interferometry Network (EVN-VLBI) [
42]. The Medicina VLBI antenna was used in a joint bistatic experiment together with the Evpatoria RT-70 transmitter (later discussed in this paper) in July and November 2007 [
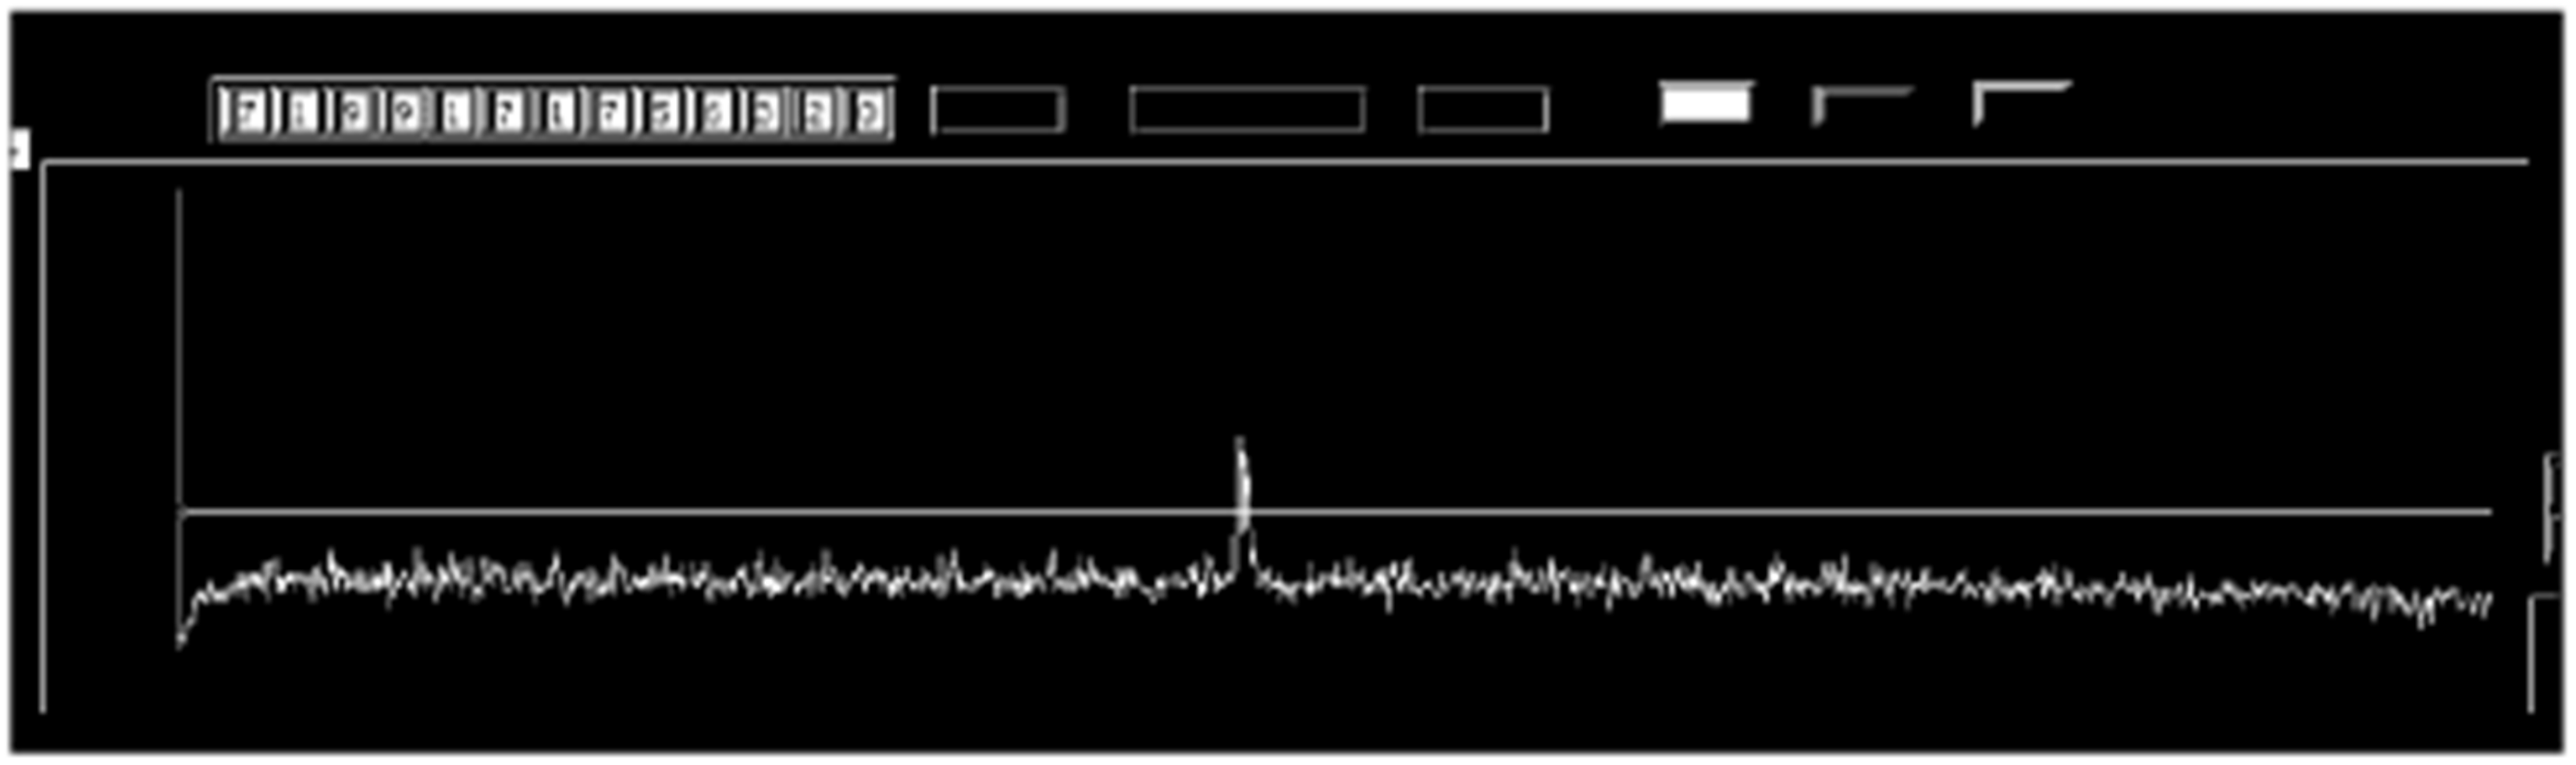
46]. A continuous wave (CW), RHCP, high-power signal (20–40 kW) was transmitted within a beam of approximately 2.6 arcmin. Several suitable targets were selected (inactive geostationary satellites and known debris, among others), and a part of the experiment was dedicated to the detection of uncatalogued objects using beam-park mode. Unfortunately, in [
46] no scatter plot or summarizing table is reported to show the complete campaign results, but only an example of one of the several echoes of unknown objects received, which is herein depicted as
Figure 21 [
46].
The counterpart of the BIRALES system is the BIRALET, which employs a different receiving segment, represented by the Sardinia Radio Telescope (SRT). The SRT is a 64 m dish fully steerable wheel-and-track parabolic antenna, able to operate in the frequency range 0.3–116 GHz [
47,
48], located 35 km north of Cagliari (Sardinia, Italy). Its azimuth and elevation maximum rotation speeds, 0.85°/s and 0.5°/s, respectively, allow for potential debris tracking. Jointly with the Northern Cross, the SRT was employed as a receiver in the same 2014 debris experiment [
2]. In the same fashion, the list of debris to observe was predetermined, and the observations followed the same rules explained for the BIRALES experiment. Only six objects were detected (two of them shared with the BIRALES observations), some with multiple detections. This was due to the fact that the SRT, devoted mainly to radioastronomical observations, was not optimized for space debris detection. The results of the brief preliminary campaign are reported in
Table 2 [
2]. The objects detected reside in the altitude range 460–980 km with variable RCS from 0.3 to 11.6 m
2. After this first experiment, the SRT was upgraded. In particular, a new space debris-dedicated channel was designed and installed to improve the detection capabilities of the radio telescope [
48,
49]. The new receiving channel was first tested during the reentry process of the Chinese space station Tiangong-1 on 29 March 2018 [
48].
On the French side, the most well-documented and prominent example of debris sensor is the Grand Réseau Adapté a la Veille Spatiale (GRAVES). The GRAVES is a CW VHF (143.05 MHz) bistatic radar, with its transmitter located near Dijon (France) and its receiver 400 km further south, in Provence [
50,
51]. The transmitter is a phased array composed of four linearly polarized 30-element arrays (arranged in panels), each one covering 45° in azimuth and 30° in elevation. The layout of the panels allows a 180° azimuth coverage toward the south. The receiving segment is a 60 m diameter sparse array with 100 circularly polarized elements. The azimuth and elevation detections of the resident objects in the LEO are enabled by the digital beamforming (DBF) [
50,
51]. Preliminary trials using only a portion of the phased array were performed between 1997 and 2001. The results from a late 2004 campaign are available in the literature. On that occasion, the pool of objects observable by the GRAVES system was around 2300, but only a small portion were effectively detected; these are shown in
Figure 7 of [
51] in terms of altitude of apogee and perigee as a function of the inclination [
51].
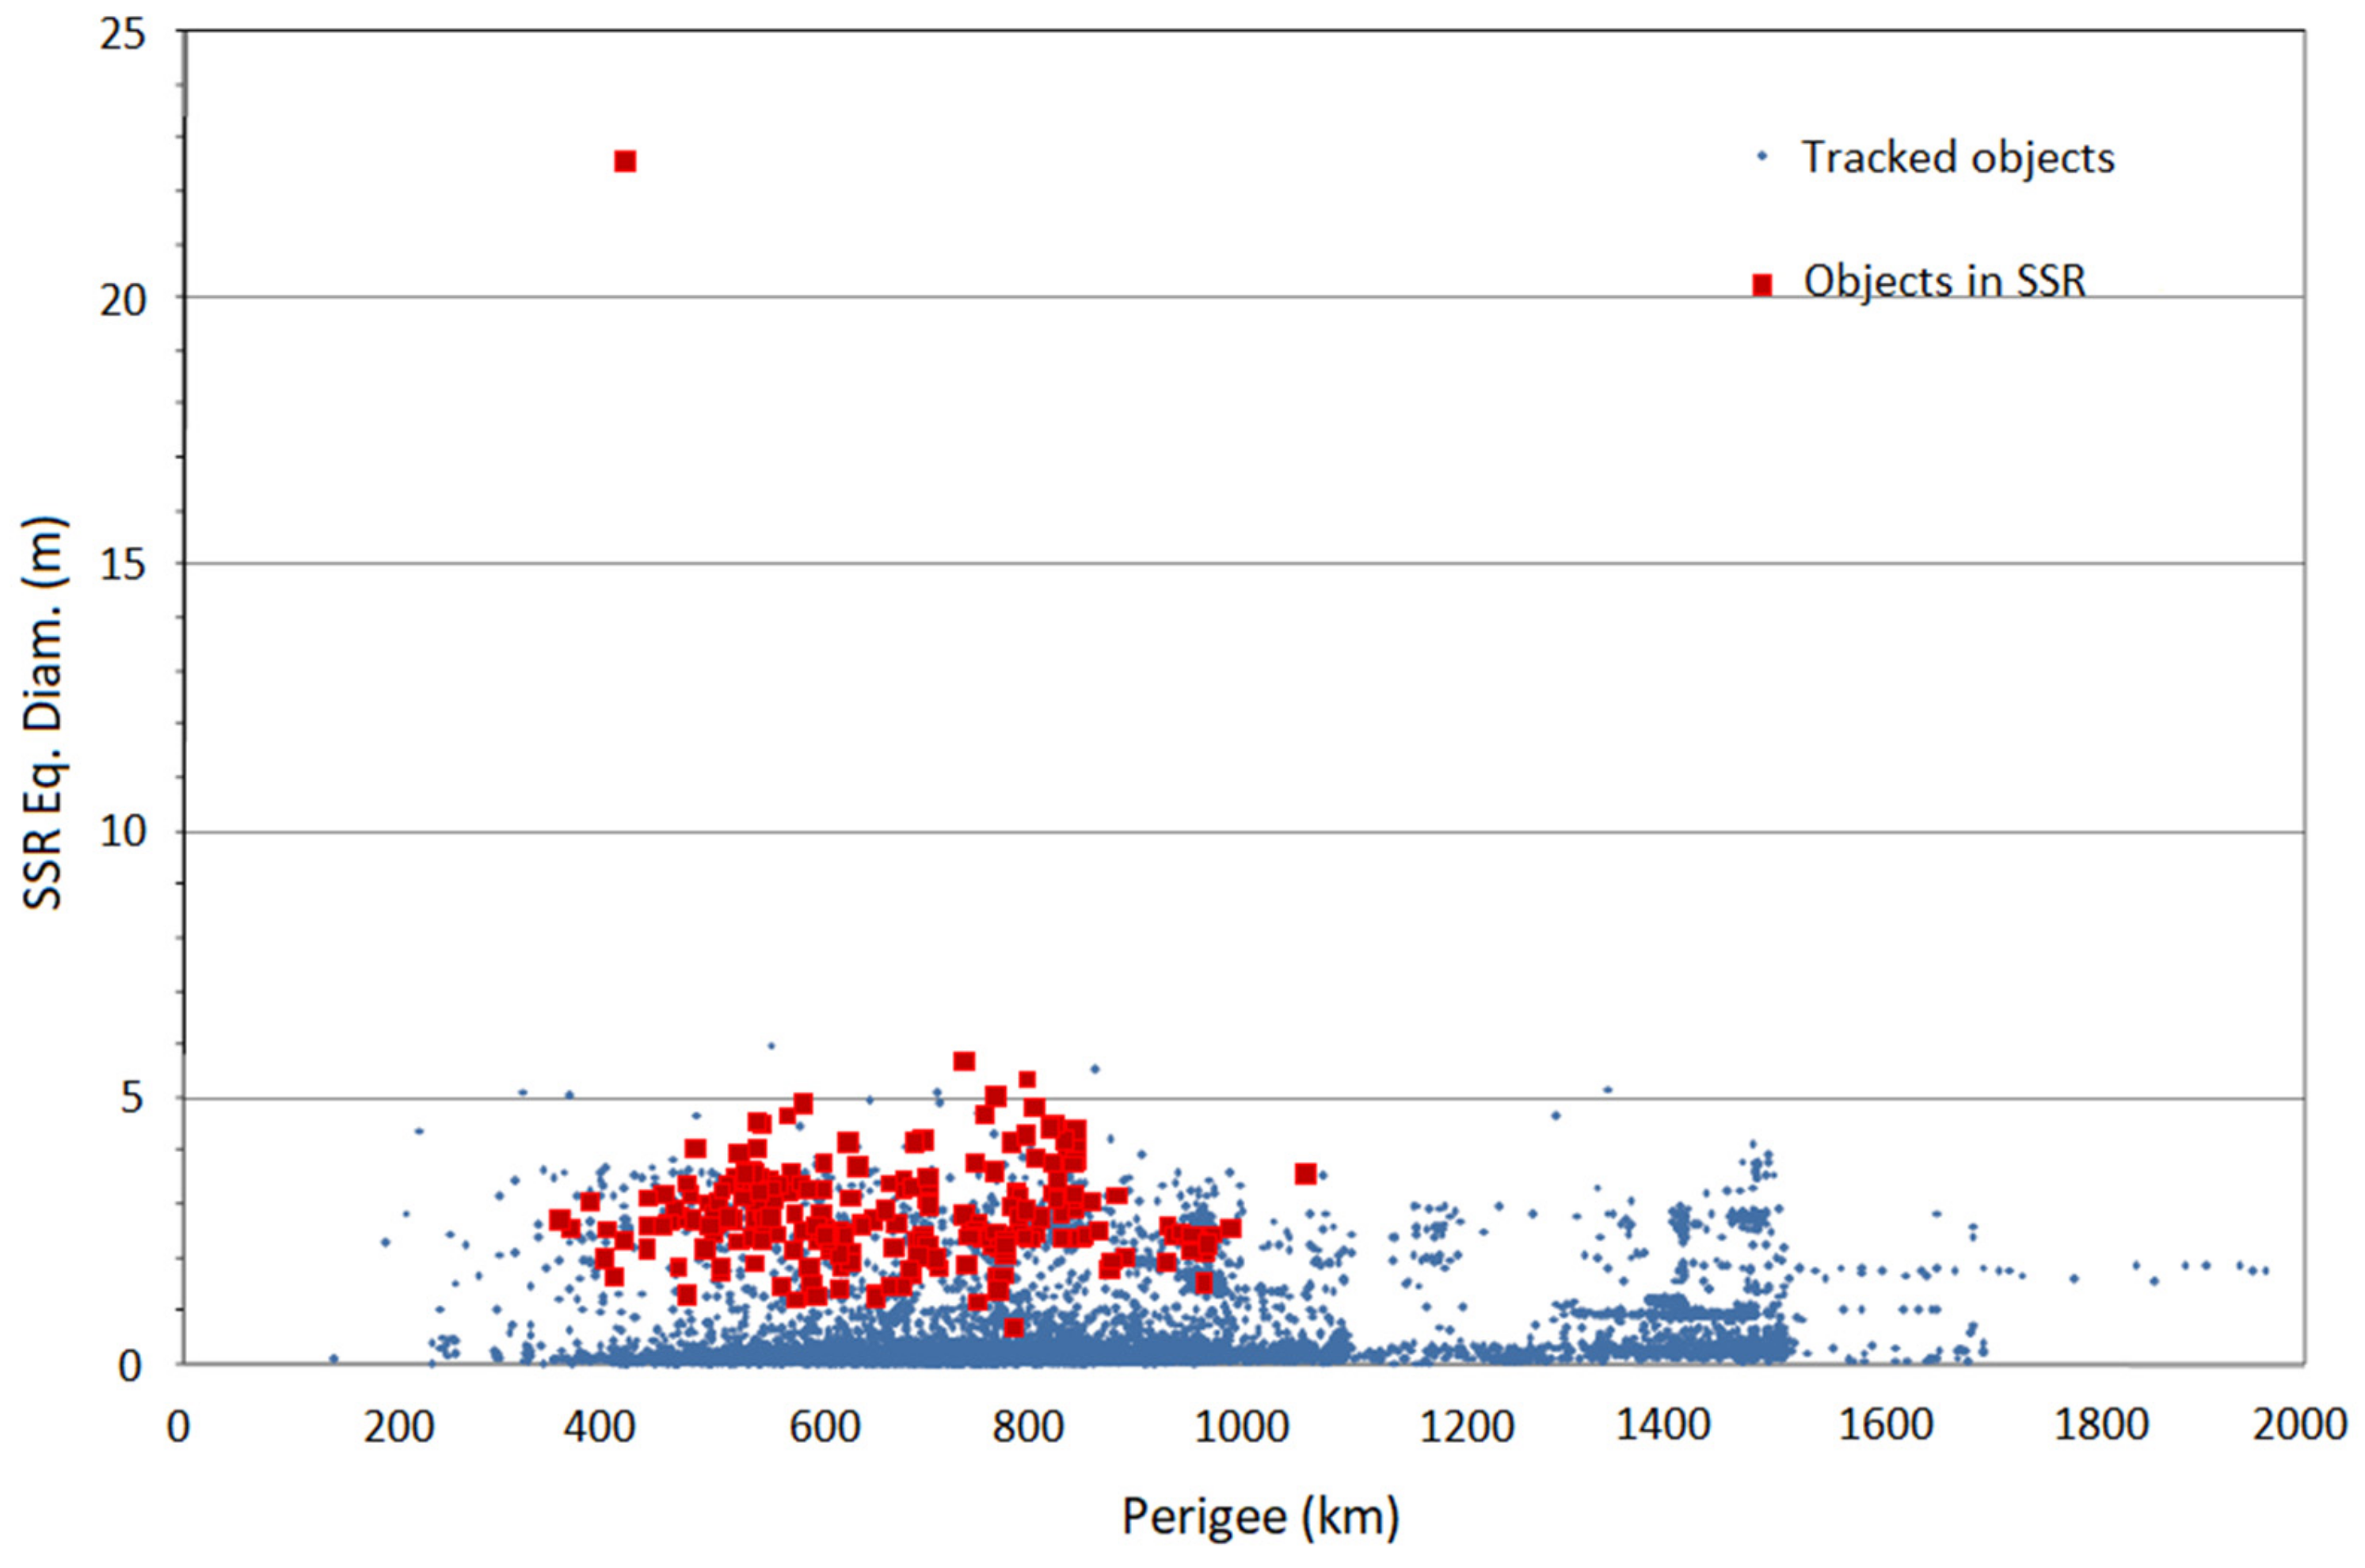
A further notable experiment is the project Antenna Bistatic for Space Surveillance (ABISS), led by the ONERA group, involving an L-band bistatic radar with a transmitter located 100 km west of Paris and a receiver located in Paliseau, 30 km south of Paris [
52,
53]. The transmitting antenna is a phased array of 49 elements arranged in a panel, with an average gain of about 24 dBi, capable of sending a CW signal with 300-W power. The receiving antenna is also a phased array, consisting of 64 elements, with an overall gain of about 32 dBi [
52,
53]. The transmitting and receiving beams are electronically controlled by means of DBF. After March 2015, the ABISS radar was routinely used for several debris campaigns, during which around 500 objects with a diameter of more than 2 m were detected and tracked. More than 43% of the global detections were recognized as rocket debris. The summary of the campaigns’ measurements is reported in
Figure 22, showing object diameter vs. perigee in comparison with the Space-Track catalog (a public online catalog where registered users can access satellite and debris TLEs [
54]).
An interesting study that may lead to future developments within space debris radar measurements is the employment of passive radar transmission by means of Digital Audio Broadcasting (DAB) services. In [
55,
56], the possibility of taking advantage of the reflected signal from DAB stations using a Low Frequency Array for Radio Astronomy (LOFAR) located in Borówiec (Poland) as a receiver is envisioned.
Unfortunately, there are no noticeable reported debris radar measurements from other European countries. However, major contributions in this field will be certainly expected from the United Kingdom and Spain. For the UK, the Chilbolton Advanced Satellite Tracking Radar (CASTR), a monostatic 25 m dish steerable parabolic antenna working in S-band (3076.5 MHz) with 700 kW peak-power, is suitable for tracking of objects in LEO with RCS greater than 0.5 m
2 beyond 2100 km range [
57]. Spain, on the other hand, can count on the radars of the Spanish Space Surveillance and Tracking (S3T): the Monostatic Space Surveillance Radar (MSSR), a close monostatic L-band radar located in Santorcaz (30 km from Madrid, Spain), which is able to detect large objects in the 200–1200 km range, and the new S3T Surveillance Radar (S3TSR) [
58].
5. Other Countries’ Radar Measurements
Major contributions in the literature from countries outside USA and Europe are mainly sourced from Japan and Australia. Nonetheless, a few works from other nations are also noteworthy. The Middle and Upper (MU) atmosphere radar of Kyoto University is a powerful VHF (46.5 MHz) radar that has the longest history of space debris measurements in Japan [
59]. The MU radar is a circular 100 m phased array composed of 475 crossed Yagi antennas, located in Shigaraki (Japan). It is capable of transmitting a RHCP signal with a peak power of 1 MW [
59,
60]. The features of the MU radar allow for different types of analysis on space debris, such as orbit determination using a single track [
59], variation in measured RCS [
60], and shape estimation [
60,
61]. Such characteristics guarantee a high sensitivity, enough to make the MU radar performances comparable to those of the US SSN sensors, as demonstrated by a campaign performed in 1989 [
60]. The results of the latter campaign are reported in Figure 1 of [
60]. In that image, the debris flux as a function of the altitude is plotted, showing a comparable amount of detections made by the MU radar with respect to the USSTRATCOM (former USSPACECOM) catalogue.
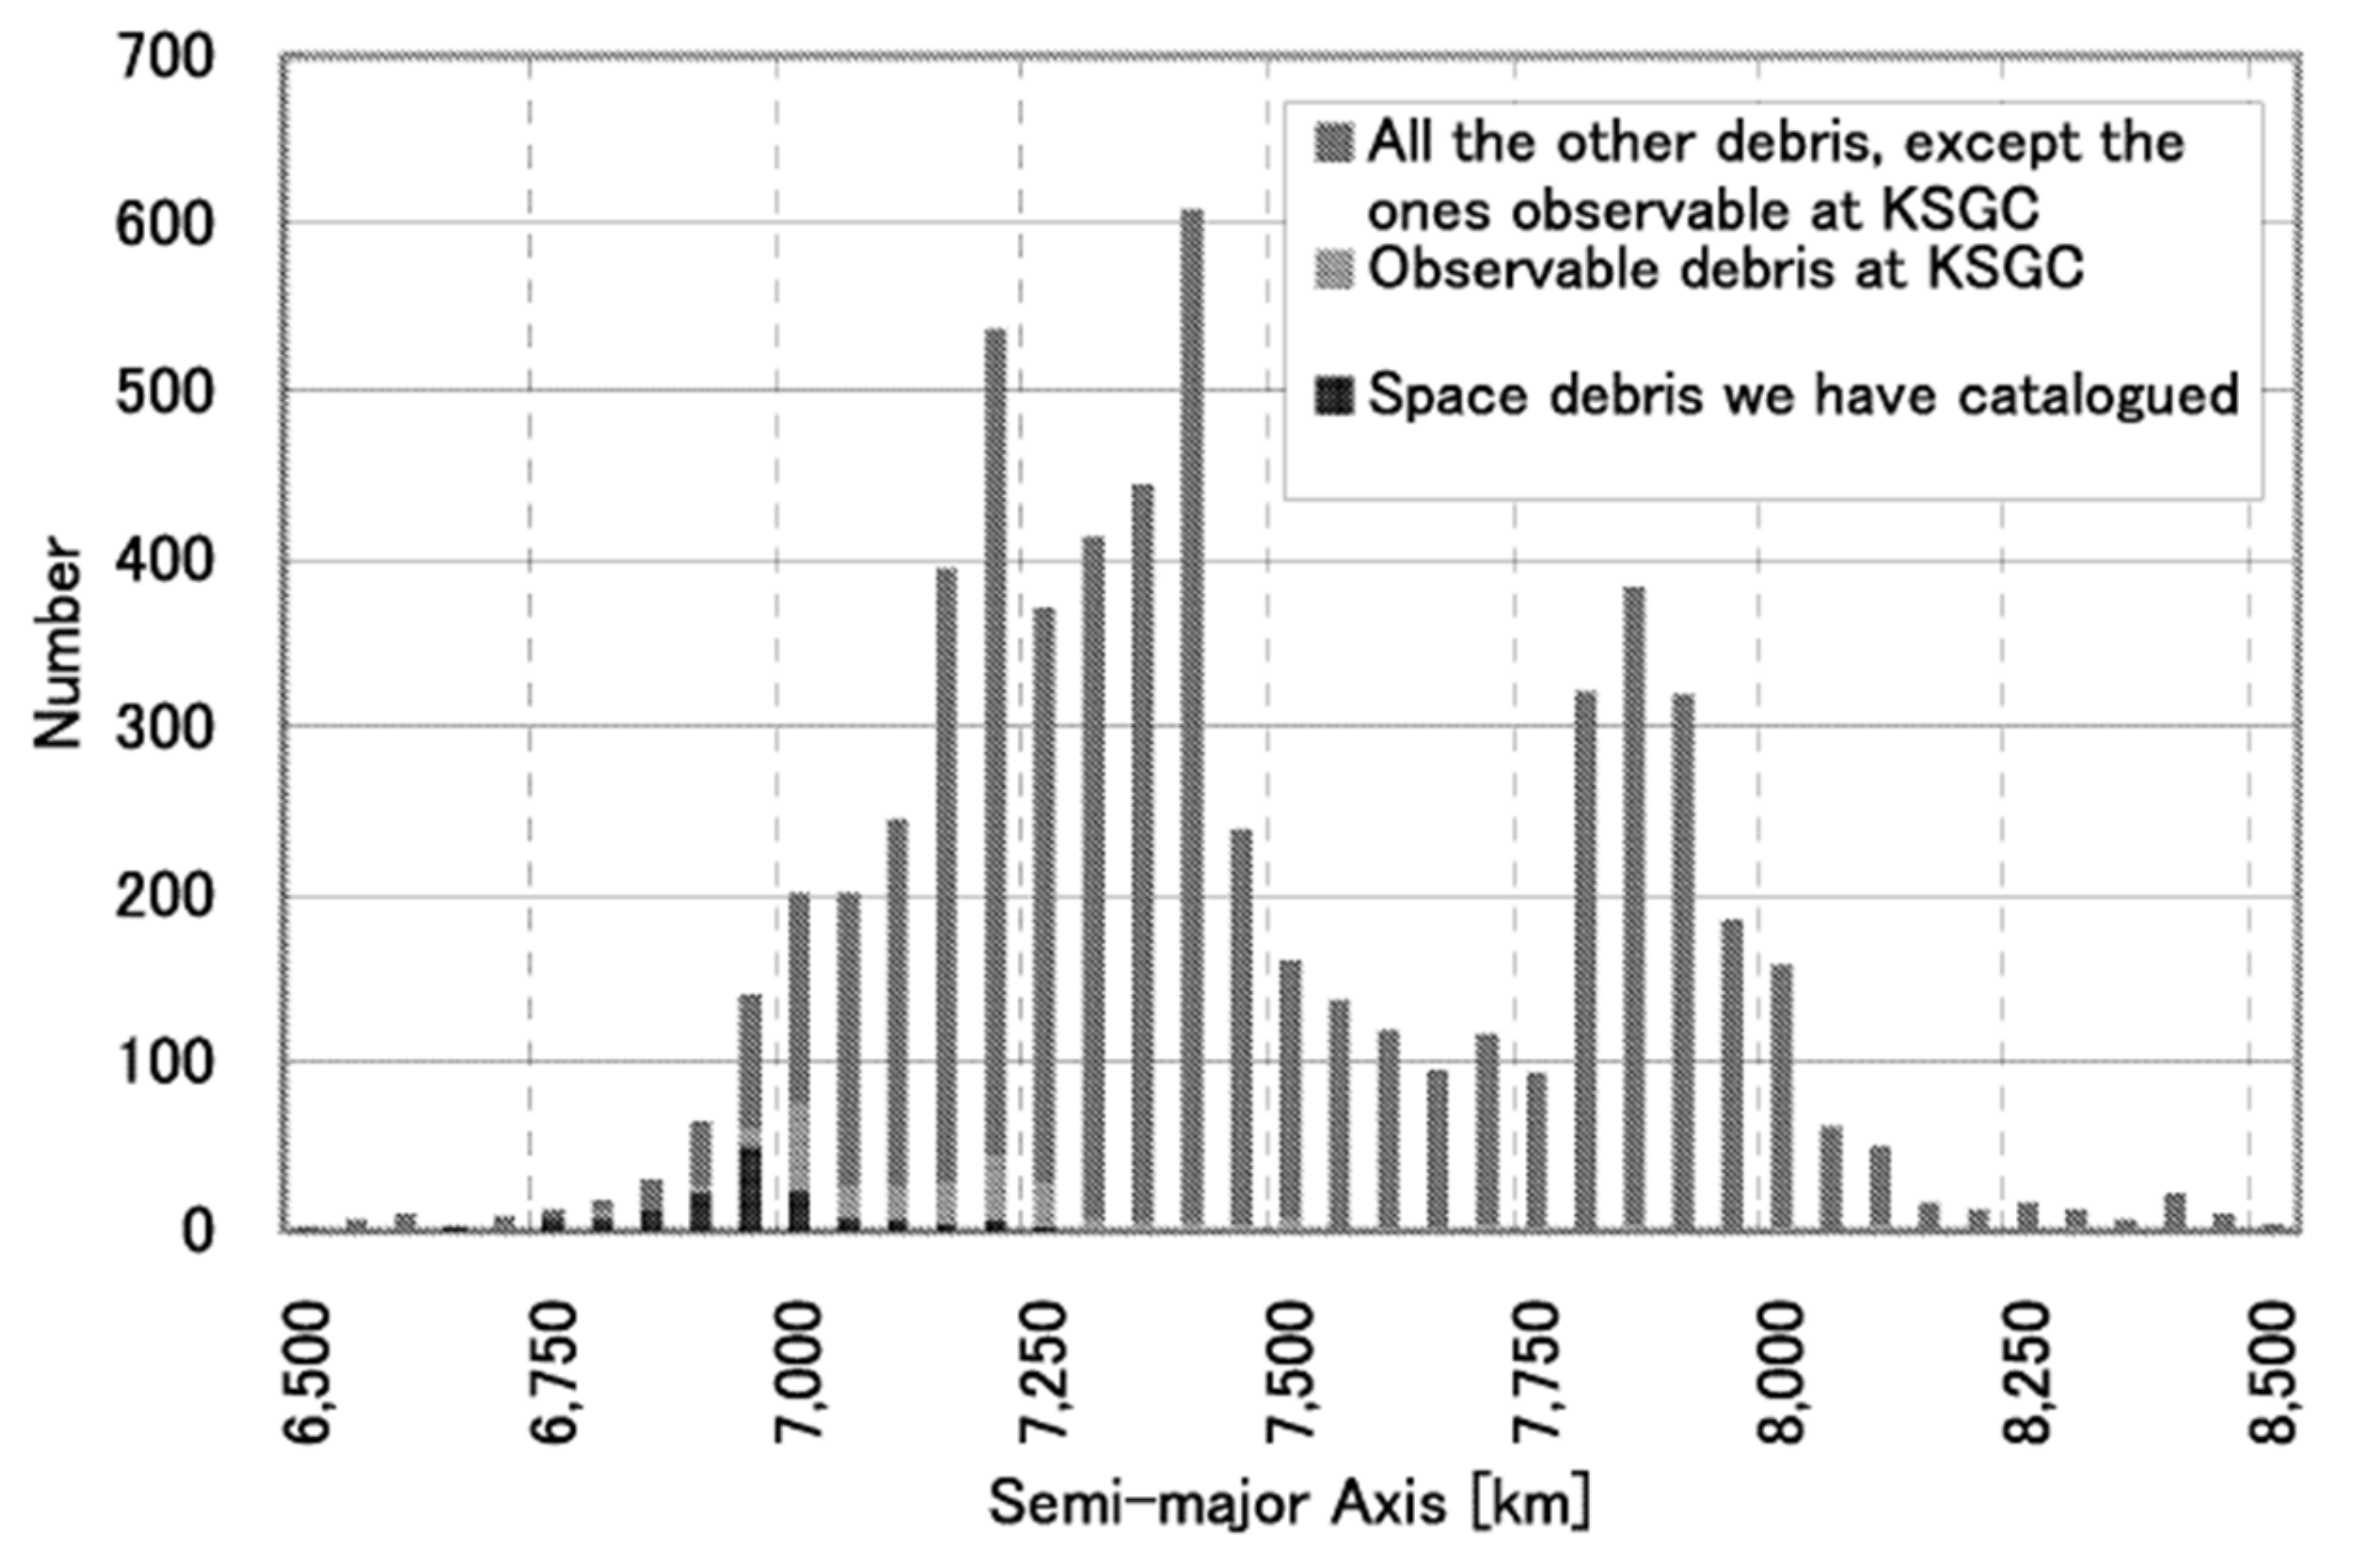
Another important sensor in the Japanese debris network is the Kamisaibara Space Guard Center (KSGC) radar located in Okayama Prefecture (the western part of Japan) [
62]. The KSGC radar is a S-band (3 GHz) 3 m × 3 m active phased array enclosed in a radome, equipped with 1395 transceiver modules (TRM) capable of transmitting a linearly polarized (vertical) signal with a peak power of 70 kW [
62,
63]. It is designed mainly for LEO detections, with its ability to observe 1 m-sized objects at a maximum of 1350 km slant range [
62,
63]. The radar was employed during the 2004 fiscal year, detecting more than 500 objects. The results of the campaign are reported in
Figure 23, showing the number of pieces of debris observable (and catalogued) by the KSGC radar vs. the semimajor axis of the orbit and comparing them with the total number of pieces of debris.
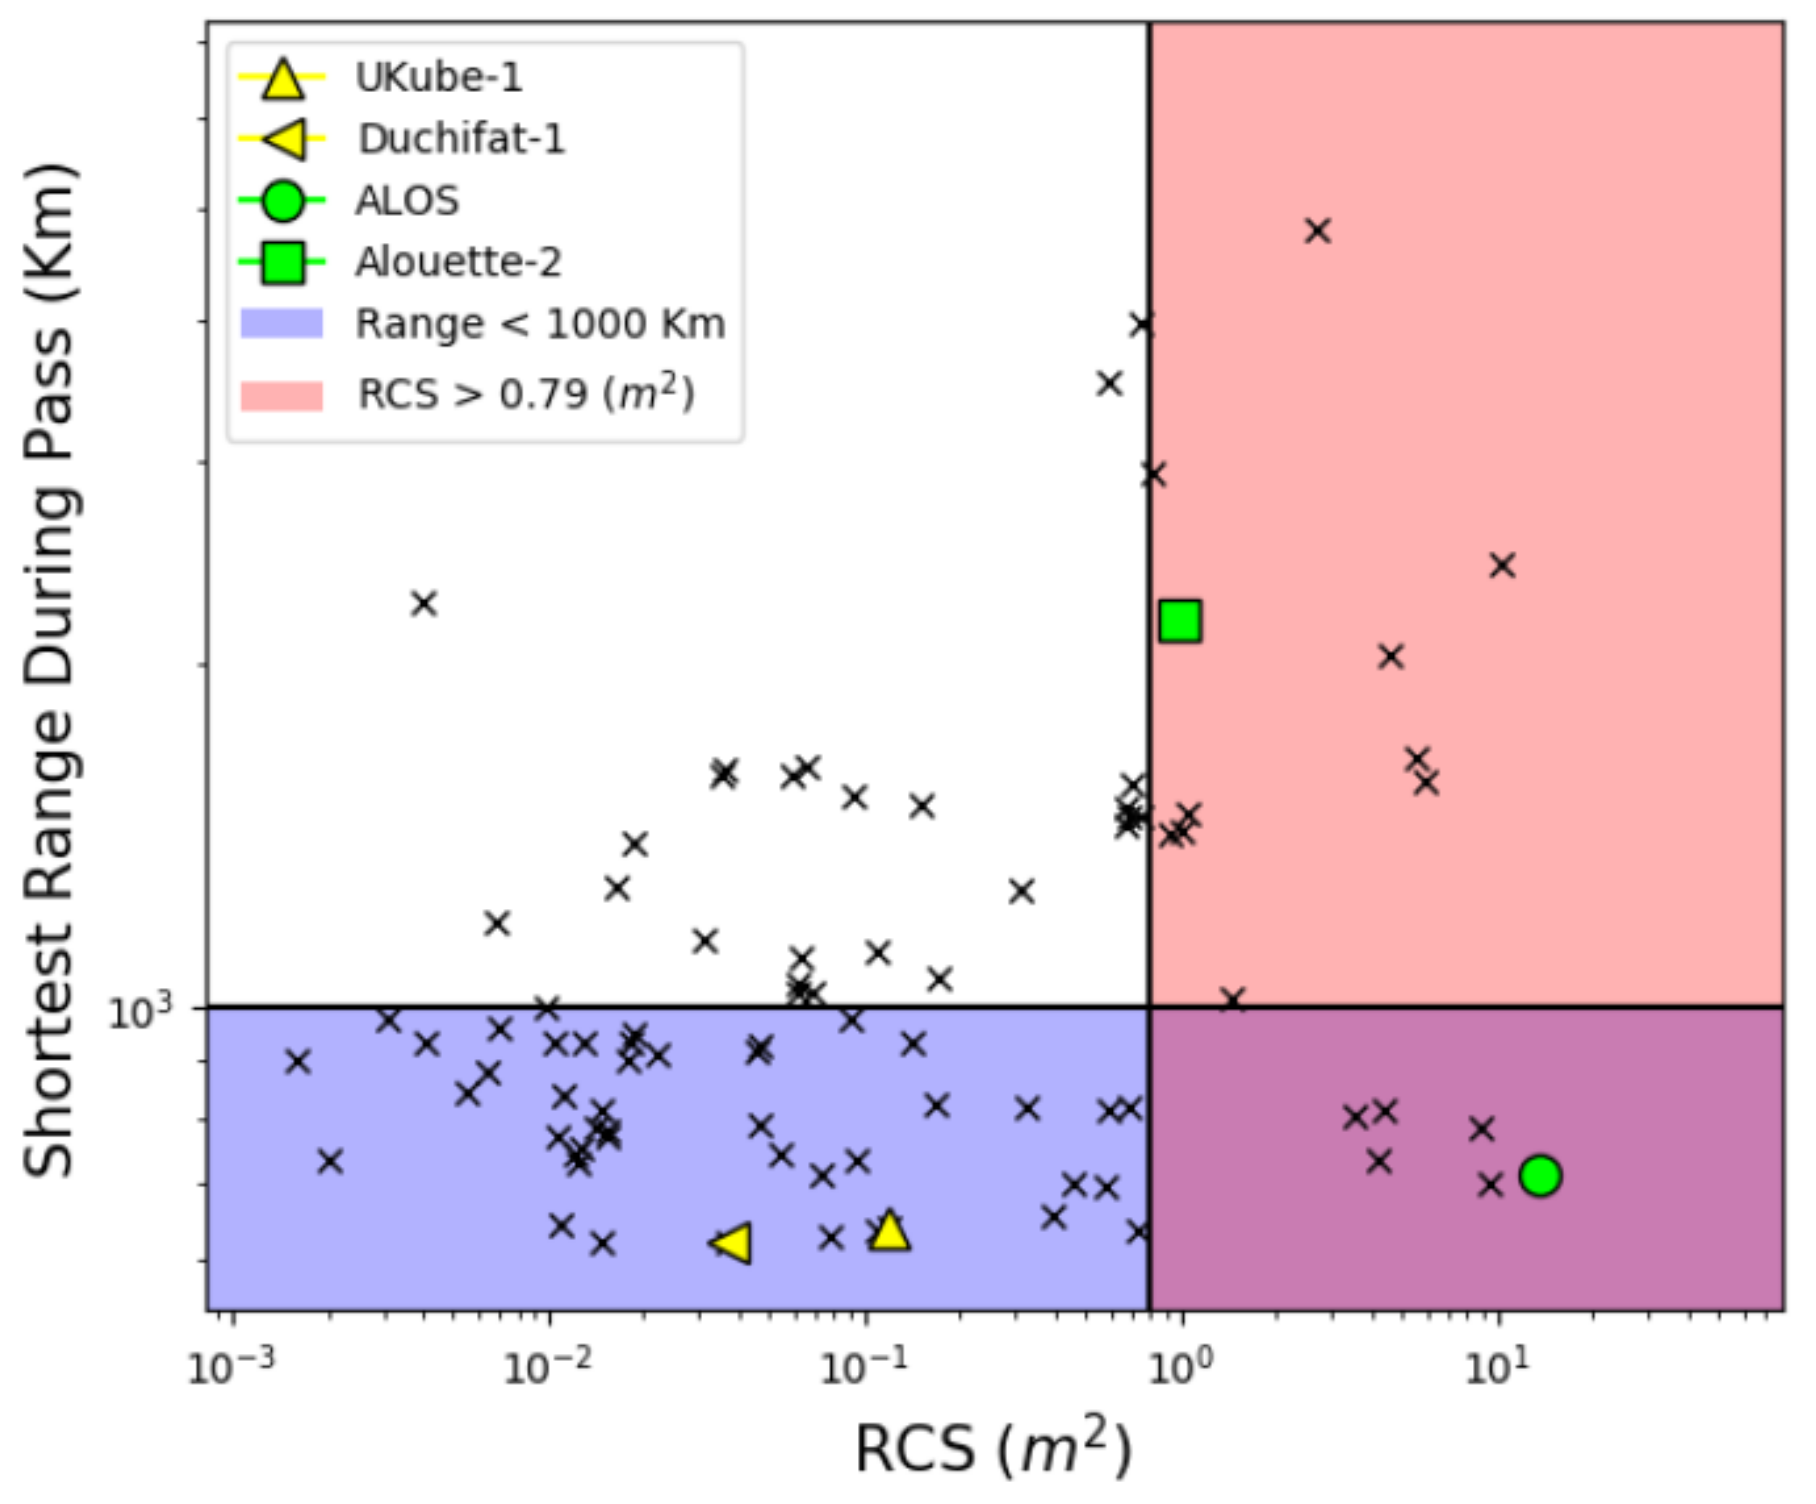
Recent advances in the field of SSA have been made by Australia thanks to the Murchison Widefield Array (MWA). The MWA is a low-frequency (80–300 MHz) interferometer radio telescope located in the Murchison region in western Australia [
64,
65]. The array is organized in tiles, and each tile is a 4 × 4 grid of dual-polarization dipole antennas with spacing of 1.1 m [
64,
65]. In its current status the MWA is equipped with 128 tiles, but 512 are expected as part of future plans. The peculiarity of this array is the fact that it takes advantage of a passive transmission, in the form of FM broadcast services, that can be reflected by objects in space [
64,
65]. With this expedient, the MWA was already able to detect the International Space Station’s (ISS) passage with 32 of the 128 tiles at its disposal [
65]. During a recent experiment (late 2014), in the attempt to detect not only the ISS but also small satellites, the MWA was able to capture several short duration signals that under closer investigation turned out to be space debris, confirming the desired detection capability of the radar [
66]. Some of the results of this campaign are reported in
Figure 24, showing a total of 49 objects detected within a time interval of 19.34 min.
The ability of the Ukrainian transmitter RT-70 to operate in a space debris radar scenario has briefly been discussed earlier in
Section 3. The RT-70 is a 70 m dual reflector parabolic antenna located in Evpatoria (Ukraine) that can operate in the frequency spectrum from VHF to X-band [
67,
68]. It is able to transmit a CW signal with a peak power of about 200 kW (at 5 GHz) [
67,
68]. Investigations on the suitability of the powerful transmitter in a bistatic configuration for debris measurements were conducted in the form of four trial experiments between 2001 and 2003 performed in Geostationary, Highly Elliptical and Medium Earth Orbits (GEO, HEO and MEO) [
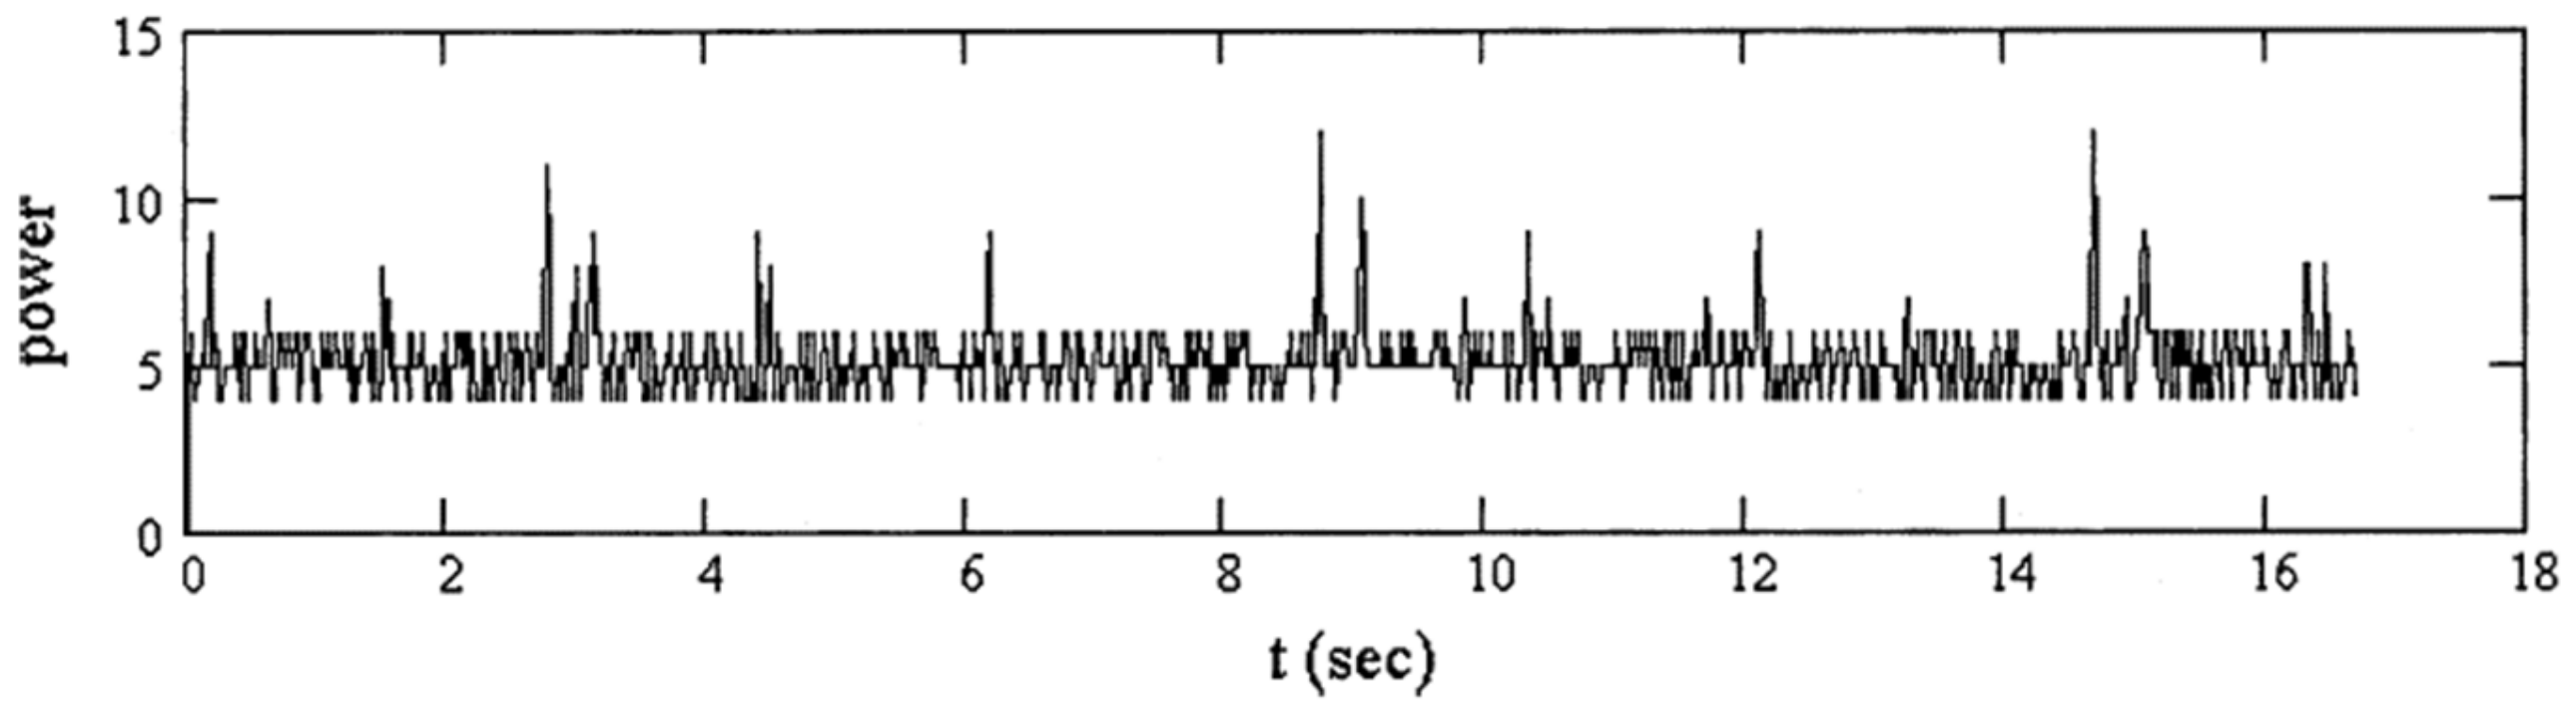
68]. During these experiments the RT-70 was employed in a differential interferometer radar technique using as a receiving segment other radars from the VLBI network, including Noto RT-32 (Italy), Torun RT-32 (Poland), Shanghai RT-25 (China), Urumqi RT-25 (China), and Bear Lakes RT-64 (Russia) [
68]. The first experiment (23–29 May 2001) was focused on the detection of GEO large inactive objects with small inclination, tracked by the RT-70 and their echoes recorded on magnetic tapes at the receiving locations. An example of the echo registered at Bear Lakes is reported in
Figure 25 showing the power intensity of the echo signal as a function of the observation interval.
A total of seven objects were tracked and recorded during this campaign. A first successful attempt at the correlation processing of one specific object to retrieve the Doppler shift was also made; however, the measurement lacked of accuracy. The second experiment (14–19 December 2001) aimed at the observation of HEO and GEO objects with sizes smaller than 1 m. Of the six objects detected, two belonged to HEO and the rest to GEO. This campaign also served as a test for GEO beam-park mode between Evpatoria RT-70 and Bear Lakes RT-64. The third experiment (23–29 July 2002) included the first attempt to track objects in MEO and a second attempt of the
beam-park mode, this time between Evpatoria and Noto, but the main goal was the ground testing of a new real-time interface designed in Noto. Once again, the number of detected objects was seven: two in HEO and five in GEO. Moreover, a new correlation processing was tested, improving the frequency resolution of the measurements. The fourth and final experiment (23–29 July 2003) included the observation of GEO, HEO and MEO objects, and a third test on the beam-park mode in order to detect small fragments in GEO, involving Evpatoria, Bear Lakes, Noto, and Urumqi. The number of observed objects was 10. All the four campaigns displayed the results as registered echoes from the receiving station, in the same fashion shown in
Figure 25. The overall number of detected objects (GEO, HEO, and MEO population) was 30.
Regrettably, despite being probably the second most fruitful source on space debris information, there are no relevant published works representing the Russian radar network. Nonetheless, there are some clues suggesting that one of the major Russian radars, i.e., the Don-2N phased array radar [
6], participated in one of the so-called Orbital Debris Radar Calibration Spheres (ODERACS) experiments in 1994 [
69]. The ODERACS experiments were a series of tests, sponsored by NASA, conducted between 1992 and 1995. They consisted of the release of three pairs of highly polished metal spheres with different diameters for calibration purposes and in order to identify which radar facility was able to detect small-sized debris [
69,
70]. The Don-2N phased array radar (a.k.a. Pill Box) is a 16 m diameter 4-face antenna working in S-band (4 GHz) with a peak power of 25 MW and an azimuth coverage of 360° [
71]. This radar was part of the early warning antiballistic missile sites of the former USSR that became fully operational in 1989 [
71]. During the ODERACS experiment, the Don-2N radar was able to track the smallest family of spheres with a diameter of 5.1 cm. An estimation of the radar’s sensitivity is reported on page 15 of [
69].
Among others noteworthy facilities of the Russian network we cite the Dnestr-M/Dnepr radars located in Olengorsk, Balkhash (Kazakhstan), Mishelevka, Sevastopol (Ukraine), and Mukachevo (Ukraine), the Daryal-type radar in Pechora and Gabala (Azerbaijan), and, finally, the Volga-type radar in Baranovichi (Belarus) [
72]. Like the Don-2N, these radars were once part of the early warning antiballistic missile network within the Soviet Union, and, except for the Dnestr-M/Dnepr radars, they are all large phased-array radars [
72].
Similarly to the Russian radar network, only fragments of information are retrievable about the People’s Republic of China’s (PRC) radars for debris measurements. As pointed out in [
73], there are several antennas spread across China that could be employed in space debris detection, including large parabolic reflectors and phased arrays. In [
6], it is postulated that some of the phased array radars used for LEO debris tracking are located in Kashi, Kunming, Hainan, Jiangxi, Changchun, Xuanhua (Hebei province), Henan province, and in an unspecified location in the north-western part of the country. Moreover, as already discussed, there is evidence of Chinese space debris activity in [
68], where the RT-25 in Shanghai and Urumqi, belonging to the VLBI network, were used as receivers in a space debris experiment.
6. Conclusions and Future Perspectives
The topicality of the space debris problem forces worldwide space agencies to build or reinforce radar sensor networks. While US holds primacy in efficiency and extension of the SSN network, other countries are gearing up in order to face the planetary threat. In addition, the interest of researchers in the field is getting higher, despite there not being many works available in the open literature. In this respect, this review aims to gather and assemble as much information as possible on radar measurements on space debris, displaying them in an informative and understandable fashion. The findings provide interesting considerations about the topic of debris measurement. Firstly, it is common to note the requalification of many facilities (in particular, former US and Russian antimissile structures during Cold war), which are now dedicated to space debris detection. Another common trait is the different primary mission of the many radar facilities, since plenty of the analyzed structures are radio telescopes devoted mainly to radioastronomy, that embrace space debris detection uniquely as a secondary objective. Among the radar types investigated, one of the most used layouts is easily the parabolic reflector, given its high gain, but common solutions also include phased arrays, which avoid mechanical pointing by means of digital beamforming networks. In order to help the reader to easily navigate through the analyzed radar configurations, a summary table (
Table 3) is presented, reporting name of the radar, geographic location, configuration, operating frequency, peak/average power, type of transmission, and minimum detectable size (if available).
From the works herein presented, it can be argued that the majority of the space debris radar measurements are performed in LEO; this is due to two main reasons, the first one being that LEO is surely the most crowded orbit, and the second one being the fact that in order to allow the EM echo to travel back from the debris to the receiver the power budget must be considerably high (in the order of magnitude of tens of kW and higher). This means that reaching higher orbits would require even more transmission power. Measurements on space debris are carried out employing different radar configurations, such as monostatic (where the transmitter and the receiver are the same antenna), bistatic (where transmitter and receiver are separated), or multistatic (with multiple transmitting/receiving sites). The mode of the observation also changes depending on the necessity, thus a beam-park mode is used to detect a large number of objects, including uncatalogued ones, whereas the tracking mode is used to focus on a particular object and retrieve more information about its orbit. The results provided by the articles on the subject are not limited to the number of objects observed but include different important information, such as range, altitude, RCS, effective size, and Doppler, outlining a detailed profile of the resident space objects.
To sum up, even in the scientific research field, the attractiveness of space debris is growing by the day, which is proven by the fact that new papers on the topic increased in number in the last two decades. This trend is expected to stay unaltered in the years to come. The radar monitoring of space debris is a rather complex and multifaceted process, which can be carried out in multiple ways, but the common objective is to define the current status of the debris population in order to mitigate the jeopardy associated with their presence in space.
As a result, taking advantage of technological evolution, radar systems for space debris monitoring and tracking will have improved performance with the availability of new hardware and software components on the market. From a hardware point of view, the clear tendency is to move towards the use of phased arrays or sparse arrays rather than large parabolic reflectors, thus favoring higher frequencies and wider bandwidths thanks to the fast data processing and digital beamforming provided by the new generation of CPUs, GPUs, and FPGAs [
33,
48,
74]. This opens up to the possibility for radar data digitization in situ rather than depending on a late postprocessing. On the software side, the way to go is the use of new algorithms for the processing of space debris data and images, improving the S/N ratio and decreasing the RCS of detectable objects [
75,
76]. These assumptions are reflected in the future coming of the new US Space Fence, the second-generation of the space surveillance systems. The new AN/FSY-3 Space Fence, located on Kwajalein Atoll with a second site expected in western Australia, is a S-band phased array with unprecedented detection capability, coverage, and tracking accuracy [
77,
78]. It will be able to provide both survey and tracking, increasing the number of trackable objects by ten times with respect to existing or recently retired US assets.


 ,
, 


