Article

Application of Artificial Neural Network to Somatotype Determination

by
Małgorzata Drywień
1,
Krzysztof Górnicki
2,* and
Magdalena Górnicka
1
1
Department of Human Nutrition, Institute of Human Nutrition Sciences, Warsaw University of Life Sciences—SGGW, 159C Nowoursynowska Str., 02-776 Warsaw, Poland
2
Institute of Mechanical Engineering, Warsaw University of Life Sciences—SGGW, Nowoursynowska 164 Str., 02-787 Warsaw, Poland
*
Author to whom correspondence should be addressed.
Appl. Sci. 2021, 11(4), 1365; https://doi.org/10.3390/app11041365
Submission received: 23 December 2020 / Revised: 29 January 2021 / Accepted: 1 February 2021 / Published: 3 February 2021
(This article belongs to the Special Issue Machine Learning in Medical Applications)

Abstract

:

Featured Application

The results of our study indicate the successful application of artificial neural networks—based model in predicting the endomorphy and mesomorphy ratings in young women. The artificial neural networks -model can be practically used in bioelectrical impedance analysis—devices in the future.

Abstract

Somatotype characteristics are important for the selection of sporting activities, as well as and the prevalence of several chronic diseases. Nowadays the most common method of somatotyping is the Heath–Carter method, which calculates the somatotype base on 10 anthropometric parameters. Another possibility for evaluation of somatotype gives commonly used bioelectrical impedance analysis), but the accuracy of the proposed formulas is questioned. Therefore, we aimed to investigate the possibility of applying an artificial neural network to achieve the formulas, which allow us to determine the endomorphy and mesomorphy using data on body height and weight and raw bioelectrical impedance analysis data in young women. The endomorphy (Endo), ectomorphy (Ecto), and mesomorphy (Meso) ratings were determined using artificial neural networks and the Heath–Carter method. To identify critical parameters and their degree of impact on the artificial neural network outputs, a sensitivity analysis was performed. The multi-layer perceptron MLP 4-4-1 (input: body mass index (BMI), reactance, resistance, and resting metabolic rate) for the Endo somatotype was proposed (root mean squared error (RMSE) = 0.66, χ2 = 0.66). The MLP 4-4-1 (input: BMI, fat-free mass, resistance, and total body water) for the Meso somatotype was proposed (RMSE = 0.76, χ2 = 0.87). All somatotypes (Endo, Meso and Ecto) can be calculated using MLP 2-4-3 (input: BMI and resistance) with accuracy RMSE = 0.67 and χ2 = 0.51. The bioelectrical impedance analysis and Heath–Carter method compliance was evaluated with the statistical algorithm proposed by Bland and Altman. The artificial neural network-based formulas allow us to determine the endomorphy and mesomorphy in young women’s ratings with high accuracy and agreement with the Heath–Carter method. The results of our study indicate the successful application of artificial neural network-based model in predicting the somatotype of young women. The artificial neural network model can be practically used in bioelectrical impedance analysis devices in the future.

1. Introduction

Somatometry is a fundamental research method in anthropology, involving the measurement of individual body proportions and sizes. A somatotype assessment gives a categorization of physique by using anthropometric measurement relating to body shape and composition, such as adiposity (fatness), musculo-skeletal build, and linearity or slenderness [1]. Somatotype ”expresses genetic determinism, observed from the morphoconstitutional point of view” [2]. The somatotype describes the actual morphological state of the individual expressed by three numbers, each of which represents one of three primary body components: endomorphy—mesomorphy—ectomorphy [3]. Simplifying, endomorphy—fatness, mesomorphy—muscularity, while ectomorphy defines thinness. The somatotype changes with age, and e.g., ectomorphy in females aged over 60 years has decreased and females tend to higher endomorphy values [4].
The evaluation of a somatotype and body composition is important for the selection of sporting activities [5]. Somatotyping in elite athletes is important for studying the dynamics of development of specific body shape during training processes and competitive periods [6,7,8]. It also helps for developing body building and performance [1,6,9]. Somatotype characteristics are a subject of research for a relation between somatotype, obesity, and particular features of nutrition [10], as well as the prevalence of several chronic diseases [11,12,13].
The most common method of somatotyping used today is the Heath–Carter method, which calculates the somatotype base on 10 anthropometric parameters using standard methods and licensed anthropometric instruments, without restrictions on ethnicity, gender or age (above 2 years) [14]. Values of anthropometric measures are entered into equations. The Heath–Carter method involves traditional methods for body fat estimation using skinfold calipers. The accurate assessment is strong depending on the technical experience and training, and requires specially trained and experienced personnel to perform it. It was shown that inter- and intra-individual variability in the selection of skinfold sites, depth and time delay in reading the calipers reduce the accuracy of this procedure and remain a major source of error associated with this technique [15,16]. Moreover, the disadvantages of anthropometric measurements limit the availability of large-scale research [17]. Measurements should be made in several repetitions by 2 researchers, can be tiring and depressing for the participant and can be negatively perceived as interference with the physical space. In addition, anthropometric measurements involving the naked body of the patient may be difficult to accept and should, therefore, be limited using other methods. Next to skinfolds measurement to establish body composition (fat content, muscle mass and water) relatively simple and more accurate method is bioelectrical impedance analysis (BIA). This is the most common, non-invasive, low-cost used method in sports, dietetics, medicine, healthcare. BIA bases on the electrical properties of biological tissues, and is defined as the ability of biological tissue to impede electric current [18]. Specific equations programmed in the BIA devices are used to calculate the body components, taking into account gender, age, height, weight and ethnicity. BIA, in comparison with the skinfold method mentioned above, gives more precise results determining lean or fat mass in humans [19,20]. The BIA method omits the procedures of repeatedly touching the patient, especially in places considered sensitive. Physical contact is generally limited, which has become more important recently. However, BIA is a non-invasive, easy to use and low-cost method [21], and gives an opportunity to the evaluation of somatotype based on created formulas [17]. In literature, a few formulas based on BIA data and linear regression analysis were proposed for different population groups to assess the endomorphy and mesomorphy [17,22,23]. All of those depended on age and sex.
Recently, the application of artificial neural networks (ANNs) in medical and nutritional sciences has been of great interest and raised hopes for better prevention, diagnosis and health care [24,25,26]. ANNs have been successfully applied in clinical trials s to predict the risk of dengue disease [27,28] or the level of cholesterol associated with body composition [29].
However, they have rarely been used in body composition analysis. An ANN was used to assess bone mineral density [30], intracellular water in healthy subjects [30,31], and total water in hemodialysis patients [32], and an ANN was found here to be an alternative to existing methods of multivariate analysis. The use of an ANN to improve the BIA predictive equations to estimate total fat-free mass [33], and fat-free mass in the lower limbs [34,35] in the elderly has shown the successful application of their model. Therefore we aimed to investigate the possibility of applying ANNs to achieve the formulas which allow the endomorphy and mesomorphy rating to be determined using data on body height and weight and raw BIA-data.

2. Materials and Methods

2.1. Study Design

This was a cross-sectional observational study on healthy volunteer women of Polish ethnicity aged 19–29 years. At this age, adulthood is characterized by somatic and psychological indicators with a stabilized somatotype [36]. The research was approved by the Bioethics Commission of the Food and Nutrition Institute in Warsaw, Poland (06.07.2015). The study procedures were implemented according to the Declaration of Helsinki. Informed consent was obtained from each participant before their entry into the study. For the study, 190 women volunteered. The following inclusion criteria were adopted: informed consent to participate in the study protocol, no metabolic disorders, as assessed through an interview. The exclusion criteria were as follows: pregnancy, breastfeeding, epilepsy, menstruation. The above criteria did not meet 17 women (n = 10 body mass index (BMI) > 30; n = 6 type II diabetes and 1 with kidney diseases). The final sample consisted of 173 women.

2.1.1. Anthropometric Measurement

The subjects’ body height (H, cm) was measured using a SECA stadiometer (measurement accuracy 0.01 m), body weight (BW, kg) was measured using medical scales (measurement accuracy ±0.1 kg). Skinfolds were measured with a Harpenden caliper, the femur and humerus breadths were measured with a small sliding caliper, the caliper branches extend to 10 cm. All measurements were performed under strictly standardized conditions (room temperature 22 °C, air humidity 45%) by well-trained researchers maintaining methodical procedure described below [37], using the same device in order to avoid inter-observer and inter-device variability. Measurements were taken twice in light clothing and without shoes and the averages were calculated. Mean technical error of measurement for skinfolds was 2.6% and for all other measures 0.33%. Intra-class correlation coefficient (ICC) was not lower than 0.85 for all measures [38].

2.1.2. Measurement Techniques

Ref. [39]. Height (H). Height was taken with the subject standing straight, against an upright stadiometer, touching the device with heels, buttocks and back. The head was oriented in the Frankfort plane (the upper border of the ear opening and the lower border of the eye socket on a horizontal line), and the heels together. The subject was instructed to stretch upward and to take and hold a full breath.
Body weight (BW). The subject, wearing minimal clothing (underwear is recommended), stands in the center of the scale platform. A correction was made for clothing so that nude weight could be used in subsequent calculations.
Skinfolds. A fold of skin and subcutaneous tissue was raised firmly between the thumb and forefinger of the left hand and away from the underlying muscle at the marked site. The edge of the plates on the caliper branches was applied 1 cm below the fingers of the left hand and they were allowed to exert their full pressure before reading at 2 s the thickness of the fold. All skinfolds were taken on the right side of the body. The skinfolds were taken from the subject standing relaxed, except for the calf skinfold, which was taken with the subject seated.
Triceps skinfold (TS). With the subject’s arm hanging loosely in the anatomical position, the fold at the back of the arm at a level halfway on a line connecting the acromion and the olecranon processes should be raised.
Subscapular skinfold (SubsS). The subscapular skinfold on a line from the inferior angle of the scapula in a direction that is obliquely downwards and laterally at 45 degrees should be raised.
Supraspinale skinfold (SuprS). The fold 5–7 cm (depending on the size of the subject) above the anterior superior iliac spine on a line to the anterior axillary border and on a diagonal line going downwards and medially at 45 degrees was raised.
Medial calf skinfold (CS). The vertical skinfold on the medial side of the leg, at the level of the maximum girth of the calf was raised.
Biepicondylar breadth of the humerus, right (HB). The width between the medial and lateral epicondyles of the humerus with the shoulder and elbow flexed to 90 degrees was measured.
Biepicondylar breadth of the femur, right (FB). The subject was seated with the knee bent at a right angle during the measurement. The greatest distance between the lateral and medial epicondyles of the femur was measured.
Upper arm girth (AG). The right elbow was flexed and tensed. The subject flexed the shoulder to 90 degrees and the elbow to 45 degrees, clenched the hand, and maximally contracted the elbow flexors and extensors. The measurement was taken at the greatest girth of the arm.
Calf girth (right calf) (CG). The subject stood with feet slightly apart. The tape was placed around the calf and measured the maximum circumference.
The stature and girths to the nearest mm, biepicondylar diameters to the nearest 0.5 mm, and skinfolds to the nearest 0.1 mm (Harpenden caliper) were read. The measured sites were marked and the complete sequence repeated a second time. For further calculations, the duplicated measurements were averaged.
The individual anthropometric somatotypes were calculated for components—endomorphy (Endo), mesomorphy (Meso), ectomorphy (Ecto) by entering the data into equations, according to Carter and Heath [39]:
Ecto = H BW 1 3 ,
where H is the height [m], BW is the body weight [kg]
Endo = 0.7182 + 0.1451   X 0.00068   X 2 + 0.0000014   X 3 ,
where:
X = TS   mm + SubsS   mm + SuprS   mm   ×   170.18 / H   cm ,
Meso = 0.858   HB   +   0.601   FB   +   0.188   AG   corrected   +   0.161   CG   corrected     0.131   H   +   4.50
BMI was calculated as BW/H (kg/m2) [40]. BMI was categorized according to the World Health Organisation (WHO) [41]; 76% of women had normal body weight, whereas 13% were classified as underweight and 11% as overweight and obese (data not shown).

2.1.3. Body Composition Analysis

Before the body composition measurement participant was asked to refrain from vigorous physical activity at least 12 h prior, intake no caffeine and alcohol for 24 h prior to testing, fast, and empty the bladder 30 min prior to testing. Hydration status was tested in urine sample by specific gravity test and colors in each person. To assess individual body composition, multi-frequency BIA (MF-BIA) was used, at 5, 50, 100 and 200 kHz electrical current frequencies (Maltron BioScan 920-2, Maltron International, UK). MF-BIA was performed under standardized conditions according to the manufacturer’s protocol. Body composition tests were performed in the supine position with a leg opening of 45 degrees and upper limbs inclined by 30 degrees from the trunk, after 15 min resting. After cleaning the skin with alcohol, two electrode patches were placed on the non-dominate hand and two electrodes on the corresponding foot. The impedance measurements were performed in a single-channel, tetrapolar system. Displaying parameters such as extracellular and intracellular fluids, total body water (TBW, L, %), fat mass (FM, kg, %), fat-free mass (FFM, kg, %), resting metabolic rate (RMR, kcal), dry weight and many others including mineral composition, as well as raw data such as resistance (Res) and reactance (Reac) were analyzed. For further analysis, TBW (%), FFM (%), RMR, Res (Ω), and Reac (Ω) were selected.
The descriptive statistics of anthropometric, body composition, bioelectrical and somatotype components are presented in Table 1.

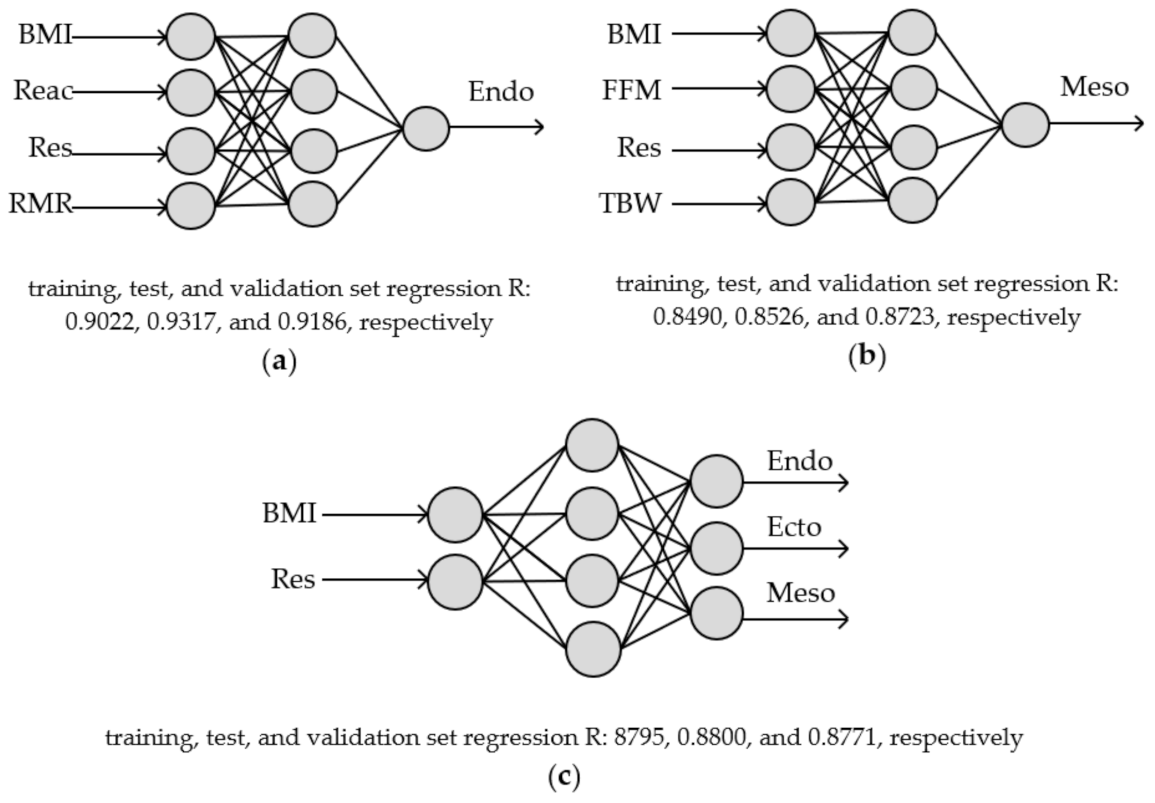
2.2. Somatotypes Modelling—Artificial Neural Network (ANN)

ANN modelling was carried out with Matlab R2018a. The somatotypes Endo, Meso and Ecto were predicted with feedforward multilayer perceptron ANN. In this study, 173 cases were randomly divided into the following sets: for training 121 sample (70% cases), for validation 26 samples (15% cases) and for testing 26 samples (15% cases) [42,43]. Data were normalized using a function (mapminmax):
y = y max y min x x min x max x min + y min
where x is the value before normalized (range xmin and xmax in Table 1) and y is the value after normalized.
The Levenberg–Marquardt training function was used in study. Detailed information on the selection of the ANN architecture and the ANN learning process can be found in [42,44].
The goodness of fit of the tested ANNs to the experimental data was evaluated with the correlation coefficient (R), the reduced chi-square (χ2), and the root mean square error (RMSE) [45,46]. The higher the R-value, and lower the RMSE and χ2 values confirm better goodness of fit.

2.3. Sensitivity Analysis of the ANN

To identify critical parameters and their degree of impact on the ANN outputs (somatotypes), a sensitivity analysis was performed. This analysis indicates the importance of individual network input variables (see Table 1) and consists of checking how the network error behaves with a change of independent variables. For each input variable, its average value was entered (the variable ceases to provide any information) and the final prediction error was checked. No increase in error means that this variable for the ANN is not significant and can be omitted.

2.4. Statistical Analysis

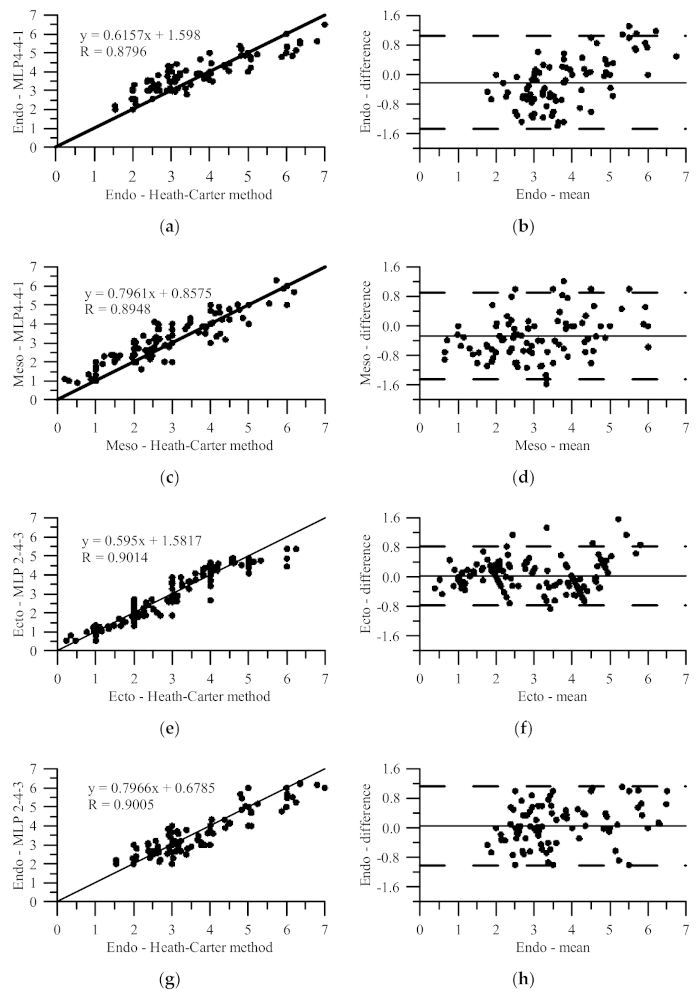
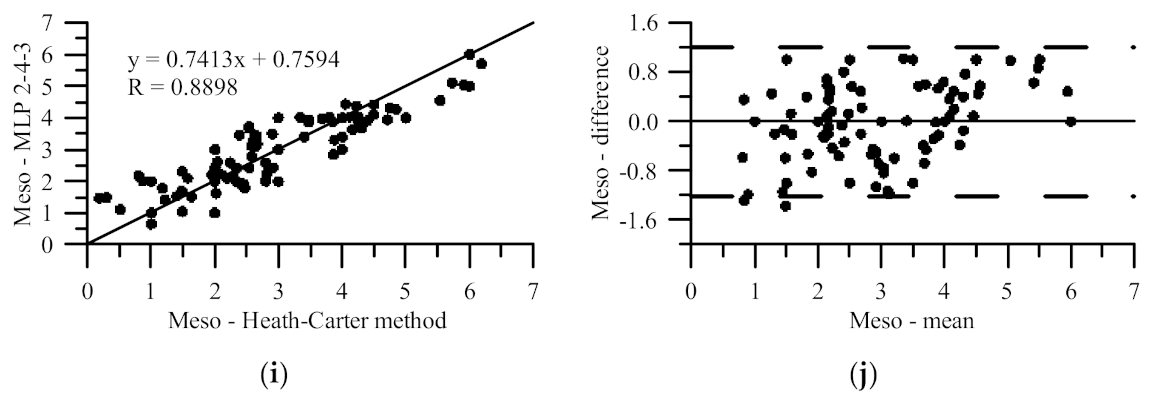
BIA and Heath–Carter Method Compliance

To evaluated of BIA and Heath–Carter method compliance, the statistical algorithm proposed by Bland and Altman was used [47]. Bland–Altman analyses assess the magnitude of the disagreement (error and bias) between the somatotypes determined by Heath-Carter method and ANNs. The Bland–Altman plots were generated to graphically depict these differences and to calculate the 95% limits of agreement as a reference interval between which lie all but 5% of the observed differences in an intraobserver measurement.
The accuracy of the available literature BIA-based models for the somatotype determination was compared. The accuracies of the models were measured using correlation coefficient R, the root mean square error (RMSE) and reduced chi-square χ2. Homogenous groups were tasted using Tukey’s honest significant difference (HSD), α = 0.05 (the analysis of variance (ANOVA) technique applying the Levene test of homogeneity of variances).

3. Results

The ANNs were used to describe Endo, Meso and Ecto somatotypes. Hidden and output layers with a log-sigmoid (logsig), hyperbolic tangent sigmoid (tansig) and linear (linear) transfer function were used for the prediction of the somatotypes whereas and the Levenberg–Marquardt (trainlm) was the training function.
The ANNs were selected to determine somatotypes. These networks had one hidden layer. Three-layer neural networks MLP 6-5-1 (multilayer perceptron) were used to determine Endo, Meso or Ecto somatotypes, while three-layer neural network MLP 6-4-3 was used to determine these three somatotypes simultaneously. It should be noted that the ectomorphy is be calculated on the basis of height and weight, therefore it does not require further simplifications and it was excluded in the calculation from MLP with one output layer. The input parameters were all parameters shown in Table 1. The transfer function for hidden layer was log-sigmoid, and for output layer tangent sigmoid and linear for MLP 6-5-1 and MLP 6-4-3, respectively. The highest values of the correlation coefficient were obtained for ANN describing Endo somatotypes (validation: 0.96). The correlation coefficient for ANN describing all somatotypes simultaneously is higher (R = 0.91 for validation set). Results of statistical analyses on the modelling of somatotypes are presented in Table 2.
Comparing the statistics of ANNs obtained for individual somatotypes from different ANNs, it can be seen that ANN MLP 6-4-3 describes all somatotypes worse than ANNs with one output. However, the aforementioned ANN allows us to determine simultaneously (given the same weights and bias between input and hidden layer) all somatotypes and the errors are not much larger compared to the single-output ANN (RMSE greater by 0.14 and 0.08 for Endo and Meso, respectively) and so it can be considered suitable for somatotype calculation.
Sensitivity analysis of ANNs showed that in the case of MLP 6-5-1 (for Endo) the TBW (the greatest R = 0.93, the lowest errors: RMSE = 0.51, χ2 = 0.61) and FFM (R = 0.91, RMSE = 0.53, χ2 = 0.66) have the lowest impact, whereas in sequence: Reac (smallest R = 0.78, biggest errors: RMSE = 0.84 and χ2 = 1.63), BMI, Res, and RMR have the greatest impact on the Endo somatotype. The Reac (the greatest R = 0.86, the lowest errors: RMSE = 0.70 and χ2 = 1.14) and RMR (R = 0.82, RMSE = 0.77, χ2 = 1.39) have the lowest impact, while in turn: BMI (R = −0.11, the greatest errors: RMSE = 1.53 and χ2 = 5.41), TBW, FFM and Res have the greatest impact on the Meso somatotype values.
The ANN for determining all somatotypes (MLP 6-4-3) is characterized by the fact that TBW and Reac have the lowest impact on obtained somatotypes (the highest R values of 0.90 and 0.89, respectively, the lowest RMSE = 0.63 and χ2 of 0.50 and 0.48, respectively) and next RMR and FFM while the highest impact has the BMI (R = 0.16, the RMSE = 1.52 and χ2 = 2.80) and Res. For the Endo somatotype determined from MLP 6-4-3, as for all somatotypes, Res has a large (2 in order, after BMI) impact (R = 0.48, RMSE = 1.29, χ2 = 3.65). For the Ecto somatotype, Res has a large impact (R = 0.94, RMSE = 0.52, χ2 = 0.58): third in order after BMI and RMR (R = 0.91, RMSE = 0.61, χ2 = 0.81), whereas for the Meso somatotype the effect of Res is similar to other parameters.
After taking into account the results of sensitivity analysis of ANNs (reducing the number of input data) and applying linear activation functions in the output layer, the following straight neural networks were obtained for somatotype determination (Figure 1).
Comparing the obtained ANN: MLP 4-4-1 for Endo and Meso with MLP 6-5-1, it can be seen those correlation coefficients are slightly worse (R of 0.87 and 0.83 for Endo and Meso, respectively). The correlation coefficient for MLP 2-4-3 is also not much worse than for MLP 6-5-3 and it is 0.88.
The Endo somatotype can be calculated from the ANN (MLP 4-4-1):
Endo = 5 i = 1 4 W i F i + W b + 1 2 + 2 ,
where F(i=1,2,3,4) can be calculated using:
F i = 2 1 + exp D 1 i BMI 16.4 5.7 1 + D 2 i Reac 86.1 97.7 1 + D 3 i Res 194 343.5 1 + D 4 i RMR 1373 173 1 + D 5 i 1 ,
and weights (D1i-D4i and Wi) and biases (D5i and Wb) are in Table 3.
The Meso somatotype can be calculated from the ANN (MLP 4-4-1):
Meso = 5 i = 1 4 W i F i + W b + 1 2 + 1
where F(i=1,2,3,4) can be calculated using:
F i = 2 1 + exp D 1 i BMI 16.4 5.7 1 + D 2 i FFM 57.53 16.765 1 + D 3 i Res 194 343.5 1 + D 4 i TBW 43.32 14.755 1 + D 5 i 1
The Endo, Ecto and Meso somatotypes can be calculated from the ANN (MLP 2-4-3):
Endo = 5 i = 1 4 W Endo   i F Endo   i + W b   Endo + 1 2 + 2
Ecto = 5 i = 1 4 W Ecto   i F Ecto   i + W b   Ecto + 1 2 + 1
Meso = 5 i = 1 4 W Meso   i F Meso   i + W b   Meso + 1 2 + 1
where FEndo i, FEndo i and FEndo i can be calculated according to:
F i = 2 1 + exp D 1 i BMI 16.4 5.7 1 + D 2 i Reac 86.1 97.7 1 + D 3 i 1
weights (D1i, D2i and Wi) and biases (D3i, Wb) of the ANN are in Table 3.
The results of statistical analysis (Table 2) shown that calculation of somatotypes from simpler ANNs: Endo—using MLP 4-4-1 (RMSE = 0.66, greater by 0.21 than for MLP 6-5-1) and Meso—using MLP 4-4-1 (RMSE = 0.76, by 0.15 more than for MLP 6-5-1) is possible. However, considering the fact that the values of all somatotypes are usually needed at the same time, the proposed ANN (MLP 2-4-3) is the easiest to use. Although R is 0.88, comparing its statistics for each of somatotypes with the other proposed, more complex ANNs, the Endo somatotype is calculated more accurately (RMSE = 0.61) than with MLP 4-4-1 (RMSE smaller by 0.05) and not much worse than with MLP 6-4-3 (RMSE greater by 0.02) and MLP 6-5-1 (RMSE greater by 0.16). The Ecto somatotype calculated from MLP 4-2-3 (RMSE = 0.62) gives worse results than that calculated from MLP 4-3-1 (RMSE greater by 0.16), from MLP 6-4-3 (RMSE greater by 0.1), and from MLP 6 -5-1 (RMSE greater by 0.24). The Meso somatotype calculated from MLP 4-2-3 (RMSE = 0.77) gives slightly worse results than that calculated from MLP 4-4-1 (RMSE greater by 0.02), from MLP 6-4-3 (RMSE greater by 0.09) and worse than that calculated from MLP 6-5-1 (RMSE greater by 0.16).
In our study group the mean somatotype was 3.6-2.9-2.9 by the Heath–Carter method and 3.6-2.9-2.9 by ANN MLP 2-4-3 (Table 4), that indicates on mesomorphic-endomorph somatotype. The study of Sidneyeva and Rudnev [23] with BIA-based formulas found that in Russian a adult meso-endomorphic type prevailed in females aged 16–86 years, and somatotype was age-related. They also noted age- and sex-related patterns of somatotype changes. The endomorph somatotype is dominant in the average woman, especially if she is not involved in sports while in men the mesomorph dominates. Many studies confirm that women are predominantly endomorphic with a secondary mesomorphic component [48,49,50].
Figure A1 presents Scatterplot of Ecto, Endo and Meso somatotypes and levels of agreement graph from Bland-Altman analysis.
Bland–Altman 95% limits of agreement for somatotype determination using the Heath-Carter method and ANNs were −0.26 (95% confidence interval (CI): −1.43, 0.91) and 0.01 (95% CI: −1.21, 1.19) for Meso (MLP 4-4-1 and MLP 2-4-3, respectively), −0.21 (95% CI: −1.47, 1.05) and 0.06 (CI: −1.02, 1.14) for Endo (MLP 4-4-1 and MLP 2-4-3, respectively) and 0.03 (CI: −0.77, 0.83) for Ecto (MLP 2-4-3). The differences between the values of each somatotype calculated using the Heath–Carter method and ANNs are statistically insignificant (Table 4). Results of the above statistical analyses proved that somatotype rating by ANNs has a high agreement with somatotype determination by the Heath–Carter method and, as mentioned above, BIA data are easier to obtain than anthropometric measurements.
To determine factors (ANN input data), which most affect the somatotypes predicted by ANN, a sensitivity analysis was performed. Results of sensitivity analysis of ANNs are presented in Table 2.
Sensitivity analysis of ANNs shows that for MLP 4-4-1 the RMR (the largest R of 0.84, the greatest values of errors: RMSE = 0.74 and χ2 = 0.83), Reac, and Res have the smallest impact, whereas BMI (the smallest R = 0.47 and the greatest errors: RMSE = 1.14 and χ2 = 1.98) has the greatest impact on the value of the determined Endo somatotype. The smallest impact on the Meso somatotype form MLP 4-4-1 has Res (the greatest R of 0.81, the smallest errors: RMSE = 0.83 and χ2 = 1.04) and TBW) while the greatest impact are from FFM and BMI, respectively (R is 0.55 and 0.61, RMSE: 1.13 and 1.09, χ2 = 1.96 and 1.83, respectively).
The ANN MLP 2-4-3 for determining all somatotypes is characterized by the fact, that the smallest impact on the value of the somatotypes has Res (the greatest R of 0.83, the smallest RMSE = 0.78 and χ2 = 1.19), whereas the greatest impact has BMI (R = 0.26, RMSE = 1.35, χ2 = 2.07). An analogous relationship also exists for each somatotype separately.
This is to our knowledge the first study that specifically develops and applies ANNs to predictive equations for young women and opts for using also raw BIA variables to estimate somatotype. Due to the lack of results using ANNs for somatotypes in existing literature, discussion of our result is not possible. Therefore, we decided to test the accuracy of existing BIA-based formulas (Table A1) using our data. In recent years [51] using raw BIA-data have gained attention due to their association not only with FFM, but also markers with extracellular/intracellular distribution of water, BMC, integrity and muscle quality. Also, raw BIA-data as resistance (R), reactance (Xc) and phase angle (PhA) could be treated as indices of biological variables [52]. A few existing BIA-based formulas to calculate endo- and mesomorphy ratings [19,20,21,22,23,24] based on the value of resistance at 50 kHz, BMI, body weight, fat mass and fat free mass, as well as gender and age were considered.
Taking into account the age of our group, we could use only two existing BIA-based formulas [17,23] for endo- and mesomorphy. The statistical results obtained (Table A1) by using equations to assess endo- and mesomorphy in age groups 16–61 and 16–40, indicate how limited those applications are in our group. Better results we obtained using ANNs, but higher homogeneity of our group (young women) and differences in the devices (single- or multi-frequency BIA) should be noted. Moreover in our study, we used a few raw BIA variables (not only resistance value at 50 kHz). Due to the fact that BIA data are influenced by various factors, e.g., device, patient positions (standing, lying), measurement conditions and electrode type, the obtained formulas can be specific for our study conditions.
The present study showed the possibility of Ecto, Endo and Meso somatotypes calculation in young women using ANN based on the BIA results. Our study shows a very good agreement between ANN-based formulas and the Heath–Carter method. The proposed ANNs: MLP 4-4-1 (Endo and Meso) accurately describe the somatotypes (R ∈ (0.83–0.87), RMSE ∈ (0.66–0.76), χ2 ∈ (0.66–0.87). All somatotypes (Ecto, Endo and Meso) can be calculated using MLP 2-4-3 (R = 0.88, RMSE = 0.67, and χ2 = 0.51). It should be noted that the ectomorphy is be calculated on the basis of height and weight and, therefore, it does not require further simplifications.
Some limitations in this study should be considered. Firstly, our results have an application to multi-frequency BIA and could be differ for other devices. There are several manufacturers of BIA, using different algorithms, which is the main disadvantage of BIA devices. Secondly, our findings could be generalized for young females. Further studies are needed to consider ANN-BIA-based formulas as an alternative tool for somatotyping.
The strengths of our study are that anthropometric and BIA measurements were carried out after one another. This allowed us to reduce the bias caused by the changes in body composition.
Neural networks applied in our study are non-linear systems, which make it possible to classify the data better than existing linear model methods such as the aforementioned BIA-based formulas. Moreover, ANNs are not programmed, but are trained to do so in the examples [25]. The application of ANNs on BIA-data to determine the somatotype seems to be more accurate. These types of new technique are becoming increasingly attractive in health sciences, thanks to their ability to process huge amounts of data, suggest new correlations between markers obtained by different methods, and also lead to the possibility of a more precise diagnose and personalized treatment of the patient [24].

4. Conclusions

The results of our study indicate the successful application of an ANN-based model in predicting the endomorphy and mesomorphy ratings in young women. The ANN model can be practically used in BIA devices in the future. BIA measurements compared with the Heath–Carter method require less physical contact between the researcher and the subject, which significantly increases the psychological comfort of the subject. Given attention to protecting personal intimate space, the Heath–Carter measurement methodology may be rejected by many people. Therefore, it seems necessary to look for alternative comparative methods.

Author Contributions

M.D., K.G. and M.G. were responsible for the conception of this study, M.D. and M.G. were responsible for data collection, K.G. analyzed the data, modelling, visualization, K.G. and M.G. were responsible for writing the original draft of the manuscript, M.D., K.G. and M.G. were responsible for revising the manuscript critically for important intellectual content. All authors have read and agreed to the published version of the manuscript.

Funding

This research was supported by sources of the Polish Ministry of Sciences and Higher Education within funds of Faculty of Human Nutrition and Consumer Sciences and Institute of Mechanical Engineering, Warsaw University of Life Sciences (SGGW-WULS).

Institutional Review Board Statement

The study was conducted according to the guidelines of the Declaration of Helsinki and approved by the Bioethics Commission of the Food and Nutrition Institute in Warsaw, Poland (06.07.2015).

Informed Consent Statement

Informed consent was obtained from all subjects involved in the study.

Data Availability Statement

Not applicable.

Conflicts of Interest

The authors declare no conflict of interest.

Appendix A

Figure A1. Scatterplot of (a) Ecto (MLP 4-4-1), (c) Meso (MLP 4-4-1), (e) Ecto (MLP 2-4-3), (g) Endo (MLP 2-4-3) and (i) Meso (MLP 2-4-3) somatotypes and levels of agreement graph from Bland-Altman analysis for (b) Ecto (MLP 4-4-1), (d) Meso (MLP 4-4-1), (f) Ecto (MLP 2-4-3), (h) Endo (MLP 2-4-3) and (j) Meso (MLP 2-4-3) somatotypes calculated using Heath-Carter method.
Applsci 11 01365 g0a1aApplsci 11 01365 g0a1b
Table A1. Selected formulas, based on bioimpedance, for the evaluation of the endomorphy and mesomorphy rating of the Heath–Carter somatotype and results of statistical analyses on the modelling (S—sex, 1-M, 0-F; FMi = FM/H2—Fat Mass index, FFMi = FFM/H2—Free Fat Mass index).
Formula [References]AgeRRMSEχ2
Endo = 2875 R 50 + 0.625   BMI 0.042   BM 0.23   S 2.33 [22]7–18 0.6711.5893.869
Endo = 3224.7 R 50 + 0.63867   BMI 0.04162   BM 2.195 [53,54]5–17 0.6441.8605.301
Endo = 2837 R 50 + 0.916   BMI + 0.0109   BMI 2 + 0.013   BM + 0.017   A 1.40   S 5.95 [23]16–40 0.7902.0296.304
Endo = 3399 R 50 + 0.922   BMI + 0.0102   BMI 2 0.85   S 5.93 [17]16–61 0.7892.2017.423
Endo = 0.5282   FMi + 0.2580   BMI 0.04822   BM 1.881 [54]7–170.3601.3612.839
Meso = 1467 R 50 + 0.552   BMI 0.096   BM + 0.59   S 4.22 [22]7–18 0.7331.8365.162
Meso = 2195.4 R 50 + 0.52966   BMI 0.09740   BM 4.5522 [53,54]5–17 0.6352.3548.422
Meso = 890.8 R 50 + 0.5017   BMI 0.073   BM 0.017   A 1.17   S 3.83 [23]16–40 0.8881.0791.785
Meso = 1578 R 50 + 0.479   BMI 0.077   BM 0.015   A + 0.81   S 4.14 [17]16–610.8221.4213.095
Meso = 0.3651   FFMi + 0.42765   BMI 0.09323   BM 4.803 [54]7–170.5942.3498.455

References

  1. Ryan-Stewart, H.; Faulkner, J.; Jobson, S. The influence of somatotype on anaerobic performance. PLoS ONE 2018, 13, e0197761. [Google Scholar] [CrossRef]
  2. Malina, R.M.; Bouchard, C.; Bar-Or, O. Growth, Maturation, and Physical Activity, 2nd ed.; Human Kinetics: Champaign, IL, USA, 2004; ISBN 978-0-88011-882-8. [Google Scholar]
  3. Somatotyping, C.L. Anthropometrica: A Textbook of Body Measurement for Sports and Health Courses; Norton, K., Olds, T., Eds.; University of New South Wales Press: Sydney, Australia, 1996; pp. 147–170. ISBN 978-0-86840-223-9. [Google Scholar]
  4. Yang, L.-T.; Wang, N.; Li, Z.-X.; Liu, C.; He, X.; Zhang, J.-F.; Han, H.; Wen, Y.-F.; Qian, Y.-H.; Xi, H.-J. Study on the adult physique with the Heath-Carter anthropometric somatotype in the Han of Xi’an, China. Anat. Sci. Int. 2016, 91, 180–187. [Google Scholar] [CrossRef] [PubMed]
  5. Hermassi, S.; Sellami, M.; Fieseler, G.; Bouhafs, E.G.; Hayes, L.D.; Schwesig, R. Differences in body fat, body mass index, and physical performance of specific field tests in 10-to-12-year-old school-aged team handball players. Appl. Sci. 2020, 10, 9022. [Google Scholar] [CrossRef]
  6. Gutnik, B.; Zuoza, A.; Zuozienė, I.; Alekrinskis, A.; Nash, D.; Scherbina, S. Body physique and dominant somatotype in elite and low-profile athletes with different specializations. Medicina 2015, 51, 247–252. [Google Scholar] [CrossRef]
  7. Marta, C.C.; Marinho, D.A.; Barbosa, T.M.; Carneiro, A.L.; Izquierdo, M.; Marques, M.C. Effects of body fat and dominant somatotype on explosive strength and aerobic capacity trainability in prepubescent children. J. Strength Cond. Res. 2013, 27, 3233–3244. [Google Scholar] [CrossRef]
  8. Noh, J.-W.; Kim, J.-H.; Kim, M.-Y.; Lee, J.-U.; Lee, L.-K.; Park, B.-S.; Yang, S.-M.; Jeon, H.-J.; Lee, W.-D.; Kwak, T.-Y.; et al. Somatotype analysis of elite boxing athletes compared with nonathletes for sports physiotherapy. J. Phys. Ther. Sci. 2014, 26, 1231–1235. [Google Scholar] [CrossRef] [Green Version]
  9. Tóth, T.; Michalíková, M.; Bednarčíková, L.; Živčák, J.; Kneppo, P. Somatotypes in sport. Acta Mech. Autom. 2014, 8, 27–32. [Google Scholar] [CrossRef] [Green Version]
  10. Koleva, M.; Nacheva, A.; Boev, M. Somatotype, nutrition, and obesity. Rev. Environ. Health 2000, 15, 389–398. [Google Scholar] [CrossRef]
  11. Koleva, M.; Nacheva, A.; Boev, M. Somatotype and disease prevalence in adults. Rev. Environ. Health 2002, 17, 65–84. [Google Scholar] [CrossRef]
  12. Baltadjiev, A.G. Somatotype characteristics of female patients with type 2 diabetes mellitus. Folia Med. 2013, 55, 64–69. [Google Scholar] [CrossRef]
  13. Almeida, A.H.S.; Santos, S.A.G.; Castro, P.J.P.; Rizzo, J.A.; Batista, G.R. Somatotype analysis of physically active individuals. J. Sports Med. Phys. Fit. 2013, 53, 268–273. [Google Scholar]
  14. Carter, J.E.L. The Heath-Carter Anthropometric Somatotype—Instruction Manual; Department of Exercise and Nutritional Sciences San Diego State University: San Diego, CA, USA, 2002. [Google Scholar]
  15. Fornetti, W.C.; Pivarnik, J.M.; Foley, J.M.; Fiechtner, J.J. Reliability and validity of body composition measures in female athletes. J. Appl. Physiol. 1999, 87, 1114–1122. [Google Scholar] [CrossRef] [PubMed] [Green Version]
  16. Pastuszak, A.; Gajewski, J.; Buśko, K. The Impact of skinfolds measurement on somatotype determination in Heath-Carter method. PLoS ONE 2019, 14, e0222100. [Google Scholar] [CrossRef] [PubMed]
  17. Rudnev, S.G.; Negasheva, M.A.; Godina, E.Z. Assessment of the Heath-Carter somatotype in adults using bioelectrical impedance analysis. In Journal of Physics: Conference Series; IOP Publishing: Bristol, UK, 2019; Volume 1272, p. 012001. [Google Scholar] [CrossRef]
  18. Khalil, S.; Mohktar, M.; Ibrahim, F. The theory and fundamentals of bioimpedance analysis in clinical status monitoring and diagnosis of diseases. Sensors 2014, 14, 10895–10928. [Google Scholar] [CrossRef] [PubMed]
  19. Roubenoff, R.; Dallal, G.E.; Wilson, P.W. Predicting body fatness: The body mass index vs estimation by bioelectrical impedance. Am. J. Public Health 1995, 85, 726–728. [Google Scholar] [CrossRef] [PubMed] [Green Version]
  20. Heitmann, B.L. Impedance: A valid method in assessment of body composition? Eur. J. Clin. Nutr. 1994, 48, 228–240. [Google Scholar]
  21. Böhm, A.; Heitmann, B.L. The use of bioelectrical impedance analysis for body composition in epidemiological studies. Eur. J. Clin. Nutr. 2013, 67, S79–S85. [Google Scholar] [CrossRef]
  22. Kolesnikov, V.A.; Rudnev, S.G.; Nikolaev, D.V.; Anisimova, A.V.; Godina, E.Z. On a new protocol of the Heath-Carter somatotype assessment using software for body composition bioimpedance analyzer. Vestn. Mosk. Univ. Ser. 23 Antropol. 2016, 4, 4–13. [Google Scholar]
  23. Sindeyeva, L.V.; Rudnev, S.G. Characteristic of age- and sex-related variability of the Heath-Carter somatotype in adults and possibility of its bioimpedance assessment (as exemplified by Russian population of Eastern Siberia). Morfologiya 2017, 151, 77–87. [Google Scholar]
  24. Attanasio, S.; Forte, S.M.; Restante, G.; Gabelloni, M.; Guglielmi, G.; Neri, E. Artificial intelligence, radiomics and other horizons in body composition assessment. Quant. Imaging Med. Surg. 2020, 10, 1650–1660. [Google Scholar] [CrossRef] [PubMed]
  25. Xhumari, E.; Manika, P. Application of Artificial Neural Networks in Medicine, CEUR Workshop Proccedings, Tirana, Albania, 18–19 November 2016; Kika, A., Hoxha, E., Eds.; CEUR: Tirana, Albania, 2016; Volume 1746, pp. 155–157.
  26. Shahid, N.; Rappon, T.; Berta, W. Applications of artificial neural networks in health care organizational decision-making: A scoping review. PLoS ONE 2019, 14, e0212356. [Google Scholar] [CrossRef] [PubMed]
  27. Ibrahim, F.; Faisal, T.; Mohamad Salim, M.I.; Taib, M.N. Non-invasive diagnosis of risk in dengue patients using bioelectrical impedance analysis and artificial neural network. Med. Biol. Eng. Comput. 2010, 48, 1141–1148. [Google Scholar] [CrossRef] [PubMed] [Green Version]
  28. Faisal, T.; Ibrahim, F.; Taib, M.N. A noninvasive intelligent approach for predicting the risk in dengue patients. Expert Syst. Appl. 2010, 37, 2175–2181. [Google Scholar] [CrossRef]
  29. Mohktar, M.S.; Ibrahim, F.; Ismail, N.A. Non-invasive approach to predict the cholesterol level in blood using bioimpedance and neural network techniques. Biomed. Eng. Appl. Basis Commun. 2013, 25, 1350046. [Google Scholar] [CrossRef]
  30. Linder, R.; Mohamed, E.I.; De Lorenzo, A.; Pöppl, S.J. The capabilities of artificial neural networks in body composition research. Acta Diabetol. 2003, 40, s9–s14. [Google Scholar] [CrossRef]
  31. Chiu, J.-S.; Chen, C.-A.; Lee, C.-H.; Li, Y.-C.; Lin, Y.-F.; Wang, Y.-F.; Yu, F.-C. Neural network technology to predict intracellular water volume: Neural network technology. Int. J. Clin. Pract. 2006, 60, 1231–1238. [Google Scholar] [CrossRef]
  32. Chiu, J.-S.; Chong, C.-F.; Lin, Y.-F.; Wu, C.-C.; Wang, Y.-F.; Li, Y.-C. Applying an artificial neural network to predict total body water in hemodialysis patients. Am. J. Nephrol. 2005, 25, 507–513. [Google Scholar] [CrossRef]
  33. Hsieh, K.-C.; Chen, Y.-J.; Lu, H.-K.; Lee, L.-C.; Huang, Y.-C.; Chen, Y.-Y. The novel application of artificial neural network on Bioelectrical Impedance Analysis to assess the body composition in elderly. Nutr. J. 2013, 12, 21. [Google Scholar] [CrossRef] [Green Version]
  34. Liu, T.-P.; Kao, M.-F.; Jang, T.-R.; Wang, C.-W.; Chuang, C.-L.; Chen, J.; Chen, Y.-Y.; Hsieh, K.-C. New application of bioelectrical impedance analysis by the back propagation artificial neural network mathematically predictive model of tissue composition in the lower limbs of elderly people. Int. J. Gerontol. 2012, 6, 20–26. [Google Scholar] [CrossRef] [Green Version]
  35. Liu, T.-P.; Kao, M.-F.; Jang, T.-R.; Wang, C.-W.; Chuang, C.-L.; Chen, J.; Chen, Y.-Y.; Hsieh, K.-C. Corrigendum to “New application of bioelectrical impedance analysis by the back propagation artificial neural network mathematically predictive model of tissue composition in the lower limbs of elderly people” [Int. J. Gerontol. 2012, 6, 20–26]. Int. J. Gerontol. 2015, 9, 133. [Google Scholar] [CrossRef] [Green Version]
  36. Chao, Y.-S.; Wu, H.-C.; Wu, C.-J.; Chen, W.-C. Stages of biological development across age: An analysis of Canadian health measure survey 2007–2011. Front. Public Health 2018, 5, 355. [Google Scholar] [CrossRef] [PubMed]
  37. Duquet, W.; Carter, J.E.L.; Eston, R.; Reilly, T. Somatotyping. In Kinanthropometry and Exercise Physiology Laboratory Manual: Tests, Procedures and Data, Volume One: Anthropometry; Routledge: Abingdon, UK, 2009; pp. 54–72. [Google Scholar]
  38. Koo, T.K.; Li, M.Y. A guideline of selecting and reporting intraclass correlation coefficients for reliability research. J. Chiropr. Med. 2016, 15, 155–163. [Google Scholar] [CrossRef] [PubMed] [Green Version]
  39. Carter, J.E.L.; Heath, B.H. Somatotyping-Development and Applications; Cambridge University Press: New York, NY, USA, 1990; ISBN 978-0-521-35951-1. [Google Scholar]
  40. Kwon, B.; Lee, S. Ensemble learning for skeleton-based body mass index classification. Appl. Sci. 2020, 10, 7812. [Google Scholar] [CrossRef]
  41. WHO. The Challenge of Obesity in the WHO European Region and the Strategies for Response: Summary; Branca, F., Nikogosian, H., Lobstein, T., World Health Organization, Eds.; World Health Organization, Regional Office for Europe: Copenhagen, Denmark, 2007; ISBN 978-92-890-1388-8. [Google Scholar]
  42. Winiczenko, R.; Górnicki, K.; Kaleta, A.; Janaszek-Mańkowska, M. Optimisation of ANN Topology for predicting the rehydrated apple cubes colour change using RSM and GA. Neural Comput. Appl. 2018, 30, 1795–1809. [Google Scholar] [CrossRef] [PubMed] [Green Version]
  43. Górnicki, K.; Kaleta, A.; Trajer, J. Modelling of dried apple rehydration indices using ANN. Int. Agrophys. 2019, 33, 285–296. [Google Scholar] [CrossRef]
  44. Nadi, F.; Górnicki, K.; Winiczenko, R. A novel optimization algorithm for Echium amoenum petals drying. Appl. Sci. 2020, 10, 8387. [Google Scholar] [CrossRef]
  45. Górnicki, K.; Winiczenko, R.; Kaleta, A.; Choińska, A. Evaluation of models for the dew point temperature determination. Tech. Sci. 2017, 20, 241–257. [Google Scholar] [CrossRef]
  46. Kaleta, A.; Górnicki, K.; Winiczenko, R.; Chojnacka, A. Evaluation of drying models of apple (var. Ligol) dried in a fluidized bed dryer. Energy Convers. Manag. 2013, 67, 179–185. [Google Scholar] [CrossRef]
  47. Bland, M.J.; Altman, D.G. Statistical methods for assessing agreement between two methods of clinical measurement. Lancet 1986, 327, 307–310. [Google Scholar] [CrossRef]
  48. Krzykała, M.; Karpowicz, M.; Strzelczyk, R.; Pluta, B.; Podciechowska, K.; Karpowicz, K. Morphological asymmetry, sex and dominant somatotype among Polish youth. PLoS ONE 2020, 15, e0238706. [Google Scholar] [CrossRef] [PubMed]
  49. Marangoz, I.; Var, S.M. The comparison of somatotype structures in students studying at different departments of physical education. J. Educ. Train. Stud. 2018, 6, 108. [Google Scholar] [CrossRef] [Green Version]
  50. Bulbulian, R. The influence of somatotype on anthropometric prediction of body composition in young women. Med. Sci. Sports Exerc. 1984, 16, 389–397. [Google Scholar] [CrossRef] [PubMed]
  51. Marra, M.; Cioffi, I.; Sammarco, R.; Santarpia, L.; Contaldo, F.; Scalfi, L.; Pasanisi, F. Are raw BIA variables useful for predicting resting energy expenditure in adults with obesity? Nutrients 2019, 11, 216. [Google Scholar] [CrossRef] [PubMed] [Green Version]
  52. Francisco, R.; Matias, C.N.; Santos, D.A.; Campa, F.; Minderico, C.S.; Rocha, P.; Heymsfield, S.B.; Lukaski, H.; Sardinha, L.B.; Silva, A.M. The predictive role of raw bioelectrical impedance parameters in water compartments and fluid distribution assessed by dilution techniques in athletes. Int. J. Environ. Res. Publ. Health 2020, 17, 759. [Google Scholar] [CrossRef] [Green Version]
  53. Rudnev, S.C.; Tseytlin, G.Y.; Vashura, A.Y.; Lukina, S.S.; Rumyantsev, A.G. Somatotype of children and adolescents with oncological diseases in remission and possibility of its bioimpedance assessment. Pediatria 2017, 96, 186–193. [Google Scholar] [CrossRef]
  54. Anisimova, A.V.; Godina, E.Z.; Nikolaev, D.V.; Rudnev, S.G. Evaluation of the Heath-Carter somatotype revisited: New bioimpedance equations for children and adolescents. In Proceedings of the II Latin American Conference on Bioimpedance, Proceedings of the IFMBE, Montevideo, Uruguay, 30 September–2 October 2015; Simini, F., Bertemes-Filho, P., Eds.; Springer: Singapore, 2016; Volume 54, pp. 80–83. [Google Scholar]
Figure 1. Three layer neural networks: (a) MLP 4-4-1 for Endo somatotype, (b) MLP 4-4-1 for Meso somatotype and (c) MLP 2-4-3 for Endo, Ecto and Meso somatotypes; transfer functions: hidden and output layers: tangent sigmoid and linear, respectively.
Applsci 11 01365 g001
Table 1. Group characteristic and statistical parameters of the used data.
ParameterUnitStatistical Parameters
Mean ± SD (Range)Coefficient of VariationSkewness Coefficient
Ageyear22.9 ± 1.70 (19–29)0.070.45
Anthropometric measurement
Body weightkg59.57 ± 7.80 (40–78)0.130.09
Body heightcm166.97 ± 5.91 (151–179)0.04−0.59
Triceps skinfoldmm13.09 ± 4.82 (6–28)0.370.96
Subscapular skinfoldmm11.80 ± 4.77 (5–29)0.401.59
Supraspinale skinfoldmm10.64 ± 4.62 (4.5–23)0.430.91
Medial calf skinfoldmm11.87 ± 6.14 (1–35.5)0.521.11
Biepicondylar breadth of the humeruscm6.19 ± 0.39 (5.5–7)0.061.08
Biepicondylar breadth of the femurcm7.64 ± 0.99 (4–9)0.13−0.81
Upper arm girthcm26.39 ± 2.56 (20–33)0.100.10
Calf girthcm35.91 ± 2.67 (30–41)0.070.19
Body composition (BIA)
FFM%74.12 ± 7.10 (57.5–91)0.10−0.36
FM%25.88 ± 7.10 (8.9–42.5)0.280.36
TBW%53.01 ± 5.17 (43–73)0.101.11
ReacΩ157.56 ± 43.93 (86–282)0.280.88
ResΩ620.64 ± 116.45 (194–881)0.19−1.47
RMRkcal1546.64 ± 61.35 (1373–1719)0.04−0.16
Indices in used formulas
BMIkg/m221.32 ± 2.70 (16–28)0.130.45
FMi = FM/H2kg/m29.33 ± 2.73 (3.5–16.0)0.300.47
FFMi = FFM/H2kg/m216.77 ± 2.26 (14.17–25.0)0.141.72
BIA—Bioelectrical Impedance Analysis, BMI—Body Mass Index, FFM—Fat Free Mass, FM—Fat Mass, TBW—Total Body Water, Reac—Reactance, Res—Resistance, RMR-Resting Metabolic Rate, H—Body height, FMi—Fat Mass Index, FFMi—Free Fat Mass Index.
Table 2. Results of statistical analyses on the modelling of somatotypes and sensitivity analysis.
Somatotype and ANN FormStatistics ANNOmitted Parameter
BMIFFMResReacRMRTBW
MLP 6-5-1
EndoR0.93500.82710.91360.83350.78200.86720.9275
RMSE0.45290.71440.53400.70770.83790.65580.5128
χ20.47641.18540.66221.16331.63050.99880.6107
Meso R0.8909−0.11280.79810.77150.85720.81950.5187
RMSE0.60631.52571.06260.86200.70130.77341.2268
χ20.85365.40632.62221.72591.14211.38943.4957
MLP 6-4-3
Endo, Ecto, and MesoR0.90600.15540.87510.77420.89280.87950.8967
RMSE0.59061.51580.70950.89970.62870.66280.6334
χ20.42572.80390.61430.98780.48240.53610.4895
EndoR0.8860−0.34530.87050.47590.86070.87170.8796
RMSE0.58861.99570.82161.29280.64830.62210.6379
χ20.75588.69001.47293.64650.91700.84430.8879
EctoR0.94630.83770.94040.93810.94540.91200.9447
RMSE0.48091.07310.55770.51590.48960.61020.5106
χ20.50462.51230.67860.58070.52310.81240.5687
MesoR0.85970.19870.84720.85350.84120.82900.8442
RMSE0.68461.32610.724020.70060.72520.74730.7320
χ21.02273.83681.14361.07101.14741.21851.1690
MLP 4-4-1
EndoR0.86870.4680-0.71780.79260.8366-
RMSE0.65621.1365-0.95020.88980.7361-
χ20.65961.9787-1.38301.21280.8298-
MesoR0.82930.60500.54640.8066--0.7535
RMSE0.75461.09291.13040.8250--1.1365
χ20.87231.82981.95741.0426--1.9787
MLP 2-4-3
Endo, Ecto, and MesoR0.87960.2569-0.8314---
RMSE0.67031.3463-0.7745---
χ20.51352.0715-0.6855---
EndoR0.87770.2924-0.7316---
RMSE0.60911.2550-0.8637---
χ20.59372.5200-1.1936---
EctoR0.90920.0436-0.9078---
RMSE0.61951.4715-0.6230---
χ20.61403.4644-0.6211---
MesoR0.81650.2323-0.7918---
RMSE0.77021.3029-0.8157---
χ20.94922.7160-1.0645---
BMI—Body Mass Index, FFM—Fat Free Mass, Res—Resistance, Reac—Reactance, RMR—Resting Metabolic Rate, TBW—Total Body Water, MLP—Multilayer Perceptron, Endo—endomorphy, Ecto—ectomorphy, Meso—mesomorphy, R—correlation coefficient, RMSE—root mean square error, χ2—reduced chi-square.
Table 3. Weights and biases between input and hidden layers and between hidden and output layers for artificial neural network (ANN) Endo, Ecto, and Meso somatotypes.
Somatotypes and ANN FormNo.Weights and Biases
MLP 4-4-1iD1iD2iD3iD4iD5iWiWb
Endo1−2.51963.3665−0.10690.2737−2.0654−0.01240.6713
2−1.60570.6506−1.82080.23051.2134−0.8628
30.7439−1.2159−0.83330.09532.2781−0.1618
42.22642.19721.25052.53163.9790−0.5781
Meso11.81621.4232−1.8635−0.2445−0.72191.4688−0.2921
20.5244−2.2078−0.50861.97761.05021.3685
3−1.31440.03940.8123−0.6986−0.62321.0849
4−0.91150.1162−3.00570.6690−1.8619−1.1589
MLP 2-4-3 D1iD2iD3iWEndo iWEcto iWMeso iWbEndo
Endo, Ecto, and Meso11.5266−0.03790.2213−1.1164−0.1439−0.0378−0.1789
22.00051.5189−0.79450.0018
33.1287−5.8295−2.1418−0.1264
4−2.07621.52570.8236−0.2852
Table 4. Mean values (with standard deviation) of the somatotype in woman calculated from the Heath–Carter method and ANNs (the same letters indicate homogenous groups (α < 0.05)).
SomatotypeHeath-Carter Method
Mean ± SD
ANN MLP 4-4-1
Mean ± SD
ANN MLP 2-4-3
Mean ± SD
p-Value
Endo3.63 ± 1.28 a3.83 ± 0.87 a3.55 ± 1.12 ans
Meso2.86 ± 1.34 b3.19 ± 1.17 b2.94 ± 1.11 bns
Ecto2.89 ± 1.35 c-12.90 ± 1.39 cns
a–c the same letters indicate homogenous groups, 1 no Ecto from MLP with one output layer, and the possibility of calculation based on height and weight.
Publisher’s Note: MDPI stays neutral with regard to jurisdictional claims in published maps and institutional affiliations.

