Article

In Vitro Estimation of Relative Compliance during High-Frequency Oscillatory Ventilation

Department of Biomedical Technology, Faculty of Biomedical Engineering, Czech Technical University in Prague, nam. Sitna 3105, CZ-272 01 Kladno, Czech Republic
*
Author to whom correspondence should be addressed.
Appl. Sci. 2021, 11(3), 899; https://doi.org/10.3390/app11030899
Submission received: 11 December 2020 / Revised: 12 January 2021 / Accepted: 15 January 2021 / Published: 20 January 2021
(This article belongs to the Section Applied Biosciences and Bioengineering)

Abstract

:

Featured Application

Optimization of the mean pressure setting in high-frequency oscillatory ventilation.

Abstract

High-frequency oscillatory ventilation (HFOV), which uses a small tidal volume and a high respiratory rate, is considered a type of protective lung ventilation that can be beneficial for certain patients. A disadvantage of HFOV is its limited monitoring of lung mechanics, which complicates its settings and optimal adjustment. Recent studies have shown that respiratory system reactance (Xrs) could be a promising parameter in the evaluation of respiratory system mechanics in HFOV. The aim of this study was to verify in vitro that a change in respiratory system mechanics during HFOV can be monitored by evaluating Xrs. We built an experimental system consisting of a 3100B high-frequency oscillatory ventilator, a physical model of the respiratory system with constant compliance, and a system for pressure and flow measurements. During the experiment, models of different constant compliance were connected to HFOV, and Xrs was derived from the impedance of the physical model that was calculated from the spectral density of airway opening pressure and spectral cross-power density of gas flow and airway opening pressure. The calculated Xrs changed with the change of compliance of the physical model of the respiratory system. This method enabled monitoring of the trend in the respiratory system compliance during HFOV, and has the potential to optimize the mean pressure setting in HFOV in clinical practice.

1. Introduction

High-frequency oscillatory ventilation (HFOV) is a non-conventional mode of mechanical lung ventilation with a protective potential [1]. In clinical practice, HFOV is mainly used in patients suffering from acute respiratory distress syndrome (ARDS) who do not tolerate conventional mechanical ventilation (CMV) [2]. HFOV uses pressure oscillations to ensure effective elimination of carbon dioxide from the lungs of the ventilated subject. These pressure oscillations are superimposed on the continuous distension pressure (CDP), which keeps the lungs recruited, and together with the set fraction of inspired oxygen, ensures the oxygenation of the ventilated subject [3]. Despite its theoretical advantages, the practical suitability of HFOV is still debated [1,4,5,6,7,8], as there is a lack of recent studies that clearly demonstrate the clinical benefits of the technique for adult and pediatric patients. HFOV is therefore considered as a rescue intervention when adequate oxygenation cannot be achieved by CMV. The optimal management of HFOV, including CDP, which would be based on knowledge of lung mechanics of the patient, is unresolved, which could have contributed to inconsistent or negative conclusions of large multicenter HFOV studies [9,10] and subsequent meta-analyses [11,12]. Recent studies have shown that an individual approach to HFOV settings could improve the patient’s outcome [13,14]. Other monitoring methods should be involved to individualize HFOV settings, including electrical impedance tomography (EIT) [15], optoelectronic plethysmography [16], or respiratory system impedance analysis [17]. A lack of an individual approach to HFOV settings could have affected the outcome of earlier studies [18,19].
Currently, it is not clear how to set CDP properly with respect to an individual patient’s airway condition. CDP should be set to reach the maximal recruitment of the lungs while minimizing their overstrain [20]. An improperly high level of CDP can lead to ventilator-induced lung injury. Many studies have been performed with an aim to obtain an optimal setting for CDP [21,22,23,24,25,26,27,28]. However, none of the suggested approaches have been broadly implemented in clinical practice, and CDP is commonly being set as a value of the mean airway pressure from the preceding CMV increased by several cmH2O [25]. Nevertheless, this way of setting CDP is quite questionable [25]. As shown in [29], the CDP directly influences the compliance of the lungs, which is also tied to the recruitment (volume) of the lungs [29,30,31]. However, monitoring of the ventilation parameters is very limited in HFOV. For example, the 3100B ventilator (Vyaire Medical, Mettawa, IL, USA), which is commonly used in clinical practice for HFOV, and which was used in this study as well, does not enable monitoring of tidal volume or parameters of lung mechanics, such as lung compliance. This lack of monitoring ability also exists in the 3100A ventilator (Vyaire Medical, Mettawa, IL, USA), which is suitable for the ventilation of neonatal and pediatric patients.
Recent studies have shown that reactance of the respiratory system (Xrs) measured using the forced oscillation technique (FOT) is a promising tool for evaluation of the mechanics of the respiratory system in HFOV [20,28]. During FOT, reactance is found using high-frequency pressure oscillations applied at the entrance of the respiratory system, and using the induced flow. Reactance is tied to compliance (C), inertance (L), and frequency of the pressure oscillations (f) according to the equation:
X rs = 2 π f L 1 2 π f C .
Inertance represents the tendency of a gas to remain in motion, and depends on the characteristics of the used ventilation gas mixture and geometric characteristics of the proximal airways [32]. The frequency of the pressure oscillations determines the sensitivity Xrs to the changes of the lung mechanics in different areas of the respiratory system [33]. The reactance Xrs measured at f = 5 Hz is a sensitive indicator of the changes of the mechanics in peripheral areas of the lungs [33,34,35,36]. Assuming a constant ventilation frequency and proximal airways with constant dimensions and stable shape, we consider the changes of inertance L to be minimal. The first term of Equation (1) is therefore considered to be constant as well. On this assumption, the value of Xrs defined by the equation (1) is inversely proportional to the negative of the value of compliance C of the ventilated system. A higher value of C also means a higher value of Xrs, i.e., Xrs is less negative, which is thus called relative compliance further in this study.
In a standard configuration of FOT, high-frequency oscillations are generated by a device connected to the inspiration branch of the patient circuit, and the flow is measured at the entrance to the respiratory system. Nonetheless, it has been shown that pressure oscillations generated by the ventilator during HFOV can be also used for the relative compliance measurement [20,28]. The method has been, however, successfully used in small animals (rabbits and preterm lambs), whose parameters of the respiratory system correspond to neonatal patients, but its use has not been verified in larger physical or animal models that would correspond to pediatric and adult patients.
The aim of this study is to verify whether it is possible, under laboratory conditions, to use pressure oscillations generated by the high-frequency oscillatory ventilator to determine relative compliance of the respiratory system from the measured proximal airway pressure and flow as a method that could be used for optimization of HFOV in pediatric and adult patients.

2. Materials and Methods

The experiment setup is presented in Figure 1. In the experiment, we used a 3100B high-frequency oscillatory ventilator with a standard patient circuit for an adult patient. The patient circuit was connected to a glass container that represented the model of the respiratory system. The constant volume of the container determined its compliance. We gradually ventilated three different glass containers with volumes of 54, 35, and 25 L, which represented respiratory systems with the values of compliance 37, 24, and 17 mL/cmH2O, respectively. The measurements were realized in two phases: with and without additional parabolic resistor Rp5 (Michigan Instruments, Grand Rapids, MI, USA), which simulated an increase in the flow resistance of the airways. In the laboratory experiment, we used the following ventilatory parameters: bias flow = 30 L/min, inspiration to expiration time ratio I:E = 1:1, ventilatory frequency f = 5 Hz, CDP = 12 cmH2O, and amplitude of the pressure oscillations ΔP = 20 cmH2O. The ventilatory parameters were determined according to [37]. In clinical practice, the CDP and ΔP are titrated at the start of HFOV to reach physiological levels of PaO2 and PaCO2. We did not titrate CDP and ΔP in the ventilation because there was no gas exchange in our in vitro laboratory experiment. Pressure paw and flow qaw of the air were recorded at the entry of the model of the respiratory system using a measuring system designed for HFOV monitoring [38]. The flow was measured as a pressure difference across the orifice. Both paw and qaw signals were recorded using a sampling frequency of 1000 Hz.
The relative compliance Xrs was calculated based on the power-spectral density Sxx of the pressure and the cross-spectral density Syx of flow and pressure. The spectral densities were calculated from paw and qaw using windows with a width of 2 s that moved along the signals with a step of 1 s. In the windows, the average value of a signal in the time domain was subtracted from the signal to remove the DC component in the frequency domain. Both spectral densities Sxx and Syx were calculated using Welch’s averaged modified periodogram method of spectral estimation [39]. When calculating the spectral densities, sections of both signals within the same window were split into eight segments, with a 50% overlap between the neighboring segments. In a particular 2-s window, an i-th sample yK(i) of the K-th segment of the paw or qaw signal was thus acquired as:
y K = y ( i + ( K 1 ) 222 ) ,
where y represents the paw or qaw signal in the window, i has a range of 1 to 444, and K has a range of 1 to 8. Each segment yK was filtered in the time domain by a low-pass FIR filter using the Hamming window. Fourier transforms PK and QK of yK were obtained for the pressure and flow signal segments, respectively. Modified periodograms IK of K-th segment were calculated from PK and QK as:
I K = 1 w T w P K P K
for Sxx and as:
I K = 1 w T w Q K P K
for Syx. In equations (3) and (4), PK* represents a complex conjugate of PK, w is a column vector of coefficients of the previously used Hamming window, and wT represents the transpose of w. Finally, the spectral densities Sxx and Syx were calculated as an average value of IK in a given window. In the Sxx and Syx, the frequency fmax corresponding to the maximal power was found. This frequency corresponds with the fundamental waveform (first harmonic frequency) of the oscillations generated by the ventilator, which was set in the study as a nominal frequency f = 5 Hz.
The next step in the calculation of Xrs was calculating the amplitude Zmag and the angle Zang of the impedance of the respiratory system based on equations [40]:
Z mag = S xx ( f max ) | S yx ( f max ) | ,
Z ang = tan 1 [ Im ( S yx ) Re ( S yx ) ] .
The relative compliance Xrs was then calculated by converting the respiratory system impedance from polar coordinates to Cartesian according to Equation (7):
X rs = Z mag sin ( Z ang ) .

3. Results

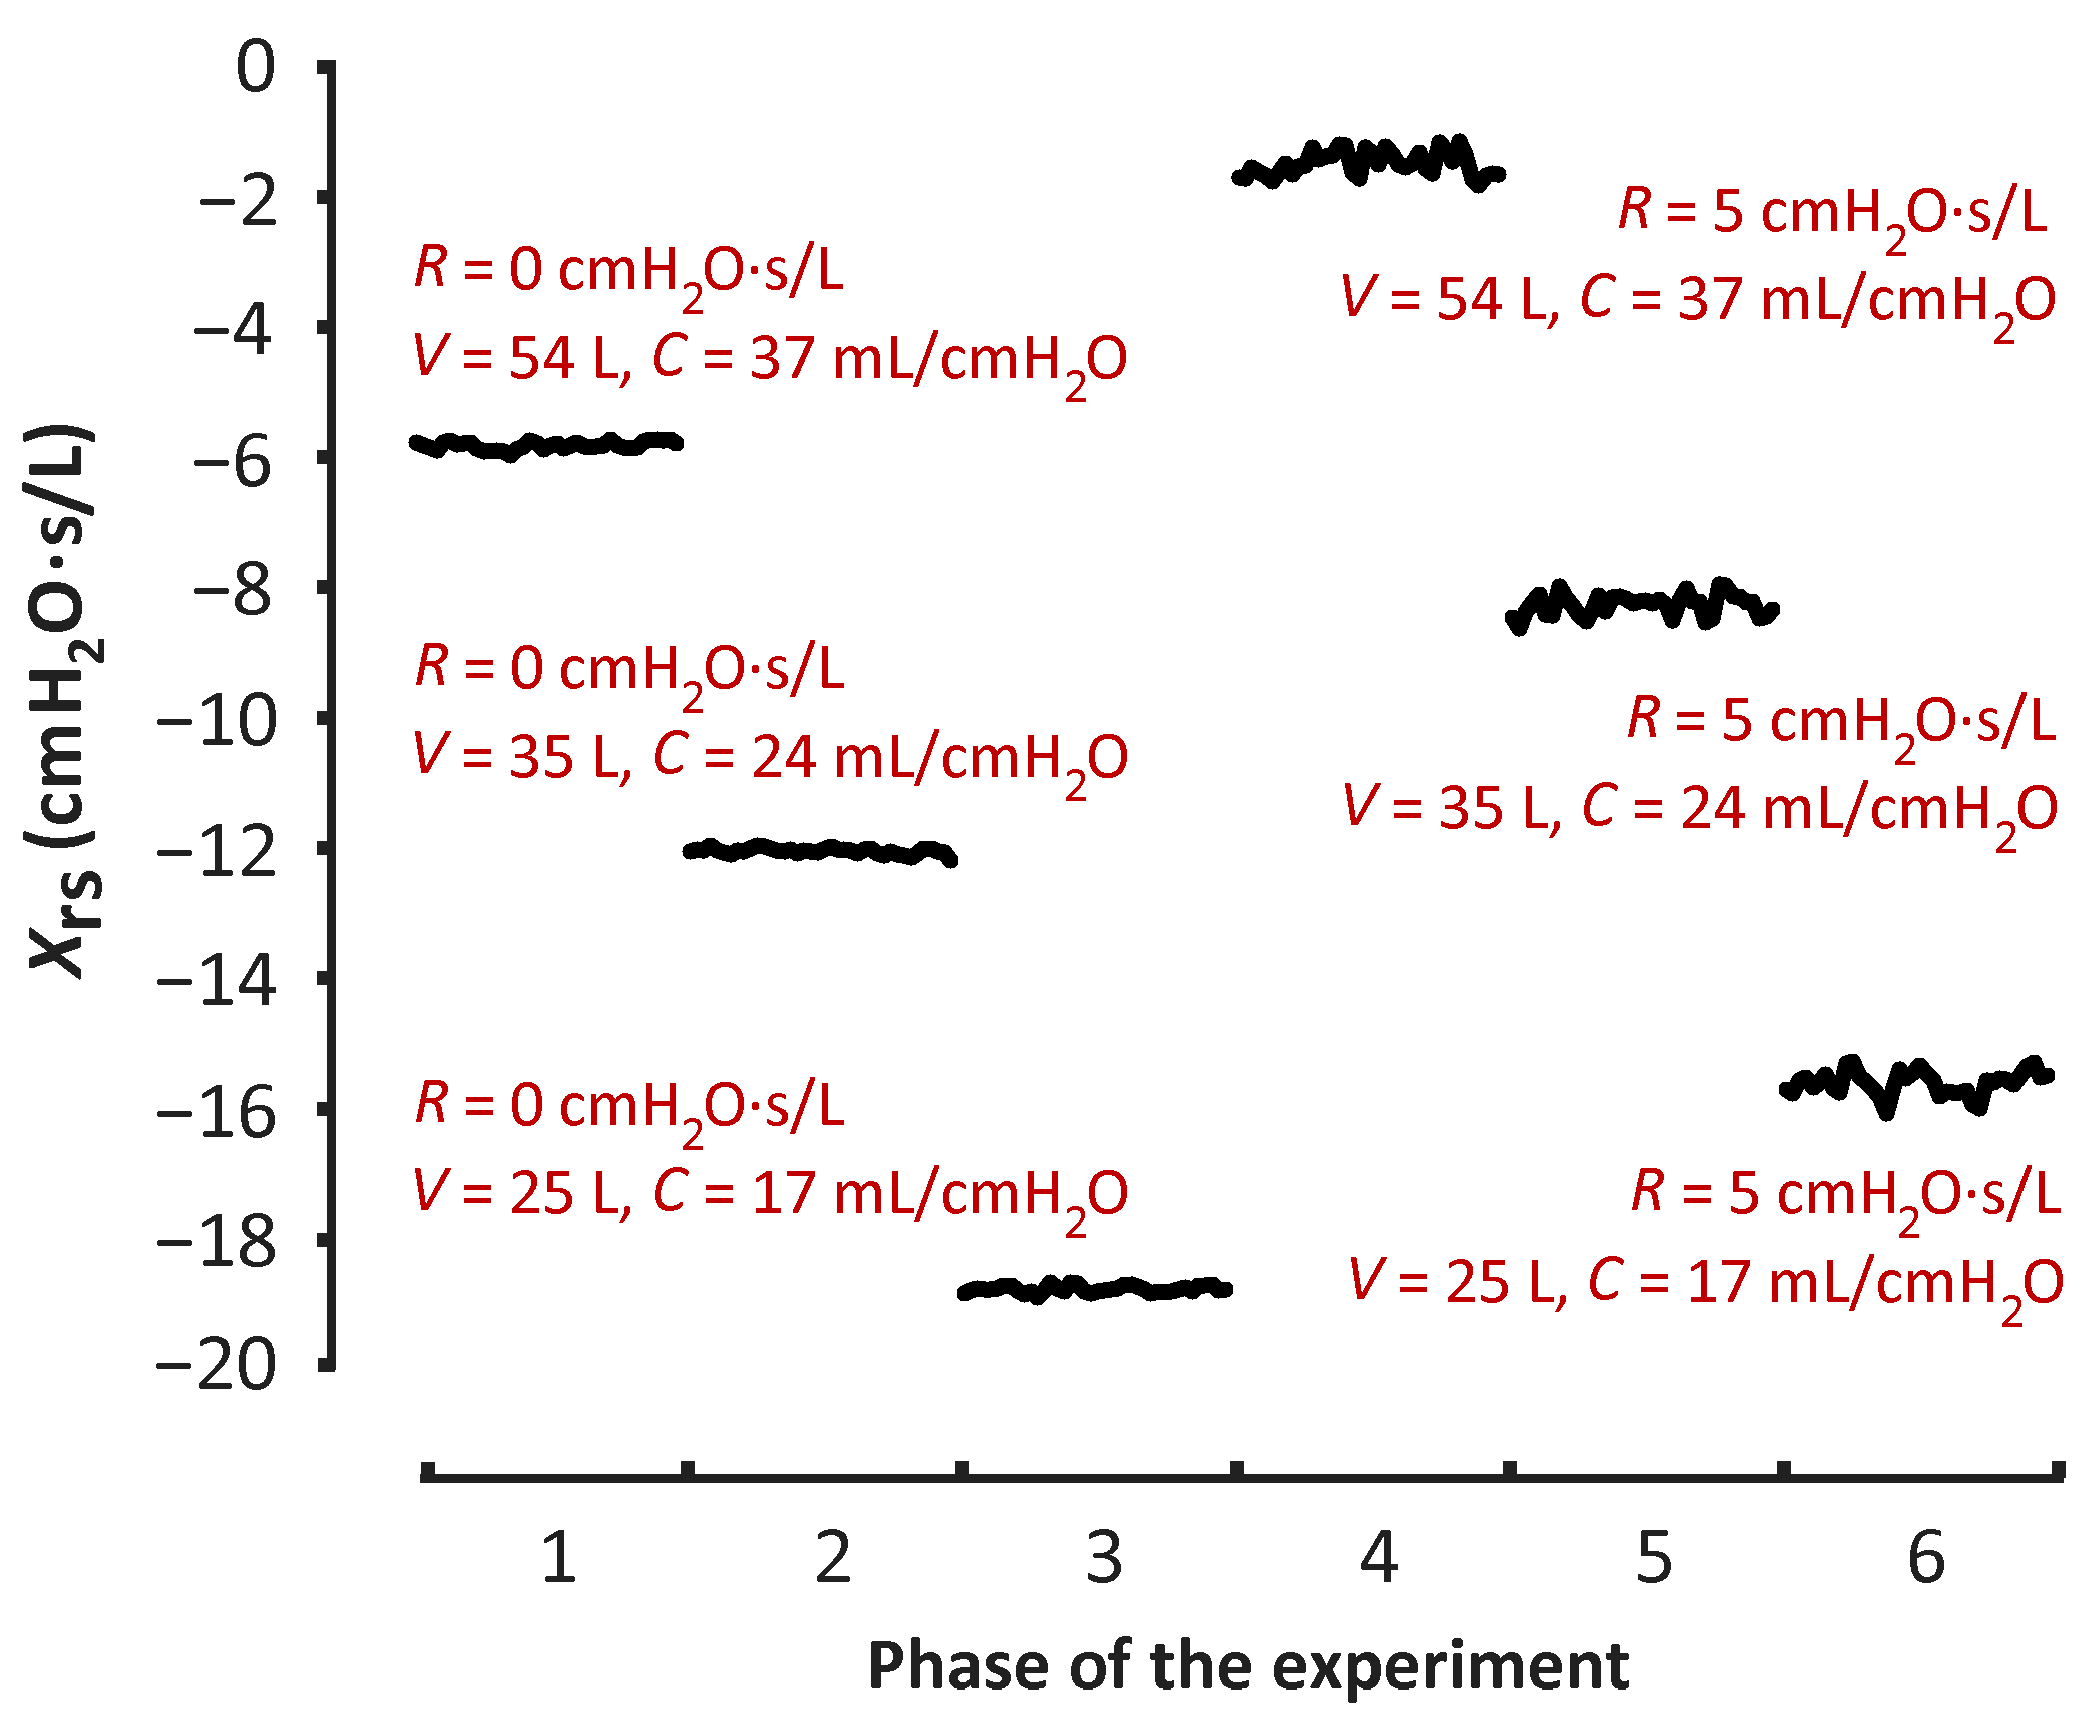
The course of Xrs is shown in Figure 2 during the measurement of the modeled respiratory system without (R = 0 cmH2O∙s/L) and with an added resistor (R = 5 cmH2O∙s/L), with three sizes of the glass container (54 L, 35 L, and 25 L). The relative compliance Xrs determined from the pressure paw and flow qaw in the respiratory circuit decreased with the value of the volume of the used rigid container, and therefore with decreasing compliance. When measuring with an additional resistor, we detected higher values of Xrs compared to the corresponding measurements without the resistor.
The average values of Xrs for each volume V of used rigid containers are summarized in Table 1 for measurements both with and without an additional resistor.

4. Discussion

The results of this study showed that during HFOV, it is possible to monitor changes in trend in respiratory system compliance by analysis of reactance. According to the models, even the very peripheral lung segment compliances propagated to the proximal value of the total respiratory system compliance [41]. We conducted an in vitro laboratory experiment using defined physical models of the respiratory system with various values of compliance and flow resistance. Using the processing of the pressure and flow signals, we calculated reactance of the ventilated physical model, and showed that changes in the reactance corresponded to changes in compliance of the model.
The results show that it is possible to monitor compliance changes during HFOV on various levels of flow resistance. The Rp5 resistor simulated an increase in the airway resistance, and its addition to the physical model resulted in an increase in the value of the measured Xrs when compared to ventilation of the same rigid container in the model without the added Rp5 resistor. The inertance of a tube of a circular cross-section is inversely proportional to its cross-section. When we added the Rp5 resistor into the model of the respiratory system, we created a narrowing, which not only increased the flow resistance, but also led to an increase of inertance L, therefore increasing Xrs, as shown by Equation (1). Nevertheless, in clinical practice, no major change in airway resistance in ventilated patients is likely to occur during short periods of titrating CDP. Under this assumption, the effect of resistance on the assessment of changes in respiratory system compliance from Xrs can be neglected.
An in vitro experiment with a rigid-wall glass container allowed us to evaluate the method of Xrs analysis for the trend estimation of the respiratory system compliance under stable conditions. In previous studies, the analysis of the spectral density of pressure and flow in the ventilatory circuit was conducted within the experiment on small laboratory animals: rabbits and preterm lambs. Before applying the same method of Xrs analysis on data from large subjects, we wished to evaluate the method on the data acquired under the condition of well-defined and stable lung compliance corresponding to the lung compliance of pediatric and adult patients. Our results were in concordance with [20,28], and suggested that the method of Xrs analysis is also suitable for analysis of pulmonary mechanics of ventilated large laboratory animals.
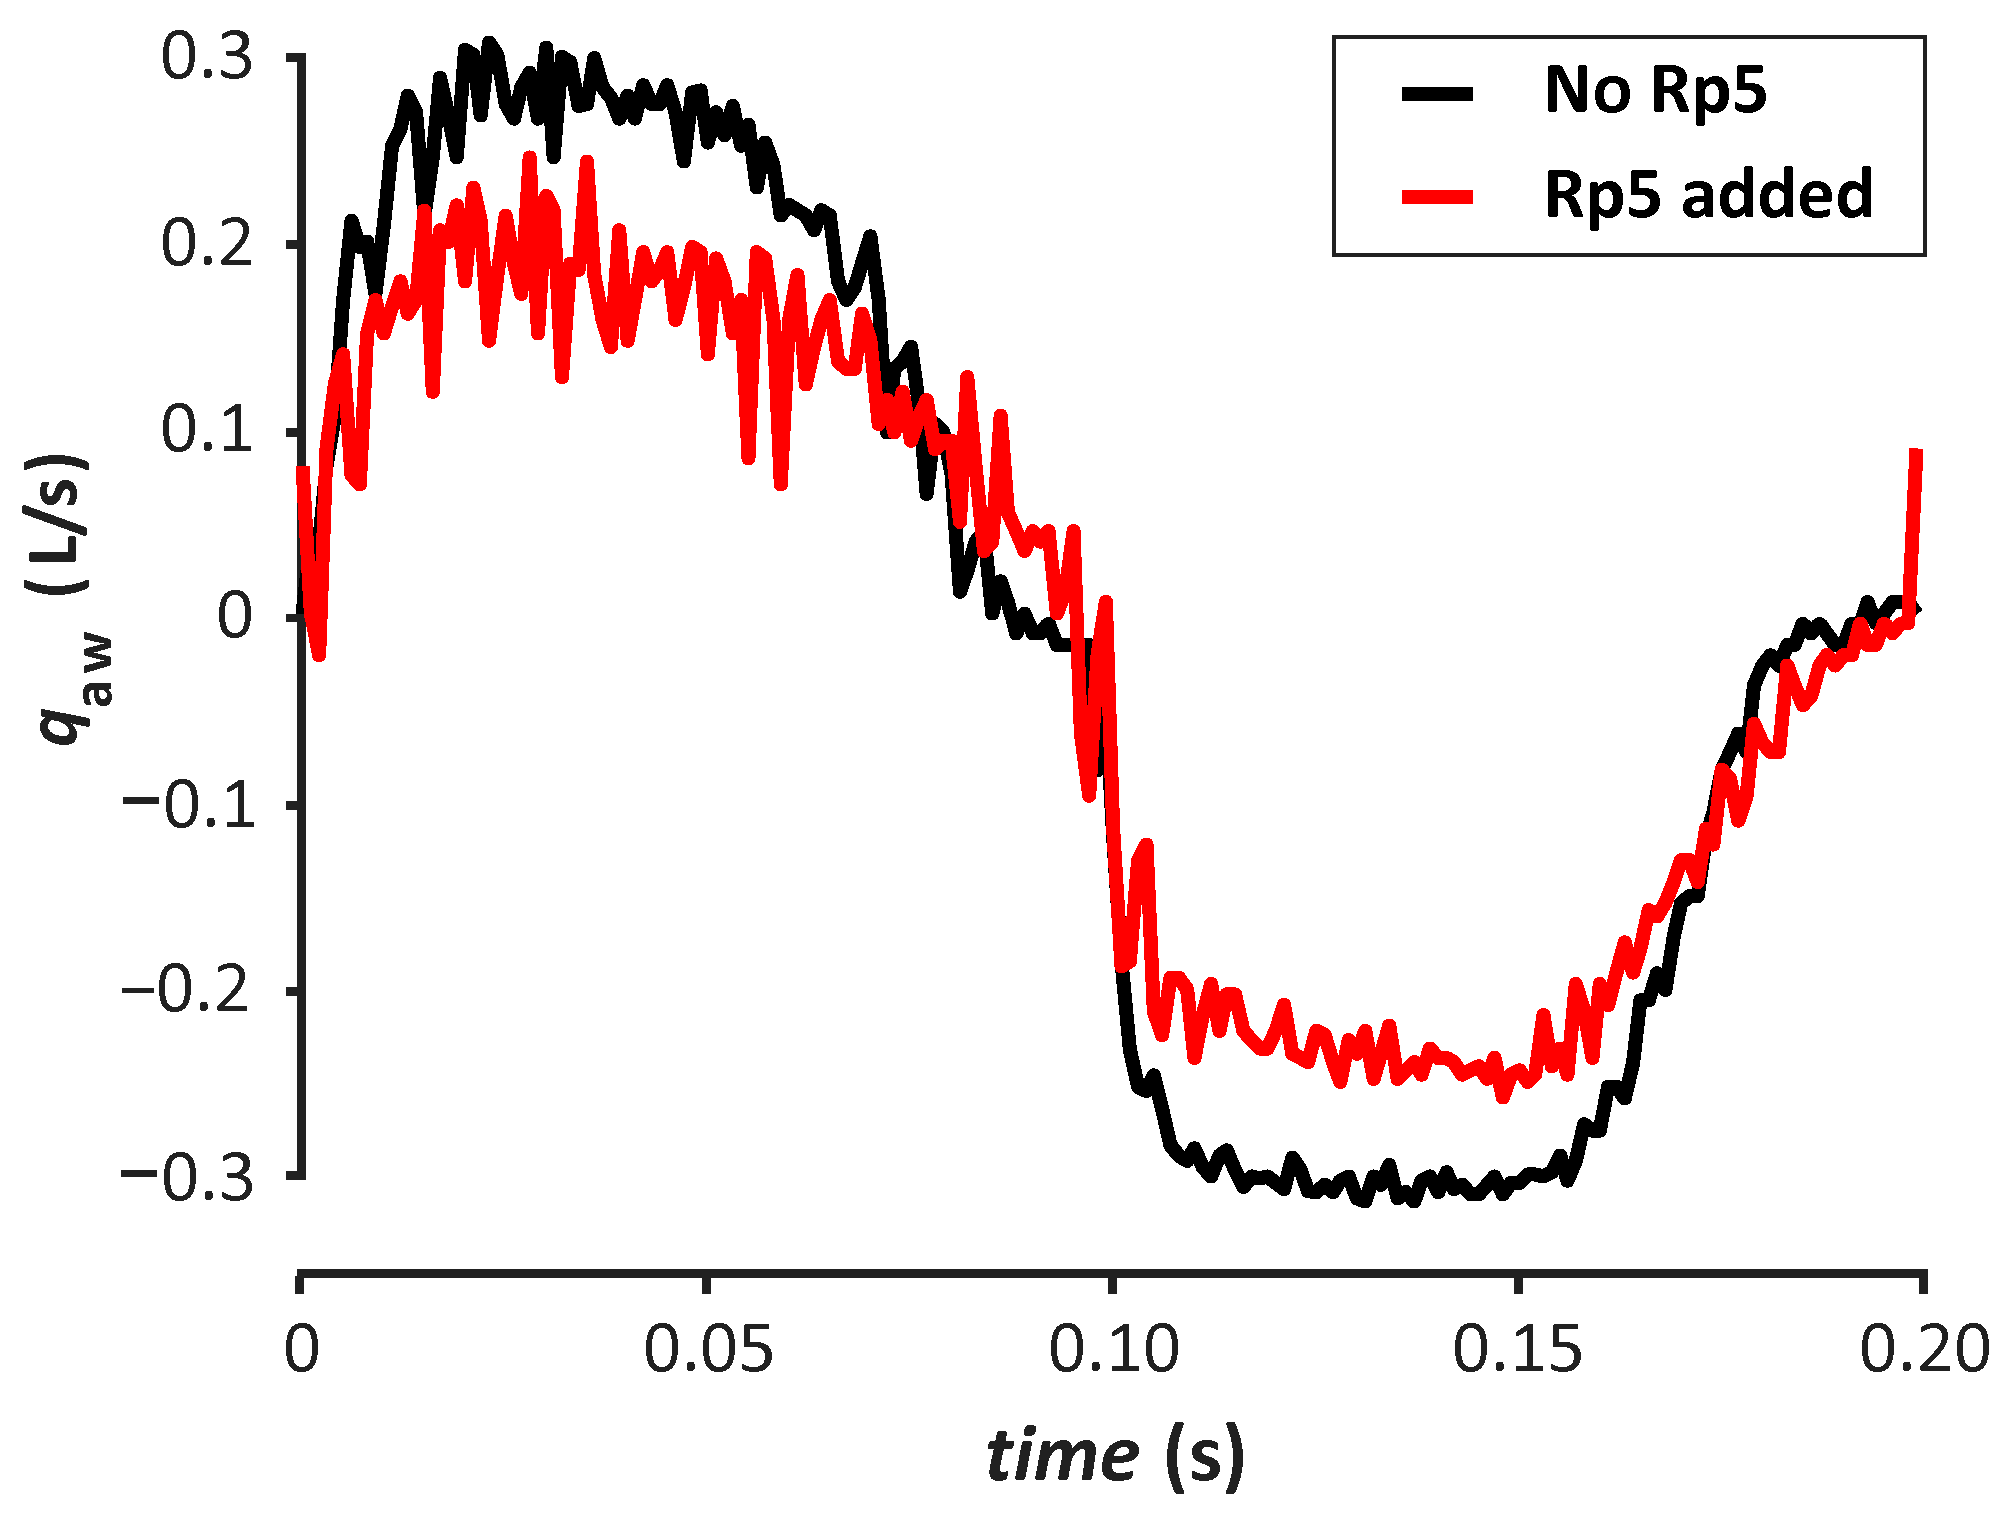
The values of the standard deviation of Xrs were very low (Table 1), which indicates a good robustness of the algorithm for Xrs calculation. The oscillation of Xrs around the average value was caused by the noise in the measured pressure and flow signals. Table 1 shows that the addition of the resistor into the ventilated system led to an increase in the value of the standard deviation of Xrs. This was caused by an increased noise amplitude in the flow signal after the addition of the resistor, as shown in Figure 3, in which the flow signals without and with the added resistor during one breathing cycle are compared.
The presented method for measurement of Xrs during HFOV is simple enough to be used bedside. The single component added into the patient circuit is an orifice for pressure and flow measurement. In our study, we used a system that consists of the orifice, sensors, digitizing hardware, and a laptop with evaluation software [38]; in a clinical scenario, any standard monitoring device capable of proximal pressure and flow measurement and real-time data streaming would be feasible. A possible disadvantage of this method is an increase of the flow resistance, together with the dead space when the orifice (used for pressure and flow measurement) is added into the patient circuit. A limitation of our study is that the test used a single ventilator model with a frequency f = 5 Hz. This choice was based on previous studies [33,34,35,36], and we did not investigate the possible use of other ventilatory frequencies.
As the described method allows determination of relative compliance with respect to airway inertance and resistance, its practical application is predetermined to maneuvers, during which the change in lung compliance is the dominant parameter affecting changes in respiratory system mechanics. An example of such a maneuver, and thus a possible advantage of using the relative compliance determination, is optimizing CDP in the initial phase of HFOV or its reassessment during the course of ventilation. Another advantage of relative compliance determination could be evaluating efficiency of recruitment maneuver, commonly implemented as a stepwise increase and consequent decrease of CDP, while evaluating influenced physiological parameters [42]. In these situations, when a constant airway inertance and resistance can be assumed, observing a short-time trend of relative compliance gives a faster response than standard methods that utilize assessment of the respiratory gas exchange. Because maximal compliance and maximal carbon dioxide elimination are highly correlated [29], relative compliance change could indicate appropriateness of a conducted CDP-optimization step. Suter et al. [43] documented that in adult patients with atelectatic lung disease, both underinflation and overinflation of the lungs impaired lung compliance. Changes in functional residual capacity during a recruitment procedure impact lung compliance as the position of ventilation changes along the inflation and deflation limbs of the pressure–volume curve [44]. As a consequence, a decrease in the relative lung compliance indicates moving ventilation outside of the linear lung-compliance region (i.e., it is able to detect either emerging lung collapse or lung hyperinflation). This method of relative lung compliance measurement could also facilitate control of modern ventilators that use mathematical modeling of the respiratory system as an integral part of their control systems, real-time systems for support of spontaneous breathing during HFOV, and in other applications with advanced control systems [45,46,47].

5. Conclusions

In this in vitro study, we verified the possibility of monitoring the relative compliance of lungs during HFOV in laboratory conditions using the model of large laboratory animal. The results of the study showed that the monitoring of relative compliance in laboratory conditions is possible. The method we used is simple enough for bedside use in clinical practice, and seems to be suitable for real-time monitoring as well. The method could allow the evaluation of changes in respiratory system compliance related to the setting of CDP during HFOV of large laboratory animals and pediatric and adult patients. It could help physicians or respiratory therapists to assess the trend in compliance of the respiratory system when its direct measurement is not available, and the information could be used for optimizing CDP in HFOV.

Author Contributions

Conceptualization, M.R.; methodology, J.M.; software, J.M.; validation, J.R.; formal analysis, J.M.; investigation, M.R.; resources, P.K.; data curation, J.M.; writing—original draft preparation, J.M.; writing—review and editing, M.R., J.R., K.R.; visualization, J.M., K.R.; supervision, M.R., K.R.; project administration, M.R.; funding acquisition, M.R. All authors have read and agreed to the published version of the manuscript.

Funding

This work was supported by projects SGS19/202/OHK4/3T/17 and SGS20/202/OHK4/3T/17.

Institutional Review Board Statement

Not applicable.

Informed Consent Statement

Not applicable.

Data Availability Statement

The data presented in this study are available on request from the corresponding author.

Conflicts of Interest

The authors declare no conflict of interest.

References

  1. Meade, M.O.; Young, D.; Hanna, S.; Zhou, Q.; Bachman, T.E.; Bollen, C.; Slutsky, A.S.; Lamb, S.E.; Adhikari, N.K.; Mentzelopoulos, S.D.; et al. Severity of Hypoxemia and Effect of High-Frequency Oscillatory Ventilation in Acute Respiratory Distress Syndrome. Am. J. Respir. Crit. Care Med. 2017, 196, 727–733. [Google Scholar] [CrossRef]
  2. Sud, S.; Sud, M.; Friedrich, J.O.; Meade, M.O.; Ferguson, N.D.; Wunsch, H.; Adhikari, N.K. High frequency oscillation in patients with acute lung injury and acute respiratory distress syndrome (ARDS): Systematic review and meta-analysis. BMJ 2010, 340, c2327. [Google Scholar] [CrossRef] [Green Version]
  3. Sklar, M.C.; Fan, E.; Goligher, E.C. High-Frequency Oscillatory Ventilation in Adults With ARDS: Past, Present, and Future. Chest 2017, 152, 1306–1317. [Google Scholar] [CrossRef]
  4. Ng, J.; Ferguson, N.D. High-frequency oscillatory ventilation: Still a role? Curr. Opin. Crit. Care 2017, 23, 175–179. [Google Scholar] [CrossRef] [PubMed]
  5. Goligher, E.C.; Munshi, L.; Adhikari, N.K.; Meade, M.O.; Hodgson, C.L.; Wunsch, H.; Uleryk, E.; Gajic, O.; Amato, M.P.; Ferguson, N.D.; et al. High-Frequency Oscillation for Adult Patients with Acute Respiratory Distress Syndrome. A Systematic Review and Meta-Analysis. Ann. Am. Thorac. Soc. 2017, 14, S289–S296. [Google Scholar] [CrossRef]
  6. Wong, J.J.; Liu, S.; Dang, H.; Anantasit, N.; Phan, P.H.; Phumeetham, S.; Qian, S.; Ong, J.S.; Gan, C.S.; Chor, Y.K.; et al. The impact of high frequency oscillatory ventilation on mortality in paediatric acute respiratory distress syndrome. Crit. Care 2020, 24, 31. [Google Scholar] [CrossRef] [PubMed] [Green Version]
  7. Angriman, F.; Ferreyro, B.L.; Donaldson, L.; Cuthbertson, B.H.; Ferguson, N.D.; Bollen, C.W.; Bachman, T.E.; Lamontagne, F.; Adhikari, N.K. The harm of high-frequency oscillatory ventilation (HFOV) in ARDS is not related to a high baseline risk of acute cor pulmonale or short-term changes in hemodynamics. Intensive Care Med. 2020, 46, 132–134. [Google Scholar] [CrossRef] [PubMed]
  8. Ning, B.; Liang, L.; Lyu, Y.; Yu, Y.; Li, B. The effect of high-frequency oscillatory ventilation or airway pressure release ventilation on children with acute respiratory distress syndrome as a rescue therapy. Transl. Pediatr. 2020, 9, 213–220. [Google Scholar] [CrossRef]
  9. Ferguson, N.D.; Cook, D.J.; Guyatt, G.H.; Mehta, S.; Hand, L.; Austin, P.; Zhou, Q.; Matte, A.; Walter, S.D.; Lamontagne, F.; et al. High-frequency oscillation in early acute respiratory distress syndrome. N. Engl. J. Med. 2013, 368, 795–805. [Google Scholar] [CrossRef] [Green Version]
  10. Young, D.; Lamb, S.E.; Shah, S.; MacKenzie, I.; Tunnicliffe, W.; Lall, R.; Rowan, K.; Cuthbertson, B.H. High-frequency oscillation for acute respiratory distress syndrome. N. Engl. J. Med. 2013, 368, 806–813. [Google Scholar] [CrossRef] [Green Version]
  11. Gu, X.L.; Wu, G.N.; Yao, Y.W.; Shi, D.H.; Song, Y. Is high-frequency oscillatory ventilation more effective and safer than conventional protective ventilation in adult acute respiratory distress syndrome patients? A meta-analysis of randomized controlled trials. Crit. Care 2014, 18, R111. [Google Scholar] [CrossRef] [Green Version]
  12. Maitra, S.; Bhattacharjee, S.; Khanna, P.; Baidya, D.K. High-frequency ventilation does not provide mortality benefit in comparison with conventional lung-protective ventilation in acute respiratory distress syndrome: A meta-analysis of the randomized controlled trials. Anesthesiology 2014, 122, 841–851. [Google Scholar] [CrossRef] [PubMed]
  13. de Jager, P.; Kamp, T.; Dijkstra, S.K.; Burgerhof, J.G.; Markhorst, D.G.; Curley, M.A.; Cheifetz, I.M.; Kneyber, M.C. Feasibility of an alternative, physiologic, individualized open-lung approach to high-frequency oscillatory ventilation in children. Ann. Intensive Care 2019, 9, 9. [Google Scholar] [CrossRef] [PubMed]
  14. de Jager, P.; Burgerhof, J.G.; Koopman, A.A.; Markhorst, D.G.; Kneyber, M.C. Physiologic responses to a staircase lung volume optimization maneuver in pediatric high-frequency oscillatory ventilation. Ann. Intensive Care 2020, 10, 153. [Google Scholar] [CrossRef]
  15. Liu, S.; Zhao, Z.; Tan, L.; Wang, L.; Möller, K.; Frerichs, I.; Yu, T.; Huang, Y.; Pan, C.; Yang, Y.; et al. Optimal mean airway pressure during high-frequency oscillatory ventilation in an experimental model of acute respiratory distress syndrome: EIT-based method. Ann. Intensive Care 2020, 10, 31. [Google Scholar] [CrossRef] [PubMed] [Green Version]
  16. Lista, G.; Bresesti, I.; Cavigioli, F.; Castoldi, F.; Lupo, E.; LoMauro, A.; Aliverti, A. Efficacy of lung volume optimization maneuver monitored by optoelectronic pletismography in the management of congenital diaphragmatic hernia. Respir. Med. Case Rep. 2017, 22, 133–136. [Google Scholar] [CrossRef]
  17. Zannin, E.; Dellaca, R.L.; Dognini, G.; Marconi, L.; Perego, M.; Pillow, J.J.; Tagliabue, P.E.; Ventura, M.L. Effect of frequency on pressure cost of ventilation and gas exchange in newborns receiving high-frequency oscillatory ventilation. Pediatr. Res. 2017, 82, 994–999. [Google Scholar] [CrossRef]
  18. Kneyber, M.C.; Markhorst, D.G. Do We Really Know How to Use High-Frequency Oscillatory Ventilation in Critically Ill Children? Am. J. Respir. Crit. Care Med. 2016, 193, 1067–1068. [Google Scholar] [CrossRef]
  19. Kneyber, M.C.; Markhorst, D.G. Any trial can (almost) kill a good technique. Intensive Care Med. 2016, 42, 1092–1093. [Google Scholar] [CrossRef]
  20. Dellacà, R.L.; Zannin, E.; Ventura, M.L.; Sancini, G.; Pedotti, A.; Tagliabue, P.; Miserocchi, G. Assessment of dynamic mechanical properties of the respiratory system during high-frequency oscillatory ventilation. Crit. Care Med. 2013, 41, 2502–2511. [Google Scholar] [CrossRef]
  21. Casserly, B.; McCool, F.D.; Sethi, J.M.; Kawar, E.; Read, R.; Levy, M.M. A method for determining optimal mean airway pressure in high-frequency oscillatory ventilation. Lung 2013, 191, 69–76. [Google Scholar] [CrossRef] [PubMed]
  22. van Genderingen, H.R.; van Vught, J.A.; Jansen, J.R.; Duval, E.L.; Markhorst, D.G.; Versprille, A. Oxygenation index, an indicator of optimal distending pressure during high-frequency oscillatory ventilation? Intensive Care Med. 2002, 28, 1151–1156. [Google Scholar] [CrossRef]
  23. Goddon, S.; Fujino, Y.; Hromi, J.M.; Kacmarek, R.M. Optimal mean airway pressure during high-frequency oscillation: Predicted by the pressure-volume curve. Anesthesiology 2001, 94, 862–869. [Google Scholar] [CrossRef] [PubMed]
  24. Habib, R.H.; Pyon, K.H.; Courtney, S.E. Optimal high-frequency oscillatory ventilation settings by nonlinear lung mechanics analysis. Am. J. Respir. Crit. Care Med. 2002, 166, 950–953. [Google Scholar] [CrossRef] [PubMed]
  25. Klapsing, P.; Moerer, O.; Wende, C.; Herrmann, P.; Quintel, M.; Bleckmann, A.; Heuer, J.F. High-frequency oscillatory ventilation guided by transpulmonary pressure in acute respiratory syndrome: An experimental study in pigs. Crit. Care 2018, 22, 121. [Google Scholar] [CrossRef] [PubMed]
  26. Klapsing, P.; Moerer, O.; Wende, C.; Herrmann, P.; Quintel, M.; Bleckmann, A.; Heuer, J.F. Setting mean airway pressure during high-frequency oscillatory ventilation according to the static pressure-volume curve in surfactant-deficient lung injury: A computed tomography study. Anesthesiology 2003, 99, 1313–1322. [Google Scholar] [CrossRef] [Green Version]
  27. Tingay, D.G.; Mills, J.F.; Morley, C.J.; Pellicano, A.; Dargaville, P.A. Indicators of optimal lung volume during high-frequency oscillatory ventilation in infants. Crit. Care Med. 2013, 41, 237–244. [Google Scholar] [CrossRef]
  28. Zannin, E.; Ventura, M.L.; Dellacà, R.L.; Natile, M.; Tagliabue, P.; Perkins, E.J.; Sourial, M.; Bhatia, R.; Dargaville, P.A.; Tingay, D.G. Optimal mean airway pressure during high-frequency oscillatory ventilation determined by measurement of respiratory system reactance. Pediatr. Res. 2014, 75, 493–499. [Google Scholar] [CrossRef] [Green Version]
  29. Miedema, M.; de Jongh, F.H.; Frerichs, I.; van Veenendaal, M.B.; van Kaam, A.H. The effect of airway pressure and oscillation amplitude on ventilation in pre-term infants. Eur. Respir. J. 2012, 40, 479–484. [Google Scholar] [CrossRef] [Green Version]
  30. Pillow, J.J. Tidal volume, recruitment and compliance in HFOV: Same principles, different frequency. Eur. Respir. J. 2012, 40, 291–293. [Google Scholar] [CrossRef] [Green Version]
  31. Kung, S.C.; Hung, Y.L.; Chen, W.L.; Wang, C.M.; Chang, H.C.; Liu, W.L. Effects of Stepwise Lung Recruitment Maneuvers in Patients with Early Acute Respiratory Distress Syndrome: A Prospective, Randomized, Controlled Trial. J. Clin. Med. 2019, 8, 231. [Google Scholar] [CrossRef] [PubMed] [Green Version]
  32. Bates, J.H. The Role of Airway Shunt Elastance on the Compartmentalization of Respiratory System Impedance. J. Eng. Sci. Med. Diagn. Ther. 2019, 2, 110011–110018. [Google Scholar] [CrossRef] [PubMed]
  33. Brashier, B.; Salvi, S. Measuring lung function using sound waves: Role of the forced oscillation technique and impulse oscillometry system. Breathe 2015, 11, 57–65. [Google Scholar] [CrossRef] [PubMed]
  34. Shimoda, T.; Obase, Y.; Nagasaka, Y.; Kishikawa, R.; Mukae, H.; Iwanaga, T. Peripheral bronchial obstruction evaluation in patients with asthma by lung sound analysis and impulse oscillometry. Allergol. Int. 2017, 66, 132–138. [Google Scholar] [CrossRef] [PubMed] [Green Version]
  35. Aronsson, D.; Hesselstrand, R.; Bozovic, G.; Wuttge, D.M.; Tufvesson, E. Airway resistance and reactance are affected in systemic sclerosis. Eur. Clin. Respir. J. 2015, 2, 28667. [Google Scholar] [CrossRef] [Green Version]
  36. Bhattarai, P.; Myers, S.; Chia, C.; Weber, H.C.; Young, S.; Williams, A.D.; Sohal, S.S. Clinical Application of Forced Oscillation Technique (FOT) in Early Detection of Airway Changes in Smokers. J. Clin. Med. 2020, 9, 2778. [Google Scholar] [CrossRef]
  37. Fessler, H.E.; Derdak, S.; Ferguson, N.D.; Hager, D.N.; Kacmarek, R.M.; Thompson, B.T.; Brower, R.G. A protocol for high-frequency oscillatory ventilation in adults: Results from a roundtable discussion. Crit. Care Med. 2007, 35, 1649–1654. [Google Scholar] [CrossRef]
  38. Roubik, K. Measuring and evaluating system designed for high-frequency oscillatory ventilation monitoring. Biomed. Tech. 2014. [Google Scholar] [CrossRef]
  39. Welch, P. The use of fast Fourier transform for the estimation of power spectra: A method based on time averaging over short, modified periodograms. IEEE Trans. Audio Electroacoust. 1967, 15, 70–73. [Google Scholar] [CrossRef] [Green Version]
  40. Michaelson, E.D.; Grassman, E.D.; Wendell, R.P. Pulmonary mechanics by spectral analysis of forced random noise. J. Clin. Invest. 1975, 56, 1210–1230. [Google Scholar] [CrossRef]
  41. Rožánek, M.; Horáková, Z.; Čadek, O.; Kučera, M.; Roubík, K. Damping of the dynamic pressure amplitude in the ventilatory circuit during high-frequency oscillatory ventilation. Biomed. Eng. Biomed. Tech. 2012, 57, 53–56. [Google Scholar] [CrossRef] [PubMed]
  42. Laviola, M.; Rafl, J.; Rozanek, M.; Kudrna, P.; Roubik, K. Models of PaO2 response to the continuous distending pressure maneuver during high frequency oscillatory ventilation in healthy and ARDS lung model pigs. Exp. Lung Res. 2016, 42, 87–94. [Google Scholar] [CrossRef] [PubMed]
  43. Suter, P.M.; Fairley, H.B.; Isenberg, M.D. Optimum endexpiratory airway pressure in patients with acute pulmonary failure. N. Engl. J. Med. 1975, 292, 284–289. [Google Scholar] [CrossRef] [PubMed]
  44. Dargaville, P.A.; Rimensberger, P.C.; Frerichs, I. Regional tidal ventilation and compliance during a stepwise vital capacity manoeuvre. Intensive Care Med. 2010, 36, 1953–1961. [Google Scholar] [CrossRef]
  45. Dellaca, R.L.; Veneroni, C. Trends in mechanical ventilation: Are we ventilating our patients in the best possible way? Breathe 2017, 13, 84–98. [Google Scholar] [CrossRef]
  46. Roubík, K.; Ráfl, J.; van Heerde, M.; Markhorst, D.G. Design and control of a demand flow system assuring spontaneous breathing of a patient connected to an HFO ventilator. IEEE Trans. Biomed. Eng. 2011, 58, 3225–3233. [Google Scholar] [CrossRef]
  47. Van Heerde, M.; Roubik, K.; Kopelent, V.; Plötz, F.B.; Markhorst, D.G. Demand flow facilitates spontaneous breathing during high-frequency oscillatory ventilation in a pig model. Crit. Care Med. 2009, 37, 1068–1073. [Google Scholar] [CrossRef]
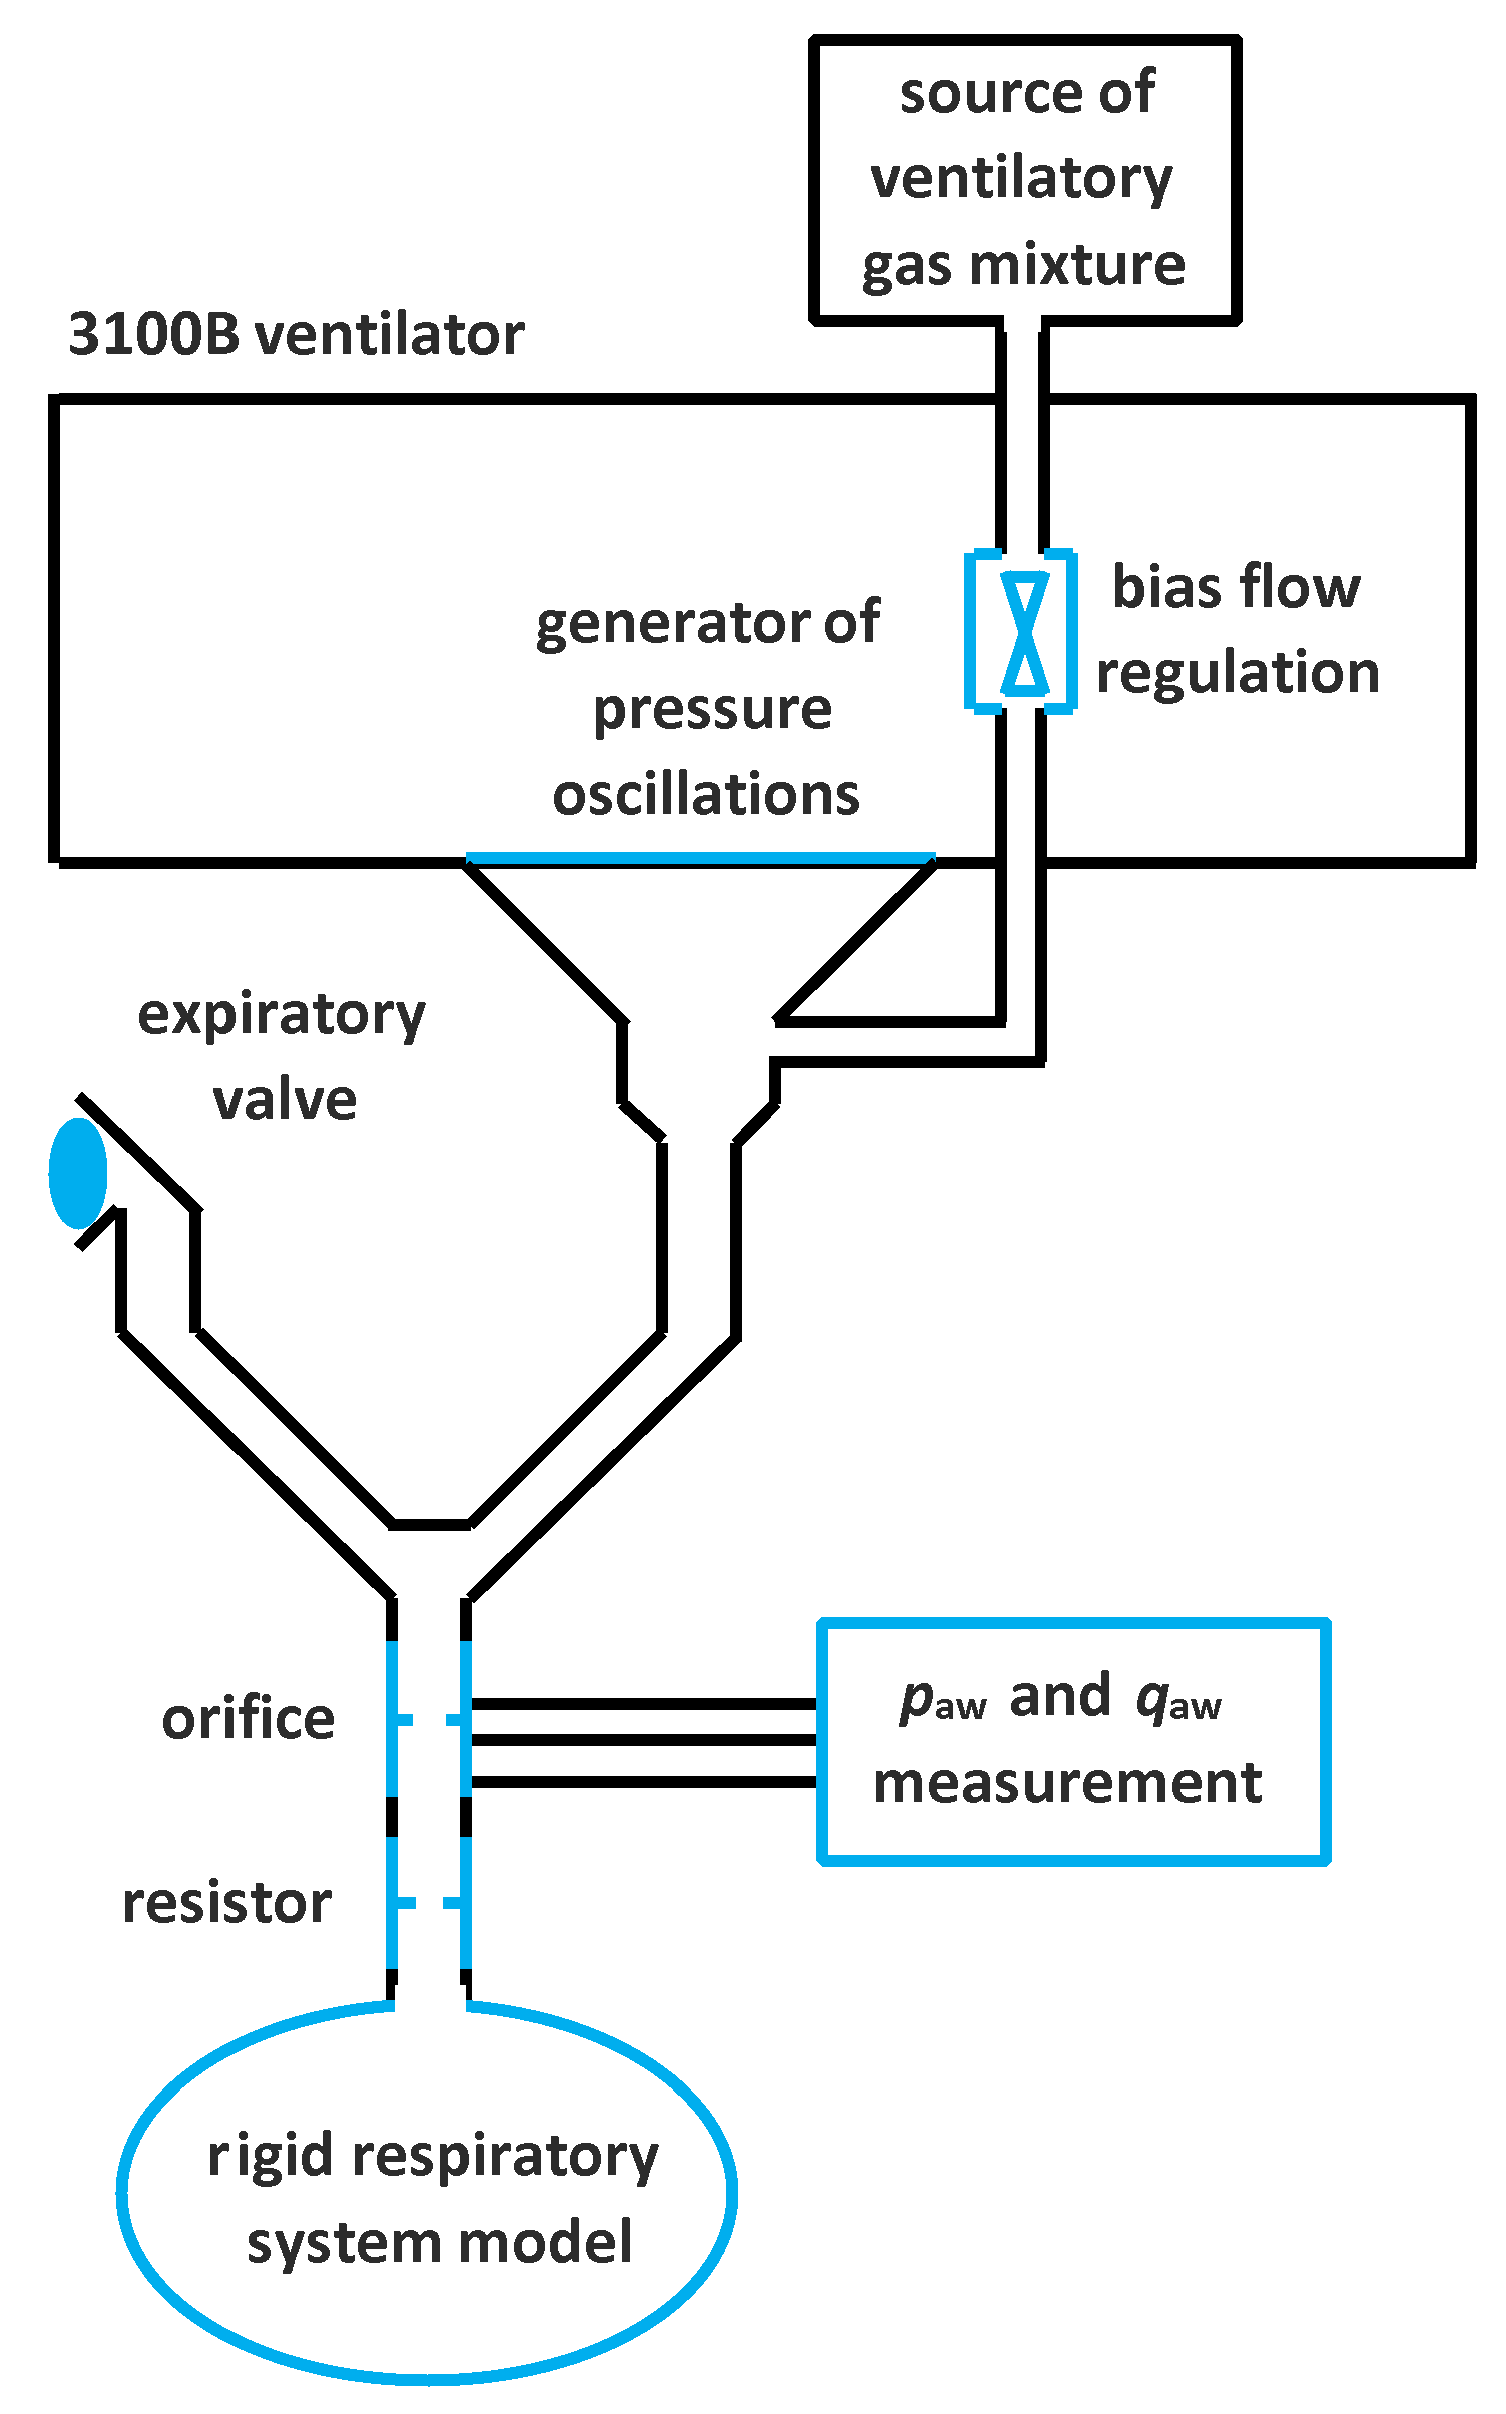
Figure 1. The arrangement of the experiment.
Applsci 11 00899 g001
Figure 2. The waveform of Xrs when ventilating a model of the respiratory system without an additional resistor (R = 0 cmH2O∙s/L) and with an additional resistor (R = 5 cmH2O∙s/L). Three glass containers with different volumes (25, 35, and 54 L) were ventilated with and without the resistor to mimic various compliance of the respiratory system.
Applsci 11 00899 g002
Figure 3. Comparison of the measured flow signal prior to and after the addition of the Rp5 resistor.
Applsci 11 00899 g003
Table 1. Summary of the detected values of Xrs (cmH2O∙s/L).
V (L)Xrs with No ResistorXrs with Added Resistor
MeanSD 1MeanSD 1
54−5.820.06−1.560.17
35−12.070.05−8.260.17
25−18.760.06−15.620.17
1 SD is an abbreviation for standard deviation.
Publisher’s Note: MDPI stays neutral with regard to jurisdictional claims in published maps and institutional affiliations.