Article

An Unsupervised Prediction Model for Salmonella Detection with Hyperspectral Microscopy: A Multi-Year Validation

1
Family Health International (FHI) 360, Product Quality and Compliance, Durham, NC 27713, USA
2
U.S. Department of Agriculture, Agricultural Research Service, U.S. National Poultry Research Center, Athens, GA 30605, USA
*
Author to whom correspondence should be addressed.
Appl. Sci. 2021, 11(3), 895; https://doi.org/10.3390/app11030895
Submission received: 12 December 2020 / Revised: 4 January 2021 / Accepted: 15 January 2021 / Published: 20 January 2021
(This article belongs to the Special Issue Application of Spectroscopy in Food Analysis: Volume II)

Abstract

:
Hyperspectral microscope images (HMIs) have been previously explored as a tool for the early and rapid detection of common foodborne pathogenic bacteria. A robust unsupervised classification approach to differentiate bacterial species with the potential for single cell sensitivity is needed for real-world application, in order to confirm the identity of pathogenic bacteria isolated from a food product. Here, a one-class soft independent modelling of class analogy (SIMCA) was used to determine if individual cells are Salmonella positive or negative. The model was constructed and validated with a spectral library built over five years, containing 13 Salmonella serotypes and 14 non-Salmonella foodborne pathogens. An image processing method designed to take less than one minute paired with the one-class Salmonella prediction algorithm resulted in an overall classification accuracy of 95.4%, with a Salmonella sensitivity of 0.97, and specificity of 0.92. SIMCA’s prediction accuracy was only achieved after a robust model incorporating multiple serotypes was established. These results demonstrate the potential for HMI as a sensitive and unsupervised presumptive screening method, moving towards the early (<8 h) and rapid (<1 h) identification of Salmonella from food matrices.

1. Introduction

Salmonella is a leading cause of gastroenteritis, with severe cases occasionally resulting in death. The World Health Organization estimates that 550 million people fall ill to foodborne diseases annually, with 33 million healthy life years calculated as lost. Non-typhoidal Salmonella represents one of the four primary pathogenic bacteria responsible [1]. Traditional detection methods such as the use of a nutrient enriched growth medium or polymerase chain reaction (PCR) have been used as the standard for the detection of Salmonella for years. While these methods are effective, the incubation time required for nutrient enriched growth media, or the reoccurring costs along with the advanced training requirement of PCR are disadvantages that influence the time required to correctly identify the causative agent and source of a foodborne disease outbreak.
In recent years, hyperspectral imaging (HSI) and hyperspectral microscope images (HMI) have been approached for food safety and quality assessment. HSI methods have been applied for the estimation of bacterial total viable counts (TVC) on the surface of salmon, pork, and chicken cuts [2,3,4]. HSI has seen application for the determination of the Campylobacter species or Shiga toxin-producing E. coli. (STEC) serogroup of bacterial colonies grown on their respective selective nutrient enriched agar plates [5,6,7]. Anderson et al. [8] discovered that an HMI system could differentiate between spectral patterns of viable and non-viable Bacillus anthraces spores damaged from contact with hydrogen peroxide. Previously, our laboratory’s research has shown that bacterial species can be differentiated through HMI, as well as serotypes of the same species, by using a single cell-based mean pixel intensity pattern, and early detection was possible in times of 8 h or less [9].
The previous project objectives involved the use of discriminant analyses (DA) or other multivariate approaches to determine if the differences in a specific experimental treatment existed. In order to advance this technology forward, an unsupervised classification approach for HMI data is necessary to determine a taxonomical identification. Presumptive pathogen screening of a food sample would require HMI to produce a yes/no answer, similar to qualitative PCR. In order to construct an unsupervised prediction model that results in a bacterial HMI slide testing positive or negative for the presence of Salmonella, a soft independent modelling of class analogy (SIMCA) approach was chosen. In this application, SIMCA was preferable to a DA with hard decision boundaries, because DA will force a sample into a positive or negative category, whereas the soft boundaries of SIMCA can reject a sample outside of the calibration model’s boundaries [10]. This is preferable for a qualitative food safety approach that gives a binary yes or no determination for a bacteria’s presence in a food product. If a DA forces a sample into a false-negative or type II error, a potentially contaminated product can be overlooked and erroneously regarded as safe, jeopardizing public health. Previously, food authentication research has addressed the issue of a food product’s quality by using spectroscopy methods paired with SIMCA to determine if product adulterations have been made for economic benefit [11].
HMI research has shown potential for application in early and rapid food safety methodologies, but the validation of a comprehensive and robust modeling approach is necessary in moving the unsupervised classification technology forward. Data were collected over the span of five years, between May 2012 and May 2017. The aim of this study was that a robust one-class SIMCA calibration model for rapid Salmonella prediction at a cellular level was constructed to determine if validation from a multi-year study could accurately predict Salmonella presence at a comparable performance to traditional detection methods such as PCR and nutrient enriched plating, with approximately 95% accuracy.

2. Materials and Methods

2.1. Sample Preparation and Collection
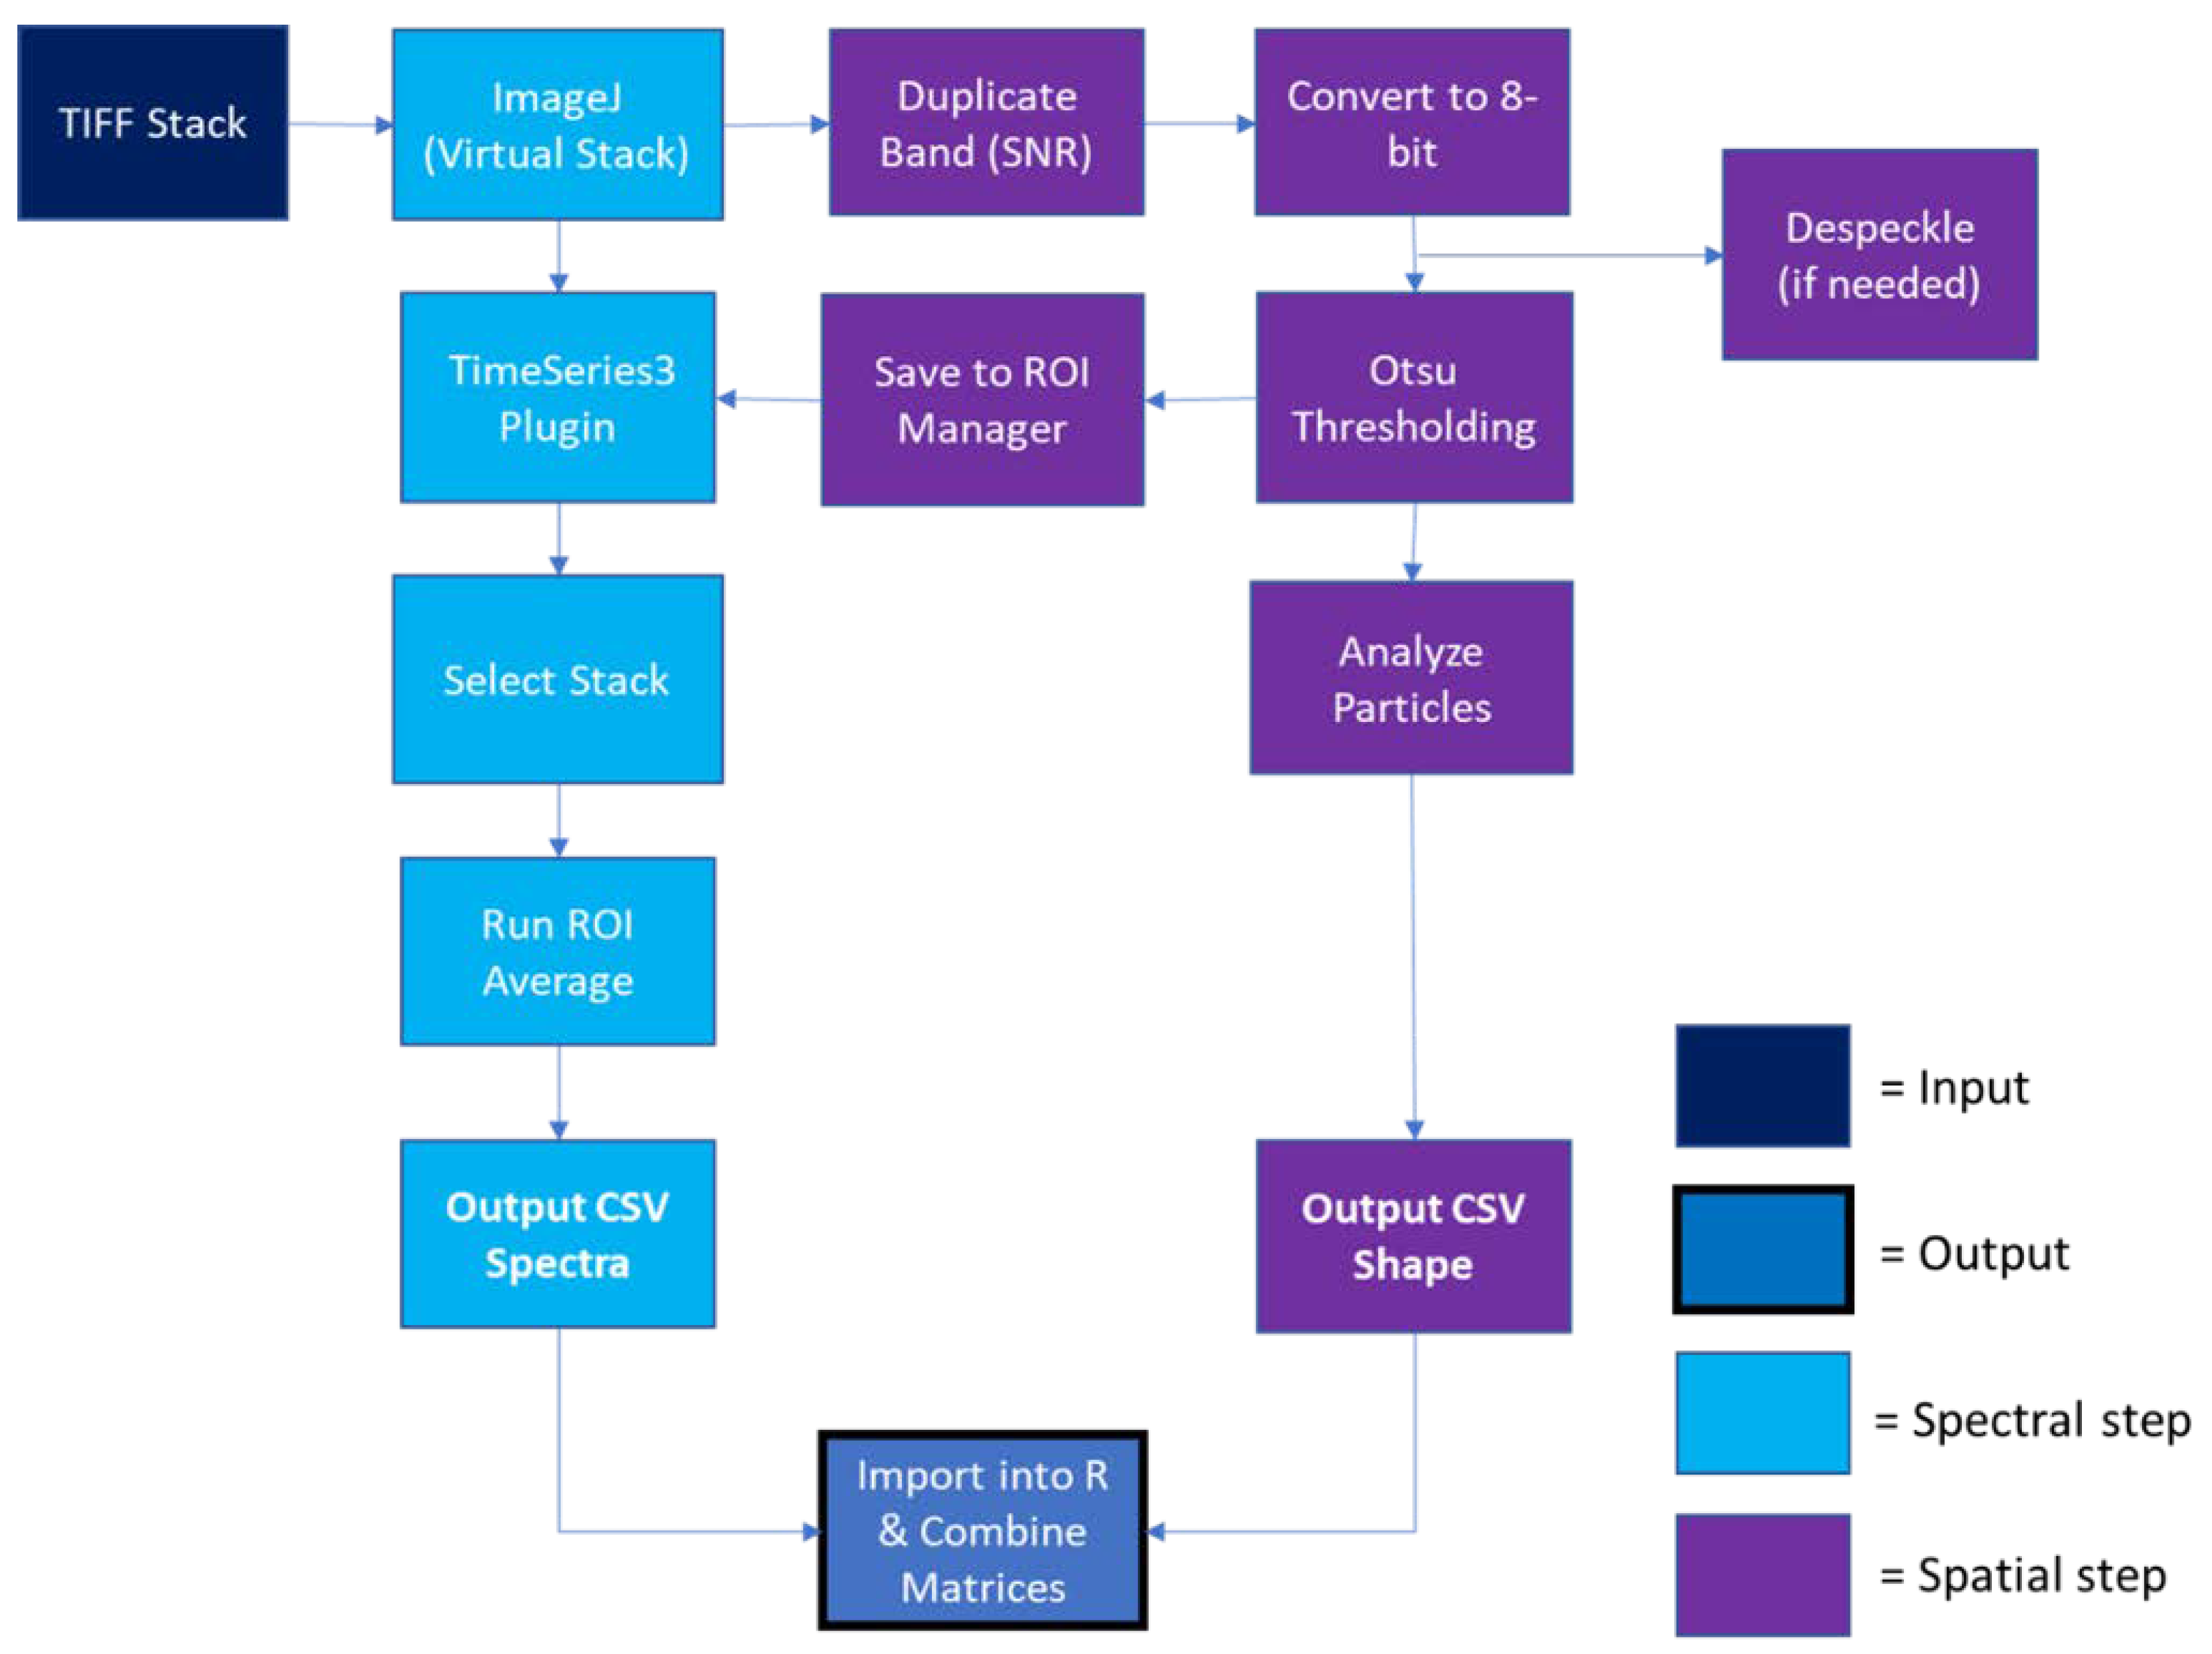
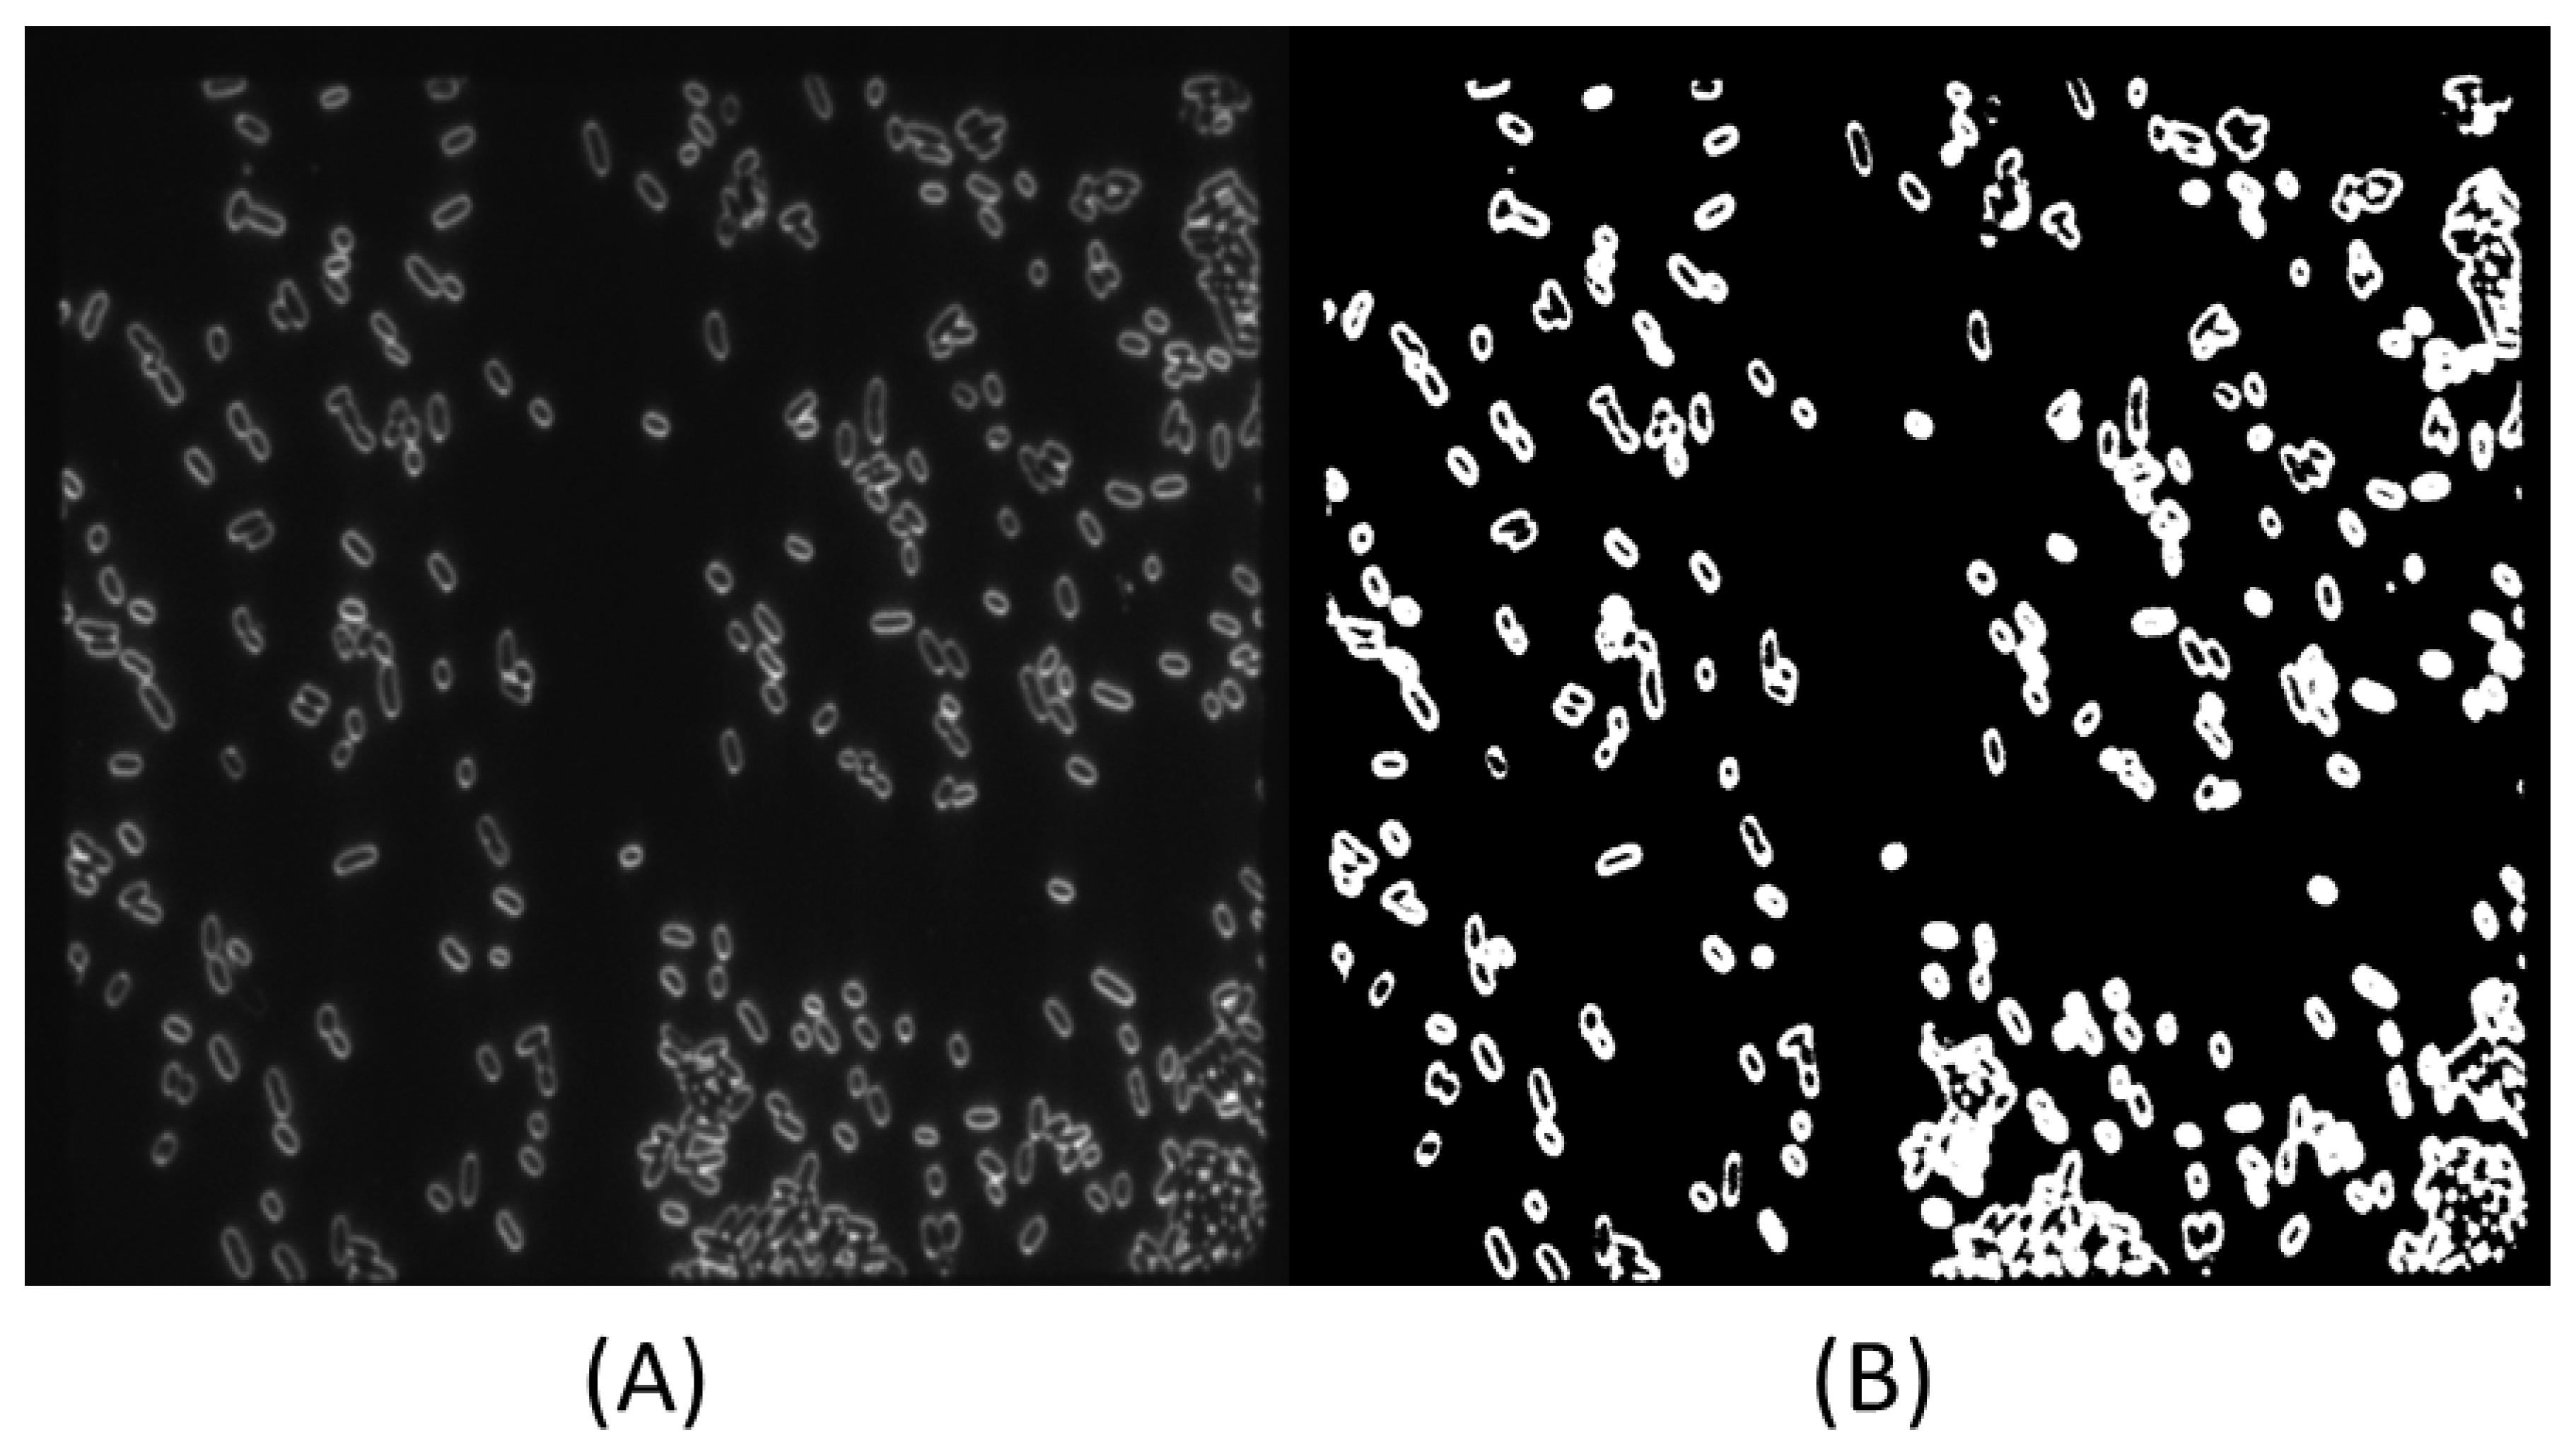
Bacterial cultures were isolated and purified from broiler chicken carcass rinses at the U.S. National Poultry Research Center by the Poultry Microbiological Safety and Processing Research Unit and were stored in 20% glycerol at −80 °C, except for the Campylobacter species, which were obtained from the American Type Culture Collection (Manassas, VA, USA). Stock cultures were removed from the freezer as needed and were inoculated onto the organism’s appropriate growth media, then incubated for the necessary time–temperature relationship [12]. A list of the microorganisms and abbreviations used can be found in Table 1.
After incubation, the cultures were stored at 4 °C with sample slides prepared, and the HMI was collected within 24 h. Bacterial cultures were sampled as mentioned in Park et al. [13]. In brief, the method calls for an inoculation loop to pick a typical colony from an agar plate, then it is inoculated into 100 µL of deionized water, vortexed, followed by placing 3 µL of the bacterial suspension on a common glass microscope slide, then allowing it to air dry under a biosafety cabinet for 15 min. A coverslip was applied, and the glass slide was placed on the HMI system’s sample stage and viewed under a 100× oil objective (Olympus, Tokyo, Japan). This effectively affixes the cells to the slide for hypercube image collection, without damaging the microorganisms, resulting in HMI of individual live cells obtained without the use of reagents, tags, or dyes.
The HMI system consists of an acousto-optic tunable filter (AOTF; Gooch and Housego, Ilminster, UK), 16-bit electron multiplying charge coupled device (EMCCD) (Andor Technology, Belfast, Northern Ireland), optimized darkfield condenser (Cytoviva, Auburn, AL, USA), 24 W tungsten halogen (TH) light (Osram, Munich, Germany), and a digital upright microscope (i80 Nikon, Lewisville, TX, USA). The TH light source was offset from the HMI system in a lamp house connected underneath the sampling stage via a fiber optic cable, which prevents heat damage to bacterial cells generated from the lamp. The HMI system collected 89 TIFF files in 4-nm increments in the range of 450–800 nm, stacking files together to form a hypercube. Hypercubes were 1000 × 1000 × 89, resulting in 89 million data points per hypercube from one sample.

2.2. HMI Processing

Fiji (ImageJ 2.0) [14] was used to process raw TIFF images collected in the hypercube stacks. Figure 1 shows a flowchart for the image processing method that extracts the mean single cell spectra in less than 5 min.
The hypercube was imported into Fiji as a virtual stack, and the spectral band resulting in a high cell to background contrast was identified and duplicated as an 8-bit grayscale image for shape analysis. The auto-thresholding option in Fiji was selected, with 16 thresholding algorithms being tested. It was found that Otsu’s method gave the optimal separation of cells from the background. Here, Otsu’s thresholding method was applied to mask the background, leaving a mask with only pixels representing cells. Otsu’s thresholding assumes a Gaussian distribution for image values, where the objective is to maximize the difference between-group variance, in this case, the feature (bacterial cells) and the background [15]. The probabilities of a pixel value falling into one of two groups can be calculated by Equation (1), as follows:
P 1 ( T ) =   i = 0 T 1 P i P 2 ( T ) =   i = T I m a x P i
where P1 and P2 represent cumulative probabilities of the two groups, T = a threshold that divides the image into pixel set S1 or S2, and Pi = the probability of image value i. After the global thresholding was computed, the Time Series 3.0 plugin [16] was used to apply the masks to the virtual stack, calculating the mean of the pixels in each regions of interest (bacterial cell). Next, Fiji exported two comma-separated value (CSV) files, where one file represented the spectral data and one file represented the shape metrics. The two CSV files were combined into one matrix, where rows were single cells with corresponding shape and spectral data shown as columns. Circularity represents how close a shape is to a perfect circle on a scale of 0 to 1, and was computed by Equation (2), as follows:
C i r = 4 π ( A P 2 )
where Cir = circularity, A = area, and P = perimeter. Bacterial cells are not always close to a value of 1, as Salmonella, E. coli, and many others are rod-shaped, in addition to Campylobacter, which can take on an S-shape. It was found that extremely low circularity values were correlated with clumps of overlapping cells, and extremely high values were typical of a small number of pixels representing extracellular debris. Thresholding values of 0.35–0.9 were optimal in removing large clumps of cells, as well as extracellular debris. Figure 2 shows an example of the bacterial hypercube and data files.

2.3. Spectral Pre-Processing

The standard normal variant (SNV) transformation has been shown to reduce spectral variation in hypercube data sets caused by small variations in sampling conditions, particle size, or bacterial size [17,18]. The SNV was calculated by Equation (3), as follows:
x ˜ i =   x i   m i δ i
where x ˜ i is the SNV adjusted spectra, mi is the sample’s mean, xi is the sample’s spectra, and δi is the sample’s standard deviation. Following SNV, outlier detection was calculated by applying a centroid-based Mahalanobis distance (MD) between two vectors, one being the individual cell’s mean spectra, and the other vector representing the class mean spectra, and was calculated by Equation (4), as follows:
M D = d ( x i ) = [ ( x i x ¯ ) T C 1 ( x i x ¯ ) ] 0.5   for   i   =   1 , , n
where xi = an object vector and x ¯ = the cluster centroid. From here, single cell values within ±3δ of the class mean MD were removed from the dataset, with 0.97% of the calibration data and 1.37% of the validation data being labeled as outliers and being removed.

2.4. SIMCA Classification Model

The SIMCA approach has previously been well defined [19,20,21]. Here, the SIMCA model was constructed for a single class, Salmonella. The calibration model was obtained through a principal component analysis (PCA), built on an optimal number of significant principal components (PCs) and defined as Equation (5), as follows:
X K =   X ¯ K +   T K ( n x r ) V K T ( r x p ) + E K ( n x p )
where n = the number of objects, r = selected PCs, p = selected variables, XK = the mean centered matrix, TK(nxr) = the score matrix obtained from n objects and r selected PCs, V K T ( r x p ) = the loading matrix obtained for r selected PCs and p variables, and E K ( n x p ) = the residual matrix [22]. The leave-one-out-cross-validation (LOO-CV) was an important step in the development of the prediction model, which has previously been shown to reduce the number of false outliers by inflating the within class component variances [23]. Class boundaries of the SIMCA are determined by Equation (6), as follows:
s 0 =   k = 1 n i = 1 p e k i 2 / [ ( p r ) ( n r 1 ) ] =   k = 1 n i = r + 1 p t k i 2 / [ ( p r ) ( n r 1 ) ]
where s0 = mean distance between objects belonging to the k class model and e k i 2 = squared residual of the kth object for the ith (latent) variable. The critical distance value is then calculated through an F-test at a specified significance level (α) by Equation (7), as follows:
S c r i t =   F c r i t s 0 2
Thirteen Salmonella serotypes were used to establish the calibration model. HMI were collected with multiple repetitions of each serotype, resulting in a collection of 3315 bacterial cells after outlier removal. Each repetition involved culturing the serotypes from frozen stock cultures. The experimental conditions were kept the same; however, small variances in colony size, or cellular size could be noticed after the incubation of the same strain. For this reason, multiple repetitions of the same strains were regrown from frozen stock for each serotype in the calibration model in order to sufficiently cover a robust set of Salmonella bacterial conditions and spectral variation within the species.

2.5. SIMCA Validation

Over five years, the SIMCA prediction model was validated by Salmonella serotypes, similar Enterobacteriaceae family members, and other pathogenic/spoilage microbes commonly found in food products, totaling 19 microorganisms and 3421 bacterial cells after outlier removal. Table 2 describes the sample size breakdown of the Salmonella spectral library and validation. Five Salmonella serotypes common to foodborne disease outbreaks, namely S. Enteritidis (SE), S. Heidelberg (SH), S. Infantis (SI), S. Kentucky (SK), and S. Typhimurium (ST), were cultured, in addition to 14 other organisms known to be foodborne pathogens [24].
The HMI for these samples were collected in the same manner as the calibration model. Preprocessing and outlier detection methods were also repeated. New single cell mean spectra were projected onto the Salmonella calibration model’s PC space, and distances towards the class’s model were calculated by Equations (8)–(10), as follows:
x ˜ n e w   ( 1 x p ) =   x ˜ K + ( x n e w   x ˜ K ) V K V K T
e n e w =   x n e w x ˜ n e w
S K =   i = 1 p e n e w , i 2 / ( p r )
where e2new = the new object’s squared residual, and SK = distance towards the class model and is compared to the Scrit value from Equation (7). Bacteria cells are labeled as Salmonella if SK < Scrit. If SK > Scrit, then the bacteria cell is classified as a non-Salmonella cell.

3. Results and Discussion

3.1. Standard Normal Variant and Spectra

The number of outliers detected by the MD method was less than 1% for the calibration dataset and less than 2% for the validation dataset, which was due to the image processing method setting thresholding limits that removed large clumps of cells. While Otsu’s thresholding method did improve the cell cluster separation, overlapping cells still existed. Figure 3 shows an example image of Salmonella Heidelberg taken at 638 nm, with the raw image shown in Figure 3A, and the cell segmentation image shown in Figure 3B. Here, we can see that some cells are touching other cells and some are not.
To increase the number of cells analyzed per image, an improved single cell separation method would need to be implemented. Figure 4 shows the mean spectra for the Salmonella calibration data set (n = 3315). In Figure 4A, it is noticeable that the raw TH spectra show a large variance in intensity values, ranging from around 1500 to 16,000 a.u. at a maximum peak of 638 nm. Applying the row-based SNV preprocessing step placed the spectra on a consistent scale, as shown in Figure 4B.
High collinearity between bacterial species is an issue that should be taken into consideration. Because PCA utilizes an orthogonal transformation of the spectra to calculate the PCs, this aids in negating the influence of collinearity in the classification model. An advantage of SIMCA is that it is sensitive to dissimilarities between objects [22], which is significant given the close spectral relationships between bacteria. Eliminating these false outliers is key in the prediction of Salmonella, as type II errors can result in a pathogenically contaminated food product to be released to the consumer market. Careful consideration of outliers was performed in this application; determining too many bacterial cells to be outliers would result in underfitting the prediction model, thus being counterintuitive to the purpose of this SIMCA application, and potentially resulting in a high number of type II errors.

3.2. SIMCA Calibration Model

As a result of the highly collinear nature of the mean bacterial cell spectra, a large amount of data benefited the robustness of the SIMCA’s prediction capability. It was found that increasing the Salmonella serotype numbers and serotype repetitions began to incorporate sufficient robustness over time, and that the model could predict the Salmonella HMI collected several years later. In Figure 5A, the distribution of the PCA score plots can be seen, and as more data points are added to the calibration model, the distribution across PC1 and PC2 becomes more normally distributed. The plots shown in Figure 5 were indicative of a robust model that could offer unsupervised classification of Salmonella cells. Figure 5B shows the loadings vectors for PCs 1–4. PC1 shows the strongest loading vectors in the red color bands, while PCs 2, 3, and 4 appearing to be strongest in the green color bands, and PC 4 represented the strongest of the blue color bands. The explained variance of PCs 1–4 is detailed in Figure 5C, with 95% of the Salmonella calibration model’s explained variance described in the first four PCs. The error matrix plotting Hotelling’s T2 values against the F-residuals is shown in Figure 5D.
There are over 2500 known serotypes of Salmonella [25]. As new serotypes are added to this calibration model, it would be assumed that some serotypes may skew the spread of these scores in the principal component space, but with enough HMI repetitions, the PCA scores will progress towards filling the multivariate space representative of Salmonella. Bacteria share many physiological traits, especially those of the same Enterobacteriaceae taxonomical family, including common foodborne pathogens such as Salmonella, E. coli, Shigella, Enterobacter, and Klebsiella [26]. These microbes tend to share many common traits such as lipopolysaccharide cell wall structures, porins, and other features that make for a single pixel differentiation between cells virtually impossible under the given conditions. For this reason, a mean spectrum was calculated per cell. For example, the pixelwise classification of E. coli cells resulted in many pixels misclassified as Salmonella pixels because of the common physiological characteristics of the two Enterobacteriaceae species. Single cell mean spectra offer an overview of the cellular characteristics, while maintaining the representation of the inherent biological variability between bacterial species.

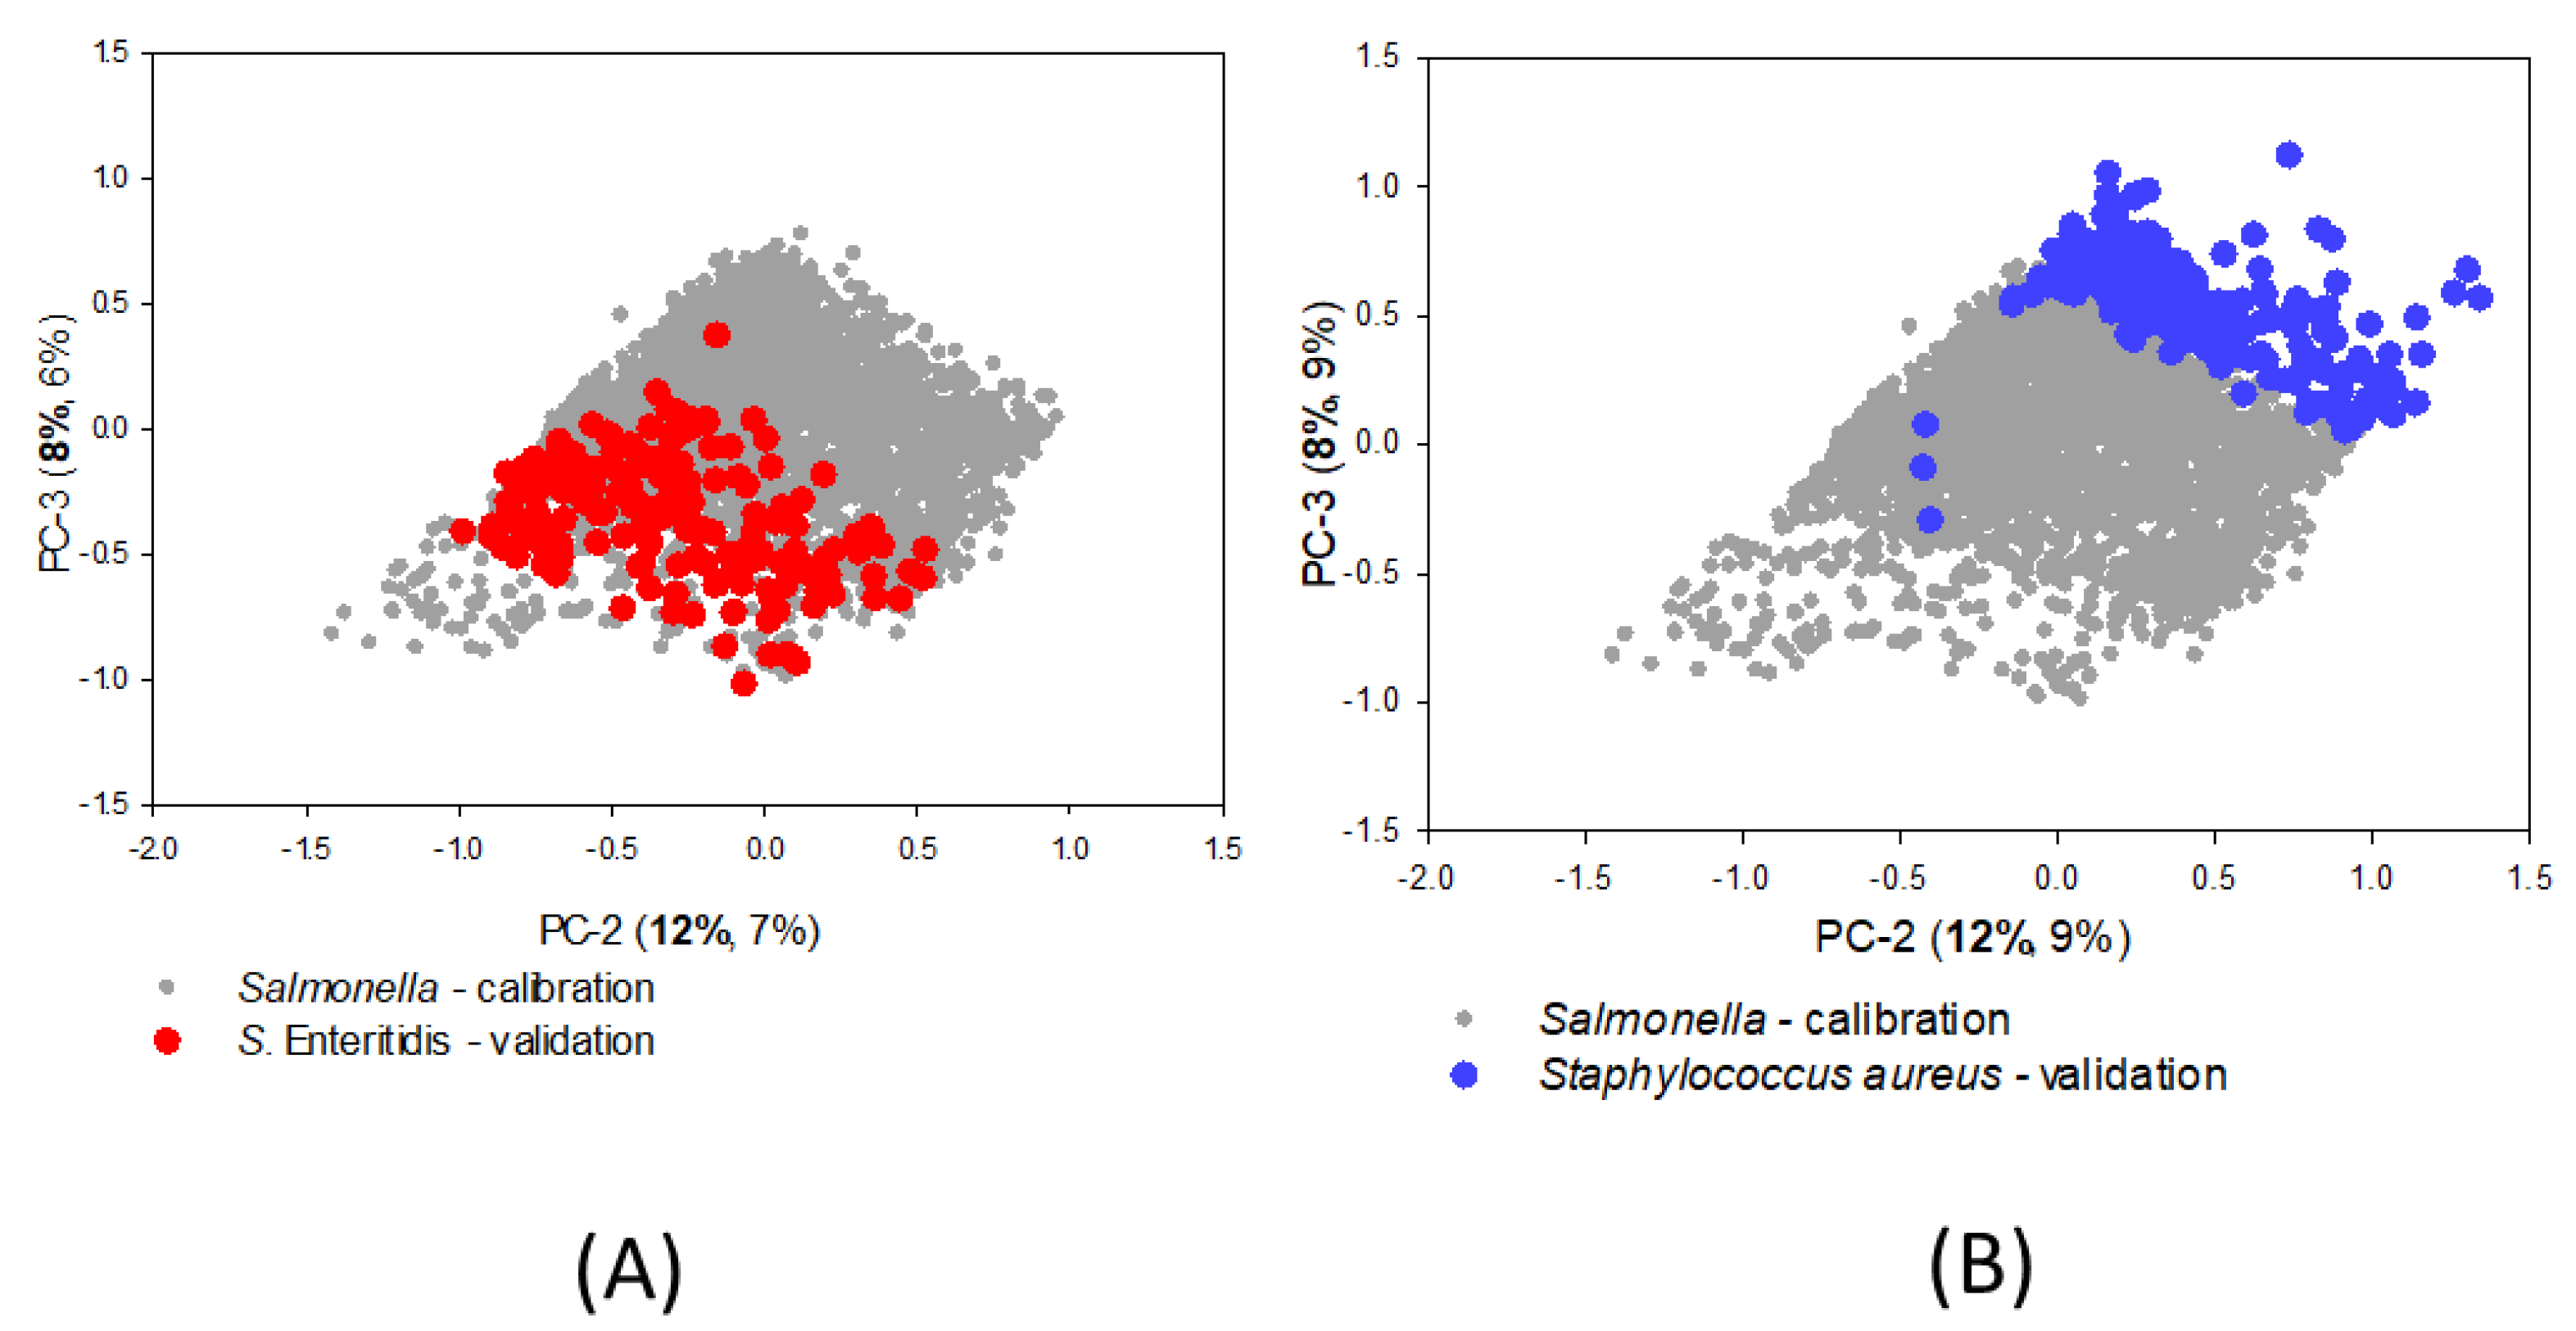
3.3. SIMCA Validation

Validation of the SIMCA model consisted of HMI collected from 19 microorganisms, and resulted in 3222 of 3421 bacterial cells correctly labeled as Salmonella or non-Salmonella and are shown in Table 3.
The SIMCA prediction model had an accuracy of 95.4%, sensitivity of 0.97, and specificity of 0.92. The five Salmonella serotypes used for validation are serotypes that commonly appear in foodborne disease outbreaks, especially SE and ST. Fairly consistent unsupervised prediction accuracies were obtained for all five serotypes, ranging between 94.6% (SH) and 98.0% (SE) accuracy. The PCA projections of the score plots calculated from the validation set are shown overlaying the Salmonella calibration score plot. Figure 6A shows a visual representation of the SE scores projected onto the Salmonella model, with most points projected inside the SIMCA boundaries of the second and third PC, while Figure 6B projects the validation set of Staphylococcus aureus (Sa) scores and the SIMCA calibration boundaries, with most Sa cells projected just outside of the model.
Of the 14 non-Salmonella serotypes from the validation dataset, there was a larger range of prediction accuracy, varying from 63.6 to 100%. Pseudomonas putida (Ppu) showed the lowest accuracy, with 63.6% classified as non-Salmonella bacteria, while 36.4% were misclassified as Salmonella cells. Of the three Ppu HMI repetitions, one HMI had a significantly higher misclassification rate at 49%. The single cell mean spectra of this HMI were not marked as outliers and were removed from the dataset; this could suggest that the MD outlier detection threshold should be lowered. Salmonella and E. coli (Ec) are both similar in composition and taxonomy, which is why a larger number of Ec (767 cells) were selected to validate the Salmonella SIMCA prediction model. Previously, Eady and Park [18] showed that the spectral patterns of Salmonella and Ec were more similar than comparing Salmonella to Sa or Li, with Salmonella and Sa being the most dissimilar.
The prediction model resulted in a lower type II error rate, of 0.030, than a type I error rate, of 0.076. This was preferable in regard to a single class model for food safety application, reducing the potential of a false negative sample being made available to consumers. Standard microbial analysis methods for food items such as PCR or the use of nutrient enriched growth media are well established, but come with disadvantages. These results suggest that it is possible to establish a reference library for a bacterial species of interest and to build a SIMCA calibration model that is robust enough for species level detection as a presumptive screening tool, effectively reducing the amount of time and reoccurring cost associated with traditional detection methods. Microorganisms of interest to the food industry, such as Listeria, Campylobacter, or Staphylococcus aureus, could have HMI reference libraries established and validated. Here, the Salmonella model can be tuned over time to incorporate the addition of more serotypes and wild type bacteria isolated from field trials, and it could eventually be tested in industry settings for the early and rapid presumptive screening of pathogenic microorganisms.

4. Conclusions

Previous HMI experiments address base studies in the system’s design and approach to pathogenic bacteria detection. In order to build an unsupervised HMI classification model for bacterial species with the sensitivity potential of single cell detection, it was essential to include HMI collected from a range of timeframes and repetitions for adequate model boundary definition. Here, 13 Salmonella serotypes commonly associated with poultry were used to build the calibration model. The SIMCA prediction for Salmonella can be used as a presumptive screening method for early and rapid bacterial detection with a minimal reoccurring sample cost versus detection methodologies requiring expensive reagent kits, dyes, or markers. Here, a Salmonella prediction accuracy of 95.4% was achieved, along with a specificity of 97%. Industry standards for Salmonella detection are approximately 97–98% with qualitative PCR or plating methods. The SIMCA prediction model can be tuned with potential outlier identification or preprocessing methods to increase the selectivity of the model. Future work can add additional Salmonella serotypes to SIMCA’s calibration model, tuning the soft boundaries of the unsupervised classification approach for a slight prediction selectivity increase. The results shown here indicate that it is possible to build qualitative single class prediction models for bacteria at a species level, as a tool for high-throughput foodborne pathogen detection.

Author Contributions

Conceptualization, M.E. and B.P.; methodology, M.E. and B.P.; software, M.E.; validation, M.E.; formal analysis, M.E.; investigation, M.E. and B.P.; resources, B.P.; data curation, M.E.; writing—original draft preparation, M.E.; writing—review and editing, M.E. and B.P.; visualization, M.E. and B.P.; supervision, B.P.; project administration, B.P.; funding acquisitions, B.P. All authors have read and agreed to the published version of the manuscript.

Funding

This research received no external funding.

Institutional Review Board Statement

Not applicable.

Informed Consent Statement

Not applicable.

Data Availability Statement

Data is contained within the article.

Acknowledgments

The authors would like to thank Nasreen Bano of the Quality and Safety Assessment Research Unit at the U.S. National Poultry Research Center for her efforts in maintaining the bacterial cultures, and for her role in developing the HMI data collection method.

Conflicts of Interest

The authors declare no conflict of interest.

References

  1. World Health Organization. Salmonella (Non-Typhoidal). 20 February 2018. Available online: https://www.who.int/news-room/fact-sheets/detail/salmonella-(non-typhoidal) (accessed on 13 August 2019).
  2. Wang, W.; Peng, Y.; Huang, H.; Wu, J. Application of hyper-spectral imaging technique for the detection of total viable bacteria count in pork. Sens. Lett. 2011, 9, 1024–1030. [Google Scholar] [CrossRef]
  3. Feng, Y.Z.; Sun, D.W. Determination of total viable count (TVC) in chicken breast fillets by near-infrared hyperspectral imaging and spectroscopic transformations. Talanta 2013, 105, 244–249. [Google Scholar] [CrossRef] [PubMed]
  4. Wu, D.; Sun, D.W. Potential of time series-hyperspectral imaging (TS-HIS) for non-invasive determination of microbial spoilage of salmon flesh. Talanta 2013, 15, 39–46. [Google Scholar] [CrossRef] [PubMed]
  5. Yoon, S.C.; Windham, W.R.; Ladley, S.R.; Heitschmidt, J.W.; Lawrence, K.C.; Park, B.; Narang, N.; Cray, W.C. Hyperspectral imaging for differentiating colonies of non-O157 Shiga-toxin producing Escherichia coli (STEC) serogroups on spread plates of pure cultures. J. Near Infrared Spectrosc. 2013, 21, 81–95. [Google Scholar] [CrossRef]
  6. Tang, Y.; Kim, H.; Singh, A.K.; Aroonnual, A.; Bae, E.; Rajwa, B.; Fratamico, P.M.; Bhunia, A. Light scattering sensor for direct identification of colonies of Escherichia coli serogroups O26, O45, O103, O111, O121, O145, and O157. PLoS ONE 2014, 9, e105272. [Google Scholar] [CrossRef] [PubMed]
  7. Foca, G.; Ferrari, C.; Ulrici, A.; Sciutto, G.; Prati, S.; Morandi, S.; Brasca, M.; Lavermicocca, P.; Lanteri, S.; Oliveri, P. The potential of spectral and hyperspectral-imaging techniques for bacteria detection in food: A case study on lactic acid bacteria. Talanta 2016, 153, 111–119. [Google Scholar] [CrossRef]
  8. Anderson, J.; Reynolds, C.; Ringelberg, D.; Edwards, J.; Foley, K. Differentiation of live-viable versus dead bacterial endospores by calibrated hyperspectral reflectance microscopy. J. Microsc. 2008, 232, 130–136. [Google Scholar] [CrossRef] [PubMed]
  9. Eady, M.; Park, B.; Choi, S. Rapid and early detection of Salmonella serotypes with hyperspectral microscopy and multivariate data analysis. J. Food Prot. 2015, 78, 668–674. [Google Scholar] [CrossRef] [PubMed]
  10. Esbensen, K.; Swarbrick, B. Multivariate Data Analysis, 6th ed.; Camo: Oslo, Norway, 2018. [Google Scholar]
  11. Karunathilaka, E.R.; Yakes, B.J.; He, K.; Chung, J.K.; Mossoba, M. Non-targeted NIR spectroscopy and SIMCA classification for commercial milk powder authentication: A study using eleven potential adulterants. Heliyon 2018, 4, e00806. [Google Scholar] [CrossRef] [PubMed] [Green Version]
  12. Zimbro, M.; Power, D. DIFCO and BBL Manual for Microbiological Culture Media, 2nd ed.; Dickinson and Co.: Sparks, MD, USA, 2009. [Google Scholar]
  13. Park, B.; Yoon, S.C.; Lee, S.; Sundahram, J.; Windham, W.R.; Hinton, A., Jr.; Lawrence, K.C. Acousto-optical tunable filter hyperspectral microscope imaging method for characterizing spectra from foodborne pathogens. Trans. ASABE 2012, 55, 1997–2006. [Google Scholar] [CrossRef]
  14. Schindelin, J.; Arganda-Carreras, I.; Frise, E.; Kaynig, V.; Longair, M.; Pietzsch, T.; Preibisch, S.; Rueden, S.; Saalfeld, C.; Schmid, S.; et al. Fiji: An open-source platform for biological-image analysis. Nat. Meth. 2012, 9, 676–682. [Google Scholar] [CrossRef] [PubMed] [Green Version]
  15. Haidekker, M. Advanced Biomedical Image Analysis; John Riley and Sons Inc.: Hoboken, NJ, USA, 2011. [Google Scholar]
  16. Balaji, J. Time Series Analyzer Version 3.0. 28 May 2014. Available online: https://imagej.nih.gov/ij/plugins/time-series.html (accessed on 20 October 2018).
  17. Burger, J.; Geladi, P. Spectral pretreatments of hyperspectral near infrared images: Analysis of diffuse reflectance spectroscopy. J. Near Infrared Spectrosc. 2007, 15, 29–37. [Google Scholar] [CrossRef]
  18. Eady, M.; Park, B. Unsupervised classification of individual foodborne bacteria from a mixture of bacterial cultures with a hyperspectral microscope image. J. Spectr. Imaging 2018, 7, a6. [Google Scholar] [CrossRef] [Green Version]
  19. Mertens, B.; Thompson, M. Principal component outlier detection and SIMCA: A synthesis. Analyst 1994, 119, 2777–2784. [Google Scholar] [CrossRef]
  20. Vanden Branden, K.; Hubert, M. Robust classification in high dimension based on the SIMCA method. Chemom. Intell. Lab. Syst. 2005, 79, 10–21. [Google Scholar] [CrossRef] [Green Version]
  21. Wold, S.; Sjostrom, M. SIMCA: A method for analyzing chemical data in terms of similarity and analogy. Chemom. Theory Appl. 1977, 52, 243–282. [Google Scholar]
  22. Candolfi, A.; De Maesschalck, R.; Massart, D.L.; Hailey, P.A.; Harrington, A.C.E. Identification of pharmaceutical excipients using NIR spectroscopy and SIMCA. J. Pharm. Biomed. Anal. 1999, 19, 923–935. [Google Scholar] [CrossRef]
  23. De Maesschalk, R.; Candolfi, A.; Massart, D.L.; Heuerding, S. Decision criteria for soft independent modelling of class analogy applied to near infrared data. Chemom. Intell. Lab. Syst. 1999, 47, 65–77. [Google Scholar] [CrossRef]
  24. Centers for Disease Control and Prevention. Salmonella Outbreaks. 1 October 2020. Available online: https://www.cdc.gov/salmonella/outbreaks.html (accessed on 27 December 2020).
  25. Borges, K.A.; Furian, T.Q.; de Souza, S.N.; Menezes, R.; Alves de Lima, D.; Bornancini Borges Fotes, F.; Tadeu Pippi Salle, C.; Luiz Souza Moraes, H.; Pinheiro Nascimento, V. Biofilm formation by Salmonella Enteritidis and Salmonella Typhimurium isolated from avian sources is partially related with their in vivo pathogenicity. Microb. Pathog. 2018, 118, 238–241. [Google Scholar] [CrossRef] [PubMed]
  26. Van Vuuren, H.J.J.; Kersters, K.; De Ley, J.; Toerien, D.F. The identification of Enterobacteriaceae from breweries: Combined use and comparison of API 20E system, gel electrophoresis of proteins and gas chromatography of volatile metabolites. J. Appl. Bacteriol. 1981, 51, 51–65. [Google Scholar] [CrossRef]
Figure 1. Flowchart of steps used to record Fiji macro for processing hyperspectral microscope images of bacteria.
Applsci 11 00895 g001
Figure 2. Representation of data collection of hyperspectral microscope images of bacterial cells between 450 and 800 nm.
Applsci 11 00895 g002
Figure 3. Hyperspectral microscope image of Salmonella Heidelberg at 638 nm: (A) Raw image and (B) cell segmentation image with extracted pixels shown in white.
Applsci 11 00895 g003
Figure 4. Raw (A) and preprocessed (B) Salmonella spectral profiles for the calibration dataset.
Applsci 11 00895 g004
Figure 5. Soft-independent modelling of class analogy (SIMCA) calibration diagnostics: (A) PC scores 1 and 2, (B) loadings for PCs 1–4, (C) principal component analysis residuals, and (D) scree plot of explained variance (%).
Applsci 11 00895 g005
Figure 6. Principal component analysis projections for the validation data of (A) S. Enteritidis and (B) Staphylococcus aureus onto the soft-independent calibration model for unsupervised Salmonella prediction.
Applsci 11 00895 g006
Table 1. List of microorganisms used in this experiment and their abbreviations.
MicroorganismMicroorganism
Campylobacter coli (Cc)Salmonella Enteritidis (SE)
Campylobacter fetus (Cf)Salmonella Heidelberg (SH)
Campylobacter jejuni (Cj)Salmonella Infantis (SI)
Enterobacter cloacae (Ecl)Salmonella Javiana (SJ)
Enterococcus faecalis (Ef)Salmonella Kentucky (SKe)
Escherichia coli (Eco)Salmonella Kiambu (SKi)
Klebsiella oxytoca (Ko)Salmonella Mbandanka (SMb)
Listeria innocua (Li)Salmonella Montevideo (SMo)
Listeria monocytogenes (Lm)Salmonella Muenchen (SMu)
Macrococcus caseolyticus (Mc)Salmonella Seftenberg (SSe)
Paenibacillus polymyxa (Ppo)Salmonella Typhimurium (ST)
Pseudomonas putida (Ppu)Salmonella Typhimurium–NAL (STN)
Staphylococcus aureus (Sa)Salmonella Weltevreden (SW)
Staphylococcus simulans (Ss)
Table 2. List of spectral library files used in building and validating the soft independent modeling of class analogy (SIMCA) from hyperspectral microscope images of bacterial cells.
CalibrationValidation
MicroorganismRepsCellsMicroorganismRepsCells
Salmonella Enteritidis4346Campylobacter coli227
Salmonella Heidelberg4388Campylobacter fetus226
Salmonella Infantis3282Campylobacter jejuni265
Salmonella Javiana2231Enterobacter cloacae1142
Salmonella Kentucky3313Enterococcus faecalis3157
Salmonella Kiambu2279Escherichia coli8767
Salmonella Mbandanka2274Klebsiella oxytoca382
Salmonella Montevideo2156Listeria innocua379
Salmonella Muenchen2259Listeria monocytogenes2116
Salmonella Seftenberg3165Macrococcus caseolyticus324
Salmonella Typhimurium3345Paenibacillus polymyxa266
Salmonella Typhimurium-NAL3140Pseudomonas putida3151
Salmonella Weltevreden2137Staphylococcus aureus2212
Staphylococcus simulans2190
Salmonella Enteritdis8350
Salmonella Heidelberg6149
Salmonella Infantis5284
Salmonella Kentucky3239
Salmonella Typhimurium8295
Total353315Total683421
Table 3. SIMCA results for a one-class Salmonella prediction model obtained from hyperspectral microscope images of bacteria.
Salmonella
MicroorganismCellsYesNoAccuracy (%)
Campylobacter coli2762177.8
Campylobacter fetus2632388.5
Campylobacter jejuni6595686.2
Enterobacter cloacae142413897.2
Enterococcus faecalis157115699.4
Escherichia coli767975898.8
Klebsiella oxytoca8218198.8
Listeria innocua7997088.6
Listeria monocytogenes116111599.1
Macrococcus caseolyticus24024100
Paenibacillus polymyxa6666090.9
Pseudomonas putida151559663.6
Staphylococcus aureus2121020295.3
Staphylococcus simulans190518597.4
Salmonella Enteritdis350343798.0
Salmonella Heidelberg149141894.6
Salmonella Infantis284277797.5
Salmonella Kentucky239233697.5
Salmonella Typhimurium2952831295.9
Total34211277198595.4
Publisher’s Note: MDPI stays neutral with regard to jurisdictional claims in published maps and institutional affiliations.

