1. Introduction
The sustainable development of the European Union (EU) is strongly influenced by transport, which is polluting from an environmental point of view. Transport infrastructure accessibility criteria and accessibility distance have a positive effect on sustainable development [
1]. In order to mitigate transport sector greenhouse gas emissions, it is necessary to assess the efficiency of transport policy [
2]. One of the most effective ways of improving the sustainability of the transport sector is the choice to use a less-polluting mode of transport. Passenger satisfaction is an important factor in choosing a mode of transport to travel in municipalities and especially in big cities [
3].
Mobility is crucial for the development of a country’s internal market and for maintaining the desired life quality of citizens, as it is important for people to exercise their freedom to travel. This means more frequent travel by bus, rail, and air [
4]. Viable options can only be available through better integration of modal networks, which means that airports, railway stations, and metro and bus stations should be increasingly interconnected and transformed into multimodal passenger transport platforms [
4].
There will be more possibilities for passengers to choose a particular mode of transport when various systems of transportation become more closely integrated. Experience has shown that passengers usually choose the mode of transport that best suits their personal needs, habits and understanding of the expected quality of traveling. The mode of transport that is the most acceptable to a passenger can be determined by developing a system of criteria and calculating their weights using multi-criteria decision-making (MCDM) methods [
5,
6,
7,
8,
9]. Passenger loyalty development increases the profits of airline, rail, and road transport companies. This is undoubtedly important for the success of the enterprise [
10].
Traveling allows us to learn more about the world. However, it brings about some inconveniences and discomfort. People who travel by bus for long distances spend much time on a bus and become tired.
For many people, it causes stress, unless they are inveterate travelers. Therefore, when planning a trip, people should learn more about particular transport modes, trip duration, possibilities for rest, and the cost of the trip. Various transport modes (by bus, train or airplane) have advantages and disadvantages [
11]. It is important to inform urban public transport passengers on the estimated time of arrival, as that influences the outlook for traveling by bus [
12]. Train traffic has increased over the last decade and is likely to continue to do so, as more passengers and freight are transported by train rather than by car. This will reduce energy consumption and pollutant emissions [
13].
Travel by train is still popular worldwide. The railways, rolling stock, and services provided to passengers as well as safety are being constantly improved, while the environmental pollution is being reduced. This helps rail transport to compete with other modes of transport. Matuška [
14] examined the accessibility of rail transport by providing ways to assess the accessibility of railway infrastructure and trains. He applied a two-step model to assess the availability of departure halls. Train services are barrier-free for passengers, especially those traveling long distances, but they are still less accessible to disabled passengers in the suburbs and outer regions.
2. Literature Review
A U.S. interregional travel study focused on regional long-distance (100 to 500 miles) passenger transportation. Consideration was put on travel by car, plane, motor bus, and train. Attention was paid to high-speed and conventional passenger trains [
15]. In the freight and passenger transport sector in the Slovak Republic, competition in the rail transport market differs. The total number of passenger-kilometers has increased by 12 percent due to an increase in free tickets for students and retired people [
16].
Studies aimed at evaluating technical parameters of roads and rolling stocks and improving their interaction and safety of travel as well as risk factors and accidents have been performed. Rail transport must ensure a high level of reliability and safety of travel. Since the wheel is one of the main subsystems of the railway vehicle, it can make a significant contribution to the reliability and safety of the train. One of the main measures to meet the requirements is to implement proper maintenance procedures. The quality of railway tracks has an impact on train safety and passenger comfort. In practice, the quality of railway tracks is measured by a track recording vehicle, which measures seven key geometrical parameters of tracks. Traditionally, track gauge, vertical and lateral alignments, and cross-level (angular variation in the track section, i.e., cant or superelevation) are measured [
17]. Xin et al. [
18] presented a model for predicting railway track damage. Railway violations have been proved to be the most important determinants of train safety and passenger travel comfort [
19]. Unauthorized changes in railway track geometry can have a negative impact on train traffic safety [
20].
Compared to other modes of transport, rail travel is safe. Afazov et al. [
21] provided a more detailed understanding of modern modeling techniques that can be used in the design of railway vehicles. Lin et al. [
22] presented a probabilistic risk assessment methodology for analyzing adjacent-track accident risk. Research in [
23] was conducted to establish the safety of glazing systems for passenger railway equipment. Kovandová and Válka [
24] investigated traffic safety as a major social problem related to accidents on railways and at track crossings.
Some studies have been performed regarding the possibilities of increasing the power and frequency of rail vehicles. Xu et al. [
25] presented strategies to increase train frequency and rail capacity that would be helpful to metro dispatchers.
The model presented by Sun and Schönefeld [
26] made it possible to identify gaps in the capacity of the train network and to assess the impact of schedule adjustments on passenger route choice. Xiang and Zhu [
27] proposed multifunctional optimization to improve the economic performance of heavy rail.
Increasing the volume of passenger transportation by rail and its effectiveness in terms of expenses is a priority task. Determining the market shares and new offers for passenger service requires the study of the specific regional features of demand and the relevant state of transport services provided by different types of passenger transportation companies. Makarova and Muktepavel [
28] presented a system of calculation and analytical indicators for analyzing regional passenger traffic. It allows specialists in this area to investigate passenger flow tendencies, determining the demand and cost of transport services as well as their dispersion across the region and to perform a comparative analysis of internal passenger traffic and the total amount of passenger traffic in the network. In practice this analytical information can be used to determine the optimal passenger train length, to assess the profitability of introducing local trains into operation, to define the optimal number of stops, and to calculate the amount of passenger cars needed to satisfy the demand. The route in the model that was offered by Tang et al. [
29] is divided into sections that can be independently updated, and the target function is expressed in terms of minimizing driving time. This model can help to quickly and efficiently develop a strategic plan to reduce running time in passenger rail corridors.
Liao and Liu [
30] used microscopic simulation models to investigate passenger behavior in the non-payment area.
Allen and Levinson [
31] studied passenger train schedules and their average speed on North American railways in the period between 1965 and 2015. These train traffic parameters were used because their values were easy to obtain.
Passenger transportation systems are being upgraded and expanded around the world. Experimental studies have been carried out to improve the quality and efficiency of high-speed train services. Lee et al. [
32] investigated the aerodynamic properties of a high-speed train pantograph and made suggestions for their improvement. Ou et al. [
33] investigated the reasons for the development of a comprehensive railway system in China and its impact on the development of intercity passenger railways. Teixeira and Prodan [
34] reviewed railway taxation systems and their development in 2007–2012. They assessed the importance of taxation for the single European railway market.
Oh et al. [
35] conducted an analysis of covariance and analysis of regression and identified the effect of wagon door width on passenger boarding time on Korean city railways. Holloway et al. [
36] presented the results obtained from an experiment in determining the time required for passengers to board or deboard a train. They found out that steps had little or no effect on the time to board a train for younger luggage-carrying people, while senior passengers, on the contrary, needed more time.
Multi-criteria decision making (MCDM) methods are used to solve problems related to the use of different modes of transport [
37,
38,
39,
40,
41,
42,
43,
44,
45]. Chen et al. [
46] investigated the process of rail passenger transfer at large terminals by comparing different alternatives. Stoilova [
47] presented a combination of multi-criteria models for rating railway passenger transport development.
The MCDM methods used for modeling and evaluating the quality of passenger transportation on an international route allow researchers to identify the opinions of passengers, staff and the administration of the train about the weights (significances) of various criteria describing this complicated process [
48,
49]. Improving various aspects of this process can help rail transport to compete with other modes of transport more effectively. Based on an investigation of existing market research practices, three main approaches were identified for a comparative analysis of the influence of different parameters of transport services on passenger satisfaction in order to define priority directions for implementation of administrative decisions concerning service quality. They included the method of obtaining priorities from passengers, as well as calculations based on mechanisms of correlation and regression analysis using the method of smallest squares and calculations based on the application of various nonparametric methods of statistics. Methodical and practical approaches based on modeling and intended for identifying promising areas for improving the quality of public services have also been presented [
50]. The comparison and visualization of the results of assessing the impact of different transport service parameters on the overall quality of service by the methods of ordinal logistic regression were also presented. Customer perceptions of the quality of service provided by the operator and the level satisfaction are key parameters to monitor performance. Kesten and Öğüt [
51] provided a practical way to monitor the functioning of the public transport system as a result of passenger evaluation. The passenger-oriented efficiency index was developed, and it employed 22 indicators and 6 different tools. Time, cost, ease of transfer, security and quality of service were assessed.
The aim of this study is to provide a set of criteria and show the advantages of rail transport compared to road transport (buses). By using MCDM methods, we determined the mean ranks, global, and overall weights of these criteria, employed a reverse hierarchy model and correlation of values. Finally, we calculated indicators showing the consistency of passenger views.
3. The Methods of the Average Rank Transformation into Weight (ARTIW-L and ARTIW-N)
The weights of the evaluation criteria (sub-criteria or key criteria) largely determine the evaluation result. In practice, the subjective weights assigned by experts or respondents to the considered criteria are commonly used. These weights present the judgments of highly qualified experts with long-term practical experience and theoretical knowledge in the considered field [
52,
53]. Passengers themselves make decisions about the mode of transport they choose for travel and, therefore, are experts themselves. However, because of their low competence, they should be referred to as respondents answering the survey questions rather than experts.
Most of the widely known and used methods for evaluating the weights of multiple criteria (factors) are based on experts’ judgments. These methods embrace a thorough problem analysis by experts, the organization of this process as well as quantitative evaluation of decisions, and the arrangement of the obtained results. Therefore, the problem of practical determination of the accurate weights of the considered criteria arises. The subjective weights of the evaluation criteria can also be found from the ranks assigned to these criteria by experts. The estimates (judgments) of various experts differ considerably, often being inconsistent, which implies that the obtained weights (significances) of the criteria as well as their order of preference may be different.
The result of the experts’ evaluation largely depends on their qualifications and experience in assessing the objectives, as well as their responsibility for providing the appropriate estimates of criterion significance and readiness to take part in the experimental study. The judgments of specialists and respondents about the relative significance of the criteria and their arrangement by order of priority (preference) often differ; therefore, the ranks and weights expressed in terms of the average values of the experts’ estimates can be used in multi-criteria evaluation only if the consistency of the estimates has been proved. The consistency of the estimates given by a group of experts in terms of ranks is based on the idea of compactness.
In the case of expert evaluation, the average estimate obtained from a group of experts (respondents) is the problem solution (a result of decision-making) only when the judgments of all the experts are consistent. If a decision should be made based on the average estimate of the experts or respondents, the level of consistency of the experts’ estimates is described by the concordance coefficient W. To determine the concordance coefficient W, the ranks of the evaluation criteria assigned by the experts or respondents are required. If their estimates are given in other units (for example, in points), they should be ranked.
The consistency of the weights of the criteria describing an object and the estimates provided by experts are usually determined by using the analytic hierarchy process (AHP) approach [
54,
55,
56]. The consistency of group evaluation results is determined by using the method of rank correlation [
57,
58].
The AHP approach is rather complicated [
59,
60] because not all of the experts can properly fill in the questionnaire (i.e., a pairwise comparison matrix), which would allow them to calculate the weights of the criteria and the consistency ratio (C.R.). The AHP method also allows for determining the consistency ratio of each expert’s estimates, which should be smaller than C.R. ≤ 0.1. Moreover, the AHP approach is used for calculating each criterion’s eigenvector, i.e., the procedure of normalizing the geometric mean of the rows. The maximal eigenvalue (
λmax), the consistency index (C.I.) and the consistency ratio (C.R.) should also be calculated [
41,
53,
55,
61,
62].
Experts usually assign the ranks Rij to the criteria by arranging them according to their significance and giving them the appropriate numbers. This method of determining the criteria weights is logical; however, its accuracy is low. Therefore, it can be used only at the initial stage of analysis. Using more accurate and complicated methods still requires preliminary ranking of the criteria.
The weights ωj of the ranked indicators (criteria) can be determined by applying different methods (algorithms) that do not have theoretical advantages over one another. However, the general principle of all algorithms is the same: the most important criterion is assigned the highest weight. The values of the weights ωj must correspond to the criteria ranks (lower rank–higher weight). The sum of the weights ωj of all the criteria describing the research object must be equal to one, i.e., weights must be normalized.
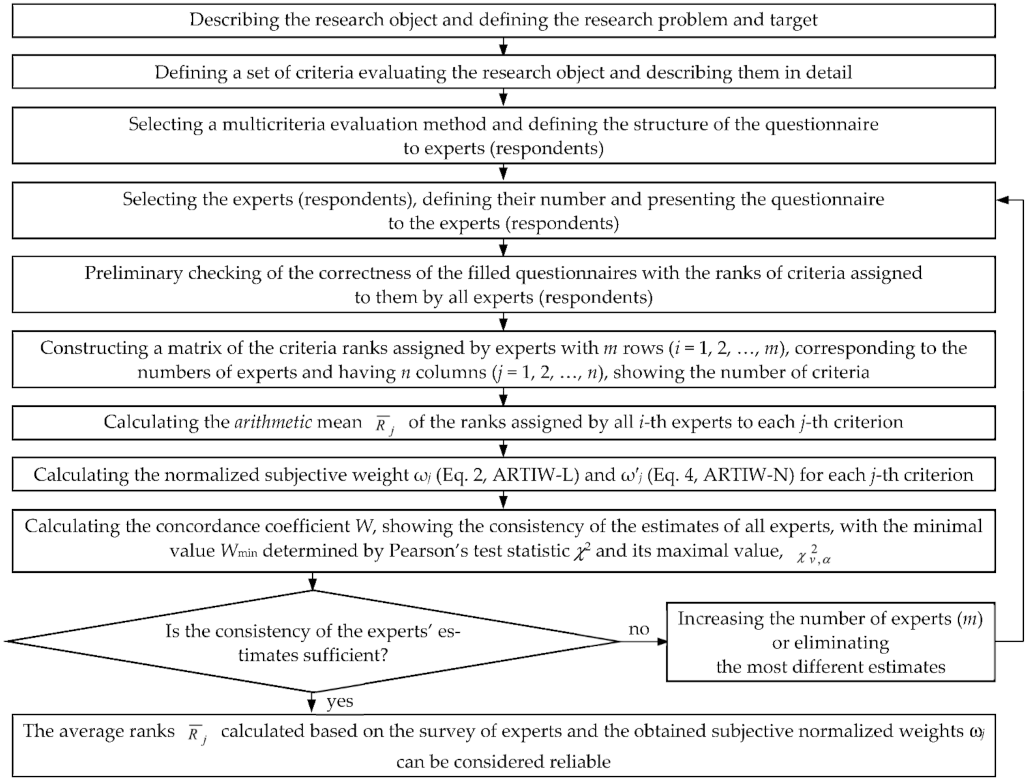
It is convenient to transform the ranks assigned to the criteria by a group of experts into weights by using the new ARTIW-L and ARTIW-N methods, whose sequence of operations and calculations is given below (see
Figure 1).The average rank
, representing the ranks assigned by all
i-th experts (
i = 1, 2, …,
m) is calculated for each
j-th criterion (
j = 1, 2, …,
n) by the formula:
The more important the criterion, the smaller its average rank . In practice, it is more convenient to use the estimates of the criteria significance, whose numerical values show higher importance. For this purpose, the normalized weights of criteria j, expressing relative importance, are used.
Significances (weights) of the evaluation criteria of an object can be determined in the process of their normalization (setting their sum equal to one) by transforming the average ranks into weights (the ARTIW method). This method was first proposed in 2011 [
63]; however, at that time it was not called ARTIW. A relative weight
ωj of the criterion is calculated as follows:
where
n is the number of criteria describing the quality of the considered object,
is the average
j-th criterion rank calculated by Equation (1).
The normalized weights ωj of the j-th criteria calculated according to formula (2) have a linear inverse correlation (functional) relationship with the rank averages (average ranks) of these criteria calculated according to Formula (1). Therefore, this method is called the average rank transformation into weight-linear (ARTIW-L).
The normalized weights ω′j of the criteria can be calculated by using another method of transforming rank averages into weights. The criterion weights calculated according to Formulas (3) and (4) are related to criteria rank averages by a non-linear inverse correlation (functional) dependence. Therefore, this method is called the average rank transformation into weight-non-linear (ARTIW-N).
Using the ARTIW-N method, the ratio of the min
of the most important criterion (with the lowest average ranks
) to the average of the ranks
of all other
j-th criteria is initially calculated:
After normalizing the values
uj for each criterion, their subjective significances
ω′
j are calculated:
Neither of these two methods (ARTIW-L and ARTIW-N) can be considered more accurate than the other, and neither of them can be looked at as the reference method. The average of the weights
calculated for each criterion by these two methods can be considered as the result of the task calculation:
The consistency of expert group estimates is determined by the concordance coefficient W.
The concordance coefficient
W in the absence of tied ranks is expressed in terms of the relationship between the obtained sum
S and the respective largest sum
Smax [
58]:
When the estimates provided by the experts or respondents are in agreement, the Kendall coefficient of concordance, W, is about one. When the estimates differ considerably, the value of W is close to zero.
The deviations of the ranks
Rij of each criterion from the sum of squares of the average rank can be calculated as follows:
where
n is the number of criteria (
j = 1, 2, ...,
n),
m is the number of experts (respondents) (
i = 1, 2, ...,
m).
The random value for S was calculated by Equation (7), adding the squared values of all the criteria given in parentheses.
The concordance coefficient may be used in practice when its ultimate value, showing when expert estimates can be considered consistent, has been found. Kendall [
57] has shown that if the number of criteria is
n > 7, the significance of the concordance coefficient
W can be determined using Pearson’s chi-squared test statistic
χ2. The random value
is distributed according to
χ2 distribution, with the degree of freedom
ν = n − 1.
When the number of the compared criteria
n ranges from 3 to 7, the distribution
χ2 cannot be used in all cases because sometimes the critical value of
may be larger than the calculated value (even though the consistency of the estimates is still sufficiently high). In this case, the probability tables of the concordance coefficient or the tables of critical values
S (with 3 ≤
n ≤ 7) can be used [
64].
The smallest value of the concordance coefficient
Wmin allowing the authors to consider that the estimates of
m experts of the quality of the research object based on
n criteria, with the assigned (required) significance level
α and degree of freedom
ν = n − 1, are consistent, can be calculated as follows [
63]:
where
is the critical Pearson’s statistic found in the table [
65], assuming the degree of freedom
ν = n − 1 and the significance level
α.
The quality of the research object is evaluated by the additive mathematical model used for calculating its comprehensive quality index, which allows for describing the quality of the object by a single number. It also allows for comparing it with the quality of other similar objects, and the coefficients of the normalized criteria weights (rather than the average criteria ranks , which cannot show how one criterion is more important that another) are used.
The weights of the criteria describing the research object (the selection of rail transport rather than road transport by passengers) can be calculated by using a very popular but complicated approach referred to as the analytic hierarchy process (AHP) offered by T. L. Saaty [
54,
55,
56,
66]. Passengers are not highly qualified experts and, therefore, can hardly fill in a pairwise comparison matrix properly, particularly if the number of the criteria compared is large. This number may be more than nine (e.g., fifteen) criteria. In the study [
67], passengers completed pairwise comparison matrices with 32 criteria, 22 of which were rejected because their C.R. (consistency ratio) was greater than 0.1. Only 10 matrices were applicable for the study on the quality of passenger transport by train. Therefore, it is not rational to apply the AHP method in passenger interviews. Not every passenger can complete the pairwise comparison matrix properly. The AHP method can only be applied to interview highly qualified experts.
The objective weights of the criteria and sub-criteria can be calculated by using the entropy method [
61,
68] as well as the new IDOCRIW method [
52], which combines (integrates) the entropy and the criterion impact loss (CILOS) methods.
4. The Structure of the Hierarchy Model, the Questionnaire, and the Respondents
The famous American writer Mark Twain wrote that “Travel is fatal to prejudice, bigotry, and narrow-mindedness”. On the other hand, people become tired when traveling and, therefore, the choice of an appropriate mode of transport is very important. Now, there is a wide choice of modes of travel, which include pedestrian traveling, cycling and traveling by automobile, by bus as well as by rail, air or water transport. A passenger decides which mode of transport is most safe and comfortable for travel. The criteria determining the choice of a particular mode of transport can be identified when a set of the evaluation criteria is defined and a certain number of passengers are surveyed. The passengers, who chose a particular mode of transport (e.g., rail transport) as an alternative to another mode of transport, assign the ranks to the considered criteria. All the criteria describing a particular mode of transport have some advantages over the criteria describing another means of transport.
The significance of hierarchically unstructured criteria or sub-criteria is identified using a two-level model (
Figure 2a). In a three-level hierarchy model, which is used in multiple criteria decision-making, the goal of the study is given first, then the criteria are presented, and, finally, sub-criteria are provided [
69,
70,
71,
72,
73,
74,
75] (see
Figure 2b). In this work, the inverse (not classical) hierarchy model (see
Figure 2c) was used for determining the ranks of the criteria and their weights. Level 1 of the model presents the goal, Level 2 the factors and sub-criteria, and Level 3 provides a group of factors and criteria. First, the average ranks and global weights of particular sub-criteria were calculated without their division into groups (
Figure 2a). Then, they were grouped into three groups, and the reduced weights of the criteria groups were calculated, considering the fact that each group had a different number of criteria (
Figure 2c).
The study was based on a survey of passengers traveling from Vilnius (Lithuania) to Moscow (Russia) and back to Vilnius. There is a regular rail and road service between the capital of Lithuania, one of the Baltic states (and a member-state of the EU) and the capital of Russia (Moscow). Therefore, passengers can choose between the two modes of transport in covering a distance of 944 km between these cities.
A set of criteria (sub-criteria) was defined to determine their influence on passengers’ choice to travel by train rather than by bus. For this purpose, passengers had to rank the considered criteria according to their importance for their choice of this mode of transport. The following sub-criteria were included in the questionnaire presented to the passengers (
Figure 2a):
- A.
A trip by train is safer than a trip by bus (according to the statistical data).
- B.
Trains take preference over buses at road crossings, which helps them to cut the time of stops.
- C.
Trains pollute the environment less heavily.
- D.
A trip by train is cheaper than a trip by bus.
- E.
Passengers can lie down on berths, rest and change clothes in the compartment.
- F.
The compartment of a passenger car is a closed space (ensuring fewer disturbances from other passengers),
- G.
There is a possibility for passengers to use WC on the train and smoke on the platform of a passenger car at any time.
- H.
Traveling by train does not depend on weather conditions.
- I.
There is less noticeable rocking and vibration than in a passenger car.
- J.
A dining car is available for passengers.
- K.
There is freedom of movement on the train.
- L.
Trains have fewer stops than buses and are rarely overdue.
- M.
Trains are traveling day and night.
- N.
There is a possibility for passengers to order food or newspapers and magazines to the compartment.
- O.
There is a simpler border control for passengers on the train (they do not need to leave the cars and their luggage is with them).
A questionnaire for ranking the sub-criteria by using the method of correlation was prepared by the authors. It was also translated into Russian language. An anonymous survey was carried out, with 52 questionnaires presented to passengers on the Vilnius–Moscow–Vilnius train. About 48% of the trip, which lasts for 14 h and 05 min (944 km), took place during the night. Respondent characteristics are presented in
Table 1.
The same passengers completed questionnaires and assessed the sub-criteria that determine the choice to travel by train as an alternative to aircraft. The results of this research were published in the article [
11].
The number of respondents (52) was three times that of the criteria (sub-criteria) (15). Therefore, it was sufficient because m ≥ n. A description of 15 sub-criteria was presented in the questionnaire, and the respondents assigned different ranks to them (all the ranks had different assignable values).
When applying expert research methods to assess the significance of criteria, there is a problem of determining the required (necessary) minimum number of experts. In practice, the mathematically unsound provision (principle) that the number of experts must be equal to or greater than the number of criteria is often observed. There is another common position that is often applied in practice, which maintains that the amount of data required for studies
m ≥ 30 is also not substantiated, because in some cases the number m is sufficient (if the group range is small), while in other cases it is too small. The credibility of expert group assessments depends on the level of knowledge of individual experts and their number. Having assumed that the experts are accurate assessors, it can be stated that as their number increases, the reliability of the expertise of the whole group of experts (average of the opinion estimate) also increases. The minimum number of experts to be interviewed
mmin can be calculated according to the sample size formula [
69]:
where
t is the value of
t (Students) distribution, which depends on the probability taken to assess the importance of the criterion in deciding to go by train as an alternative to the bus. When the probability
P = 95% (significance level
α = 0.05 for one-sided test),
t = 1.96;
—standard deviation of the ranks
Rij of the evaluated
j-th criterion; Δ
j is the absolute error of passengers (respondents) rank values
j-th criterion, indicating the accuracy of the survey results.
The absolute error of the survey shows how much the average of the ranks calculated for the j-th criterion of m surveyed passengers may differ from the average of the population set that would be determined by surveying all passengers. Due to the limited sample size m, always differs from by no more than plus or minus Δj. This difference is greater the smaller the m and the larger .
By interviewing m passengers and calculating the standard deviation of the ranks of j-th criterion with the 95% probability recommended in practice, the absolute error Δj of the j-th criterion value can be determined from formula (10) and compared with the permissible value (if any).
5. Calculating the Average Rank, the Consistency of Expert Estimates and the Criteria Weights
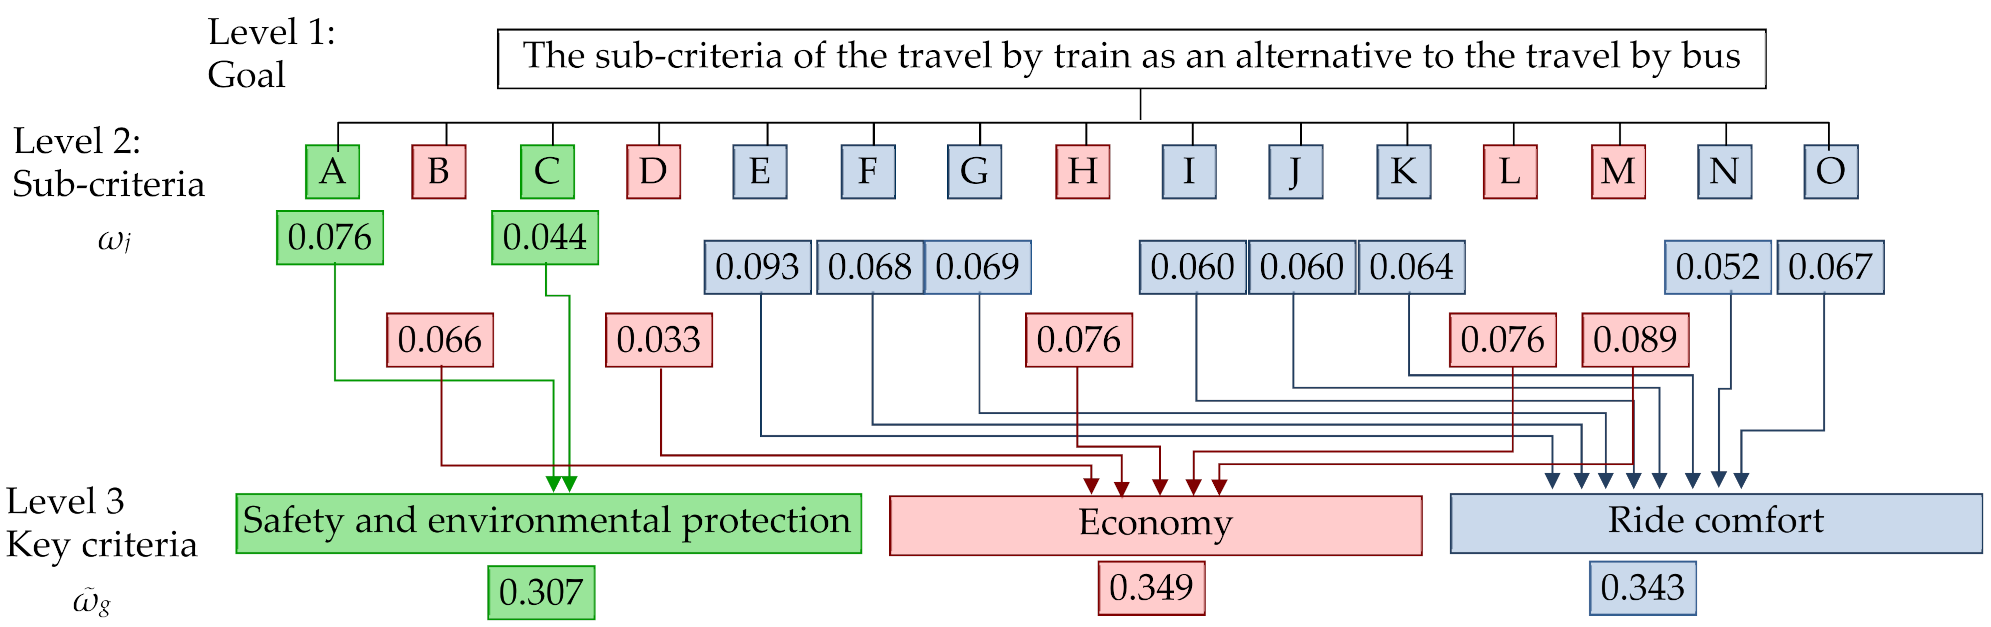
All 15 sub-criteria presented in the questionnaire, which determined the choice of passengers to travel by train rather than by bus, were divided into three groups and named key criteria (
Figure 2b,c). The group of safety and environmental protection included two sub-criteria (A and C), the economy group embraced five sub-criteria (B, D, H, L, M) and the ride comfort group consisted of eight sub-criteria (E, F, G, I, J, K, N, O).
The ranks of the significance of sub-criteria, determining the choice by passengers of a trip by train rather than traveling by bus, were used for calculating the average values of the ranks
, the concordance coefficient
W, Pearson’s chi-square statistic
χ2 and sub-criteria weights
ωj and
ω′
j (
Table 2). The following table also presents the mean values
of the sub-criteria weights
ωj and
ω′j and the standard deviations of the ranks
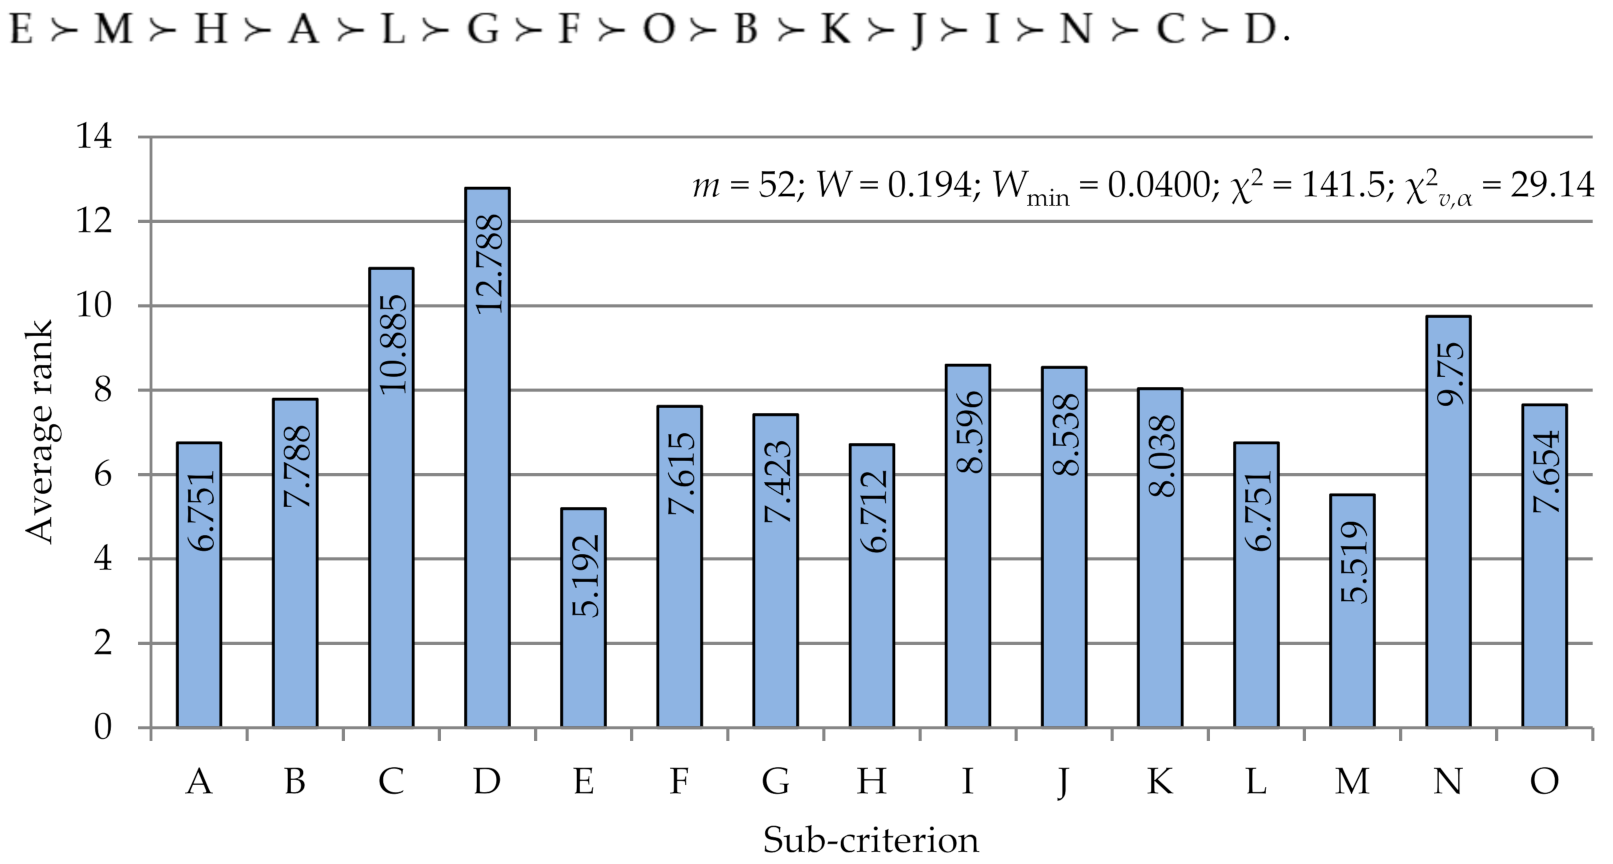
Rij.The total of sub-criteria ranks was , while the sum of average ranks of all j sub-criteria was . The average value of sub-criteria ranks was calculated by Equation (6) or . The sum of squared deviations S = 147,172 (Equation (7)). The concordance coefficient W = 0.194, showing the consistency of the estimates of respondents (52 passengers), was calculated by Equation (6).
Based on the data from the passengers’ survey and using Equation (11), χ2 = 141.5 was obtained. The critical value taken from the table of chi-squared distribution with ν = 15 − 1 = 14 degrees of freedom and the significance level α = 0.01 was equal to 29.1413. The empirical value χ2 = 141.5 was 4.8 times the critical value , which allowed the researchers to assume that the respondents’ estimates were consistent.
The smallest value of the concordance coefficient Wmin, with the significance level α = 0.01 and the degree of freedom ν = n − 1 = 15 − 1 = 14, allowing the authors to assume that the respondents’ estimates were consistent, was calculated by Equation (9). The smallest value of the concordance coefficient Wmin = 0.0400 corresponded to only about one-fifth of the calculated concordance coefficient W = 0.194.
The estimates of 52 passengers that took part in the survey were in agreement (or consistent) because the calculated concordance coefficient was equal to 0.194, while the value of Pearson’s chi-squared statistic, equal to 141.5, was considerably larger than the critical value of 29.14, corresponding to degrees of freedom of 14 and a significance level of 0.01. The smallest concordance coefficient still allowing the estimates of all respondents to be considered consistent was equal to 0.0400, which was equivalent to only one-fifth of 0.194. It was hardly possible to expect very high consistency of the respondents’ estimates because of their highly different experiences, wishes, habits and means.
A bar diagram of the calculated average ranks
of the 15 sub-criteria determining the passengers’ choice of traveling by train rather than by bus is given in
Figure 3.
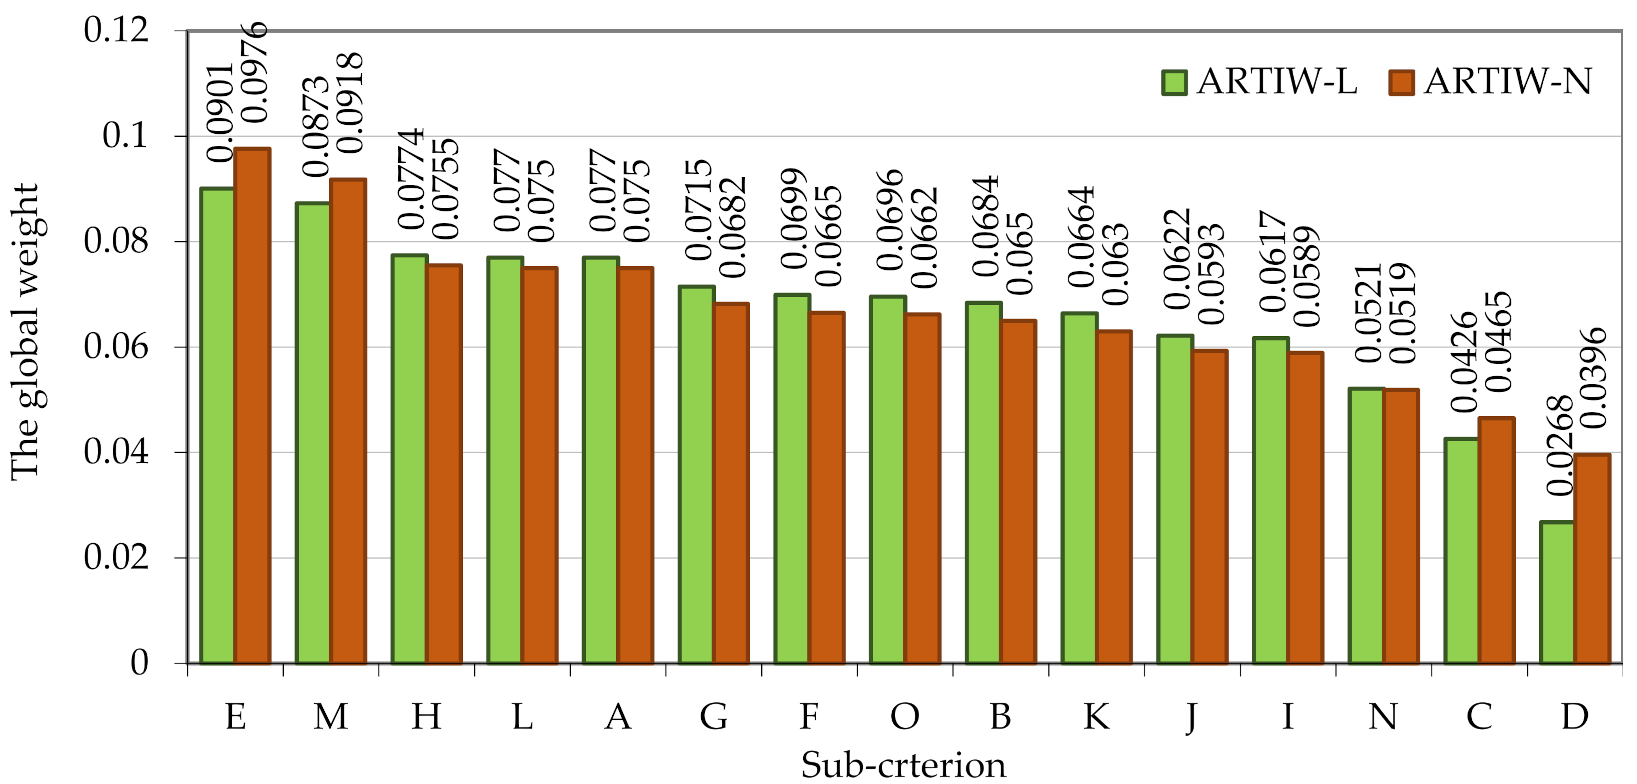
By applying the new ARTIW-L and ARTIW-N methods, the passengers’ reasons for selecting a trip by train rather than a trip by bus, which were described by criteria (sub-criteria) and their weights
ωj,
, and
, were determined. The calculation data for sub-criteria beginning from the most important (E) to the least important (D) ones are shown in
Figure 4.
The calculated average ranks
(
Figure 3) and global weights
ωj and
(
Figure 4) of sub-criteria, determining the choice by the respondents to travel by train rather than by bus, show that sub-criteria E, M and H were much more important than sub-criteria N, C and D. This implies that their priority order should be as follows:
Figure 3.
The average ranks of sub-criteria .
Figure 3.
The average ranks of sub-criteria .
Figure 4.
Relative weights of sub-criteria in descending order.
Figure 4.
Relative weights of sub-criteria in descending order.
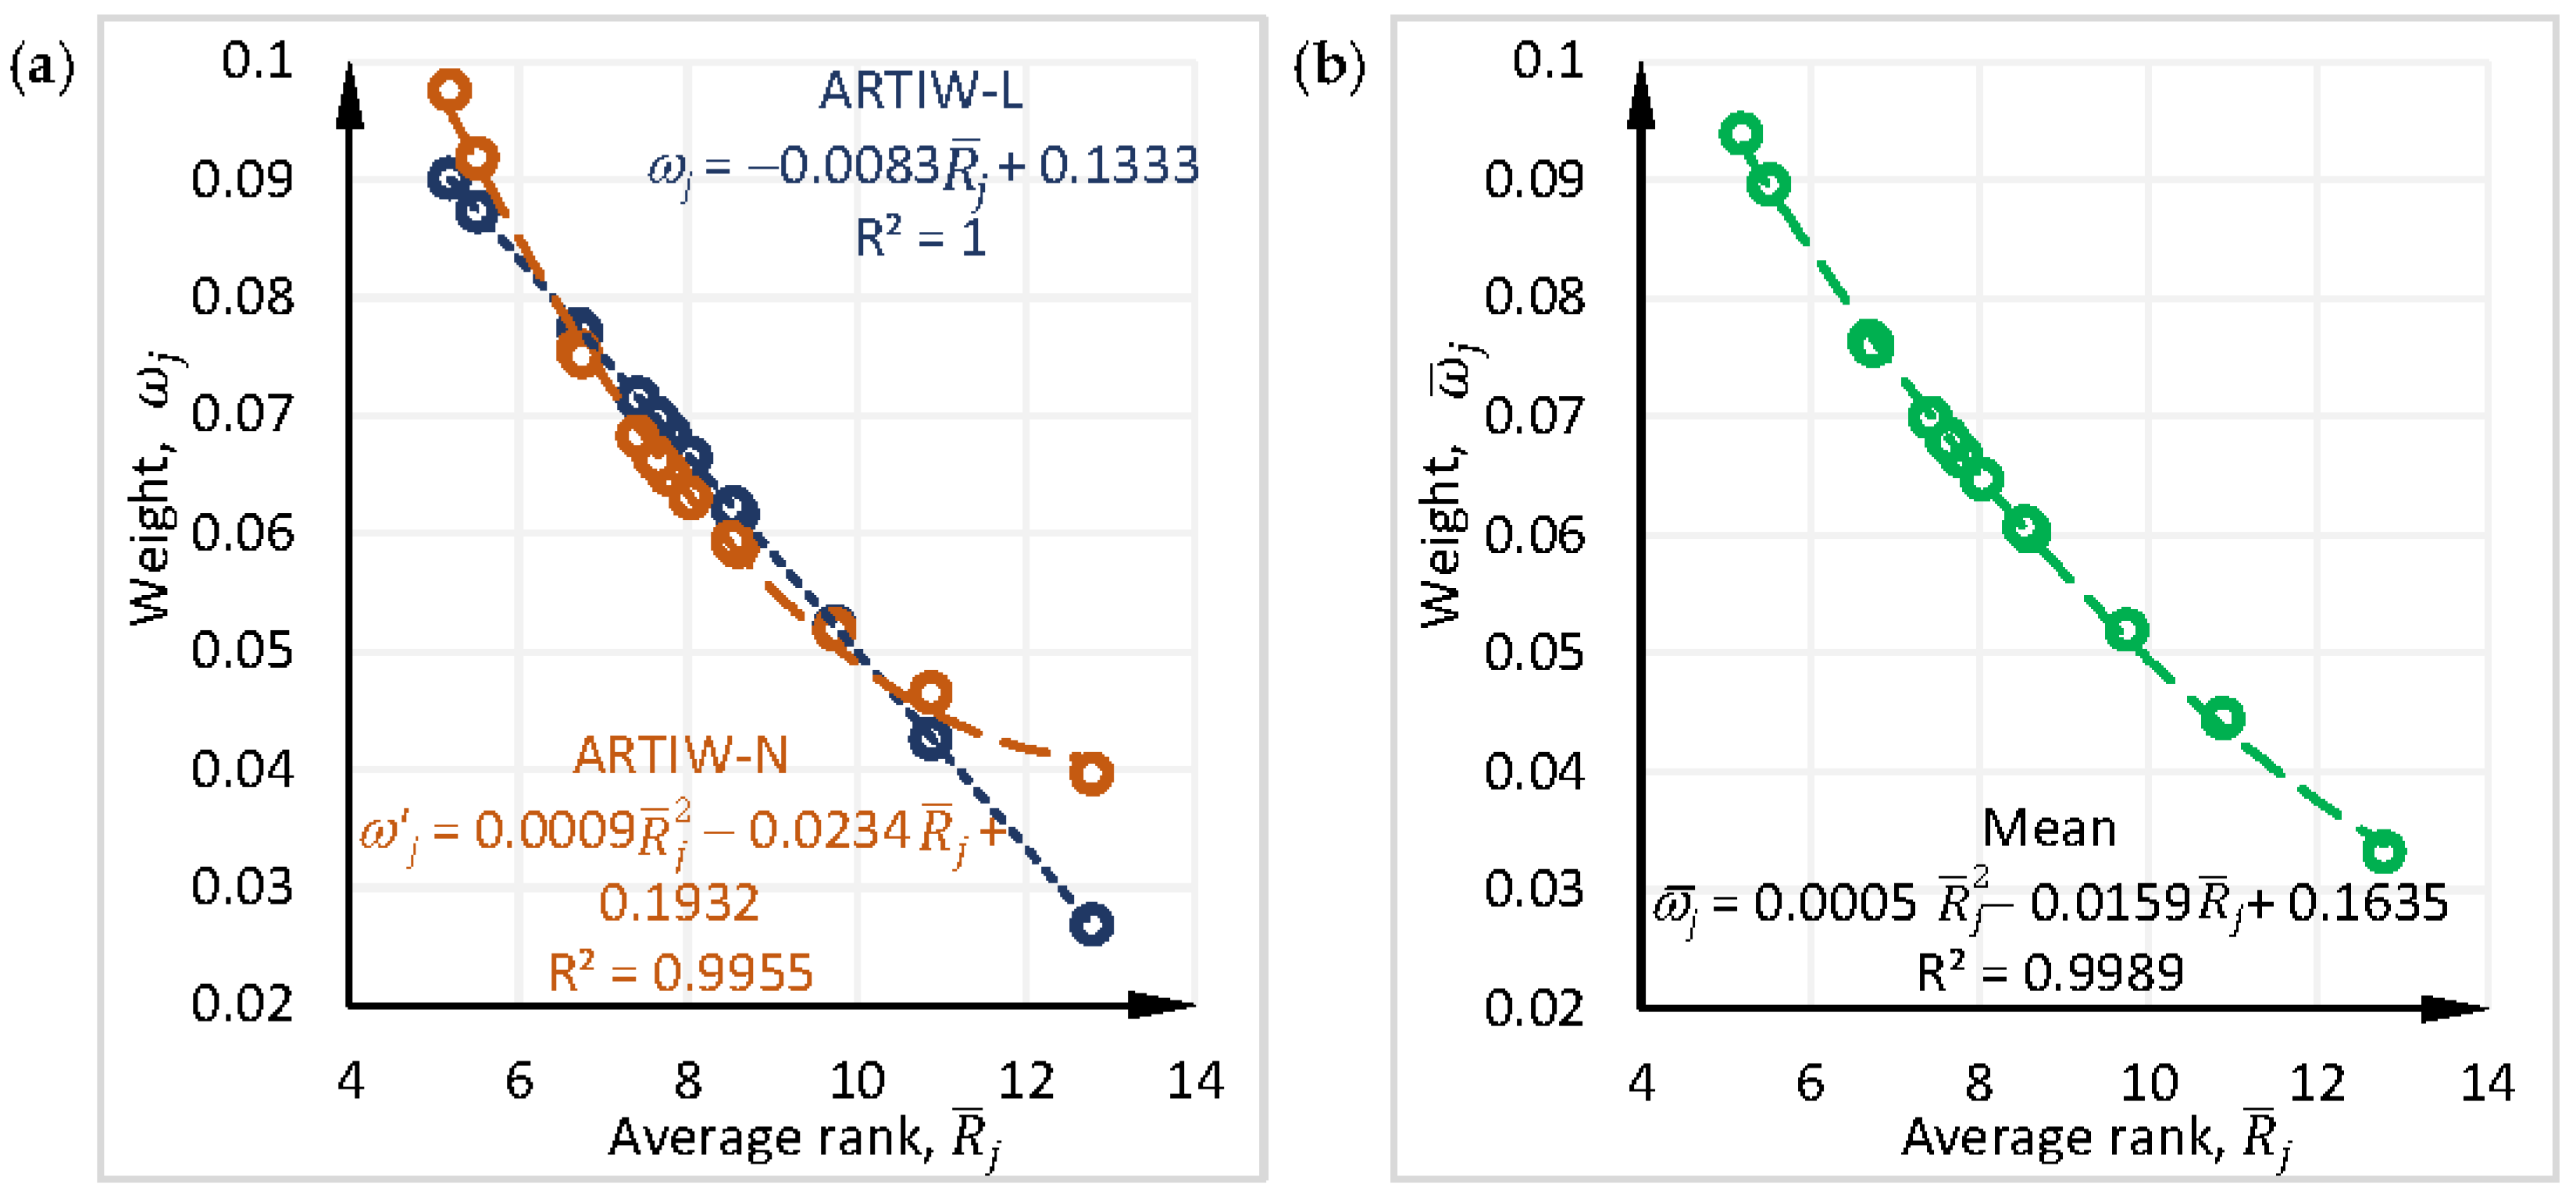
Moreover, there should be an inverse straight-line relationship between the average ranks
and the global weights
ωj calculated by the ARTIW-L method. The determination coefficient of the regression equation of 15 sub-criteria, R
2 = 1, and coefficient of correlation
r = −1, show that this is a functional linear relationship
. The correlation between
and the weights
calculated using the ARTIW-N method is non-linear (
Figure 5a). Ranks and weights are related by the quadratic regression equation
= 0.0009
− 0.0234
+ 0.1932, coefficient of determination, which is R
2 = 0.9955.
The data obtained in the performed study show that the estimates of the significance (importance) of sub-criteria determining the passenger choice of traveling by train rather than by bus were consistent (in agreement) and reflect their general opinion, shown by the averages
of criteria weights
ωj and
calculated according to Equation (5) and their correlation with the rank averages
(
Figure 5b).
With reference to the principle of determining the sample size, the absolute error Δ
j for determining the average rank
of each
j-th sub-criterion was calculated from formula (10) (
Table 3). For the calculation of Δ
j, the values of the standard deviation
of each sub-criterion were taken from
Table 2 when 52 passengers were interviewed and
α = 0.05 significance level.
The results (
Table 3) show that the mean ranks
of the 15 sub-criteria were identified with an absolute error Δ
j, the sample range of which was Δ
jmax − Δ
jmin = Δ
jA − Δ
jK = 1.20 − 0.88 = 0.32, and the mean value
= 1.06. By taking ∆
j for each sub-criterion or the mean value
of 15 sub-criteria, it was possible to calculate the confidence interval
±Δ
j of ranks average
, with the population mean rank
of 95% confidence. For example, the population mean rank
of the sub-criterion A with the highest rank variation was in the range 6.751 ± 1.20, i.e., between 5.551 and 7.951. The range would decrease if more than 52 passengers were interviewed. We believe that
= 1.06 is close to one, so the number of passengers
m = 52 who completed the survey was sufficient and allowed us to reliably assess the factors determining the choice of passengers to travel by train as an alternative to bus.
6. Calculating the Overall Weights of Key Criteria
It was rather difficult to determine the weights
ωj of 15 sub-criteria by using the AHP approach because the optimal number of criteria for this method was seven plus or minus two [
55,
66].
When the global weights
of all 15 sub-criteria were determined and sub-criteria were divided into three groups (key criteria) as shown in
Figure 2c, the overall weights of the key criteria
ῶg (see
Table 4) were calculated as follows using the inverse hierarchy for assessment main criteria importance (IHAMCI) method:
where
ωj is the global weight of
j-th sub-criterion,
k is the number of sub-criteria in the group (
j = 1, 2, ...,
k),
g is the number of groups of criteria describing the research object (
b = 1, 2, ...,
g).
The overall weight
ῶSa of two sub-criteria, A + C, included in the travel safety and environmental protection group (key criterion), which was calculated by Equation (11), was the smallest:
The overall weight
ῶEc of five sub-criteria, B + D + H + L + M, included in the key criterion describing economy, was calculated in the same way, as follows:
The overall weight
ῶCo of the key criterion of eight sub-criteria, E + F + G + I +J + K+N + O, describing ride comfort, was the largest:
The results of calculation show that the choice of passengers to travel by rail transport rather than by road transport (a bus) was determined by the criteria describing ride comfort and economy (about 35%) as well as safety and environmental protection (only about 31%).
The obtained global weights
of sub-criteria and the overall weights
ῶg of criteria divided into three groups, as shown in
Figure 6, allowed the authors to identify the criteria determining the choice of passengers to travel by train (as an alternative to travel by bus). The obtained data can be used by companies engaged in passenger transportation by rail to enhance the quality of services provided by this more environmentally friendly mode of land transport so that it will have a competitive edge over rival modes of transportation.
The sub-criteria and key criteria weights calculated in this study, which show why passengers choose train travel as an alternative to the bus, are not absolutely accurate and constant. When interviewing citizens of other countries traveling on international trains, the significance of the sub-criteria and key criteria may differ. Their values can be influenced by the economic development of the country, passenger habits, the reliability factors relating to different modes of transport, and risks.
The most important part of the study consisted of the original sub-criteria system and their weighting methodology, applying the new ARTIW-L and ARTIW-N methods, as well as the method of inverse hierarchy for assessment main criteria importance (IHAMCI). These methods can be used by other researchers to calculate normalized subjective weights when ranking the results of an expert or respondent survey.
7. Discussion and Conclusions
Passengers usually make a decision to travel by a particular mode of transport by evaluating the criteria describing it, whose weights reflecting their significance seem to be different to them. The selection of a particular (alternative) mode of transport is based on the significances (subjective weights) of the considered criteria, which can be determined by using expert evaluation methods. The average value of the estimates given by a considerable number of passengers (respondents) in ranking the criteria can be used as a result, presenting public opinion about a particular transport mode chosen for a particular route if their opinions (judgments) are considered.
In the present work, the reasons behind the passengers’ choice to travel by train rather than by bus were identified by considering fifteen sub-criteria. The significances of these sub-criteria for choosing travel by train were evaluated by 52 respondents (passengers on the Vilnius–Moscow–Vilnius train) against a 15 rank scale. The subjective total normalized weights of sub-criteria based on the new ARTIW-L and ARTIW-N methods allowed the authors to rank them by order of priority (preference). A functional or close and strong correlation between the means of the sub-criteria ranks and the normalized weights of the sub-criteria calculated from them indicated that the ARTIW-L and ARTIW-N methods were satisfactory to assess the significance of the sub-criteria. The mean of the sub-criteria weights calculated by these two methods was taken as the final significance of the sub-criteria. The sub-criteria determining the passengers’ choice of traveling by train rather than by bus (as an alternative mode of transport) included ride comfort (the availability of berths in passenger cars for sleeping and relaxation) (0.0939), the selected time of travel (0.0896) and a negligible effect of weather conditions on it (0.0764). The sub-criteria describing rail transport as safer than road transport, as well as such advantages as a smaller number of stops and delays on the way (0.0760), the availability of WCs and places for smoking (0.0699), a lower probability that passengers would disturb each other (0.0682), and simpler border control (0.0679) were less important for passengers. However, even less important for them were sub-criteria describing the priority given to rail vehicles when crossing motor roads (0.0667) and freedom of movement (0.0647), the availability of a dining car (0.0607) and unpleasant slight rocking and vibration (0.0603). The least important sub-criteria for passengers included the possibility to order food or newspapers and magazines to the compartment (0.0520), lower environmental pollution by rail transport (0.0445), and sometimes cheaper railway tickets (0.0332). The ratio of the largest total weight of sub-criteria (0.0939) to their smallest total weight (0.0332), which was equal to 3.36, showed that the significance of particular sub-criteria was different for passengers choosing a particular mode of transport.
The fifteen considered sub-criteria were divided into three groups using the inverse hierarchy for assessment main criteria importance (IHAMCI) method suggested by the second author. The normalized overall weights for these groups (criteria) were calculated. The overall weight of two sub-criteria describing safety and environmental protection was equal to 0.3077, while the overall weight of five sub-criteria forming the ‛economy’ group was 0.3492, and the overall weight of eight sub-criteria referring to ride comfort was the largest, at 0.3431. The overall weights of the key criteria of any sub-criteria group were calculated using a new IHAMCI method, which allowed assessment of different numbers of sub-criteria in a key criterion.
The minimum number of experts or respondents to be consulted in order to obtain reliable results was calculated using the sample size principle. After interviewing 52 passengers, the values of the standard deviations of the sub-criteria ranks were identified, and then used to determine the absolute error of the mean of the ranks of each sub-criterion. The results showed that with 95% probability, the sub-criteria sample rank averages differed from the population averages by no more than 1.20–0.88 rank (on average 1.06 rank). This difference was close to unity and indicated that the significance of the sub-criteria was determined with sufficient accuracy.
The decision-makers in the countries engaged in passenger transportation by the considered international train should primarily improve the services described by the criteria that most strongly influence decisions by passengers to choose a trip by train rather than by bus. A company providing passenger transportation by any particular mode of transport can win the competition in this area only if its provided services are of the highest quality and satisfy the ever-growing demands of passengers.


