Article

Model Test on Mechanical and Deformation Property of a Geomembrane Surface Barrier for a High Rockfill Dam

1
College of Water Conservancy and Hydropower Engineering, Hohai University, Nanjing 210024, China
2
Dianshan Lake Water Area Comprehensive Management Center of Kunshan City, Kunshan 215300, China
*
Author to whom correspondence should be addressed.
Appl. Sci. 2021, 11(23), 11505; https://doi.org/10.3390/app112311505
Submission received: 4 October 2021 / Revised: 28 November 2021 / Accepted: 30 November 2021 / Published: 4 December 2021
(This article belongs to the Special Issue Advances in Geosynthetics)

Abstract

:
The cushion of a geomembrane surface barrier of a high rockfill dam built on deep overburden is prone to crack and fail because of excessive flexural deformation. This study proposes a geomembrane surface barrier for a high rockfill dam on deep overburden. The proposed geomembrane surface barrier uses polyurethane bonded aggregates as the cushion material. The loading and deformation performance of the barrier system under uniform water pressure was investigated using a self-developed structure model test device. The mechanical and deformation property of each layer of the barrier, and the interaction mode between adjacent layers, were obtained through external videos and internal sensor monitoring. The results demonstrated that the polyurethane bonded aggregate cushion exhibited good adaptability to flexural deformation during the entire loading process and maintained good contact and coordinate deformation with the upper protective and the lower transition layers. The geomembrane surface barrier created using polyurethane bonded aggregates as the cushion material can adapt to the flexural deformation of a high rockfill dam surface on deep overburden.

1. Introduction

For a high rockfill dam built on deep overburden, the dam surface will produce large deflection deformation because of the large deformation of the dam body and foundation. If there is a geomembrane barrier on the upstream face of the dam, excessive deflection deformation will lead to cracking or even dislocation of the cushion and protective layers. This situation will endanger the safety of the geomembrane under pressure by water. A granular crushed stone layer, or porous concrete, is typically used as the cushion material in the geomembrane surface barrier of a low rockfill dam. However, existing research and engineering application experience have demonstrated that the granular material cushions cannot maintain stability [1,2]. The porous concrete usually presents a higher elasticity modulus and an obvious brittle characteristic during compressive and flexural failure [3,4]. Thus, these traditional cushion materials are not suitable as a cushion for the geomembrane surface barrier of a high rockfill dam.
Polyurethane bonded aggregates are a new type of elastic honeycomb porous material composed of polymer glue and crushed stone. Polyurethane bonded aggregates were first applied to embankment surfaces in Europe for slope protection. The porous structure was used to eliminate the energy of the wave and water flow, thus reducing the erosion damage to the embankment [5,6]. Polyurethane bonded aggregates have high strength and permeability. Moreover, they have low elastic modulus and good flexibility. Polyurethane bonded aggregates have stronger deformation adaptability than traditional materials such as porous concrete. Thus, they are well suited as a cushion material for the geomembrane surface barrier of a high rockfill dam [7]. However, there has not been any reported research on the mechanical and deformation performance of a geomembrane surface barrier comprised of polyurethane bonded aggregates as the cushion material.
Several researchers have studied the deformation behavior of geomembrane on different cushion materials. Based on the film tension theory, Wilson et al. (1996) proposed the design criteria of a geomembrane with different cushion layers [8]. Koerner et al. (1996) verified and improved the design criteria through laboratory model tests and proposed a calculation method for the safety factor of geomembrane puncture on different cushions [9]. Gudina and Brachman (2006) conducted puncture tests on 1.5 mm-thick high-density polyethylene (HDPE) geomembrane with a coarse gravels cushion under 3000 kPa-pressure and concluded that the geomembrane could be punctured under this extreme condition [10]. Stark et al. (2008) obtained the puncture resistance of geomembranes with different thicknesses through puncture tests and pointed out that the puncture resistance of the geomembrane increases with increasing thickness [11]. Brachman and Sabir (2010) conducted laboratory tests to measure the strain of a geomembrane placed on cushions and concluded that the indentation and strain of geomembranes are affected by the shape and particle size of cushion material [12]. Jiang et al. (2013) and Jiang and Shu (2014) derived the relationship between the contact–stress distribution and the particle size of cushion materials using the entropy theory [13,14]. Jiang and Tian (2018) used the image recognition method to measure the depression of a geomembrane formed by cushion particles and conducted simulation and analysis through the finite element method [15]. The previous research mainly focuses on the behavior of geomembranes on the cushion of granular materials. No research has been conducted on the failure characteristics of geomembrane and cushion of polyurethane-bonded aggregates under the non-uniform settlement deformation of the dam surface conditions. Thus, the influence of polyurethane bonded aggregates on the deformation of the geomembrane is unclear.
The model test of geotechnical structure is an effective method to evaluate the mechanical and deformation property of complex structures. The model test of geotechnical structures is divided into two categories. The first category is a similarity model test. It uses similarity theory to design the model and reflects the prototype situation through similarity relation. This approach is extensively used in the study of foundations, tunnels, slopes, hydropower stations, and other structural problems [16,17,18,19,20]. However, the model test of a geotechnical structure is multi-disciplinary and involves multiple research areas, including soil mechanics, material mechanics, and structural mechanics. Thus, the similarity principle is not often satisfied in the model design. A centrifuge model test is a type of similarity model test extensively used in the simulation of embankments, subgrade, tunnels, and earth rock dams [21,22,23,24]. This type of test is often expensive and requires a long time to complete. The second category is a local structure model test. A local structure model test cannot quantitatively reflect the mechanical and deformation characteristics of the prototype structure. However, the same materials and structural types can be used in this type of test. Thus, a local structure model test is an effective method to qualitatively evaluate the mechanical and deformation characteristics. It can also be used to evaluate the failure mode of local structures and the interaction mode between different materials. Local structure model tests are extensively used to study the geotechnical structure problems of foundations [25], earth dams [26], tunnels [27,28,29], slopes [30,31], and retaining walls [32]. The test methods employed in these studies can provide valuable references for studying the deformation property of a geomembrane surface barrier.
This study proposes a geomembrane surface barrier for a high rockfill dam on a deep overburden that uses polyurethane bonded aggregates as the cushion material. Both the composition and the advantages of the new type of barrier are described in detail. This study discusses a self-developed structure model test device that was used to investigate the mechanical and deformation properties of the geomembrane surface barrier under uniform water pressure conditions. During the tests, the mechanical and deformation behaviors of each layer of the barrier and the interaction mode between adjacent layers are obtained using external videos and internal sensor monitoring. The test results can be used as guidance for relevant research and future engineering designs.

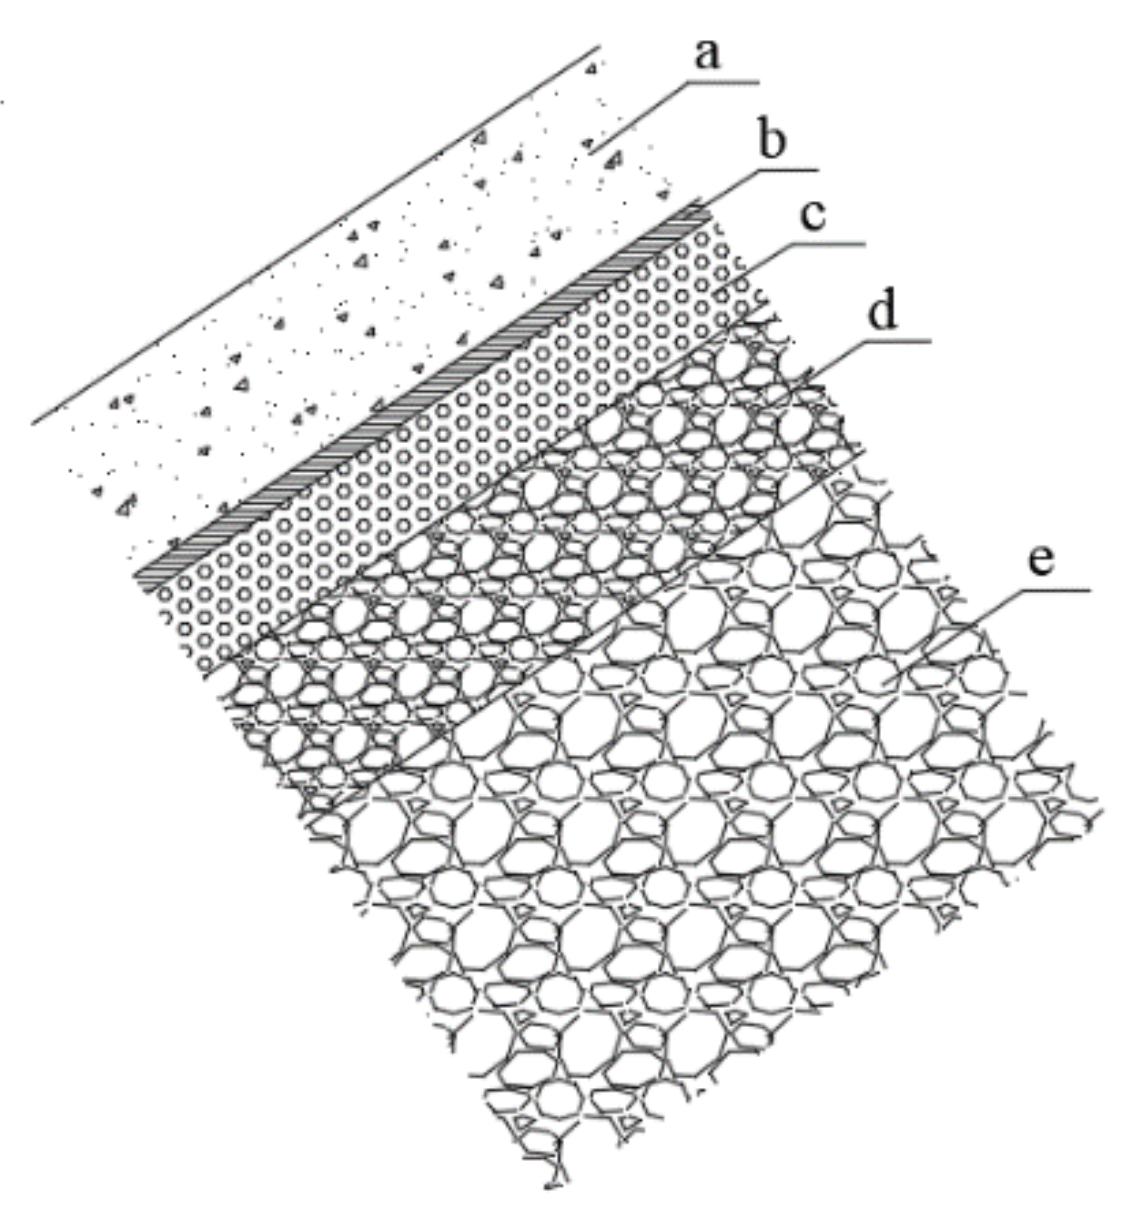
2. A Geomembrane Surface Barrier for a High Rockfill Dam

This study proposes a new type of geomembrane surface barrier that employs polyurethane bonded aggregates as the cushion material for high rockfill dams on deep overburden. Figure 1 show the specific structure composition and materials.
As shown in Figure 1, the geomembrane surface barrier for a high rockfill dam is primarily composed of four layers: transition layer, cushion layer, composite geomembrane, and protective layer.
(1)
Transition Layer: The transition layer is composed of coarse aggregates. The coarse aggregates of this new structure are filled and rolled to a thickness of 2–3 m, which is similar to the transition layer of a concrete faced rockfill dam. The particle size should match the lower rockfill and the upper cushion to meet the requirements of permeability and filtration. During construction, the transition layer and the dam rockfill are simultaneously filled and rolled into layers.
(2)
Cushion layer: The cushion layer is composed of situ-cast polyurethane bonded aggregates with a thickness of 6–10 cm and an aggregate particle size of 5–20 mm. After the rockfill and transition layer are filled, the polyurethane bonded aggregates are directly poured onto the surface of the transition layer. Then, it is formed after rolling and curing for two days. As the cushion adopts the cast-in-place construction method, it can be bonded with the crushed stone on the surface of the transition layer before the final setting. This method serves to maintain the stability of the cushion.
(3)
Composite geomembrane: The composite geomembrane is a sandwich structure comprising a geomembrane (with a thickness of 0.5–2.5 mm) layer laminated to one layer of needle-punched filament geotextile (with Mass per unit area of 250–500 g/m2) on both sides. After two days of curing of cushion layer, the composite geomembrane is directly laid onto the surface of the polyurethane bonded aggregate cushion. The sheer strength of the interface between the filament geotextile on the surface of the composite geomembrane and polyurethane bonded aggregate cushion maintains its stability [33].
(4)
Protective layer: The protective layer is composed of situ-cast plain concrete and has a thickness of 20–30 cm. The protective layer uses joint or fiber reinforcement to prevent cracking with the deformation of the dam body. Before the final setting of the situ-cast concrete, the cement slurry penetrates the fluffy filament geotextile on the surface of the composite membrane. This forms good adhesion with the composite membrane after the final setting.
In summary, the proposed geomembrane surface barrier for a high rockfill dam has the following advantages: (1) the cushion layer will not have large cracks and dislocations under large deformations and will not damage the geomembrane; (2) it can adapt to the deformation of the rockfill dam body on a deep overburden; (3) it can be applied to a rockfill dam with a steep slope; and (4) the structure is simple and easy to construct. Based on the above advantages, the geomembrane surface barrier may be successfully applied to a high rockfill dam on a deep overburden.

3. Model Test Plan

3.1. Test Method

In this study, the local structure model test method was used to investigate the mechanical and deformation performance under water pressure of the geomembrane surface barrier for a high rockfill dam on a deep overburden. Figure 1 show the composition and material of the proposed barrier. The local structure model was designed based on the plane strain problem. Figure 2 show the schematic of the model test. As shown in Figure 2, to simulate the actual water pressure load on the dam surface, normal flexible uniform pressure was applied on the top of the model through the flexible loading bag. The rigid arc base was set at the bottom of the model with the compression layer above it. This design made the structure produce an uneven settlement to simulate the bottom flexural deformation. During the loading process, various sensors were arranged to measure the mechanical and deformation states at different positions within the structure. Simultaneously, the deformation and failure behaviors of the entire structure, in addition to the interaction mode between adjacent layers, were observed through lateral transparent plexiglass.

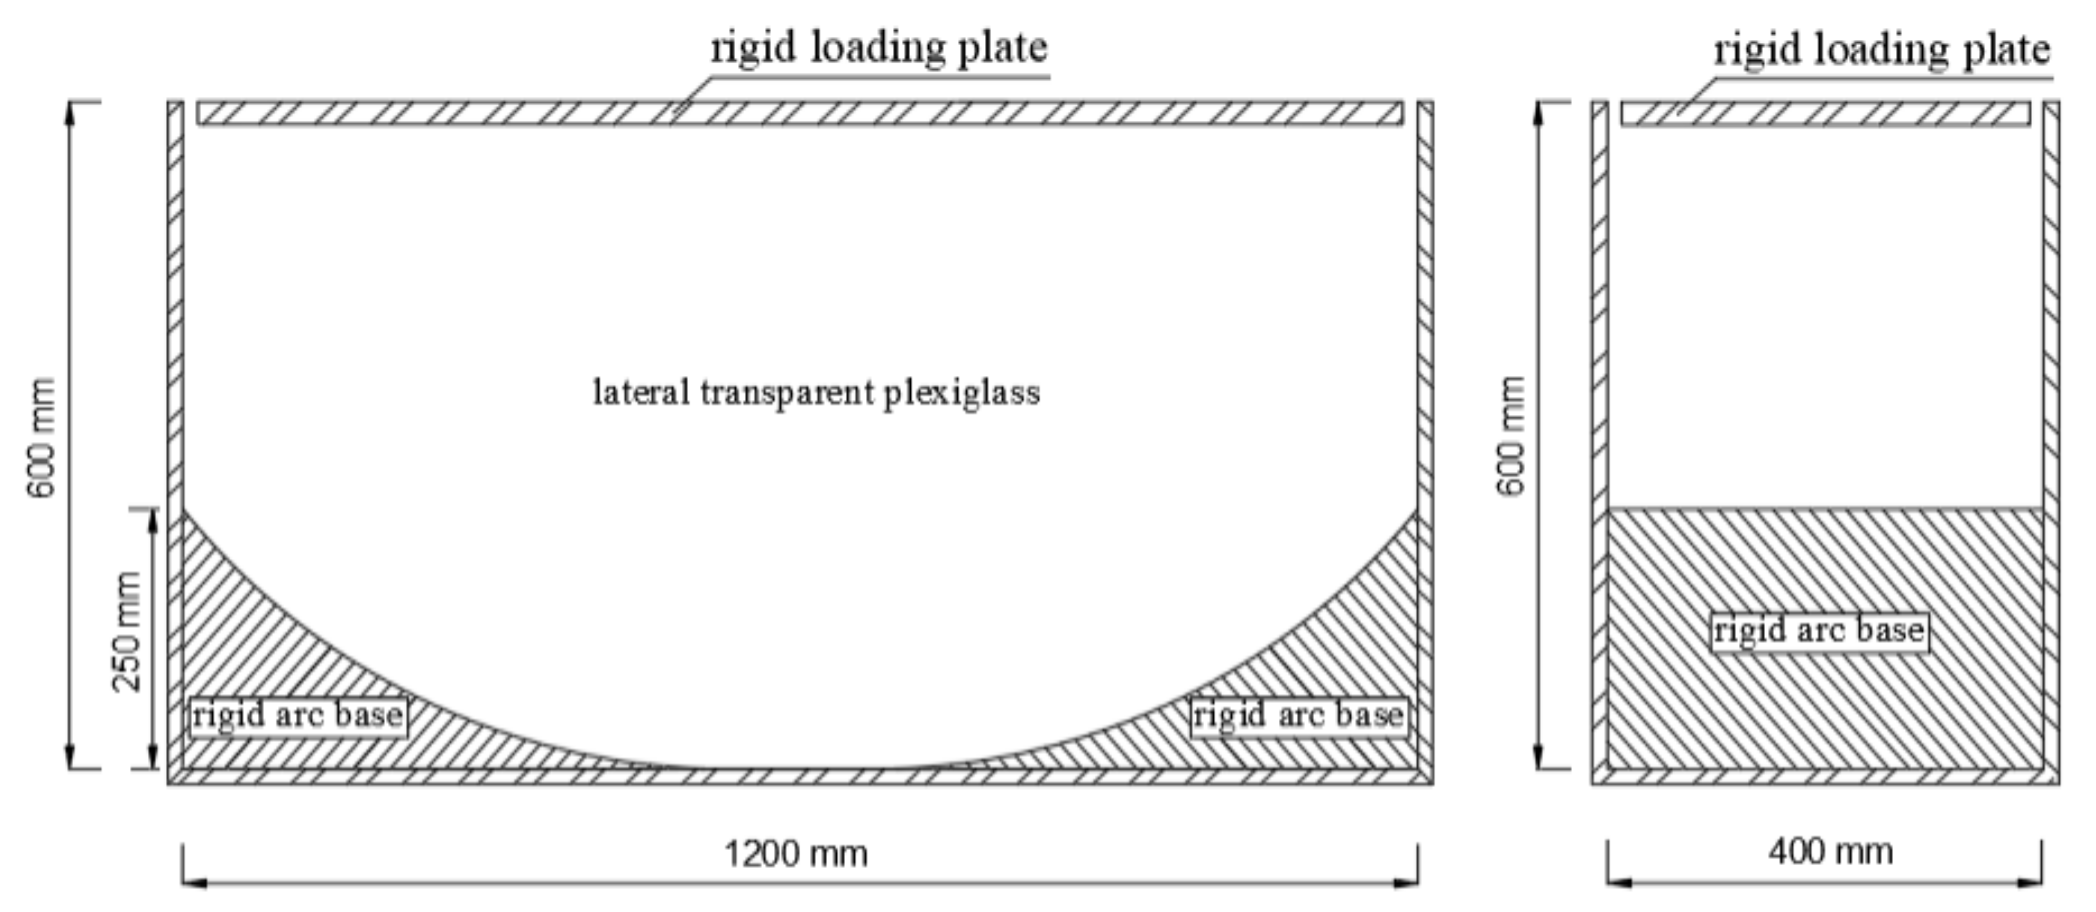
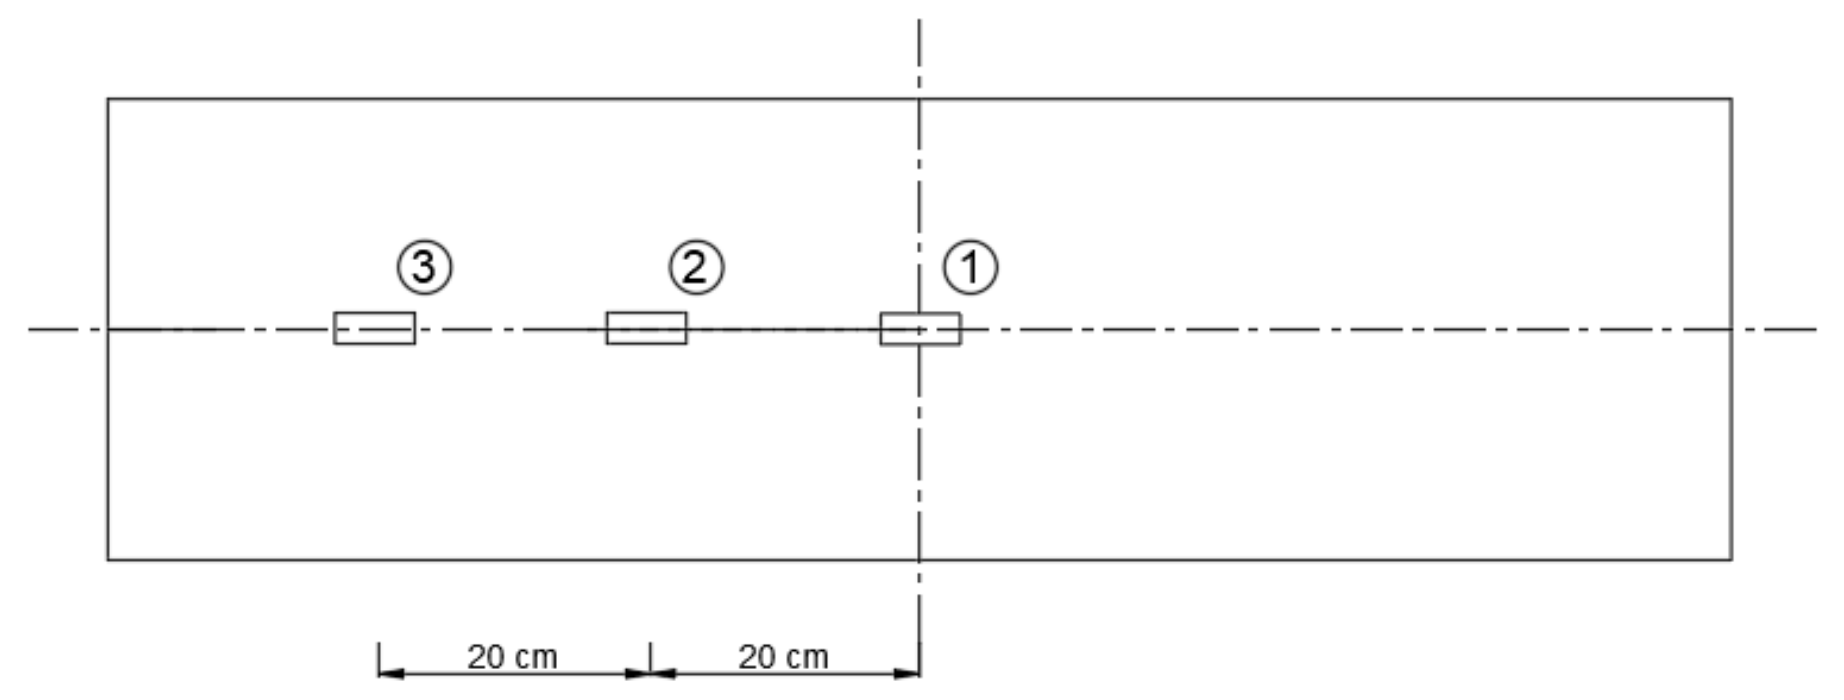
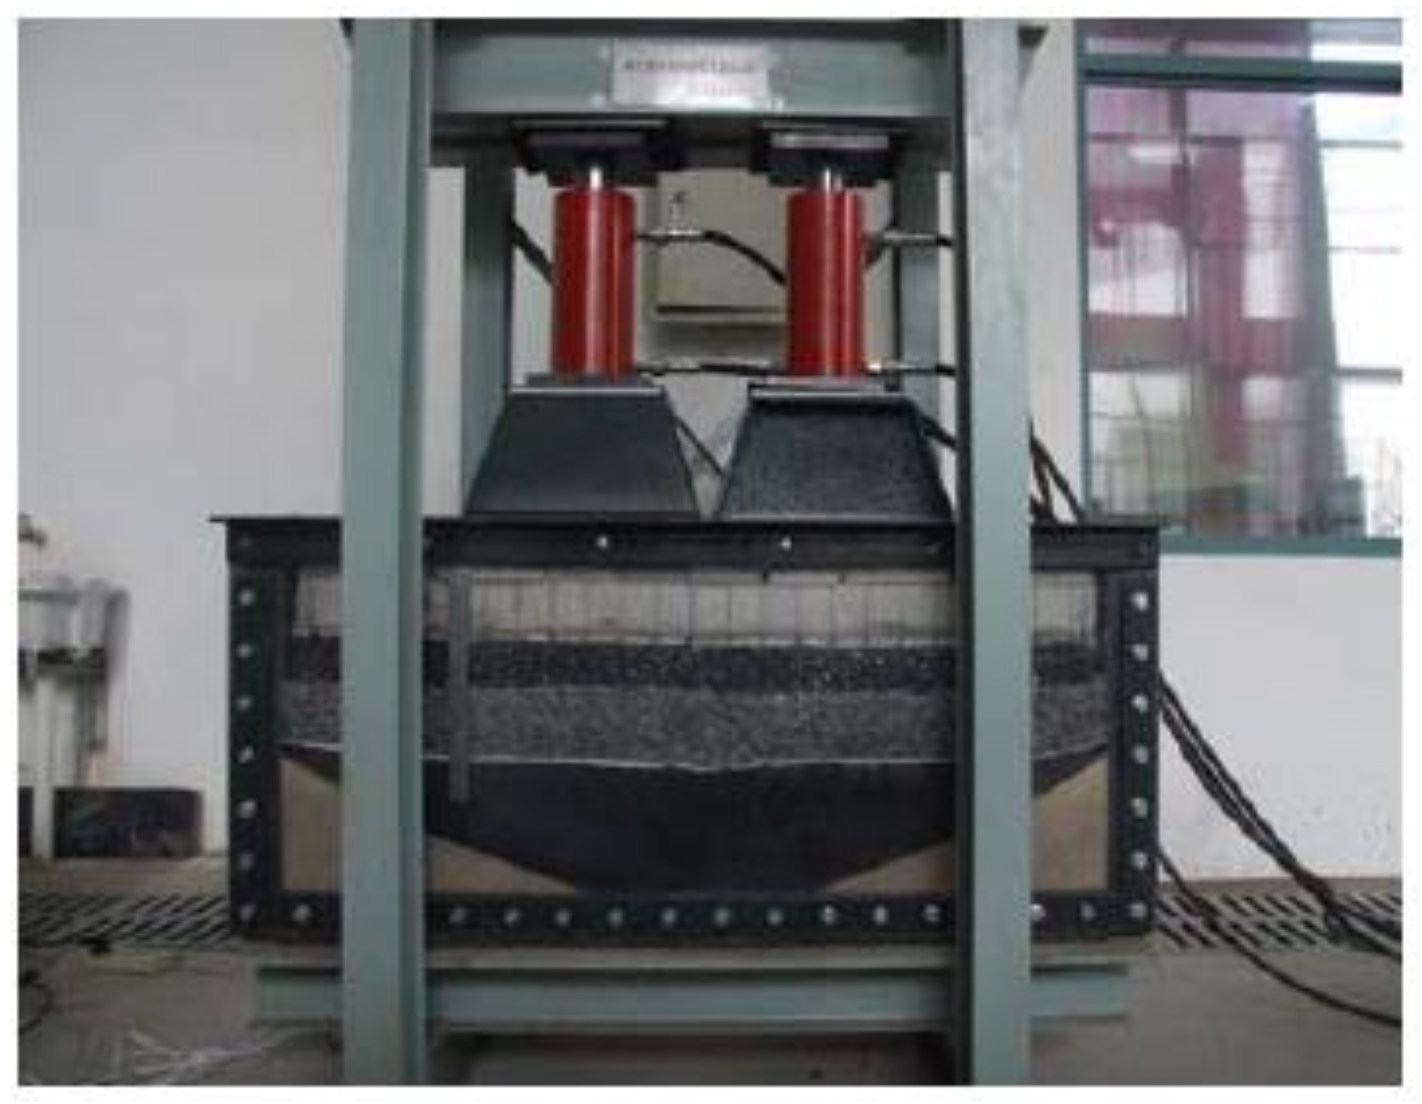
3.2. Model Test Device and Measurement

In this study, the structure model test was conducted in a steel model box (Figure 3). The front side of the model box was a transparent plexiglass plate, and the other three sides were steel plates. The rigid arc base was composed of high-strength concrete at the bottom of the model box. Polytetrafluoroethylene film was applied to the three steel inner walls to ensure that the walls were sufficiently smooth to reduce the impact of friction. As shown in Figure 2, the normal pressure load was applied using two hydraulic jacks. Two steel “bucket” shaped force transfer bases were set between the jack and the rigid loading steel plate to distribute the load more evenly on the loading steel plate. A flexible bag filled with soft glue was then applied to the flexible uniform load to simulate the actual water pressure on the dam surface. The flexible loading bag was composed of high-strength waterproof cloth and filled with flowing plastic soft glue, which could deform with the bag body. The flexible loading bag had strong viscosity to maintain stable pressure in the bag.
During the test, a hydraulic gauge was used to measure the vertical load exerted by the hydraulic jacks. Five micro-Earth pressure cells with 20 mm diameters were used to measure the normal flexible uniform pressure load on the structure surface. The deformations of the geomembrane, polyurethane-bonded aggregates, and protective layer were measured by strain gages with a maximum range of ±2000 με. The tolerance available for the strains can be effectively measured by the strain gauges is 1 με. During the installation of the strain gauges, the geotextile on the surface of the composite geomembrane at the position of the monitoring points was carefully removed using scissors. Then the strain gauges were pasted onto the geomembrane with high strength glue. Finally, two layers of 0.1 mm Polytetrafluoroethylene films were used to cover and protect the strain gauges and connecting lines from the damage of the deformation of the barrier.
The sensor test data, including the earth pressure cells and strain gages, were collected by a dynamic and static data acquisition system, automatically displayed in real-time, and saved in the computer. A high-definition camera was used to observe and record the deformation process of the model through the lateral transparent plexiglass. The deflection deformation of the model was calculated using the image analysis method.

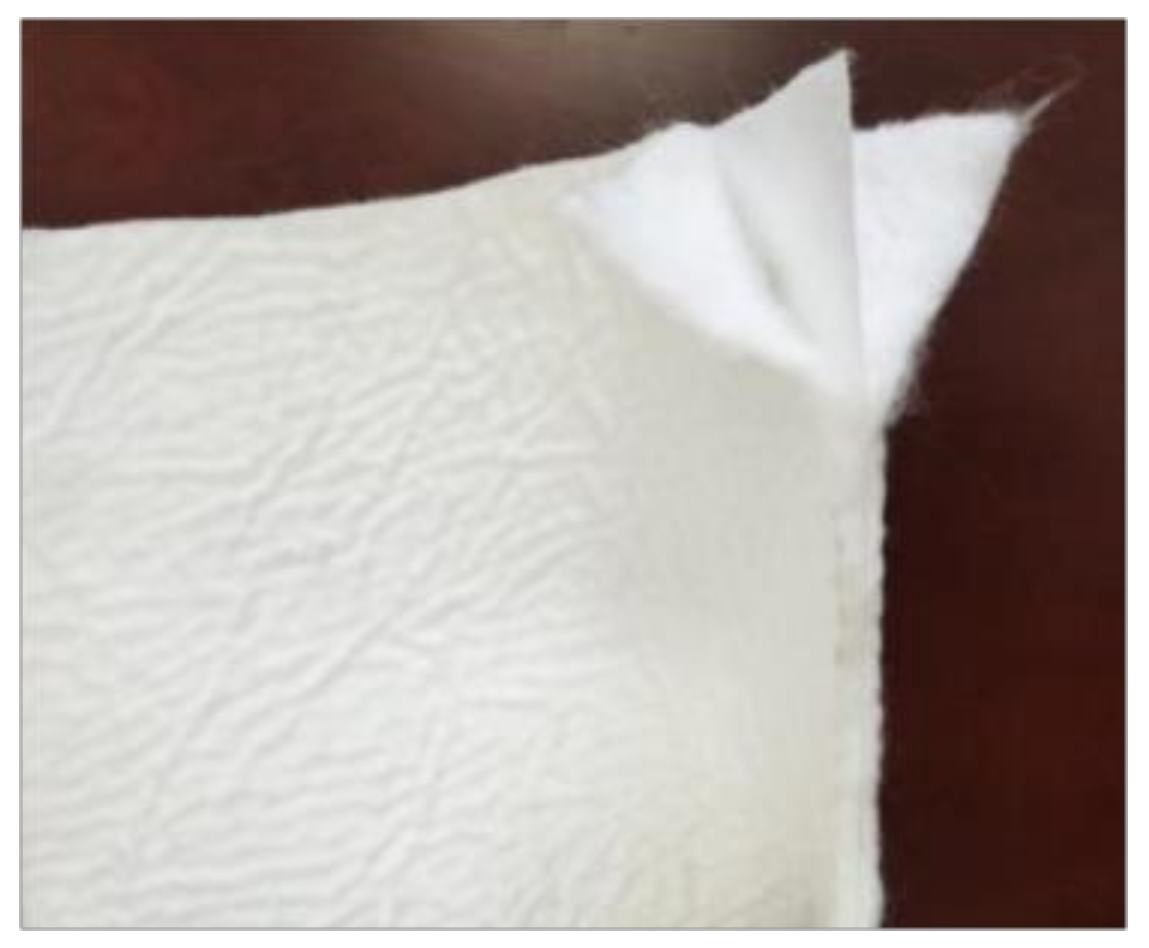
3.3. Test Materials and Manufacturing Process

As shown in Figure 2, rubber particles with good elasticity and a size of 1–3 mm were used for the compression layer. These particles were filled at the bottom of the box to a height of 25 cm. A layer of soft non-woven geotextile was laid on the upper surface of the compression layer to isolate it from the upper transition layer. This soft high-strength non-woven geotextile layer prevented the transition layer gravel from embedding in the rubber particles, which would cause discontinuous deformation during the settling of the structure. A 20-cm-thick transition layer of coarse aggregates was filled on the non-woven geotextile. The coarse aggregates were composed of artificial basalt gravel with a particle size of 5–40 mm. The physical properties of the coarse aggregates for the transition layer are shown in Table 1. The compression layer and transition layer were flattened and compacted. The polyurethane bonded aggregate cushion was directly poured onto the upper surface of the transition layer. The cushion was filled and rolled to a thickness of 6 cm by mixing basalt gravel (particle size of 5–20 mm) with Polyurethane glue using a 1.5% glue to bone ratio. The polyurethane bonded aggregate is a type of elastic material with an elastic modulus of 0.81 GPa [7]. The protective layer of concrete with a compressive strength of 30 MPa was prefabricated with formwork. The elastic modulus and Poisson’s ratio of the protective layer are 30 Gpa and 0.16, respectively. First, the composite geomembrane was laid at the bottom of the formwork. Then, the concrete was poured onto the surface of the composite geomembrane to ensure a good bonding interface between the concrete and the geotextile on the surface of the composite geomembrane. This procedure simulated an actual construction process. As shown in Figure 4, the composite geomembrane comprised two layers of 400 g/m2 filament needled geotextile and one layer of 0.8-mm-thick polythene geomembrane. The elastic modulus and Poisson’s ratio of geomembrane are 230 Mpa and 0.475, respectively. Fresh basalt coarse aggregates with a particle size of <20 mm were selected to prevent the situ-cast concrete from puncturing the composite geomembrane. The thickness of the protective layer in the model was 8 cm. The formwork was removed after 28 days of curing. Figure 5 show an image of the whole model before testing.

4. Results and Discussion

4.1. Distribution of the Top Flexible Uniform Pressure Load

In the test, the protective layer cracked and failed with the vertical failure load of 0.55 MPa when the relative deflection (i.e., the ratio of deflection and model length) of the bottom of the model reached 1/70. F the distribution curve of the measured vertical pressure values at the top of the structure under different theoretical uniform pressures before and after the failure of the protective layer. The horizontal coordinate “0” in Figure 6 show the center point of the protective layer in the length direction.
As shown in Figure 6, there were differences between the measured values and theoretical values of the pressures at the top of the protective layer before and after the failure of the protective layer. The measured value was greater than the theoretical value in the middle part of the protective layer and less than the theoretical values at both ends of the protective layer. The distribution of the measured pressure was more uneven with the increase in load. However, the maximum difference between the measured value and the theoretical value was <3%, which indicated that the flexible bag could provide an effective, flexible, and uniform pressure load.

4.2. Flexural Deformation of the Whole Model

The bottom boundary of the model had a large flexural deformation when a flexible uniform pressure load was applied to the top of the model. As the load increased, the flexural deformation transferred from the bottom of the transition layer to the top of the model. This transfer continued until the protective layer of concrete cracked and failed with a top load pressure of 0.55 MPa. The deformation was primarily concentrated in the transition layer before the cracking and failure of the protective layer. Figure 7 show the flexural deformation of the whole model before and after the failure of the protective layer. When the load reached 0.283 MPa, the maximum deflection of the bottom of the transition layer reached 9 mm. However, the protective layer and cushion layer had no obvious flexural deformations. When the protective layer failed, and the load reached 0.708 MPa, the maximum deflection of the bottom of the transition layer, cushion layer, and protective layer were 16 mm, 7 mm, and 4.5 mm, respectively.

4.3. Flexural Deformation at the Bottom of the Transition Layer

Figure 8 show the curve of the maximum deflection at the bottom of the transition layer. During the test, the curve changed with the uniform pressure load at the top of the model. Examinations of Figure 8 show that during the initial stage of loading, the maximum deflection at the bottom of the transition layer rapidly increased with the increasing load. Then, the growth rate stabilized and increased approximately linearly with increasing load. When the load reached 0.55 MPa, the maximum deflection started to rapidly increase and finally stabilized. When the bottom of the protective layer cracked, the maximum deflection of the bottom of the transition layer was 12 mm (i.e., relative deflection = 1/70). When the curve finally became horizontal, the maximum deflection was 17 mm (i.e., relative deflection = 1/49.4). It should be noted that obvious sheer and dislocation deformation can be observed in the coarse granular aggregates of the transition layer during the tests. That may result in dilatancy deformation [34] and affect the stress and deformation behavior of the upper cushion and geomembrane. However, the main focus of the experiment is to investigate the deformation behavior of the barrier, especially the cushion layer, composite geomembrane and protective layer. Therefore, no elaborate monitoring and analysis on the dilatancy behavior of the transition layer (granular material) were carried out in the test process. In future studies, more elaborate tests can be designed to study the effect of the dilatancy of granular cushion material on the deformation behavior of the geomembrane barrier.
By analyzing the mechanical and deformation characteristics of the entire structure, the rapid growth of the maximum deflection at the bottom of the transition layer during the initial stage was actually the compaction stage of the compression and the transition layers. When the compression layer and the transition layer became dense, the bottom particles started to unevenly settle because of the boundary conditions of the rigid arc base. This settlement was continuously transmitted to the top of the model. Thus, during this stage, the maximum deflection at the bottom of the transition layer linearly increased with the increasing load. When the load reached 0.55 MPa, the bottom of the protective layer cracked. The cracking of the protective layer led to a sudden decrease in the whole rigidity of the top three layers, and the deflection rapidly increased with the increasing load. However, because the bottom of the protective layer was bonded with the composite geomembrane, the composite geomembrane was subjected to tensile load when the bottom of the protective layer cracked. The tensile load limited the crack expansion; therefore, the maximum deflection stopped increasing and stabilized.

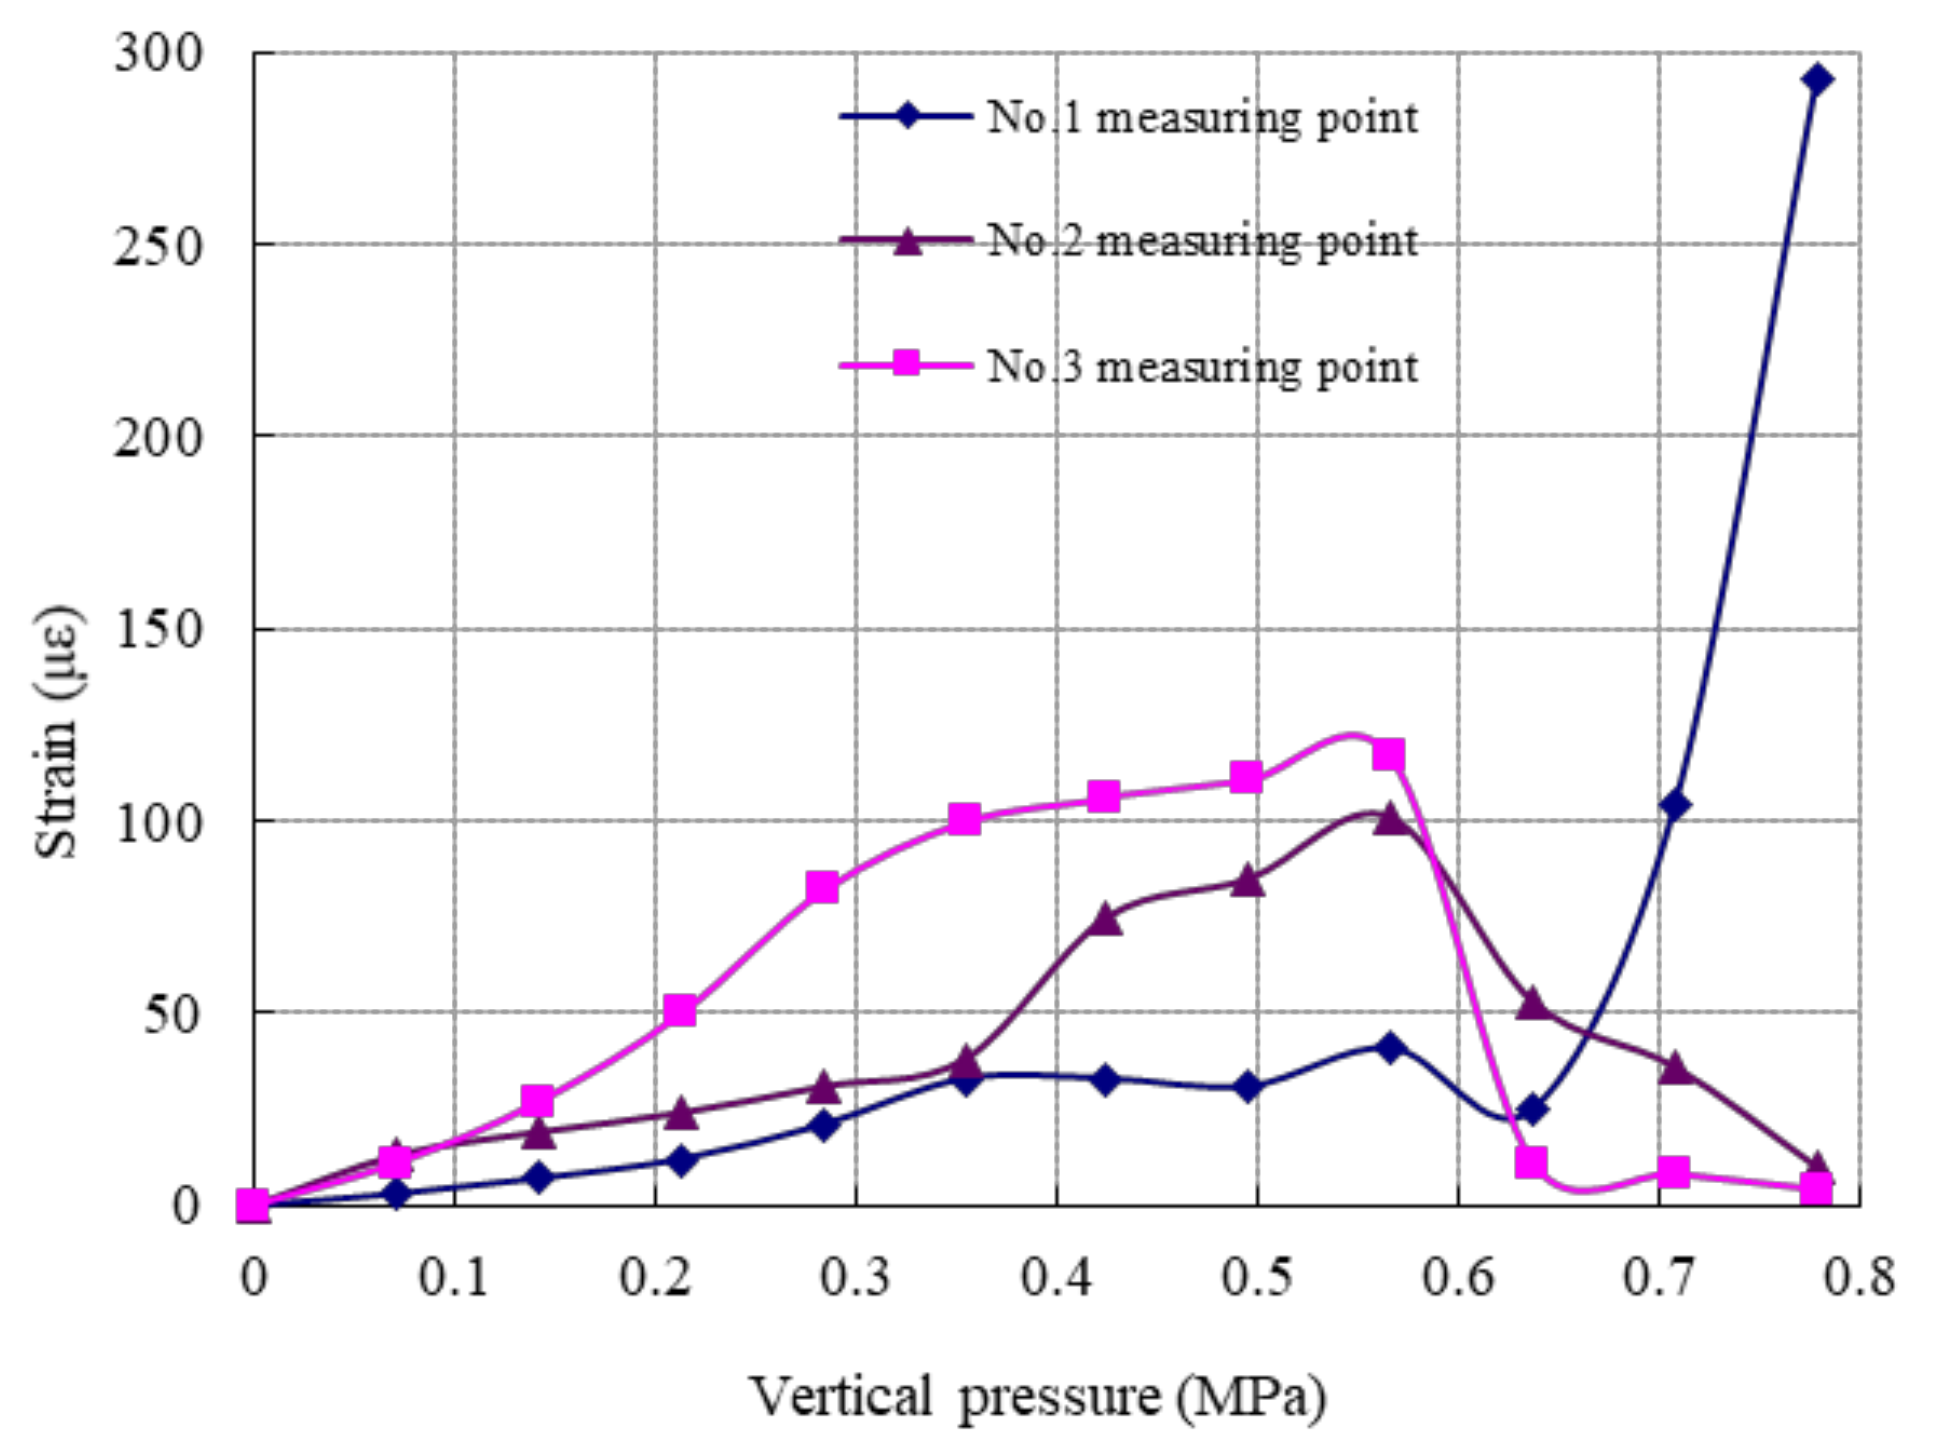
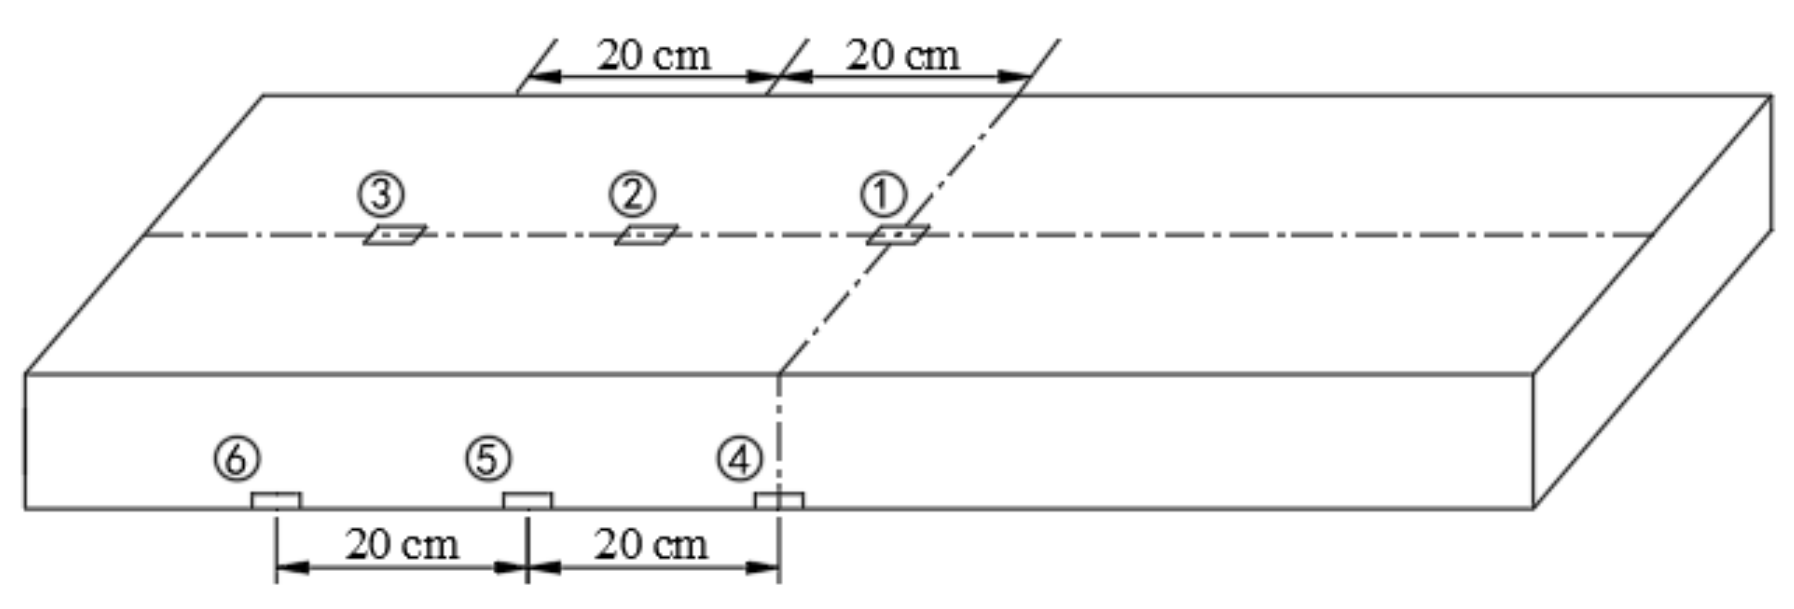
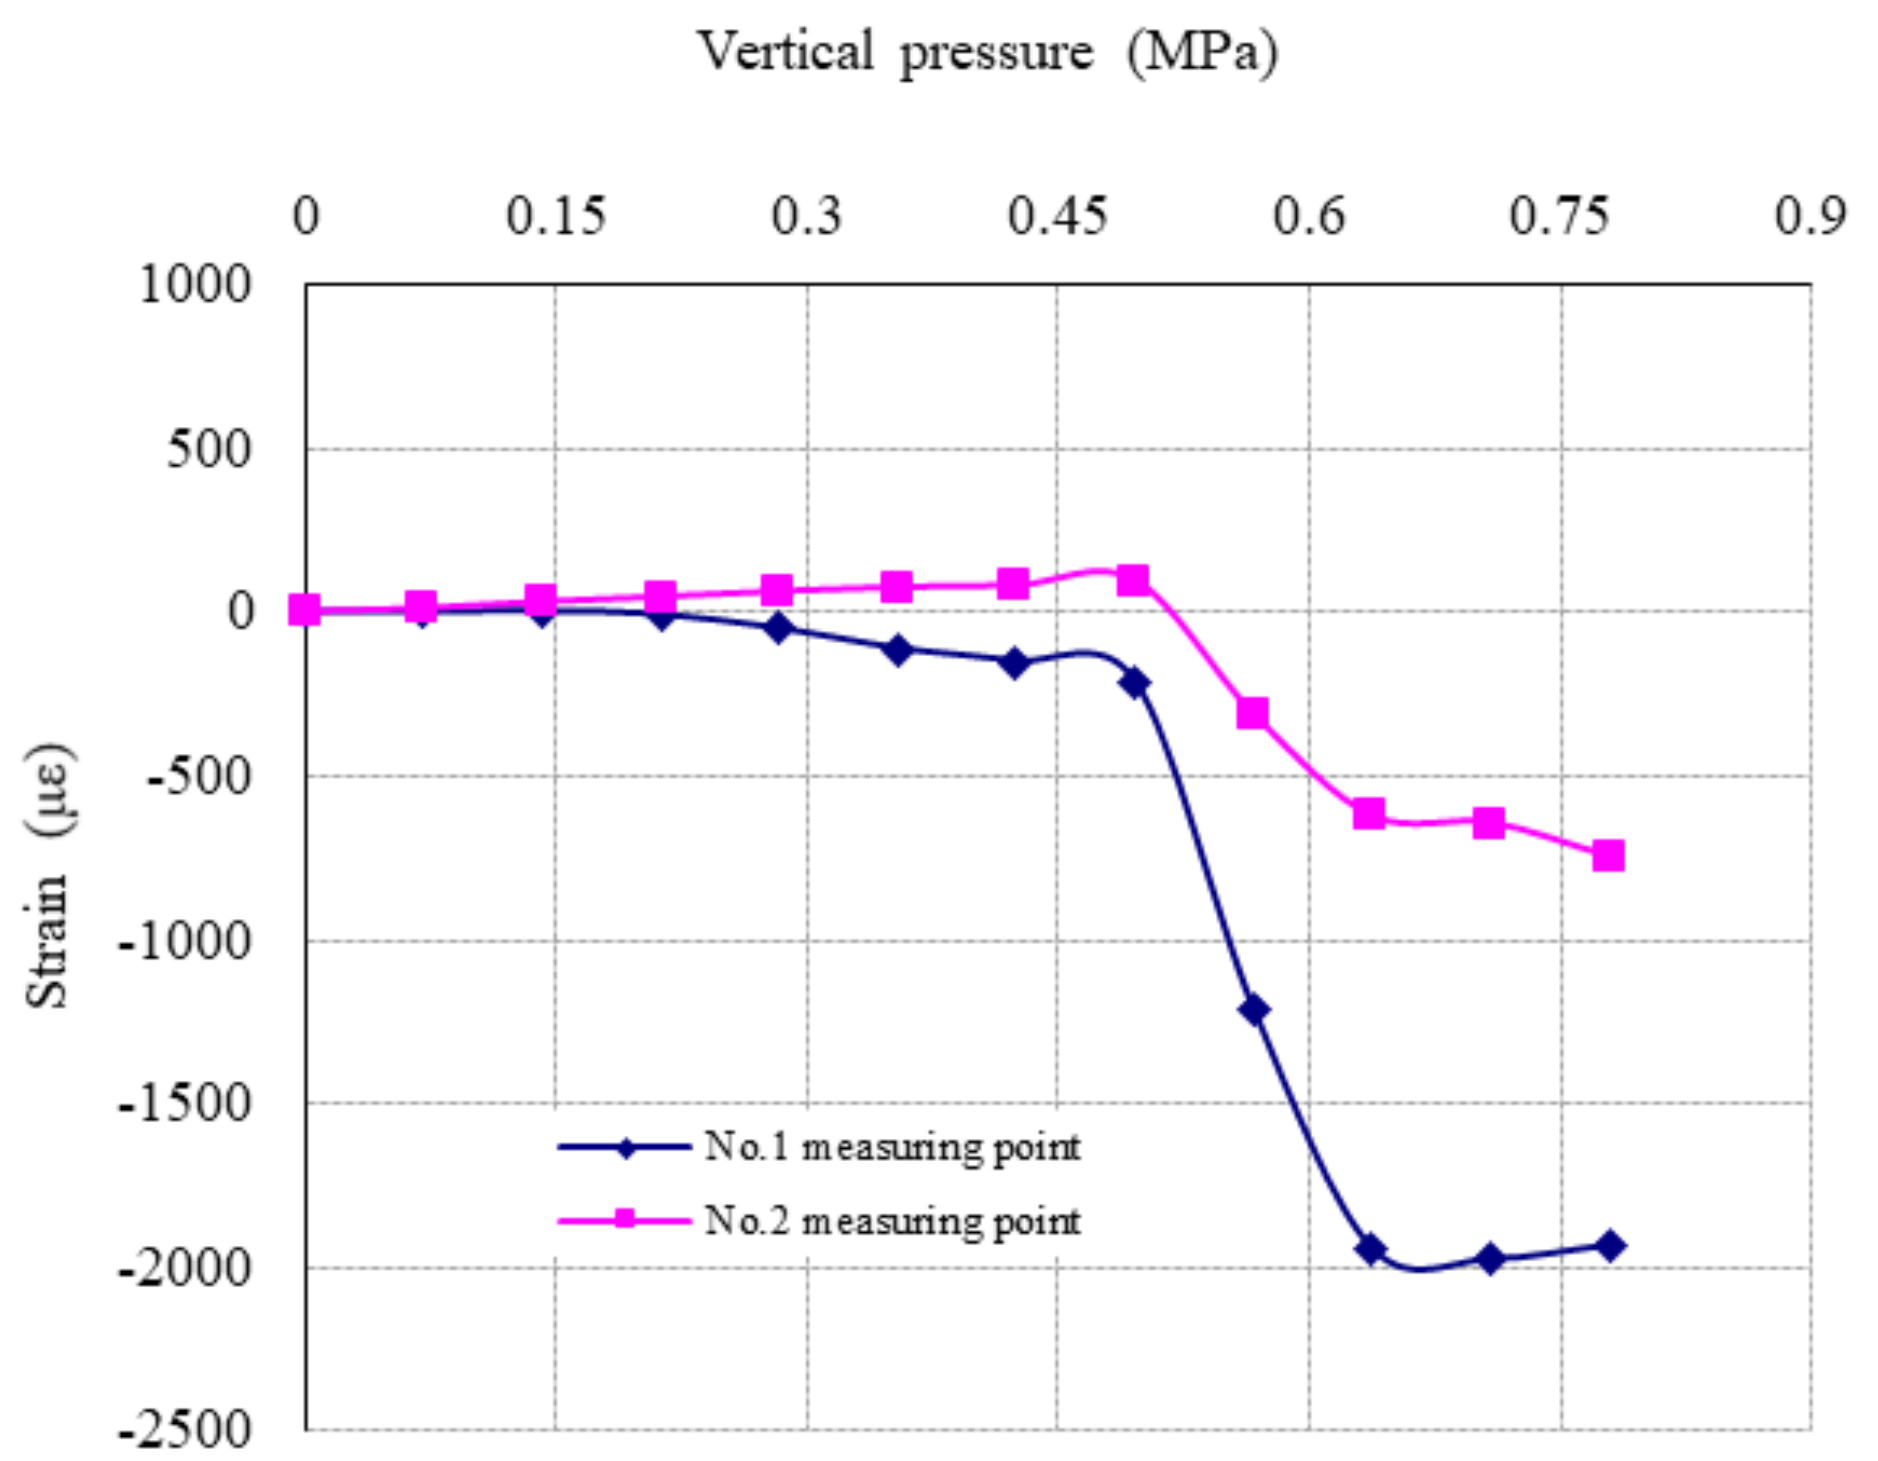
4.4. Deformation of the Composite Geomembrane

Figure 9 show the pasting position and number of strain gauges on the bottom surface of the geomembrane. Figure 10 show the curve of the measured strain at each measuring point on the surface of the geomembrane with the uniform load at the top of the model during the test.
Examination of Figure 10 indicated that the strain at each measuring point slowly increased with the increasing load during the initial loading stage. When the load reached 0.5–0.6 MPa, the strain at each measuring point suddenly changed. The strain at the No.1 measuring point rapidly increased and reached the maximum value of 295 με. Simultaneously, the strain at the No. 2 and No. 3 measuring points suddenly decreased. For the composite geomembrane in the model, the upper part comprised a rigid concrete protective layer. The lower part comprised a relatively flexible polyurethane bonded aggregate cushion along with the transition layer. In the initial stage of loading, the deflection of the upper rigid concrete protective layer was very small; however, the lower part was a flexible structure. Thus, the specific boundary conditions at the bottom of the model resulted in the normal pressures at both ends of the composite geomembrane being greater than that in the middle. The sheer force between composite geomembrane and cushion layers at both ends was greater than in the middle. Due to the sheer displacement between the composite geomembrane and cushion layer, the sheer force was transferred to the composite geomembrane. The strains at both ends of the composite geomembrane were greater than in the middle. When the load reached 0.55 MPa, the middle part at the bottom of the protective layer started to crack. This occurred where the composite geomembrane started to bear a larger tensile load, which caused the strain at the No.1 measuring point to suddenly increase. Due to the fact that the composite geomembrane and the protective layer were bonded together, there was no obvious sheer deformation between them under the large normal pressure. Thus, the sheer force was not transferred from the middle part to both ends. The middle part of the composite geomembrane bore more of the tensile load, and the tensile load at both ends decreased. Thus, the strain at the No. 2 and No. 3 measuring points suddenly decreased.

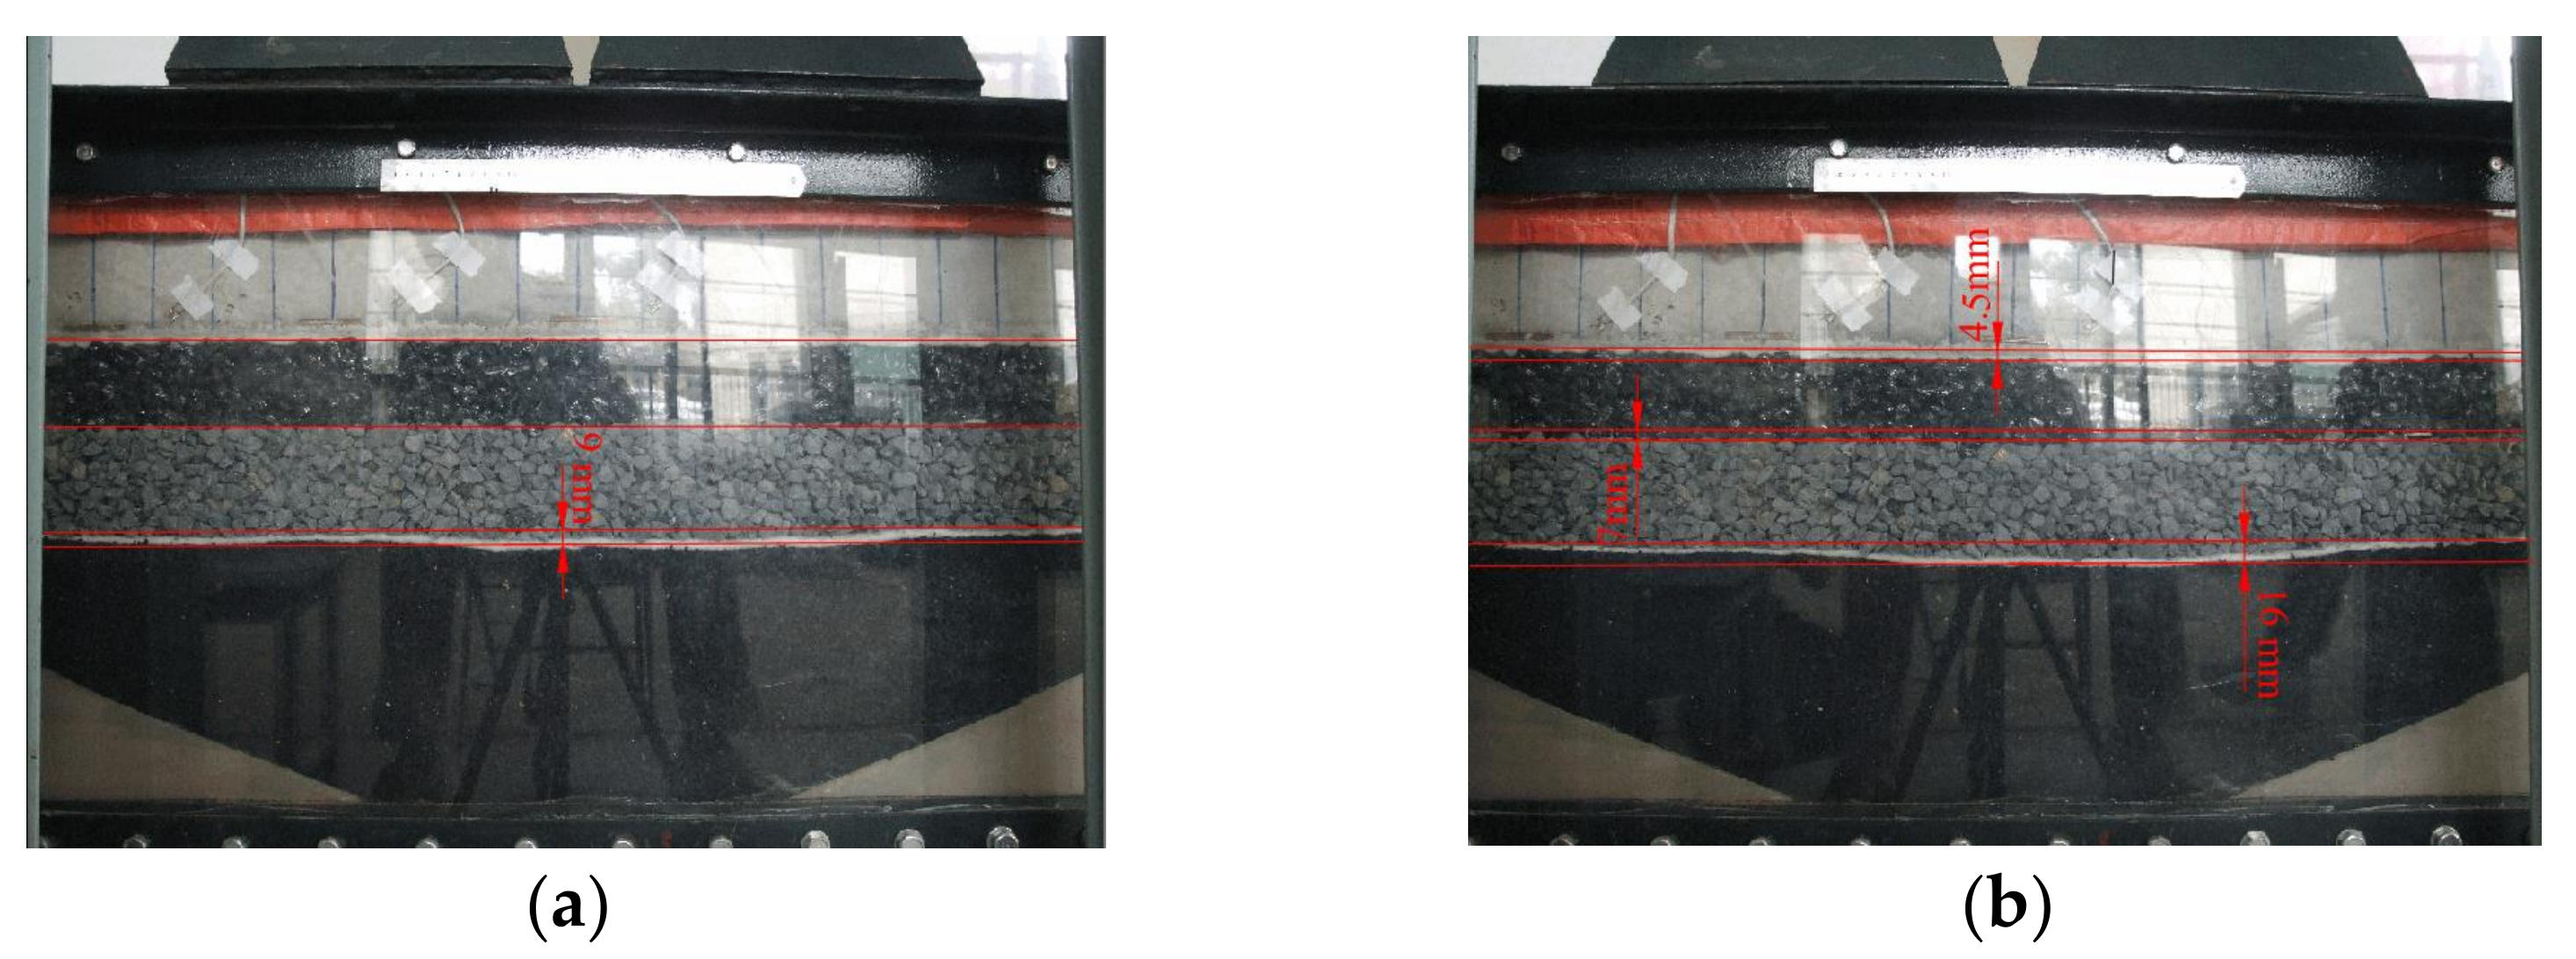
4.5. Deformation of the Cushion Layer

Figure 11 show the pasting position and number of strain gauges on the upper surface of the polyurethane bonded aggregate cushion layer. No data were collected at the No. 3 measuring point because of wiring damage during the process of model making. Figure 12 show the curve of the measured strain at each measuring point on the upper surface of the polyurethane bonded aggregate cushion layer with the uniform load at the top of the model during the test.
Examination of Figure 12 show that during the initial stage of loading, the No. 1 measuring point was under a compressive strain state, and the No. 2 measuring point was under a tensile strain state. However, the strain values at both measuring points were very small. The strain values at both measuring points on the surface of the cushion layer suddenly decreased when the load reached 0.5–0.6 MPa, resulting in a larger compressive strain. However, the strain stabilized with a further increase in load. This indicated that the deformation of the cushion layer was very small before the cracking of the protective layer. The deformation was attributed to the rigid displacement boundary condition imposed on the top of the cushion layer by the protective layer with large stiffness, which limited the flexural deformation of the cushion layer. When the load reached 0.5–0.6 MPa, the middle part of the bottom of the protective layer cracked. This forced the stiffness of the protective layer to decrease, and the relatively flexible cushion layer started to have flexural deformation, which caused the upper surface of the cushion layer to be under a compressive strain state. Then, the composite geomembrane at the bottom of the protective layer started to limit the propagation of the crack. The deformation of the protective layer tended to be stable. Moreover, the flexural deformation of the cushion layer stabilized because of the limitation of the protective layer. During the entire test process, the polyurethane bonded aggregate cushion layer demonstrated good flexibility. The cushion maintained good contact and coordinate deformation with the upper protective layer and the lower transition layer without dislocation or cracking failure.

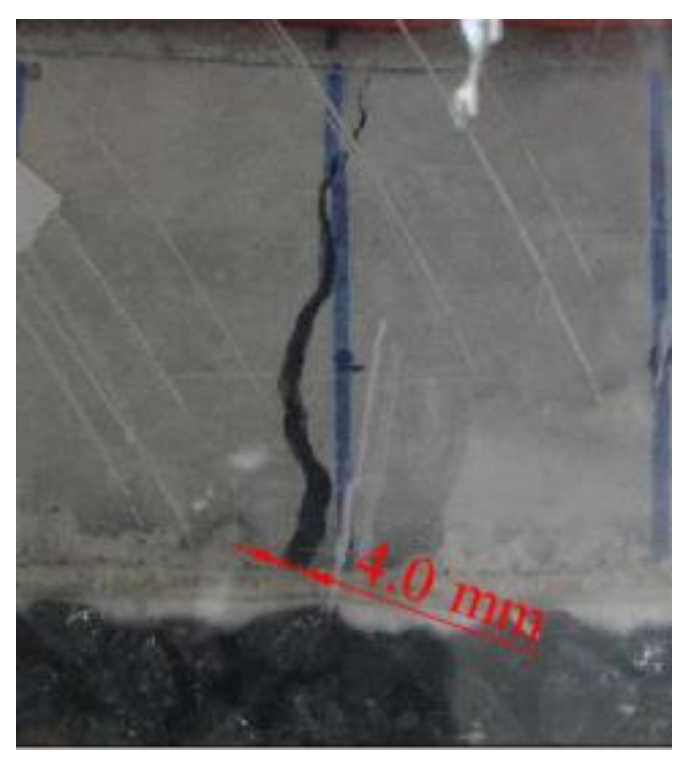
4.6. Deformation and Cracking of the Protective Layer

Figure 13 show the pasting position and number of strain gauges on the surface of the protective layer of concrete. No data were collected at the No. 6 measurement point because of a strain gauge failure during the process of model making. Figure 14 show the curve of the measured strain at each measuring point on the surface of the protective layer of concrete with the uniform load at the top of the model. During the initial stage, the No. 1, No. 2, and No. 3 measuring points on the upper surface of the protective layer were under a compressive strain state, which increased with increasing load. The No. 4 and No. 5 measuring points on the bottom side were under a tensile strain state. When the top load reached 0.5–0.6 MPa, the strain values at all five measuring points abruptly changed.
By analyzing the boundary conditions along with the mechanical and deformation characteristics of the protective layer, during the initial loading stage under uniform pressure, the protective layer was under a tension state at the bottom and a compression state at the top. Thus, the compressive strain was measured at the No. 1, No. 2, and No. 3 measuring points. The tensile strain was measured at the No. 4 and No. 5 measuring points. When the load reached 0.5–0.6 MPa, the measured value rapidly decreased to 0 because of cracking at the middle part of the bottom of the protective layer and the detachment failure of the strain gauge at the No. 1 measuring point. With the extension of the crack, the whole stiffness of the protective layer decreased, and the bending momentum decreased. Thus, with further increase in load, the deformation no longer increased, and the strain values at the No. 2, No. 3, No. 4, and No. 5 measuring points stabilized.
Under the top flexible pressure, the flexural deformation at the bottom of the model was continuously transmitted to the top. This caused the tensile stress at the middle part of the bottom of the protective layer to reach the tensile strength, which resulted in cracking and failure. With a further increase in load, the crack extended to the top, and the width of the crack increased. However, when the composite geomembrane was subjected to tensile load, the crack extension became restricted despite the increase in load. Figure 15 show the final cracks in the protective layer. The maximum width of the final cracks was 4.0 mm. The crack extended close to the top edge but did not fully penetrate. After cracking, the protection layer did not have dislocation deformation because of the limitation of the composite geomembrane and the suitable rigidity of the polyurethane bonded aggregate cushion layer at the bottom. Due to the limitation of the test conditions, the real water seepage pressure was not simulated. In a real situation, seepage pressure and the phreatic surface will develop in the granular transition layer and dam body if the protective layer cracks [35]. That may cause the larger flexural deformation of the cushion and lead to further tension failure of the geomembrane. Therefore, besides paying attention to the strength and deformation of the cushion and transition layer, the gradation of granular materials may be designed according to the requirements of seepage stability and filtration criteria.

5. Conclusions

This study proposed a geomembrane surface barrier for a high rockfill dam on deep overburden. The proposed geomembrane surface barrier uses polyurethane bonded aggregates as the cushion material. The mechanical and deformation property of the barrier under uniform water pressure was investigated using a self-developed structure model test device. The mechanical and deformation performances of each layer of the structure and the interaction mode between adjacent layers were obtained by external videos and internal sensor monitoring. The following conclusions were drawn:
(1)
Under the maximum uniform water pressure of 0.708 MPa, the cushion layer of polyurethane bonded aggregates showed good flexibility during the entire process of structural deformation. The cushion layer maintained good contact and coordinate deformation with the upper protective layer and the lower transition layer without discontinuous deformation (e.g., cracking, detachment, and dislocation). This confirmed that the polyurethane bonded aggregates are suitable as the cushion material for a geomembrane surface barrier for a high rockfill dam on deep overburden.
(2)
The protective layer cracked when the relative deflection at the bottom of the model reached 1/70. However, because the composite geomembrane at the bottom of the protective layer was subject to tensile load, the crack stopped expanding with the increasing load, and no through crack was formed. The protective layer of concrete was cast in situ on the composite geomembrane. The cement slurry completely infiltrated into the geotextile on the surface of the composite geomembrane during the setting process. This formed a good bonding interface between the protective layer and the composite geomembrane. There was no obvious dislocation or sheer displacement between the protective layer and the composite geomembrane during the process of flexural deformation of the entire structure.
(3)
There was sheer displacement between the composite geomembrane and the cushion layer of polyurethane bonded aggregates during the flexural deformation of the whole model. The sheer force between the protective layer and the cushion layer was transferred to the composite geomembrane, which made the composite geomembrane bear tensile stress and produced tensile strain. However, during the loading process of the model, the strain of the composite geomembrane was always very small. When the protective layer of the concrete cracked, the maximum tensile strain of the composite geomembrane was only 295 με. This low maximum tensile strain indicated that the surface barrier on the dam surface could ensure the safety of the composite geomembrane in the event of flexural deformation of the dam.

Author Contributions

Writing—original draft preparation, H.W.; writing—review and editing, L.F., Z.T. and Y.S.; All authors have read and agreed to the published version of the manuscript.

Funding

The research was supported by the National Natural Science Foundation of China (No. 51409083 and 51379069).

Institutional Review Board Statement

Not applicable.

Informed Consent Statement

Not applicable.

Data Availability Statement

Not applicable.

Acknowledgments

The authors would like to thank the anonymous referees whose comments helped us improve the presentation of this paper.

Conflicts of Interest

The authors declare no conflict of interest.

References

  1. Cazzuffi, D.; Giroud, J.P.; Scuero, A.; Vaschetti, G. Geosynthetic barriers systems for dams. In Proceedings of the 9th International Conference on Geosynthetics-Geosynthetics: Advanced Solutions for a Challenging World, Guarujá, Brazil, 23–27 May 2010. [Google Scholar]
  2. Wu, H.M.; Shu, Y.M. Stability of geomembrane surface barrier of earth dam considering strain-softening characteristic of geosynthetic interface. KSCE J. Civ. Eng. 2012, 16, 1123–1131. [Google Scholar] [CrossRef]
  3. Chindaprasirt, P.; Hatanaka, S.; Chareerat, T.; Mishima, N.; Yuasa, Y. Cement paste characteristics and porous concrete properties. Constr. Build. Mater. 2008, 22, 894–901. [Google Scholar] [CrossRef]
  4. Wu, H.M. Research on Key Problems in Geomembrane Surface Barrier of Rock-Fill Dam on Thick Riverbed Alluvial Deposit. Ph.D. Thesis, Hohai University, Nanjing, China, 2013. (In Chinese). [Google Scholar]
  5. Robert, C. Breakers lose their punch to PUR. Mod. Plast. Worldw. 2006, 83, 166. [Google Scholar]
  6. Lock, M.C.; van der Geest, H.G.; Lazonder, C. Early colonization of algal communities on polyurethane bonded aggregate: A field and laboratory study. J. Coast. Res. 2009, 56, 438–442. [Google Scholar]
  7. Wu, H.M.; Shu, Y.M.; Liu, Y.F. Engineering performance of polyurethane bonded aggregates. Mater. Sci. 2017, 23, 166–172. [Google Scholar] [CrossRef] [Green Version]
  8. Wilson-Fahmy, R.F.; Narejo, D.; Koerner, R.M. Puncture protection of geomembranes. Part I: Theory. Geosynth. Int. 1996, 3, 605–628. [Google Scholar] [CrossRef]
  9. Koerner, R.M.; Wilson-Fahmy, R.F.; Narejo, D. Puncture protection of geomembranes. Part III: Examples. Geosynth. Int. 1996, 3, 655–675. [Google Scholar] [CrossRef]
  10. Gudina, S.; Brachman, R.W.I. Physical response of geomembrane wrinkles overlying compacted clay. J. Geotech. Geoenviron. Eng. 2006, 132, 1346–1353. [Google Scholar] [CrossRef]
  11. Stark, T.D.; Boerman, T.R.; Connor, C.J. Puncture resistance of PVC geomembranes using the truncated cone test. Geosynth. Int. 2008, 15, 480–486. [Google Scholar] [CrossRef]
  12. Brachman, R.W.I.; Sabir, A. Geomembrane puncture and strains from stones in an underlying clay layer. Geotext. Geomembr. 2010, 28, 335–343. [Google Scholar] [CrossRef]
  13. Jiang, X.; Shu, Y.; Zhu, J. Probabilistic analysis of geomembrane puncture from granular material under liquid pressure. J. Cent. South Univ. 2013, 20, 3256–3264. [Google Scholar] [CrossRef]
  14. Jiang, X.; Shu, Y. Probabilistic analysis of random contact force between geomembrane and granular material. J. Cent. South Univ. 2014, 21, 3309–3315. [Google Scholar] [CrossRef]
  15. Jiang, X.; Tian, X. Bulge deformation of geomembrane in surface holes of cushion layers considering horizontal (tangential) displacement. Chin. J. Geotech. Eng. 2018, 40, 960–968. [Google Scholar] [CrossRef]
  16. Michalowski, R.L.; Shi, L. Deformation patterns reinforced foundation sand at failure. J. Geotech. Geoenviron. Eng. 2003, 129, 439–449. [Google Scholar] [CrossRef]
  17. Lee, Y.J.; Bassett, R.H. Application of a photogrammetric technique to a model tunnel. Tunn. Undergr. Space Technol. 2006, 21, 79–95. [Google Scholar] [CrossRef]
  18. Molins, C.; Arnau, O. Experimental and analytical study of the structural response of segmental tunnel linings based on an in situ loading test. Part 1: Test configuration and execution. Tunn. Undergr. Space Technol. 2011, 26, 764–777. [Google Scholar] [CrossRef] [Green Version]
  19. Zhang, M.; Vardcharragosad, P.; Ayala, L.P.H. The similarity theory applied to early-transient gas flow analysis in unconventional reservoirs. J. Nat. Gas Sci. Eng. 2014, 21, 659–668. [Google Scholar] [CrossRef]
  20. Kakinuma, T.; Shimizu, Y. Large-scale experiment and numerical modeling of a riverine levee breach. J. Hydraul. Eng. 2014, 140, 04014039. [Google Scholar] [CrossRef]
  21. Sharma, J.S.; Bolton, M.D. Centrifugal and numerical modelling of reinforced embankments on soft clay installed with wick drains. Geotext. Geomembr. 2001, 19, 23–44. [Google Scholar] [CrossRef]
  22. Wang, L.P.; Zhang, G.; Zhang, J.M. Centrifuge model tests of geotextile-reinforced soil embankments during an earthquake. Geotext. Geomembr. 2011, 29, 222–232. [Google Scholar] [CrossRef]
  23. Higo, Y.; Lee, C.-W.; Doi, T.; Kinugawa, T.; Kimura, M.; Kimoto, S.; Oka, F. Study of dynamic stability of unsaturated embankments with different water contents by centrifugal model tests. Soils Found. 2015, 55, 112–126. [Google Scholar] [CrossRef] [Green Version]
  24. Zhang, C.-L.; Jiang, G.-L.; Liu, X.-F.; Su, L.-J. Centrifuge modelling and analysis of ground reaction of high-speed railway embankments over medium compressibility ground. KSCE J. Civ. Eng. 2018, 22, 4826–4840. [Google Scholar] [CrossRef]
  25. Franke, E. Applicability of 1-g model tests in three cases. In Proceedings of the 12th International Conference on Soil Mechanics and Foundation Engineering, Rio je Janeiro, Brazil, 13–18 August 1989. [Google Scholar]
  26. Schober, W.; Hammer, H.; Hupfauf, B. Load transfer in embankment dams-model testing. In Proceedings of the 12th International Conference on Soil Mechanics and Foundation Engineering, Rio je Janeiro, Brazil, 13–18 August 1989. [Google Scholar]
  27. Moor, D.; Taylor, R.N. Model studies of the behavior of deep tunnels in clay. In Proceedings of the 12th International Conference on Soil Mechanics and Foundation Engineering, Rio je Janeiro, Brazil, 13–18 August 1989. [Google Scholar]
  28. Tunsakul, J.; Jongpradist, P.; Kongkitkul, W.; Wonglert, A.; Youwai, S. Investigation of failure behavior of continuous rock mass around cavern under high internal pressure. Tunn. Undergr. Space Technol. 2013, 34, 110–123. [Google Scholar] [CrossRef]
  29. Jongpradist, P.; Tunsakul, J.; Kongkitkul, W.; Fadsiri, N.; Arangelovski, G.; Youwai, S. High internal pressure induced fracture patterns in rock masses surrounding caverns: Experimental study using physical model tests. Eng. Geol. 2015, 197, 158–171. [Google Scholar] [CrossRef]
  30. Shigemura, S.; Tokue, T. Limit equilibrium analysis considering deformation of shear band in model slope. In Advances in Earth Structures: Research to Practice, Proceedings of the GeoShanghai Conference, Shanghai, China, 6–8 June 2006; American Society of Civil Engineers: Reston, VA, USA, 2006. [Google Scholar]
  31. Fukuhara, M.; Tao, S.; Uchimura, T. Multi-layered shear model test to simulate rain-induced pre-failure shear deformation in surface layer of slopes. In Proceedings of the 16th Asian Regional Conference on Soil Mechanics and Geotechnical Engineering, Taipei, Taiwan, 14–18 November 2019. [Google Scholar]
  32. Waichita, S.; Jongpradist, P. Investigation on the effects of wall slenderness on failure behavior of DCM wall using a simplified small-scale physical model test. In Proceedings of the 4th International Conference on Geotechnics for Sustainable Infrastructure Development (GEOTEC HANOI), Hanoi, Vietnam, 28–29 November 2019. [Google Scholar]
  33. Wu, H.M.; Shu, Y.M.; Dai, L.J.; Teng, Z.M. Mechanical behavior of interface between composite geomembrane and permeable cushion material. Adv. Mater. Sci. Eng. 2014, 2014, 184359. [Google Scholar] [CrossRef] [Green Version]
  34. Mehdizadeh, A.; Disfani, M.M.; Evans, R.; Arulrajah, A.; Ong, D.E.L. Discussion of ‘development of an internal camera-based volume determination system for triaxial testing’. Geotech. Test. J. 2016, 39, 165–168. [Google Scholar] [CrossRef]
  35. Ong, D.E.L.; Sim, Y.S.; Leung, C.F. Performance of field and numerical back-analysis of floating stone columns in soft clay considering the influence of dilatancy. Int. J. Geomech. 2018, 18, 1–16. [Google Scholar] [CrossRef] [Green Version]
Figure 1. The proposed geomembrane surface barrier for a high rockfill dam ((a) protective layer; (b) composite geomembrane; (c) cushion layer; (d) transition layer; and (e) rockfill).
Applsci 11 11505 g001
Figure 2. The schematic diagram of the model test.
Applsci 11 11505 g002
Figure 3. Structure and dimension of the model box.
Applsci 11 11505 g003
Figure 4. The picture of the composite geomembrane.
Applsci 11 11505 g004
Figure 5. The picture of the model test.
Applsci 11 11505 g005
Figure 6. Pressure distribution at the top of the structure before and after the failure of the protective layer (a) Before the failure of the protective layer (theoretical uniform pressure = 0.425 MPa); (b) After the failure of the protective layer (theoretical uniform pressure = 0.708 MPa).
Applsci 11 11505 g006
Figure 7. The flexural deformation of the whole model (a) Before the failure of the protective layer (theoretical uniform pressure = 0.283 MPa); (b) After the failure of the protective layer (theoretical uniform pressure = 0.708 MPa).
Applsci 11 11505 g007
Figure 8. Maximum deflection-load curve at the bottom of the transition layer.
Applsci 11 11505 g008
Figure 9. Position of strain gauges on the bottom surface of the composite geomembrane. (①—position of measuring point No. 1; ②—position of measuring point No. 2; ③—position of measuring point No. 3).
Applsci 11 11505 g009
Figure 10. Strain-load curve of each measuring point on the bottom surface of the composite geomembrane.
Applsci 11 11505 g010
Figure 11. Position of strain gauges on the upper surface of the cushion layer. (①—position of measuring point No. 1; ②—position of measuring point No. 2; ③—position of measuring point No. 3).
Applsci 11 11505 g011
Figure 12. Strain-load curve of each measuring point on the upper surface of the cushion layer.
Applsci 11 11505 g012
Figure 13. Position of strain gauges on the surface of the protective layer. (①—position of measuring point No. 1; ②—position of measuring point No. 2; ③—position of measuring point No. 3; ④—position of measuring point No. 4; ⑤—position of measuring point No. 5; ⑥—position of measuring point No. 6).
Applsci 11 11505 g013
Figure 14. Strain-load curve of each measuring point on the surface of the protective layer.
Applsci 11 11505 g014
Figure 15. Final cracks of the protective layer of concrete.
Applsci 11 11505 g015
Table 1. Physical properties of transition layer for tests.
Size Range
(mm)
d50
(mm)
CuCcρd
(g/cm3)
Φ
(°)
5–40124.32.51.83047.6
Publisher’s Note: MDPI stays neutral with regard to jurisdictional claims in published maps and institutional affiliations.

