Article

Lipid Fraction Properties of Homemade Raw Cat Foods and Selected Commercial Cat Foods

Department of Chemistry, Institute of Food Sciences, Warsaw University of Life Sciences, 02-787 Warsaw, Poland
*
Author to whom correspondence should be addressed.
Appl. Sci. 2021, 11(22), 10905; https://doi.org/10.3390/app112210905
Submission received: 9 June 2021 / Revised: 30 September 2021 / Accepted: 16 November 2021 / Published: 18 November 2021

Abstract

:
The purpose of the present study was to characterize lipid fraction extracted from five self-prepared and seven commercial cat foods using gas chromatography (GC) and pressurized differential scanning calorimetry (PDSC) techniques. Self-prepared food recipes were composed using BARFny kalkulator, software dedicated for balancing cat diets, and prepared on the basis of fresh raw meat and offal. Extracted fat fractions were compared qualitatively and quantitatively with literature data for the fat of whole prey items to check the main assumptions of the software used. The fatty acid (FA) composition and distribution were determined using GC. The PDSC method was used for the determination of the oxidative stability of extracted fats. The obtained results indicate that self-prepared cat foods contained a high level of essential fatty acids (EFA) but low oxidative stability, especially for those with significant amounts of polyunsaturated FA. The FA profile and oxidative stability were examined for four dry and three wet commercial cat foods. It was found that their omega-6 to omega-3 ratio was beneficial reaching 5.3:1 to 10.1:1, despite the low amount of EFA. The longer induction time was determined for fats extracted from commercial cat foods than for self-prepared ones, which indicate their higher oxidative stability.

1. Introduction

Most cat owners feed their pets with commercial cat food because it is convenient and economical; however, over the last decade, the use of alternative diets, such as BARF (bone and raw food/biologically appropriate raw food), other raw meat-based diets, home-cooked diets and whole prey model diets have become more popular [1,2,3]. These raw food diets are often used by owners who have concerns about the wholesomeness and nutritional value of the ingredients used in commercial pet food. However, formulating a complete and balanced pet food needs knowledge about the nutritional requirements of cats.
In the literature, it is hard to find studies in which the nutrient composition of raw meat-based foods was examined by analytical techniques. It was only found that Kerr et al. [4,5] and Hamper et al. [6] examined the chemical composition of several raw meat-based diets for cats as well as the digestibility of these foods in cats and kittens. Most publications related to raw meat-based food for cats usually only present theoretical considerations on the impact of this type of food on the health of cats, along with its advantages and disadvantages [2,7,8,9,10]. Wilson et al. [10] performed computerized assessments of several types of homemade cat recipes, including some raw recipes, using the balancing software (Balance IT) available online. Laboratory analysis could confirm the correctness of the computerized assessment, but unfortunately, they were not performed. To the best of our knowledge, this is the first study dealing with the experimental research of the self-prepared cat food lipid fraction. The software used to compose the diets was BARFny kalkulator—a nutrition-balancing software, similar to the Balance IT used by Wilson et al. [10].
Fat typically provides most of the energy, increases the palatability of food [11,12], is a carrier of fat-soluble vitamins and is a source of essential fatty acids (EFA) for cats, which are recognized as obligate carnivores. The EFA for cats are linoleic (LA), alpha-linolenic (ALA) and arachidonic (AA) acids. The conditionally EFA are eicosapentaenoic (EPA) and docosahexaenoic (DHA) acids. They are responsible, among others, for skin and coat condition, kidney function and reproduction [13,14,15].
Triacylglycerols (TAG) are the predominant component of most dietary fats and oils. Identification and quantitative analysis of the composition of TAG is the first step in evaluating the quality of fats when considering their nutritional effects [16]. The distribution of FA in TAG molecules is particularly important in the process of their digestion and absorption in the gastrointestinal tract. The rate of hydrolysis at the sn-2 position of TAG is very slow and the FA in the sn-2 position remain intact as 2-monoacylglycerols during digestion and absorption. FA located in the sn-1 and sn-3 positions are preferentially hydrolyzed, leaving a 2-monoacylglycerol [17]. Free FA are long chain saturated if released; they form acid–calcium soaps that are insoluble in aqueous media at the pH of the intestine, which causes impaired absorption of both SFA and calcium [17,18]. Calcium loss can affect Ca:P ratio in the diet, which can be associated with kidney damage in cats [19,20].
One of the most important parameters in the characterization of fats and oils is oxidative stability. Lipid oxidation is a major challenge to pet food preservation [21]. It determines the final quality and nutritional properties of the food product because it is the main reaction responsible for their degradation [22]. In food chemistry, pressurized differential scanning calorimetry (PDSC) is a convenient, reproducible and fast method used to determine the oxidative stability of fats and oils [23,24]. Moreover, it is a nonchemical method without the time-consuming processing of test samples and it requires a small amount of sample (a few milligrams) for analysis [25,26]. This technique has already been used in the studies of fat extracted from dry pet foods [27,28].
The aim of our study is to characterize the lipid fraction properties of homemade cat foods and present it in light of FA composition and oxidative stability data obtained for selected dry and wet commercial cat foods.

2. Material and Methods

2.1. Chemicals

All the solvents and reagents were of chromatographic or analytical grade and purchased from Avantor Performance Materials Poland S.A. (Gliwice, Poland), except for the standard compounds, bile salts and lipase from porcine pancreas (type II), which were supplied by Sigma–Aldrich (Saint Louis, MO, USA).

2.2. Self-Prepared Cat Foods

Five self-prepared food recipes (Supplemental Materials) were composed using a software for balancing cat diets called the BARFny kalkulator (https://www.barfnyswiat.org/viewtopic.php?t=896—accessed on 28 February 2018). The tool was designed according to the authors’ knowledge in this term and it is based on available data of the composition of raw skeletal muscles, internal organs, poultry bones, fish, as well as supplements. It also shows the cats’ nutrient requirements. According to the author statement, BARFny kalkulator is mainly based on requirements from four sources [29,30,31,32].
The prepared diets differed primarily in the origin of the meat. They were based on poultry and/or beef (a source of easily digestible and nutritious protein, rich in taurine, iron, zinc and B vitamins, which contains tendons, veins and tallow). Two diets contained one meat ingredient: SP-2—turkey and SP-5—beef, and three of them contained two meat ingredients: SP-1—chicken and beef, SP-3—chicken and turkey and SP-4—chicken and duck (the complete composition of the diets can be found in the Supplementary File). The meat was purchased in a local grocery. The type of meat in the diet was selected taking into account its nutritional value, palatability for cats, popularity of use by cat owners and their easy access. Supplements (source of vitamins and minerals) were purchased online (https://www.lunderland.org/; http://pokusa.org/ accessed on 28 February 2018) and Tokovit E in a local pharmacy.
The fat content in the diet-balancing software used in these studies was set at 20–38% of dry matter, and the dry matter content was set as 25% for all samples. Authors suggest to maintain protein:fat ratio at about 2:1. Following these tips, the fat content in self-prepared foods (SP-1–SP-5) calculated by this software was around 30% (Table 1).
Each diet was prepared three times as follows:
-
The fresh meat was ground twice;
-
To balance the food, additives such as hemoglobin, salmon oil, egg shell meal, etc. were added with water to ground meat in the amount determined by the BARFny kalkulator for a given mass of this meat (the addition of egg yolks, salmon oil and vitamin E was the same for all diets);
-
All ingredients are thoroughly mixed with each other. Each food sample was made in greater scale, portioned and frozen.
Self-prepared cat foods were designed as SP (1–5). All tested foods are listed in Table 1 with an indication of their main animal ingredients and fat content in dry matter.

2.3. Commercial Cat Foods

Seven commercial dry and wet foods for cats were used in this study. Three packs of each food were purchased in different local specialized pet stores in order to avoid the same lots of food. Each food was a mid-priced product of a different popular brand, dedicated for adult cats and unexpired. Commercial foods were based on commonly used ingredients in the pet food industry, such as poultry and fish meal, dehydrated and hydrolyzed proteins, animal fat, meat and animal by-products and plants. The complete composition of each diet can be found in the Supplementary File.
Research was not sponsored by any of the commercial diet manufacturers. Commercial diets were identified by code letters to preserve the privacy of the manufacturers. Dry foods were designed as CD (1–4) and wet foods as CW (5–7). All tested foods are listed in Table 2.

2.4. Fat Extraction and Dry Matter Determination

Fat was extracted using Folch’s method, according to the procedure described by Boselli et al. [33]. Extraction was done immediately after both methods by opening commercial foods and thawing self-prepared ones. Extraction was performed in triplicate for a given diet by conducting one for each representative sample.
The dry matter of self-prepared and commercial cat food samples was obtained by their oven-drying for 24 h at 105 °C in an electrically heated laboratory oven type SLN 115 STD (Pol-Eko-Aparatura) in triplicate.

2.5. GC Measurements

The determination of FA composition in the examined samples was carried out by a GC analysis of FA methyl esters. They were prepared through esterification with KOH/methanol (1M) according to ISO 5509:2001. An YL6100 GC chromatograph equipped with a flame ionization detector and BPX70 capillary column of 60 m (length) × 0.25 mm (internal diameter) × 0.25 μm (film thickness) was used. The oven temperature was programmed as follows: an initial temperature of 70 °C was maintained for 0.5 min, then it was increased by 15 °C min−1 to 160 °C, then from 160 °C to 200 °C it was increased by 1.1 °C min−1, then kept at 200 °C for 6 min, then in the next step from 200 °C to 225 °C it was increased by 30 °C min−1 and kept at 225 °C another 1 min. The temperature of the injector was 225 °C (with a split ratio of 1:50) and the detector temperature was 250 °C. The carrier gas was nitrogen, at a flow rate of 1.2 mL min−1. For each sample measurements were carried out three times. The results were expressed as relative percentages of each fatty acid. Reference fatty acid methyl esters from Sigma–Aldrich were used as standards for identification and quantitation purposes.

2.6. TAG Hydrolysis

In order to define the positional distribution of FA in the sn-2 and sn-1,3 positions of the TAG molecule, hydrolysis in the presence of pancreatic lipase was applied. Briefly, 0.1 g of fat sample was mixed with 1 mL of Tris buffer (1 mol L−1 and pH = 8), 0.1 mL of CaCl2 (2.2%) and 0.25 mL aqueous solution of bile salts (0.05%). After 30 s of mixing, 20 mg of purified pancreatic lipase (porcine pancreatic lipase, crude type II) was added. The samples were placed in a water bath for 3 min at 40 °C. After incubation, the reaction was stopped by adding 1 mL of hydrochloric acid (6 mol L−1) and 4 mL of diethyl ether. The products obtained as a result of hydrolysis were analyzed by extraction from the reaction mixture and separation by thin-layer chromatography with hexane/diethyl ether/acetic acid (50:50:1, v:v:v). The 2-monoacylglycerol band was removed from silica gel plates, extracted with diethyl ether, converted to methyl esters, as mentioned above, and quantified by GC. Under reaction conditions, there was little or no hydrolysis of the esters’ secondary hydroxyl groups by pancreatic lipase [34].

2.7. PDSC Measurements

The oxidative stability of fats extracted from commercial and homemade cat foods was determined using a differential scanning calorimeter (DSC Q20, TA Instruments, New Castle, DE, USA) coupled with a high-pressure cell (Q20P). Weighed fat samples (3–4 mg) were placed on an open aluminum pan in the heating sample chamber of the PDSC cell. Experiments were performed under oxygen atmosphere with an initial pressure of 1380 kPa and with the 100 mL min−1 gas flow rate. The isothermal temperature for each sample was programmed at 100 °C. Obtained diagrams were analyzed using TA Universal Analysis 2000 software. For each sample, measurements were carried out three times, and the maximum oxidation time was determined based on the maximum rate of heat flow with an accuracy of 0.005.
The maximum PDSC oxidation and induction time (τmax) was determined on the basis of the maximum rate of oxidation (maximum rate of heat flow) for all fats extracted from commercial and self-prepared cat foods.

2.8. Statistical Analysis

The statistical analysis was performed using the Stargraphics Plus, version 4.1 software. The collected data were statistically processed using the one–way analysis of variance ANOVA. Differences were considered to be significant at a p-value ≤ 0.05, according to Tukey’s Multiple Range Test. Three samples of each food were used for the analysis. All analyses were conducted in triplicate.

3. Results

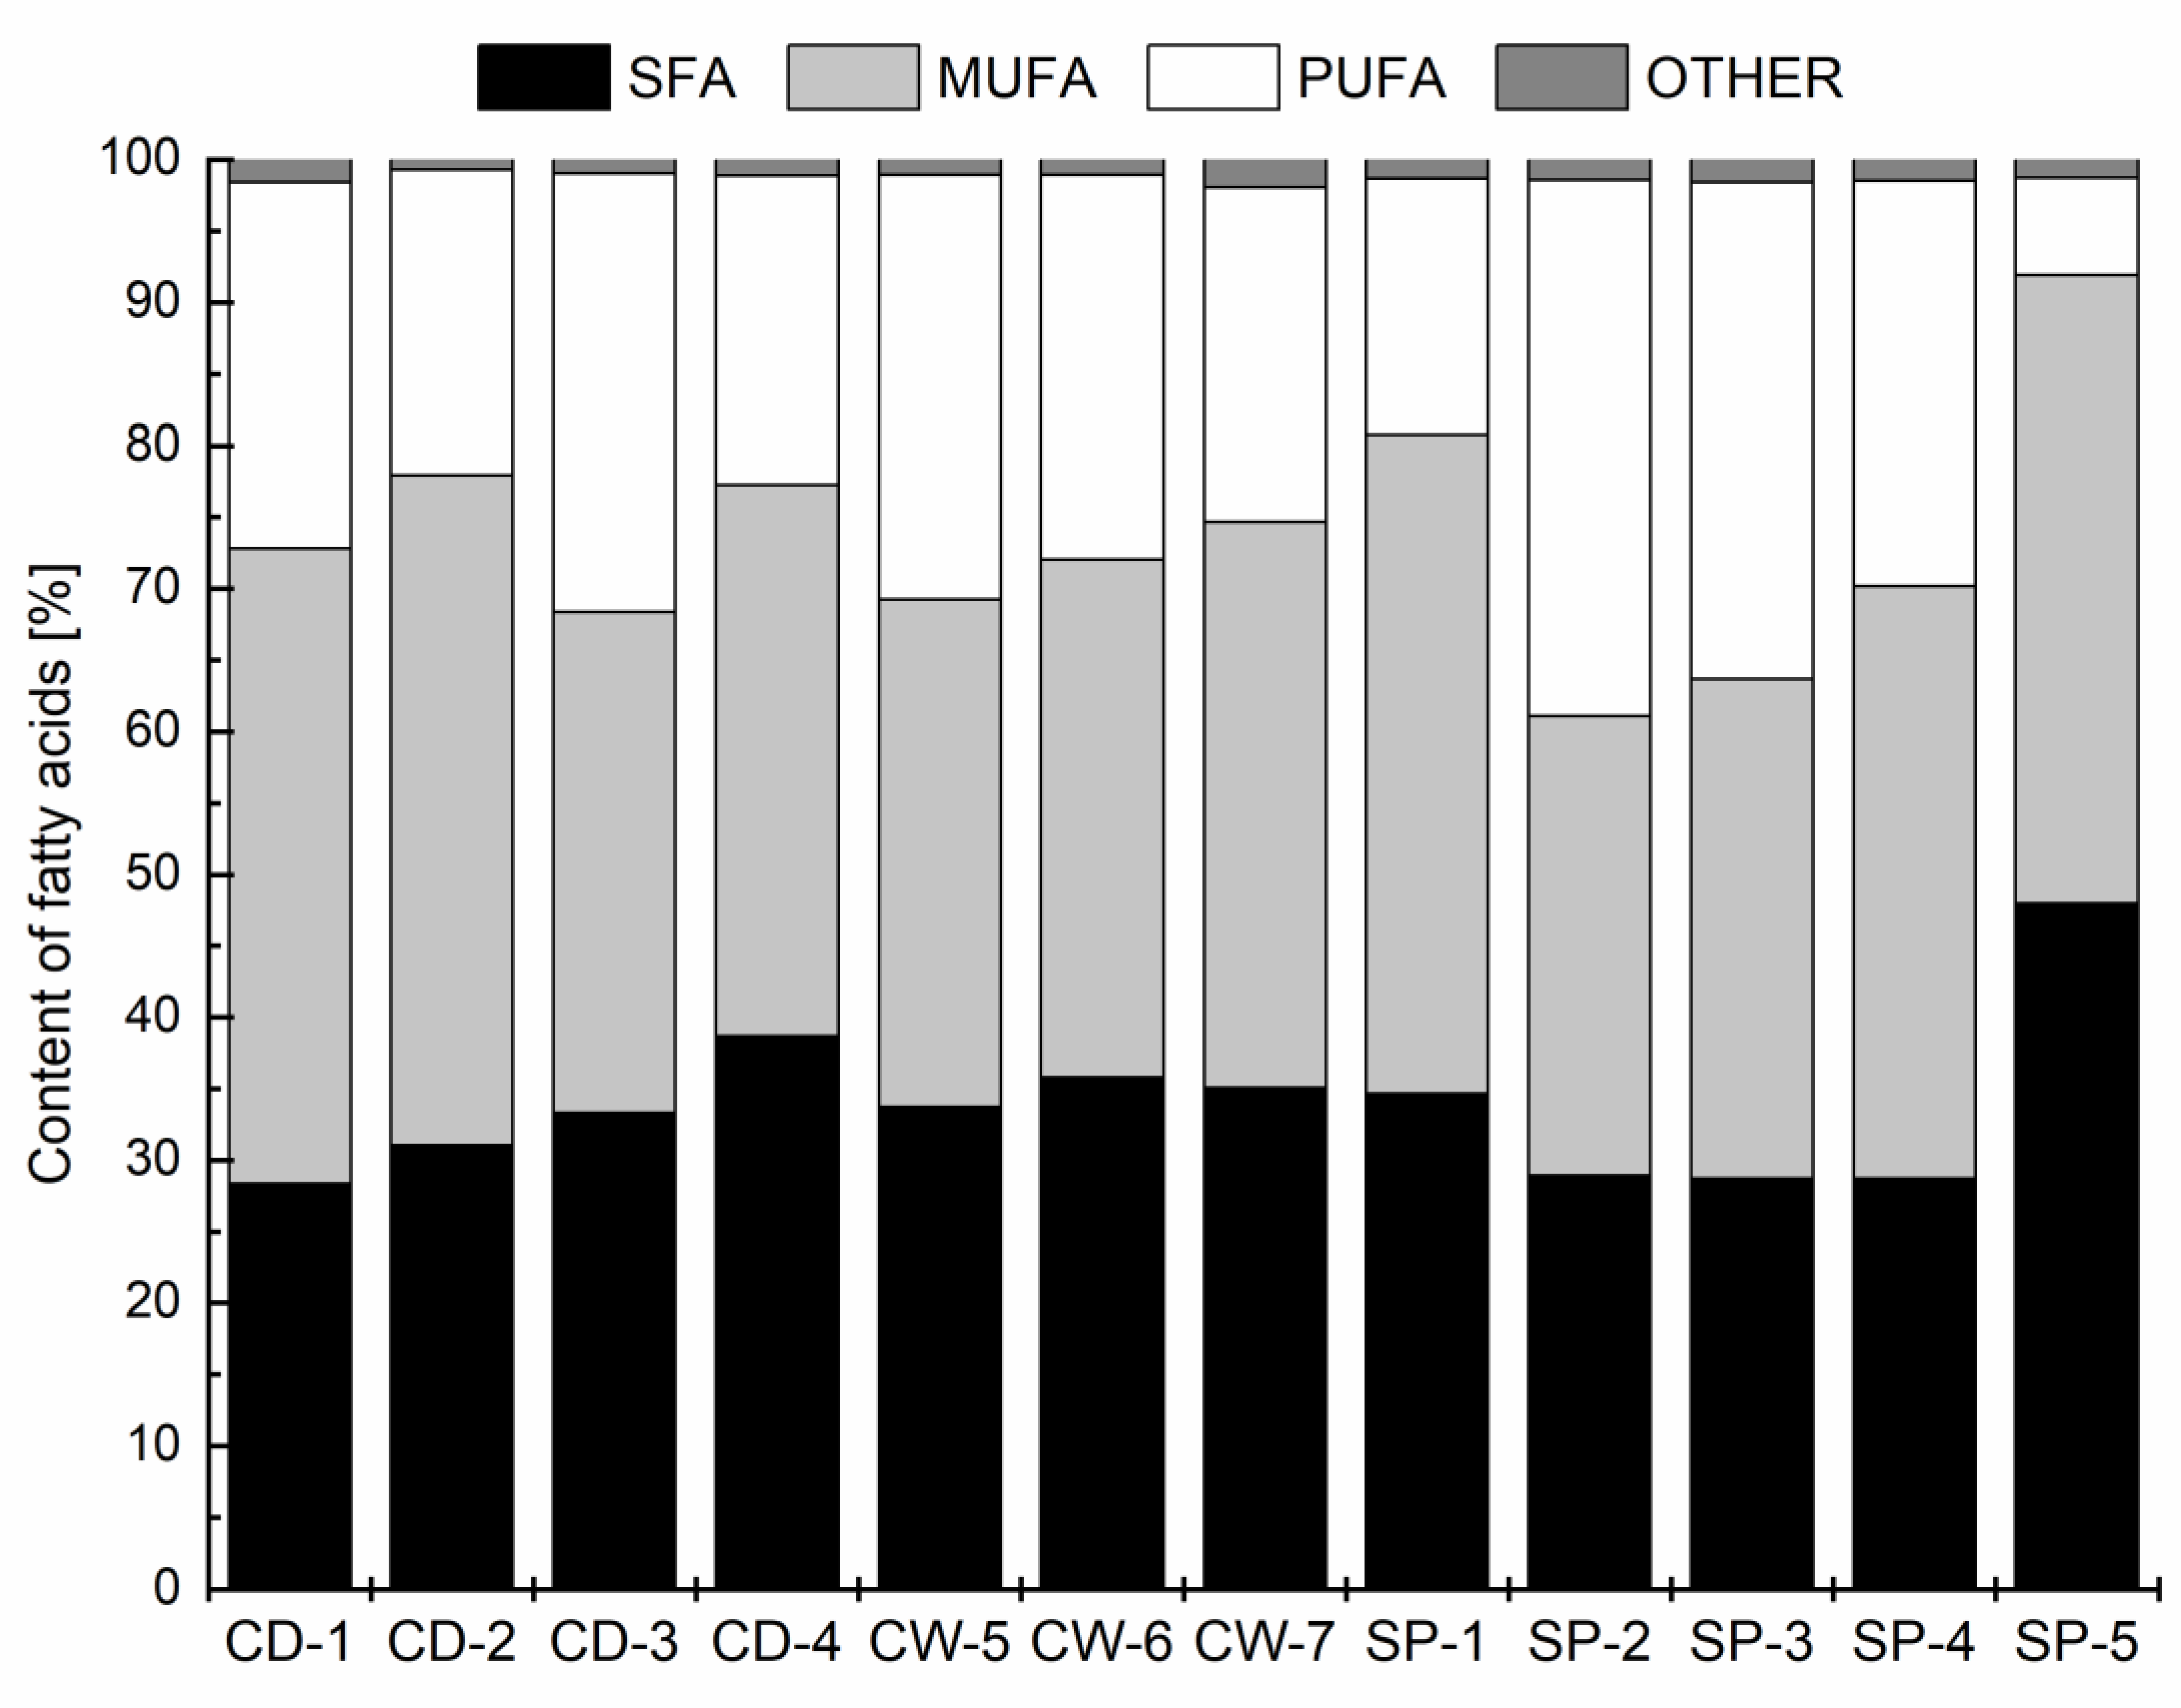
3.1. Fat Content and Fatty Acids Composition

The fat content in the dry matter of tested foods (Table 1 and Table 2) was calculated on the basis of extracted fat mass and obtained dry matter as well as taking into account the producers’ declaration (guaranteed analysis) regarding moisture and fat in products for commercial cat foods and BARFny kalkulator data for raw ones.
The results of the determination of FA composition of fat extracted (crude fat) from twelve commercial and self-prepared cat foods are presented in Table 1 and Table 2.
The percentages of saturated fatty acids (SFA), monounsaturated fatty acids (MUFA) and polyunsaturated fatty acids (PUFA) in total FA for all foods are presented in Figure 1. In the fraction of SFA, palmitic and stearic acids have the highest percentage for all foods. In turn, oleic acid has the most significant share in the MUFA fraction and linoleic acid has the highest percentage among PUFA in all foods.
The MUFA to PUFA, MUFA to SFA and PUFA to SFA ratios for all foods were also compared (Table 1 and Table 2). The MUFA to PUFA ratio is the lowest for SP-2 (below 1) and the highest for SP-5 (more than 6), while in most cases it is between 1 and 2. Additionally, the omega-6 to omega-3 ratio was also calculated and presented in Table 1 and Table 2 (the percentage of omega-3, omega-6 and omega-9 in all foods are presented in Supplemental Materials Figure S1). For most of tested foods omega-6/omega-3 was in the range of 5:1 to 10:1.
The results obtained for EFA for cats (Supplemental Materials Figure S2) were recalculated using determined dry matter content and GC data and presented as grams of each EFA per 1000 g of dry matter for self-prepared food (Table 3). The highest content of ALA and LA was detected for SP-2 and SP-3 and the lowest for SP-5. Comparing the FA composition of all self-prepared cat foods, it can be noticed that those based on poultry (SP-2–SP-4) are characterized by a higher content of LA and ALA than in SP-1 and SP-5, containing beef. The highest content of AA and EPA+DHA was found in the case of SP-1 and the lowest for SP-2.

3.2. Fatty Acid Distribution

The content of FA (%) of the TAGs and of isolated sn-2 monoacylglycerols was used to calculate the composition of FA in the sn-1 and sn-3 positions (Supplemental Materials Tables S1 and S2). The percentage of selected FA (C16:0, C18:0, C18:1 and C18:2) in the sn-2 position of TAGs of fats extracted from self-prepared cat foods was presented in Figure 2. In Figure 2 a dotted line indicates the even distribution of FA between the internal and external positions of TAGs. Taking these calculations into account, over 33.3% of palmitic acid was located at the sn-2 position of TAGs for SP-1 only; for other foods it was below 33.3% (in the range from 19% to 22%). In turn, stearic acid in all tested foods was located at the sn-2 position in less and at linoleic acid in more than 33.3% of TAGs from extracted fats. The oleic acid presented the most varied distribution between the external and internal positions of TAG. In some cases this distribution was even (for SP-2 and SP-3) but it was also directed towards sn-2 (for SP-5) as well as towards sn-1,3 (for SP-1).

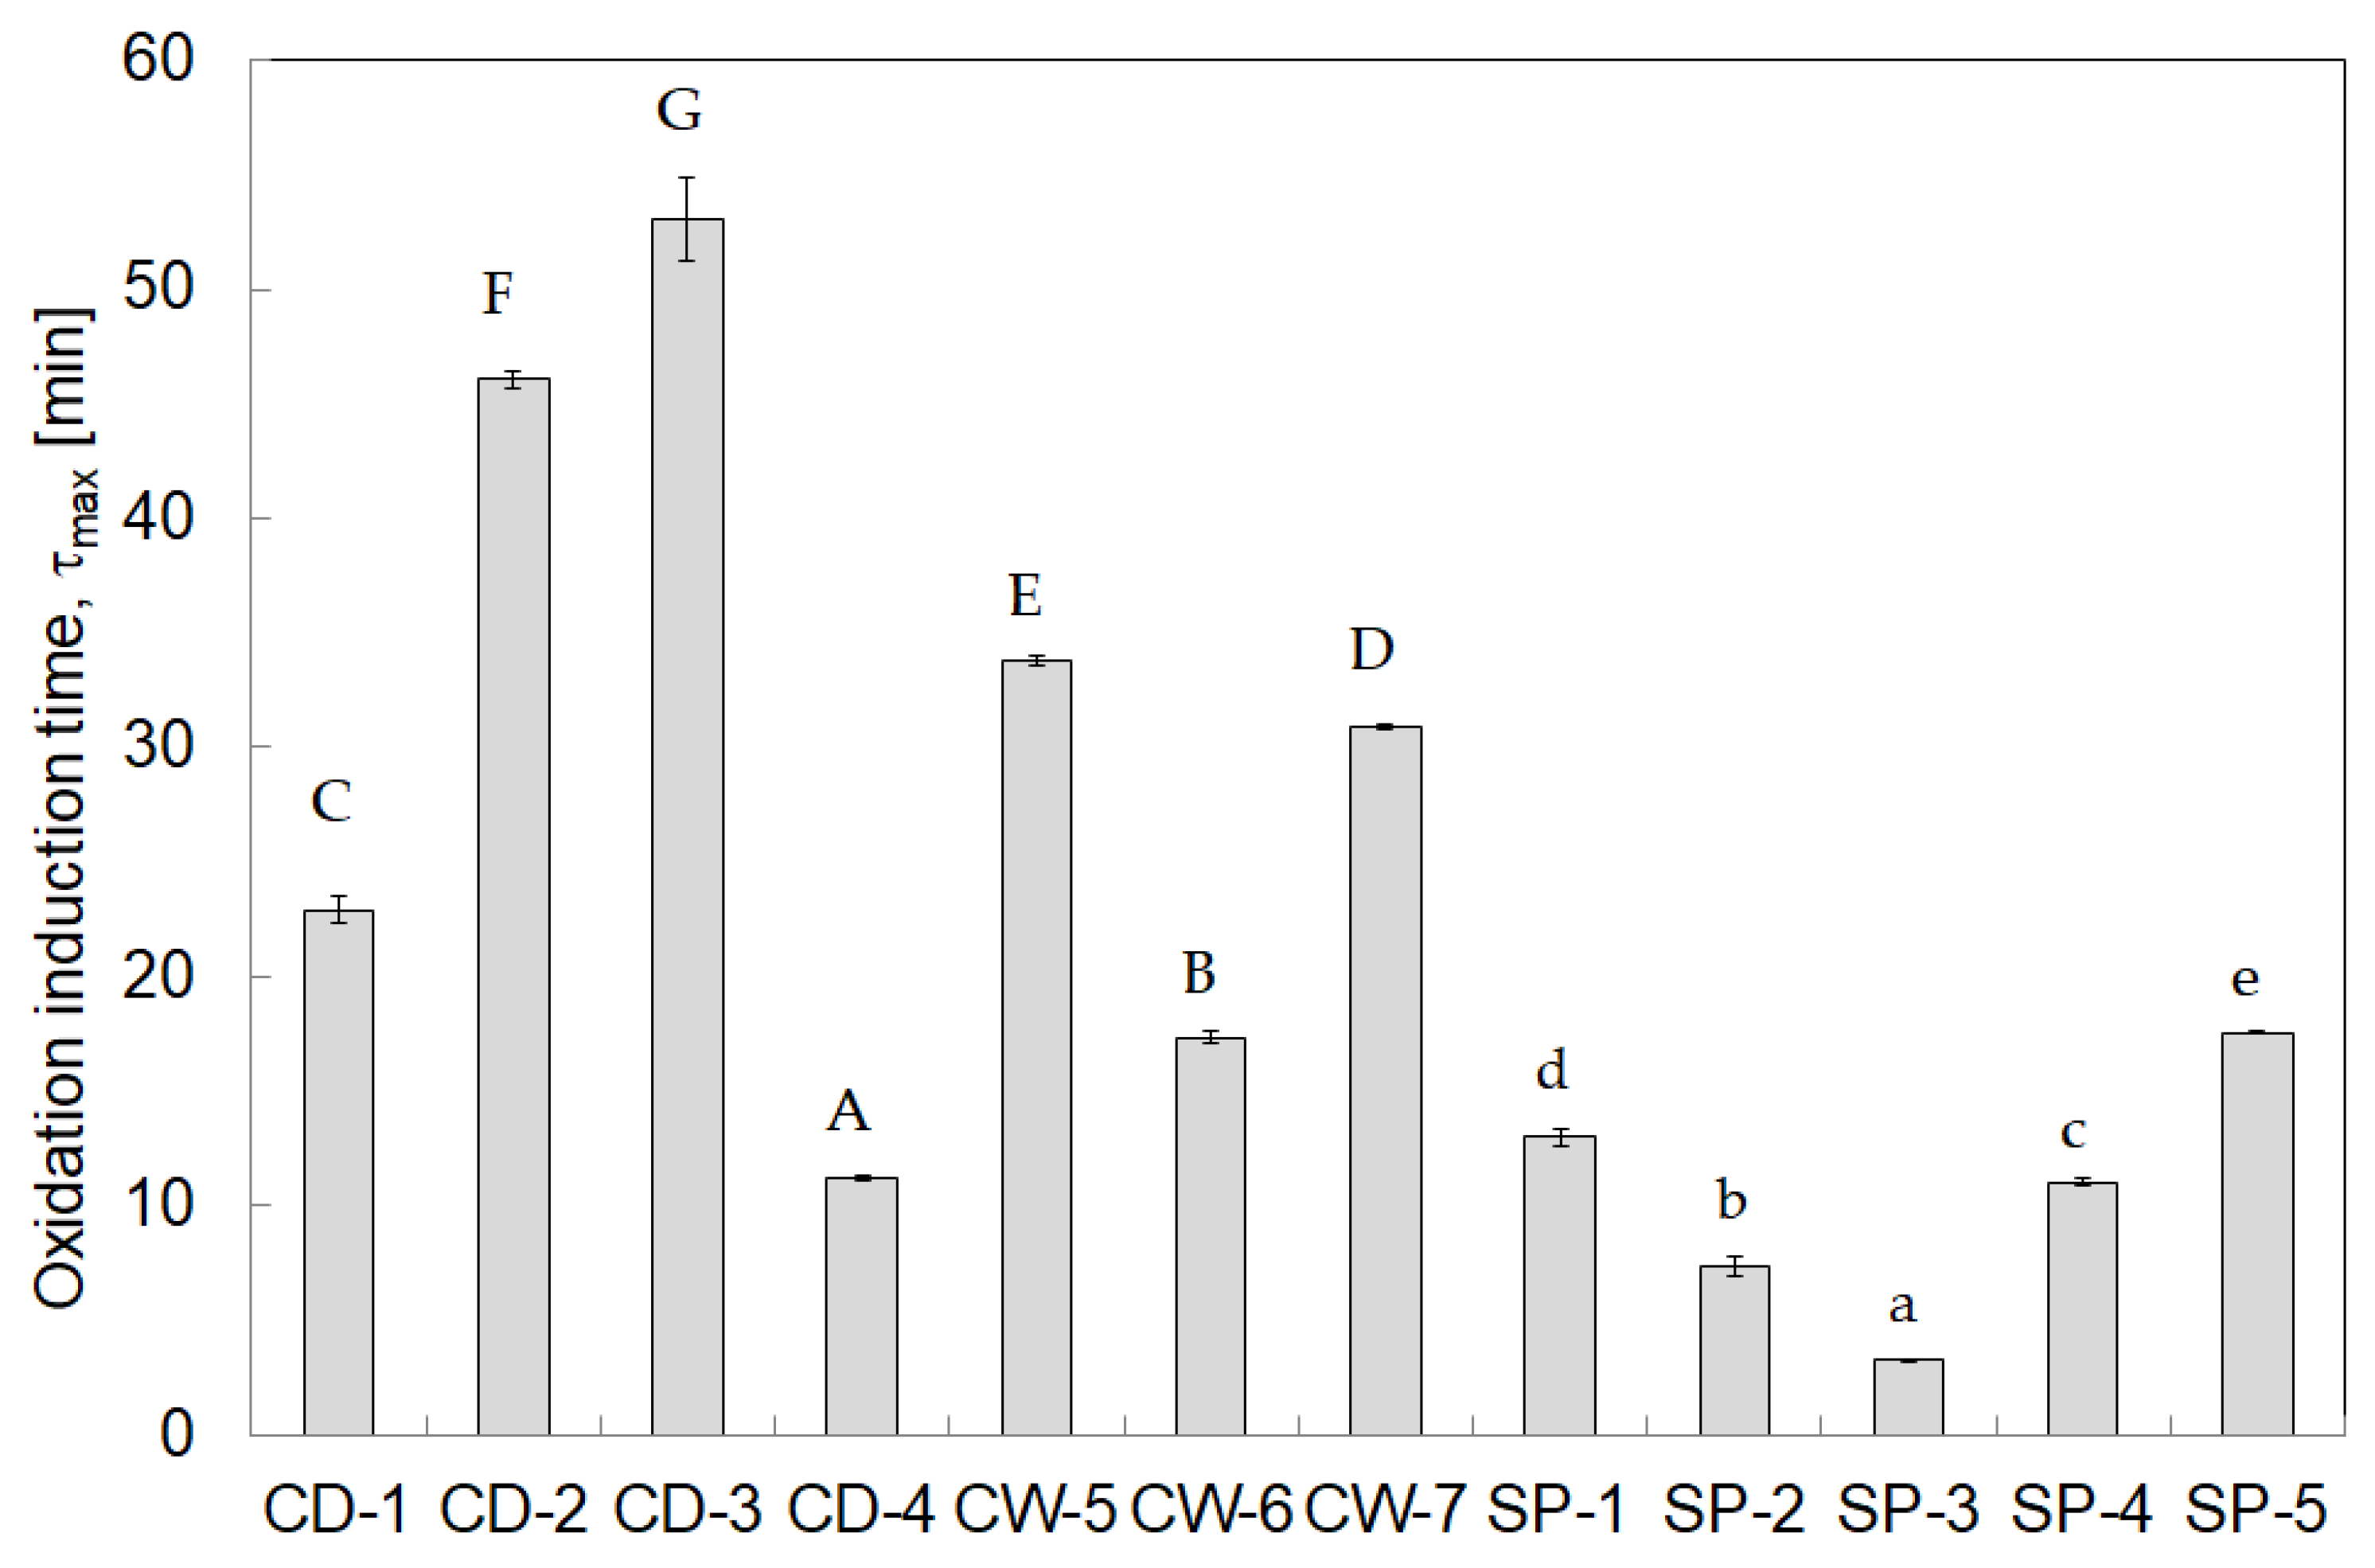
3.3. Oxidative Stability

The oxidation induction time for each extracted fat, determined under isothermal conditions (at 100 °C), is presented in Figure 3. The longest τmax, thus the highest oxidative stability, was revealed for CD-2 and CD-3 (46.05 and 53.59 min, respectively) and the shortest τmax for SP-2 and SP-3 (7.14 and 3.32 min, respectively).

4. Discussion

4.1. Lipid Fraction Properties of Self-Prepared Cat Food

The fat content in self-prepared foods oscillated around 30% (Table 1), indicating an effective extraction. The differences may be associated with variations in the composition of individual meat cuts, especially when the food is produced in very small batches.
The SP foods should have a composition similar to what cats eat in nature. Plantinga et al. [35] estimated the dietary profile of free-roaming feral cats based on a composition of the consumed preys living in the wild. The fat content varied between preys, from 9% to 31%, and the mean fat content in the diet of cats was 22.8% in dry matter. Pet food regulatory bodies, notably the Association of American Feed Control Officials in the United States and the European Pet Food Industry Federation in Europe, recommend a minimum of 9 g of fat per 100 g of dry matter, which is a significantly lower content than what a cat eats in nature. The fat content of all raw foods is significantly higher than the minimum dietary levels for cats (Table 3), but differs from the mean value for preys set by Plantinga [35].
The obtained results for LA and ALA are consistent with the literature data, suggesting that LA is found mostly in vegetable oils and only in some animal fats (e.g., chicken fat); beef is not a rich source of omega-6 fatty acids [36,37,38]. Moreover, very high contents of oleic acid as well as high contents of palmitic and stearic acids in SP-1 and SP-5 are associated with high amounts of these acids in beef [38].
The amount of individual EFA in a cat’s diet affects its health, growth and reproduction. The results of EFA for tested diets, whole prey items (available data only for captive preys) [39] and recommendations are presented as grams per kg of dry matter (Table 3). The concentrations of total FA as well as EFA for all foods are above minimal recommendations for all life stages. The LA and AA content is highly variable, but it can be noticed that ALA content is considerably lower in whole prey items than in self-prepared foods. The EPA+DHA content is several times higher in self-prepared food than in whole prey items. A higher amount of EPA+DHA is beneficial for many health aspects and essential at the stage of growth and reproduction. The low EPA+DHA content in whole prey items is probably connected with their diet during the farming period (data for free-living preys are unavailable). This content in the wild preys is supposed to be higher because of differences in their food. The higher EFA content in SP foods is also due to the overall higher fat content of raw diets. The fat content of the prey is closer to the model fat content established by Plantinga [35]. Another reason for the differences is the different content and ratio of meat, bones and internal organs used in the raw diets and their other content in the whole animal. In addition, not all internal organs are easily available on the market and they are replaced in self-prepared diets with those easily available.
The distribution of selected FA in TAG was analyzed (Figure 2) and it can be noticed that in most cases SFA (C16:0 and C18:0) occupy the external positions of TAGs. The SFA in sn-1 and sn-3 positions will be poorly absorbed in the digestive tract because they will cleave off and react with free calcium ions to form insoluble calcium soaps [17,18]. This will cause both calcium and FA losses in the feces. In turn, LA, which is EFA for mammals, mainly occupied the sn-2 position of TAGs and subsequently will be easily absorbed [17].
From the nutritional point of view, the distribution of FA in TAG is very important, but even more important, is their composition in the fat. The EFA for cats are LA and AA from the omega-6 group as well as ALA, EPA and DHA belonging to the omega-3 group [40,41]. The role of omega-6 and omega-3 fatty acids in maintaining health is affected by their ratio. Most fats and oils in cats’ foods are richer in omega-6 than omega-3 fatty acids, but it is important for pets to contain an appropriate balance of both. Determining the optimal dietary omega-6 to omega-3 ratio for pet food is still under investigation, but some recommendations indicate ratios of 10:1 to 5:1 [42]. In the case of tested foods, omega-6/omega-3 was in this range (except SP-5, with the ratio below 5:1). Salmon oil has been added to all self-prepared cat food to improve this ratio. Such supplementation seems necessary because the raw diet is intended for cats at any stage of their life, especially during growth and reproduction when they have an increased need for EFA. The addition of salmon oil as well as cod-liver oil and algae meal affects the higher content of EPA, DHA and AA in self-prepared cat food. The added salmon oil was the oil of wild Atlantic salmon, which according to the producer analysis, compared to oil of farmed salmon, has a higher content of EPA and DHA as well as higher ratio of omega-3 to omega-6 (farmed salmon—1:1 and wild salmon—10:1) [43].
FA composition is one of the factors that determine the oxidative stability of fats and oils [24]. As a rule, samples with longer τmax are more stable than those with shorter τmax determined at the same temperature. Extremely short τmax, especially for SP-2 and SP-3 (Figure 3), is probably associated with the greatest amount of PUFA in their composition (Figure 1) and a higher PUFA to SFA ratio than in the other tested foods (Table 1). The longest τmax among self-prepared foods was observed for SP-5, for which the content of SFA or MUFA was the highest and PUFA was the lowest. Moreover, it should be mentioned that only SP-5 fat was solid, which was due to the high content of SFA.

4.2. The FA Composition and Oxidative Stability of Commercial Cat Food

In light of the obtained results for raw foods, the FA profiles of selected dry and wet commercial foods were determined and presented. The same extraction method (Folch method) was used. The Folch method for fat extraction from dry pet food was also tested by other authors [27,28]. The determined extracted fat content for commercial cat foods was lower (especially for CW-6 and CW-7) than the producers’ statements (Table 2), which means the extraction was not effective. Moreover, in commercial wet foods the percentage of fat in dry matter was lower than in the case of the dry ones.
The FA composition is presented in Table 2. The differences in FA profiles of commercial and self-prepared foods may be due to the type of meat and the ingredients used (human grade meat, animal by-products, meat meal or mechanically separated meat). Among all commercial dry cat foods CD-3 had the highest content of LA. This is probably due to the presence of plant origin oils (soya and borage oils) in its composition. These oils are rich in PUFA, especially in high content of LA [44,45]. In the case of wet foods, CW-7 has the lowest LA content and it is the only commercial food that does not contain plants.
It should be emphasized that the raw diet concept assumes that it is suitable for cats at every stage of life and that tested commercial foods are for adult cats. The American Feed Control Officials and the European Pet Food Industry Federation do not provide recommendations for the minimum levels of some of the EFA (ALA, EPA and DHA) in the diet of adult cats. In the case of CD-1, in which salmon meal (source of omega-3 [39]) is the main component, an increased content of EPA+DHA in relation to other tested commercial foods was observed (Table 2). For other foods the required omega-6 to omega-3 ratio is not due to the high content of EPA and DHA, but because of the relatively high levels of ALA. Plants are a rich source of ALA [14]. The ingredients of plants origin are added to commercial diets but not to self-prepared ones (Supplemental Materials). Moreover, such ingredients do not contain AA (present only in fat of animal origin [15]). The AA content in commercial foods is relatively low, excluding CD-3 (Table 2). The low level of AA balances the ratio of omega-6 to omega-3 in commercial diets.
The oxidative stability of commercial cat foods was determined by using the PDSC technique, the same as the self-prepared food. As predicted, τmax for commercial cat foods is much longer than for self-prepared ones. Commercial cat foods contain different antioxidants and preservatives, which increase their resistance to oxidation. Moreover, technological procedures (e.g., baking or extrusion) used during their production reduce the free fat available for oxidation [46]. Self-prepared food contained only natural antioxidants in the form of vitamin E as an essential nutrient and PUFA stabilizer [37]. The BARF diet is stored frozen, inter alia, to provide additional protection against oxidation during storage.

5. Conclusions

  • The self-prepared cat foods contain high levels of EFA, which is beneficial for adult cats and essential for the cats’ growth and reproduction stage.
  • For the first time the distribution of FA in TAG for cat food has been determined.
  • The commercial and self-prepared cat foods have a similar ratio of omega-6 to omega-3 but self-prepared diets provide more EPA and DHA.
  • It is shown that the type of meat in self-prepared cat food affects the composition and distribution of fatty acids.
  • Fat samples from self-prepared cat foods containing beef are characterized by the highest oxidative stability, which can be due to a lower ratio of PUFA/SFA.

Supplementary Materials

The following are available online at https://www.mdpi.com/article/10.3390/app112210905/s1, Figure S1: The content of omega-3, omega-6 and omega-9 fatty acids for fats extracted from commercial and self-prepared cat food. Figure S2: The content of essential omega-3 and omega-6 fatty acids for fats extracted from commercial and self-prepared cat food. Table S1: The composition of selected fatty acids (%) in the internal (sn-2) and external (sn-1,3) positions of TAG in fats extracted from commercial cat food. Table S2: The composition of selected fatty acids (%) in the internal (sn-2) and external positions (sn-1,3) of TAG in fats extracted from self-prepared cat food.

Author Contributions

Conceptualization, A.G. (Agnieszka Górska) and D.M.-J.; methodology, A.G. (Agnieszka Górska), J.B. and A.G. (Agata Górska); software, J.B.; validation, J.B., A.G. (Agata Górska), A.G. (Agnieszka Górska) and D.M.-J.; formal analysis, A.G. (Agnieszka Górska), D.M.-J. and J.B.; investigation, A.G. (Agnieszka Górska) and D.M.-J.; resources, A.G. (Agnieszka Górska) and D.M.-J.; writing—original draft preparation, A.G. (Agnieszka Górska), D.M.-J.; writing—review and editing, A.G. (Agnieszka Górska), D.M.-J., J.B. and A.G. (Agata Górska); supervision, A.G. (Agata Górska) All authors have read and agreed to the published version of the manuscript.

Funding

The study was financially supported by sources of the Polish Ministry of Education and Science within funds of the Institute of Food Sciences of Warsaw University of Life Sciences (WULS), for scientific research.

Institutional Review Board Statement

Not applicable.

Informed Consent Statement

Not applicable.

Data Availability Statement

The data generated or analysed during this study are available from the corresponding author on reasonable request.

Conflicts of Interest

The authors declare no conflict of interest.

References

  1. Michel, K.E. Unconventional Diets for Dogs and Cats. Vet. Clin. N. Am. 2006, 36, 1269–1281. [Google Scholar] [CrossRef] [PubMed]
  2. Remillard, R.L. Homemade Diets: Attributes, Pitfalls, and a Call for Action. Top. Companion Anim. Med. 2008, 23, 137–142. [Google Scholar] [CrossRef]
  3. Parr, J.M.; Remillard, R.L. Handling Alternative Dietary Requests from Pet Owners. Vet. Clin. N. Am. 2014, 44, 667–688. [Google Scholar] [CrossRef] [PubMed]
  4. Kerr, K.R.; Vester Boler, B.M.; Morris, C.L.; Liu, K.J.; Swanson, K.S. Apparent total tract energy and macronutrient digestibility and fecal fermentative end-product concentrations of domestic cats fed extruded, raw beef-based, and cooked beef-based diets. J. Anim. Sci. 2012, 90, 515–522. [Google Scholar] [CrossRef] [Green Version]
  5. Kerr, K.R.; Beloshapka, A.N.; Morris, C.L.; Parsons, C.M.; Burke, S.L.; Utterback, P.L.; Swanson, K.S. Evaluation of four raw meat diets using domestic cats, captive exotic felids, and cecectomized roosters. J. Anim. Sci. 2013, 91, 225–237. [Google Scholar] [CrossRef] [PubMed] [Green Version]
  6. Hamper, B.A.; Kirk, C.A.; Bartges, J.W. Apparent nutrient digestibility of two raw diets in domestic kittens. J. Feline Med. Surg. 2016, 18, 991–996. [Google Scholar] [CrossRef]
  7. Schlesinger, D.P.; Joffe, D.J. Raw food diets in companion animals: A critical review. Can. Vet. J. 2011, 52, 50–54. [Google Scholar]
  8. Freeman, L.M.; Chandler, M.L.; Hamper, B.A.; Weeth, L.P. Current knowledge about the risks and benefits of raw meat–based diets for dogs and cats. J. Am. Vet. Med. Assoc. 2013, 243, 1549–1558. [Google Scholar] [CrossRef] [Green Version]
  9. Fredriksson-Ahomaa, M.; Heikkilä, T.; Pernu, N.; Kovanen, S.; Hielm-Björkman, A.; Kivistö, R. Raw Meat-Based Diets in Dogs and Cats. Vet. Sci. 2017, 4, 33. [Google Scholar] [CrossRef] [Green Version]
  10. Wilson, S.A.; Villaverde, C.; Fascetti, A.J.; Larsen, J.A. Evaluation of the nutritional adequacy of recipes for home-prepared maintenance diets for cats. J. Am. Vet. Med. Assoc. 2019, 254, 1172–1179. [Google Scholar] [CrossRef]
  11. Macdonald, M.L.; Rogers, Q.R.; Morris, J.G. Role of Linoleate as an Essential Fatty Acid for the Cat Independent of Arachidonate Synthesis. J. Nutr. 1983, 113, 1422–1433. [Google Scholar] [CrossRef] [PubMed]
  12. Morris, J.G. Idiosyncratic nutrient requirements of cats appear to be diet-induced evolutionary adaptations. Nutr. Res. Rev. 2002, 15, 153–168. [Google Scholar] [CrossRef] [Green Version]
  13. Rivers, J.P.W. Essential fatty acids in cats. J. Small Anim. Pract. 1982, 23, 563–576. [Google Scholar] [CrossRef]
  14. Lenox, C.E.; Bauer, J.E. Potential Adverse Effects of Omega-3 Fatty Acids in Dogs and Cats. J. Vet. Intern. Med. 2013, 27, 217–226. [Google Scholar] [CrossRef] [PubMed]
  15. Bauer, J.J.E. Facilitative and functional fats in diets of cats and dogs. J. Am. Vet. Med. Assoc. 2006, 229, 680–684. [Google Scholar] [CrossRef]
  16. Mu, H.; Høy, C.E. The digestion of dietary triacylglycerols. Prog. Lipid Res. 2004, 43, 105–133. [Google Scholar] [CrossRef]
  17. Kubow, S. The influence of positional distribution of fatty acids in native, interesterified and structure-specific lipids on lipoprotein metabolism and atherogenesis. J. Nutr. Biochem. 1996, 7, 530–541. [Google Scholar] [CrossRef]
  18. Stroebinger, N.; Rutherfurd, S.M.; Henare, S.J.; Hernandez, J.F.P.; Moughan, P.J. Fatty Acids from Different Fat Sources and Dietary Calcium Concentration Differentially Affect Fecal Soap Formation in Growing Pigs. J. Nutr. 2021, 151, 1102–1110. [Google Scholar] [CrossRef] [PubMed]
  19. Summers, S.C.; Stockman, J.; Larsen, J.A.; Zhang, L.; Rodriguez, A.S. Evaluation of phosphorus, calcium, and magnesium content in commercially available foods formulated for healthy cats. J. Vet. Intern. Med. 2019, 34, 266–273. [Google Scholar] [CrossRef]
  20. Stockman, J.; Villaverde, C.; Corbee, R.J. Calcium, Phosphorus, and Vitamin D in Dogs and Cats. Vet. Clin. N. Am. 2021, 51, 623–634. [Google Scholar] [CrossRef]
  21. Tran, Q.D.; Hendriks, W.H.; van der Poel, A.F.B. Effects of extrusion processing on nutrients in dry pet food. J. Sci. Food Agric. 2008, 88, 1487–1493. [Google Scholar] [CrossRef]
  22. Saldaña, M.D.A.; Martínez-Monteagudo, S.I. Oxidative Stability of Fats and Oils Measured by Differential Scanning Calorimetry for Food and Industrial Applications. In Applications of Calorimetry in a Wide Context—Differential Scanning Calorimetry, Isothermal Titration Calorimetry and Microcalorimetry; Elkordy, A.A., Ed.; IntechOpen: London, UK, 2013. [Google Scholar] [CrossRef] [Green Version]
  23. Symoniuk, E.; Ratusz, K.; Krygier, K. Comparison of the oxidative stability of linseed (Linum usitatissimum L.) oil by pressure differential scanning calorimetry and Rancimat measurements. J. Food Sci. Technol. 2016, 53, 3986–3995. [Google Scholar] [CrossRef] [PubMed] [Green Version]
  24. Maszewska, M.; Florowska, A.; Dłużewska, E.; Wroniak, M.; Marciniak-Lukasiak, K.; Żbikowska, A. Oxidative Stability of Selected Edible Oils. Molecules 2018, 23, 1746. [Google Scholar] [CrossRef] [PubMed] [Green Version]
  25. Danthine, S.; De Clercq, N.; Dewettinck, K.; Gibon, V. Monitoring batch lipase catalyzed interesterification of palm oil and fractions by differential scanning calorimetry. J. Therm. Anal. Calorim. 2014, 115, 2219–2229. [Google Scholar] [CrossRef]
  26. Gray, J.I. Measurement of lipid oxidation: A review. J. Am. Oil Chem. Soc. 1978, 55, 539–546. [Google Scholar] [CrossRef]
  27. Ciemniewska-Żytkiewicz, H.; Ratusz, K.; Bryś, J.; Reder, M.; Koczoń, P. Determination of the oxidative stability of hazelnut oils by PDSC and Rancimat methods. J. Therm. Anal. Calorim. 2014, 118, 875–881. [Google Scholar] [CrossRef] [Green Version]
  28. Hołda, K.; Głogowski, R. Selected quality properties of lipid fraction and oxidative stability of dry dog foods under typical storage conditions. J. Therm. Anal. Calorim. 2016, 126, 91–96. [Google Scholar] [CrossRef] [Green Version]
  29. Anderson, R.S.; Meyer, H. Ernährung und Verhalten von Hund und Katze; Schlütersche Verlag: Hannover, Germany, 1984; ISBN 978-3877060865. [Google Scholar]
  30. Horzinek, M.C.; Lutz, H.; Schmidt, V. Krankheiten der Katze; Enke: Stuttgart, Germany, 1999; ISBN 978-3830410492. [Google Scholar]
  31. Strombeck, D.R. Home-Prepared Dog & Cat Diets: The Healthful Alternative; Wiley-Blackwell: Hoboken, NJ, USA, 1999; ISBN 978-0813821498. [Google Scholar]
  32. Wanner, M. Die Ernährung der Katze. Skript für Studierende der Veterinärmedizin an der Universität Zürich; University of Zurich: Zurich, Switzerland, 2004. [Google Scholar]
  33. Boselli, E.; Velazco, V.; Caboni, M.F.; Lercker, G. Pressurized liquid extraction of lipids for the determination of oxysterols in egg-containing food. J. Chromatogr. A 2001, 917, 239–244. [Google Scholar] [CrossRef]
  34. Mattson, F.H.; Lutton, E.S. The Specific Distribution of Fatty Acids in the Glycerides of Animal and Vegetable Fats. J. Biol. Chem. 1958, 233, 868–871. [Google Scholar] [CrossRef]
  35. Plantinga, E.A.; Bosch, G.; Hendriks, W.H. Estimation of the dietary nutrient profile of free-roaming feral cats: Possible implications for nutrition of domestic cats. Br. J. Nutr. 2011, 106, S35–S48. [Google Scholar] [CrossRef] [Green Version]
  36. Li, D.; Ng, A.; Mann, N.J.; Sinclair, A.J. Contribution of meat fat to dietary arachidonic acid. Lipids 1998, 33, 437–440. [Google Scholar] [CrossRef]
  37. Wood, J.D.; Enser, M.; Fisher, A.V.; Nute, G.R.; Sheard, P.R.; Richardson, R.I.; Hughes, S.I.; Whittington, F.M. Fat deposition, fatty acid composition and meat quality: A review. Meat Sci. 2008, 78, 343–358. [Google Scholar] [CrossRef] [PubMed]
  38. Hwang, Y.-H.; Joo, S.-T. Fatty Acid Profiles, Meat Quality, and Sensory Palatability of Grain-fed and Grass-fed Beef from Hanwoo, American, and Australian Crossbred Cattle. J. Food Sci. Anim. Resour. 2017, 37, 153–161. [Google Scholar] [CrossRef] [Green Version]
  39. Wall, R.; Ross, R.P.; Fitzgerald, G.F.; Stanton, C. Fatty acids from fish: The anti-inflammatory potential of long-chain omega-3 fatty acids. Nutr. Rev. 2010, 68, 280–289. [Google Scholar] [CrossRef]
  40. Biagi, G.; Mordenti, A.L.; Cocchi, M. The role of dietary omega-3 and omega-6 essential fatty acids in the nutrition of dogs and cats: A review. Prog. Nutr. 2004, 6, 97–107. [Google Scholar]
  41. Tallima, H.; El Ridi, R. Arachidonic acid: Physiological roles and potential health benefits—A review. J. Adv. Res. 2018, 11, 33–41. [Google Scholar] [CrossRef] [PubMed]
  42. Bunglavan, S.J.; Pratheesh, M.D.; Anoopraj, R.; Harish, C.; Davis, J. Therapeutic uses of omega fatty acids in cats. Indian Pet J. 2011, 12, 1–2. [Google Scholar]
  43. Filburn, C.R.; Griffin, D. Effects of supplementation with a docosahexaenoic acid-enriched salmon oil on total plasma and plasma phospholipid fatty acid composition in the cat. Int. J. Appl. Res. Vet. Med. 2005, 3, 116–123. [Google Scholar]
  44. Jokic, S.; Sudar, R.; Svilović, S.; Vidovic, S.; Bilić, M.; Velic, D.; Jurkovič, V. Fatty acid composition of oil obtained from soybeans by extraction with supercritical carbon dioxide. Czech J. Food Sci. 2013, 31, 116–125. [Google Scholar] [CrossRef] [Green Version]
  45. Tasset-Cuevas, I.; Fernández-Bedmar, Z.; Lozano-Baena, M.D.; Campos-Sánchez, J.; De Haro-Bailón, A.; Muñoz-Serrano, A.; Alonso-Moraga, Á. Protective Effect of Borage Seed Oil and Gamma Linolenic Acid on DNA: In Vivo and In Vitro Studies. PLoS ONE 2013, 8, e56986. [Google Scholar] [CrossRef] [Green Version]
  46. Gibson, M.; Alavi, S. Pet Food Processing—Understanding Transformations in Starch during Extrusion and Baking. Cereal Foods World 2013, 58, 232–236. [Google Scholar] [CrossRef] [Green Version]
  47. Kerr, K.R.; Kappen, K.L.; Garner, L.M.; Swanson, K.S. Commercially Available Avian and Mammalian Whole Prey Diet Items Targeted for Consumption by Managed Exotic and Domestic Pet Felines: Macronutrient, Mineral, and Long-Chain Fatty Acid Composition. Zoo Biol. 2014, 33, 327–335. [Google Scholar] [CrossRef] [PubMed]
Figure 1. The content of saturated (SFA), monounsaturated (MUFA) and polyunsaturated fatty acids (PUFA) for fats extracted from commercial wet (CW), dry (CD) and self-prepared (SP) cat foods.
Applsci 11 10905 g001
Figure 2. The percentage of a given fatty acid in sn-2 position of triacylglycerols (TAGs) of fats extracted from SP cat foods, expressed as the relative fatty acid [(sn-2 fatty acid × 100%)/(3 × total fatty acid in TAGs)]. The line indicates the statistical (even) distribution of FA between three TAG positions (33%).
Applsci 11 10905 g002
Figure 3. The oxidation induction time at 100 °C obtained for the lipid fraction extracted from commercial and self-prepared cat foods. Different letters indicate that the samples are significantly different at p < 0.05 (the upper cases (A–G) for commercial cat foods and the lower cases (a–e) for self-prepared ones).
Applsci 11 10905 g003
Table 1. Main animal ingredients: dry matter (DM), fat content and fatty acid composition (%) in fats extracted from tested self-prepared (SP) cat foods.
Product DesignationSP-1SP-2SP-3SP-4SP-5
Main
Animal Ingredients
Chicken Meat, Beef MeatTurkey MeatChicken Meat, Turkey MeatChicken Meat, Duck MeatBeef Meat
DM, % †25.1325.1425.1225.1025.12
DM, %24.02 ± 0.94 b22.80 ± 1.58 ab23.53 ± 2.08 b20.47 ± 1.81 a27.73 ± 1.81 c
Fat in DM, % †32.1133.4833.5927.8729.45
Fat in DM, %35.48 ± 2.63 d25.14 ± 0.97 a28.58 ± 0.44 b32.00 ± 1.11 c36.30 ± 1.27 d
C10:00.04 ± 0.01 ab 0.13 ± 0.02 d 0.08 ± 0.02 c0.03 ± 0.01 a0.05 ± 0.01 bc
C12:00.33 ± 0.01 b1.95 ± 0.17 d1.34 ± 0.08 c0.37 ± 0.03 b 0.08 ± 0.01 a
C14:02.13 ± 0.04 b2.44 ± 0.16 c2.10 ± 0.04 b1.28 ± 0.04 a3.00 ± 0.13 d
C14:10.59 ± 0.06 b0.20 ± 0.02 a0.17 ± 0.03 a0.13 ± 0.02 a0.79 ± 0.15 c
C15:00.25 ± 0.01 c0.18 ± 0.01 b0.17 ± 0.01 b0.13 ± 0.01 a0.60 ± 0.01 d
C16:020.39 ± 0.15 b17.36 ± 0.52 a17.43 ± 0.23 a19.87 ± 0.03 b24.24 ± 0.94 c
C16:14.48 ± 0.01 d3.14 ± 0.11 a3.28 ± 0.02 b4.00 ± 0.03 c3.24 ± 0.05 b
C17:00.69 ± 0.01 c0.40 ± 0.01 b0.39 ± 0.02 b0.36 ± 0.01 a1.29 ± 0.02 d
C17:10.56 ± 0.01 b0.12 ± 0.02 a0.12 ± 0.01 a0.14 ± 0.01 a0.77 ± 0.01 c
C18:010.81 ± 0.01 c6.86 ± 0.15 ab7.18 ± 0.09 b6.68 ± 0.07 a18.71 ± 0.48 d
C18:1 n-939.72 ± 0.01 e27.86 ± 0.24 a30.53 ± 0.39 b36.41 ± 0.10 c38.60 ± 1.04 d
C18:2 n-612.88 ± 0.02 b29.14 ± 0.22 e27.15 ± 0.15 d22.65 ± 0.12 c3.12 ± 0.07 a
C18:3 n-30.87 ± 0.02 b3.40 ± 0.05 e2.66 ± 0.07 d1.30 ± 0.03 c0.69 ± 0.02 a
C20:1 n-90.79 ± 0.05 bc0.71 ± 0.11 b0.85 ± 0.05 c0.81 ± 0.01 bc0.55 ± 0.08 a
C20:2 n-60.23 ± 0.01 b0.33 ± 0.03 c0.38 ± 0.02 d0.31 ± 0.01 c0.08 ± 0.05 a
C20:3 n-61.11 ± 0.01 b1.66 ± 0.11 d1.47 ± 0.09 c1.51 ± 0.01 c0.52 ± 0.03 a
C20:4 n-61.48 ± 0.02 b1.41 ± 0.07 ab1.66 ± 0.10 c1.32 ± 0.02 a1.31 ± 0.53 a
C20:5 n-30.12 ± 0.0 1b0.14 ± 0.01 c0.14 ± 0.02 c0.16 ± 0.01 c0.05 ± 0.01 a
C22:6 n-31.22 ± 0.05 bc1.19 ± 0.12 abc1.34 ± 0.18 c1.13 ± 0.01 ab1.02 ± 0.07 a
Σ other 1.37 ± 0.02 ab1.39 ± 0.10 ab1.57 ± 0.07 c1.47 ± 0.01 bc1.27 ± 0.13 a
MUFA/PUFA2.580.861.001.466.47
MUFA/SFA1.331.091.221.440.92
PUFA/SFA0.521.271.210.990.14
Omega-6/omega-37.126.887.419.972.86
† Based on content calculated by the software. Obtained data for DM, fat in DM and fatty acids are expressed as means ± S.D. The different lower-case letters in the same row indicate significantly different values (p < 0.05). MUFA—monounsaturated fatty acids, PUFA—polyunsaturated fatty acids, SFA—saturated fatty acids.
Table 2. Main animal ingredients: dry matter (DM), fat content and fatty acid composition (%) in fats extracted from tested commercial dry (CD) and wet (CW) cat foods.
Product DesignationCD-1CD-2CD-3CD-4CW-5CW-6CW-7
DM, % †90909290201819
DM, %94.35 ± 0.37 d94.10 ± 0.28 cd94.28 ± 0.19 cd93.46 ± 0.42 c20.18 ± 0.63 b18.93 ± 0.89 a19.17 ± 0.13 a
Fat in DM, % †22.2220.0017.3917.7712.5025.0014.21
Fat in DM, %16.31 ± 0.57 cd17.39 ± 2.15 d13.16 ± 3.42 bc14.78 ± 1.32 cd10.11 ± 2.59 ab10.38 ± 1.73 ab8.89 ± 0.67 a
C10:00.08 ± 0.03 ab0.02 ± 0.01 a 0.20 ± 0.01 d0.16 ± 0.05 cd0.12 ± 0.07 bc0.06 ± 0.01 ab0.08 ± 0.04 ab
C12:00.40 ± 0.10 ab0.07 ± 0.01 a1.85 ± 0.14 c0.45 ± 0.05 ab1.98 ± 1.03 c1.07 ± 0.24 b0.29 ± 0.17 a
C14:01.36 ± 0.21 b0.73 ± 0.02 a2.72 ± 0.09 d2.19 ± 0.10 ad2.09 ± 0.75 c1.37 ± 0.24 b1.22 ± 0.36 ab
C14:10.17 ± 0.02 a0.19 ± 0.01 a0.30 ± 0.02 b0.23 ± 0.02 ab0.25 ± 0.10 ab0.20 ± 0.04 a0.17 ± 0.59 a
C15:00.15 ± 0.02 ab0.11 ± 0.01 a0.21 ± 0.01 c0.19 ± 0.01 bc0.16 ± 0.05 bc0.15 ± 0.02 ab0.19 ± 0.04 bc
C16:020.08 ± 1.10 a22.15 ± 0.23 ab22.52 ± 0.03 ab26.27 ± 0.67 c22.41 ± 3.09 ab23.03 ± 1.83 ab23.91 ± 2.82 bc
C16:14.46 ± 0.35 ab5.72 ± 0.10 d5.15 ± 0.10 cd4.89 ± 0.05 bc3.95 ± 0.62 a3.94 ± 0.35 a3.95 ± 0.51 a
C17:00.37 ± 0.01 ab0.34 ± 0.03 a0.37 ± 0.01 ab0.41 ± 0.01 bc0.35 ± 0.04 ab0.40 ± 0.04 abc0.45 ± 0.07 c
C17:10.13 ± 0.01 bc0.11 ± 0.01 ab0.14 ± 0.01 c0.18 ± 0.01 d0.13 ± 0.02 abc0.11 ± 0.01 a0.15 ± 0.02 c
C18:06.52 ± 0.37 b7.62 ± 0.07 c5.42 ± 0.04 a8.99 ± 0.04 d6.58 ± 0.63 b9.69 ± 0.18 e8.89 ± 0.57 d
C18:1 n-938.05 ± 1.08 d40.33 ± 0.09 d29.08 ± 0.18 a32.70 ± 0.76 bc30.41 ± 2.95 ab31.68 ± 1.76 ab34.90 ± 2.34 c
C18:2 n-620.48 ± 0.23 c18.38 ± 0.09 b25.58 ± 0.24 e17.12 ± 0.02 a25.18 ± 1.06 e21.83 ± 0.51 d17.60 ± 0.46 ab
C18:3 n-32.56 ± 0.06 c 1.83 ± 0.04 a 2.31 ± 0.04 b 3.12 ± 0.09 d2.51 ± 0.20 c 1.89 ± 0.06 a 2.59 ± 0.11 c
C20:1 n-91.19 ± 0.13 d0.52 ± 0.03 ab0.44 ± 0.02 ab0.61 ± 0.07 bc0.80 ± 0.22 c0.34 ± 0.015 a0.44 ± 0.11 ab
C20:2 n-60.39 ± 0.05 b0.19 ± 0.01 a0.20 ± 0.03 a0.22 ± 0.06 a0.26 ± 0.07 a0.23 ± 0.03 a0.43 ± 0.06 b
C20:3 n-60.34 ± 0.03 a0.61 ± 0.04 bc0.42 ± 0.01 ab0.64 ± 0.01 bc0.78 ± 0.17 c2.30 ± 0.12 d2.29 ± 0.34 d
C20:4 n-60.63 ± 0.05 d0.11 ± 0.01 a1.32 ± 0.06 e0.23 ± 0.03 b0.34 ± 0.06 c0.13 ± 0.03 a0.15 ± 0.04 ab
C20:5 n-30.08 ± 0.10 a0.06 ± 0.04 a0.08 ± 0.01 a0.05 ± 0.02 a0.08 ± 0.03 a0.16 ± 0.02 b0.07 ± 0.03 a
C22:6 n-31.03 ± 0.09 d0.19 ± 0.01 a0.77 ± 0.03 c0.29 ± 0.03 a0.53 ± 0.23 b0.37 ± 0.07 ab0.26 ± 0.07 a
Σ other 1.53 ± 0.08 c0.71 ± 0.03 a0.97 ± 0.03 b1.12 ± 0.02 b1.09 ± 0.20 b1.11 ± 0.01 b1.98 ± 0.21 d
MUFA/PUFA1.732.191.141.781.201.351.69
MUFA/SFA1.521.511.051.001.051.011.13
PUFA/SFA0.880.690.920.560.880.750.67
Omega-6/omega-35.969.268.725.278.5310.137.01
† Based on guaranteed analysis of producer. Obtained data for DM, fat in DM and fatty acids are expressed as means ± S.D. The different lower-case letters in the same row indicate significantly different values (p < 0.05).
Table 3. Concentrations of crude fat (%), essential and conditionally essential fatty acids (EFA) (g/kg DM) in self-prepared foods, whole prey items, American Feed Control Officials (AAFCO) and United States and the European Pet Food Industry Federation (FEDIAF) recommendations.
Self-Prepared Raw Meat FoodWhole Prey Items ‡Recommendations
AAFCOFEDIAF
Fat in DM, %SP-1SP-2SP-3SP-4SP-5MouseRatRabbitQuailAdultGR †AdultGR †
35.4825.1428.5832.0036.3029.9226.3522.0519.249999
LA45.6773.2677.6072.4711.3127.0333.4710.2818.766655.5
ALA3.098.557.604.142.520.461.130.470.71-0.2-0.2
AA5.253.544.734.214.762.186.860.342.750.20.20.060.2
EPA0.430.350.400.510.180.020.220.010.04----
DHA4.312.993.833.623.690.792.280.030.72----
EPA + DHA4.743.344.234.133.870.812.50.040.76-0.12-0.1
† Growth and reproduction period. ‡ According to Kerr et al. [47].
Publisher’s Note: MDPI stays neutral with regard to jurisdictional claims in published maps and institutional affiliations.

