1. Introduction
Laser-induced breakdown spectroscopy (LIBS) is a method for analyzing elements on the surface of a material by measuring plasma generated by the interaction of a sample surface with a focused laser beam as a discontinuous spectrum [
1,
2]. LIBS is based on the principle of analyzing the plasma signal generated by laser ablation on the material surface in the form of a spectrum. As laser ablation is used on the sample surface, it can be classified as a three-dimensional non-contact measurement technique [
1]. In the plasma state, the elements of a material exist as atoms and ions in excited states. As time elapses and the plasma cools, the excited atoms and ions return to the ground state, releasing radiation energy [
3].
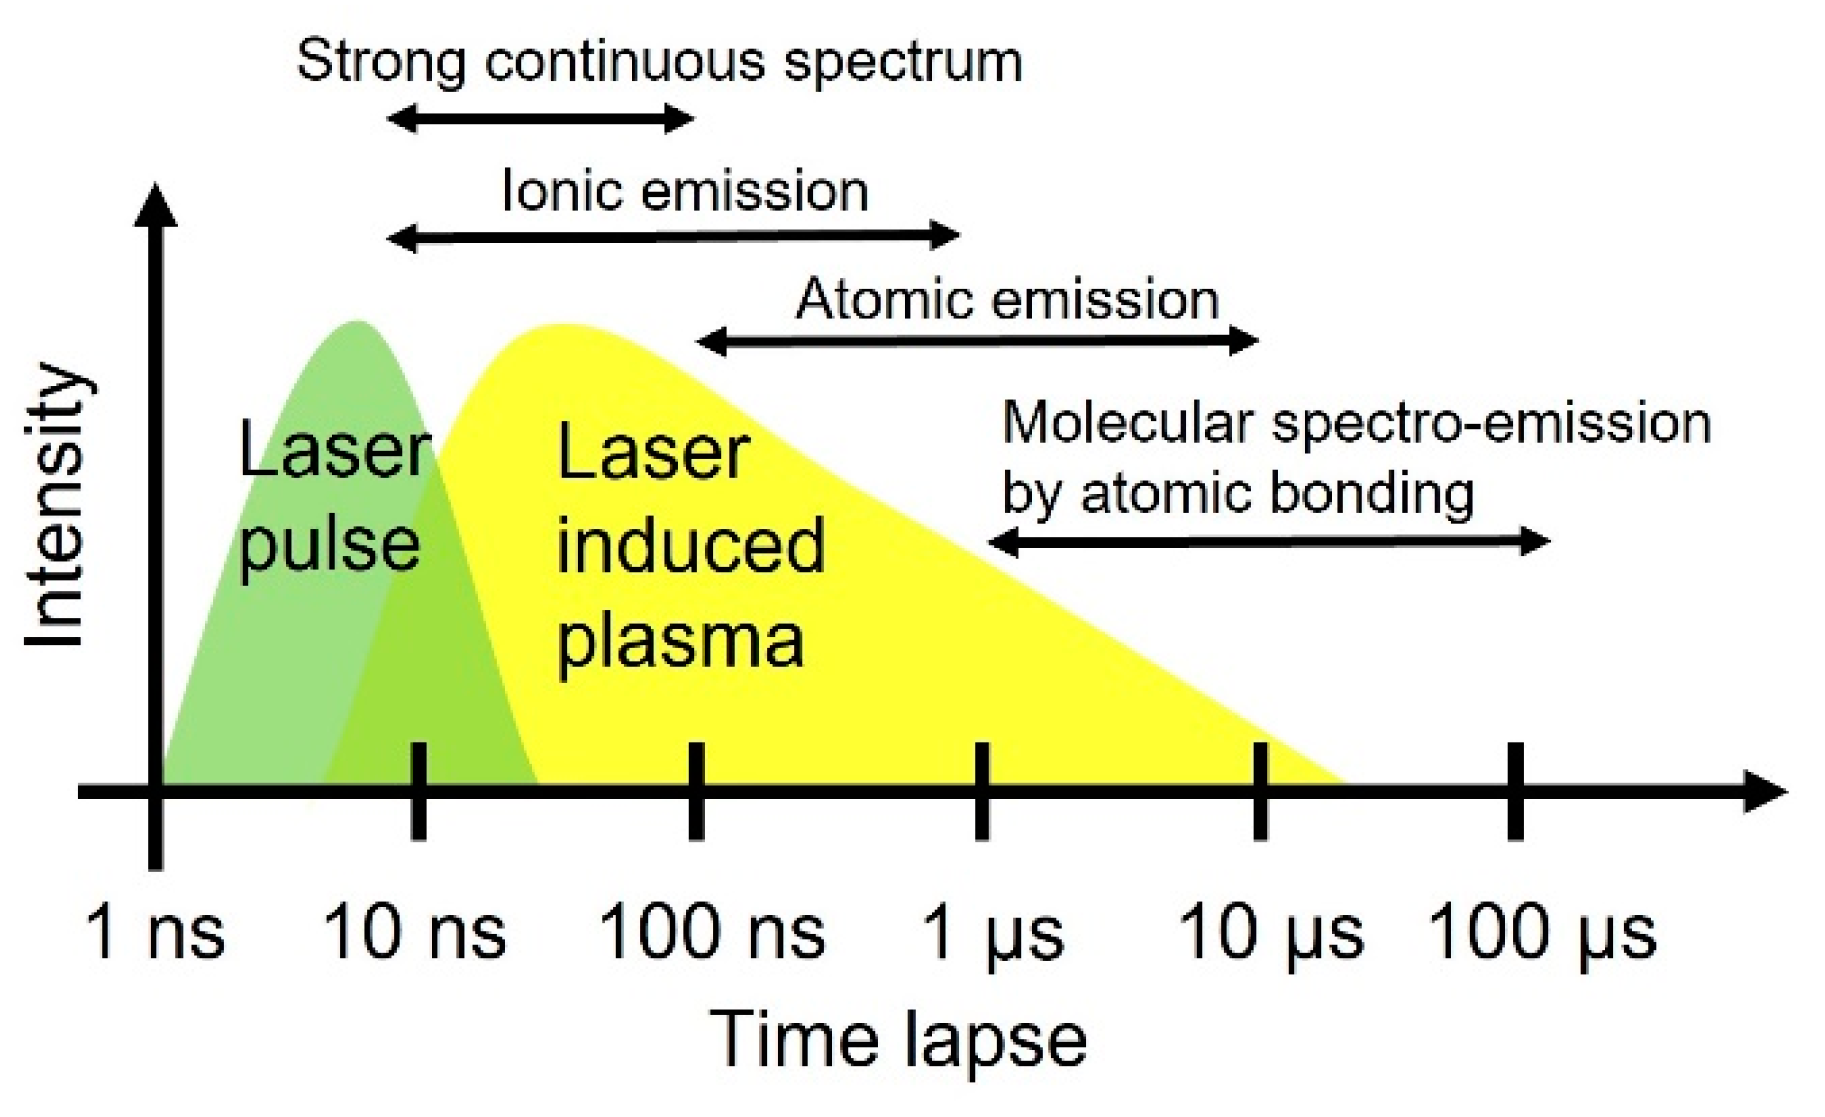
Figure 1 shows the changes in intensity of plasma energy and types of energy emitted from the plasma over time, from the moment of laser irradiation [
4]. Theoretically, plasma generation is initiated by laser ablation from femtoseconds to picoseconds immediately after the material is irradiated with the laser. At the nanosecond point, the plasma expands and emits emission lines from ions with strong and continuous emission lines. After a few hundred nanoseconds to microseconds, the plasma starts to cool and emits emission lines from atoms and spectral lines from molecules. After milliseconds have elapsed, the plasma condenses [
4,
5]. In this process, the elements have their own LIBS spectra, and information on the LIBS spectral line is used to calculate the concentration of major or minor elements in the test material through the LIBS database [
6].
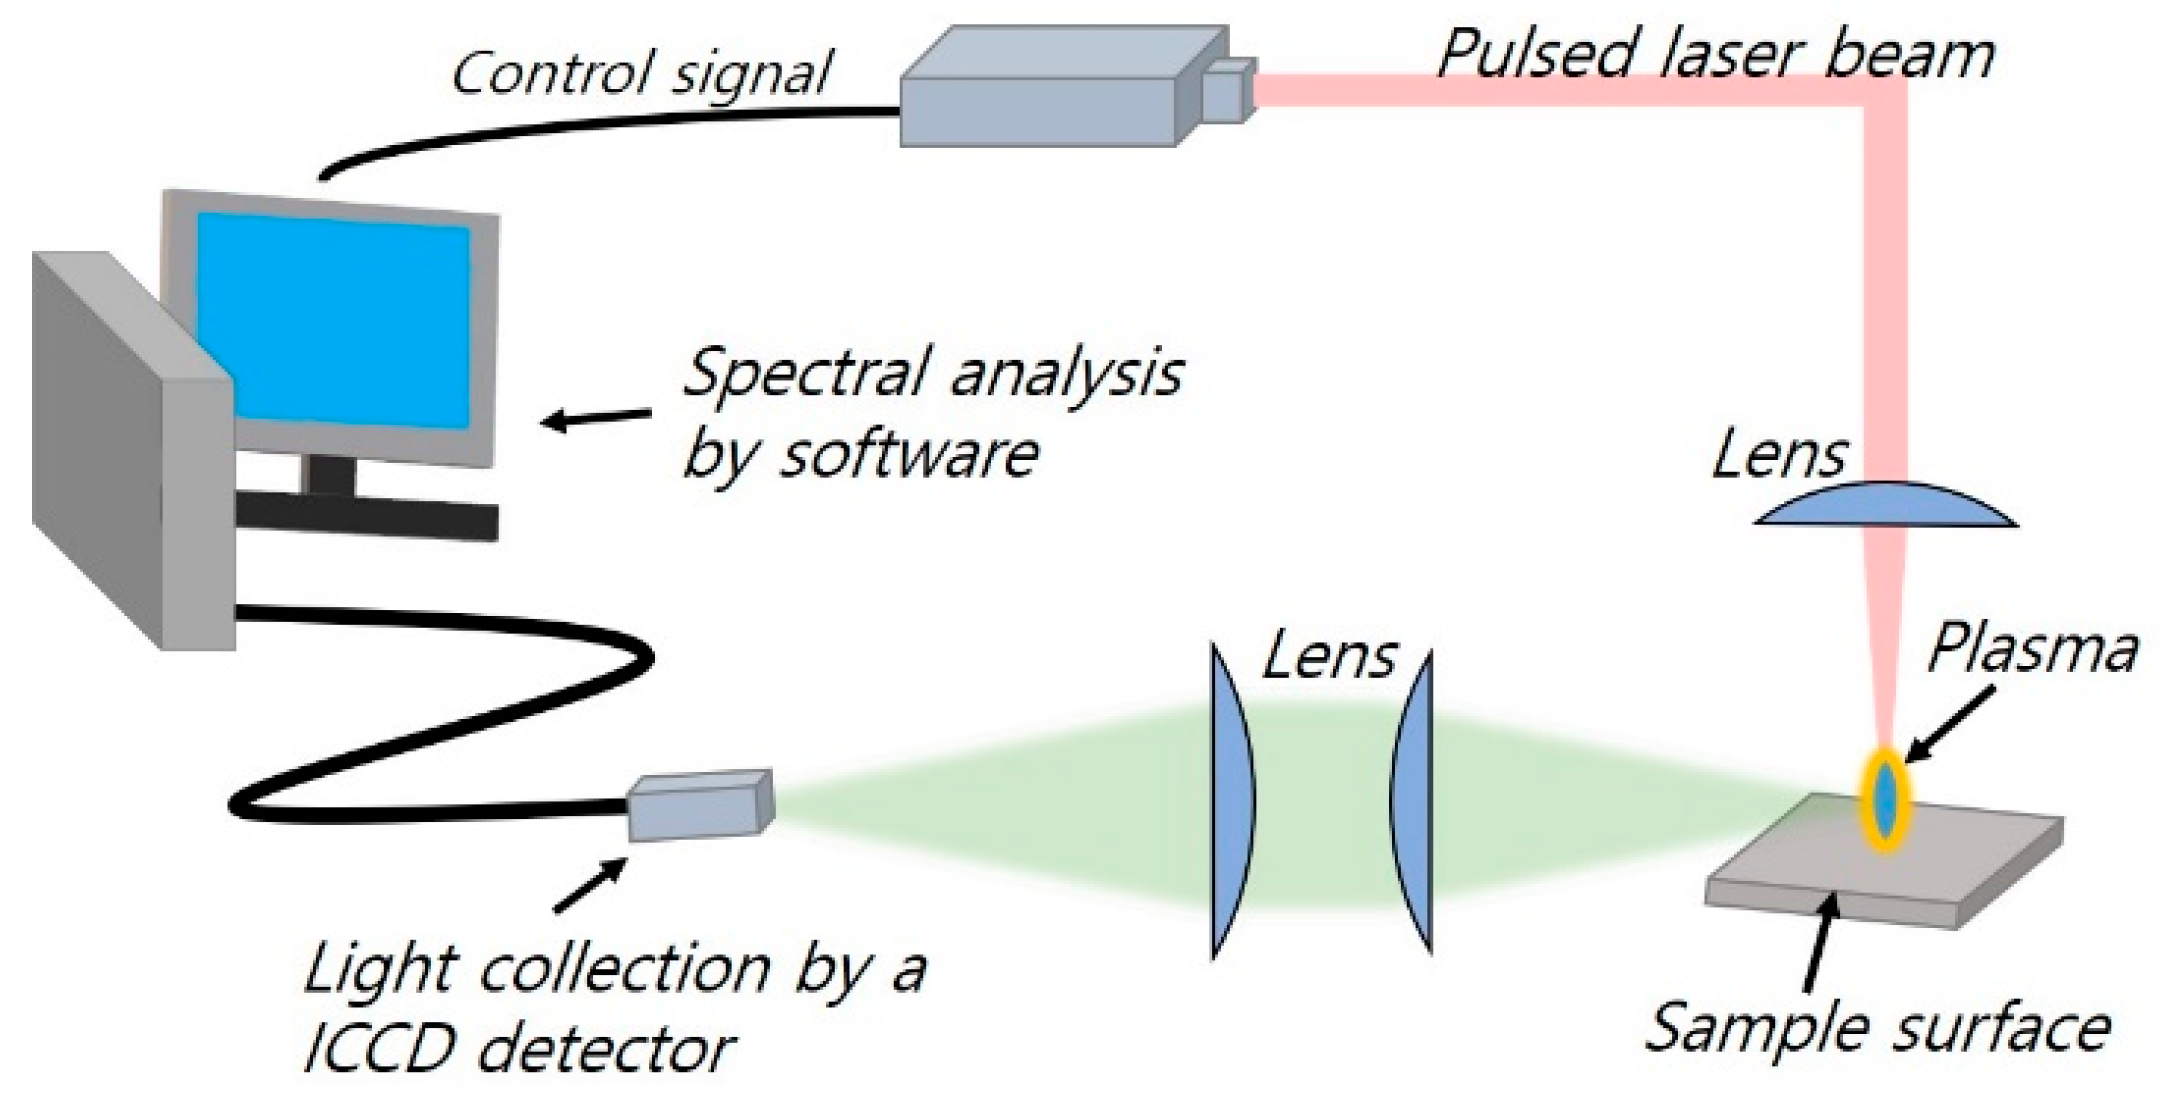
Figure 2 shows a schematic diagram of a LIBS setup and data collection method for plasma samples. The LIBS method does not require pre- or post-treatment of the sample, or a vacuum environment, and thus analysis is possible at normal pressure and room temperature. It is also possible to measure a wide range of elements regardless of the state of matter, and it can be seen that measurement is largely non-destructive because it is possible to analyze even minor elements in the range of several nanograms to micrograms [
6].
Recently, in addition to elemental analysis of materials using LIBS, several studies have analyzed various physical properties of samples through LIBS [
7,
8]. Plasma generated through laser ablation of the material surface may include, not only chemical information of the material, but also physical information of the material surface. For example, the possibility of analyzing the physical properties of the surface of the material has been reported based on the characteristic that the spectral signal of plasma appears different depending on the stress, hardness, and roughness of the material [
9,
10,
11,
12].
In elemental measurement using LIBS, plasma induced by laser ablation plume can change shape depending on the ambient atmospheric pressure [
13]. In addition, the plasma itself is also affected by the type of atmospheric gas [
14,
15]. In a He gas atmosphere, the plasma is cooled so that the signals of the induced plasma atomic and ion emission lines are limited. In addition, in an Ar gas atmosphere, the temperature of the plasma increases, thereby amplifying the signal. Thus, laser-induced plasma interacts with the surrounding gas [
14,
16].
The energy propagation of plasma, which is the basis of signal measurement in LIBS analysis, is closely related to radiation [
17]. Emission energy radiated from the plasma is directional with respect to a specific irradiated surface. This direction can be expressed as the zenith angle (
) and azimuthal angle (
) of the spherical coordinate system. Therefore, the energy propagation of plasma tends to be proportional to the area projected on the observation plane. Gas flow around the plasma will affect the observation area thereof [
4]. As a result, a shift in the spectral line or increase or decrease in spectral intensity can be expected, compared to the LIBS signal in a static state with no gas flow.
In general, the LIBS analysis method does not require a vacuum environment, so it has the advantage of being suitable for remote measurement in extreme environments outside the laboratory, such as deep sea or outer space [
18,
19]. Under conditions of external gas flow, there is a significantly greater influence of the surrounding atmospheric flow compared to the plasma signal of laser ablation under the same conditions. Therefore, it is necessary to adjust the results for the plasma signal induced by laser irradiation according to the information of the surrounding gas flow, which affects the flow characteristics. Examples of existing methods for obtaining gas flow characteristics include in-pipe flow measurement methods, using a Pitot tube, gas sensors [
20,
21], ultrasonic flow meters [
22], optical fiber cantilevers [
23,
24], and surface plasmon resonance spectroscopy [
25]. However, these methods may be difficult to apply in the absence of controlled environmental conditions, and depending on specific objects, the scale, and interference from other analysis methods. Flow rate measurement using LIBS represents another new method.
In this study, with a gas flow around the plasma, the pattern of signal change in the LIBS spectrum was monitored to confirm the gas flow rate. Based on plasma sensitively reacting to the type of surrounding gas and the flow, the correlation between changes in flow rate and the signal of plasma observed by LIBS was explored. Theoretically, the effect of plasma deformation was predicted, and the signal of the plasma was measured and analyzed. Based on the results, the effects of the gas flow rate on the LIBS signal were confirmed both qualitatively and quantitatively.
2. Methodology and Experimental Setup
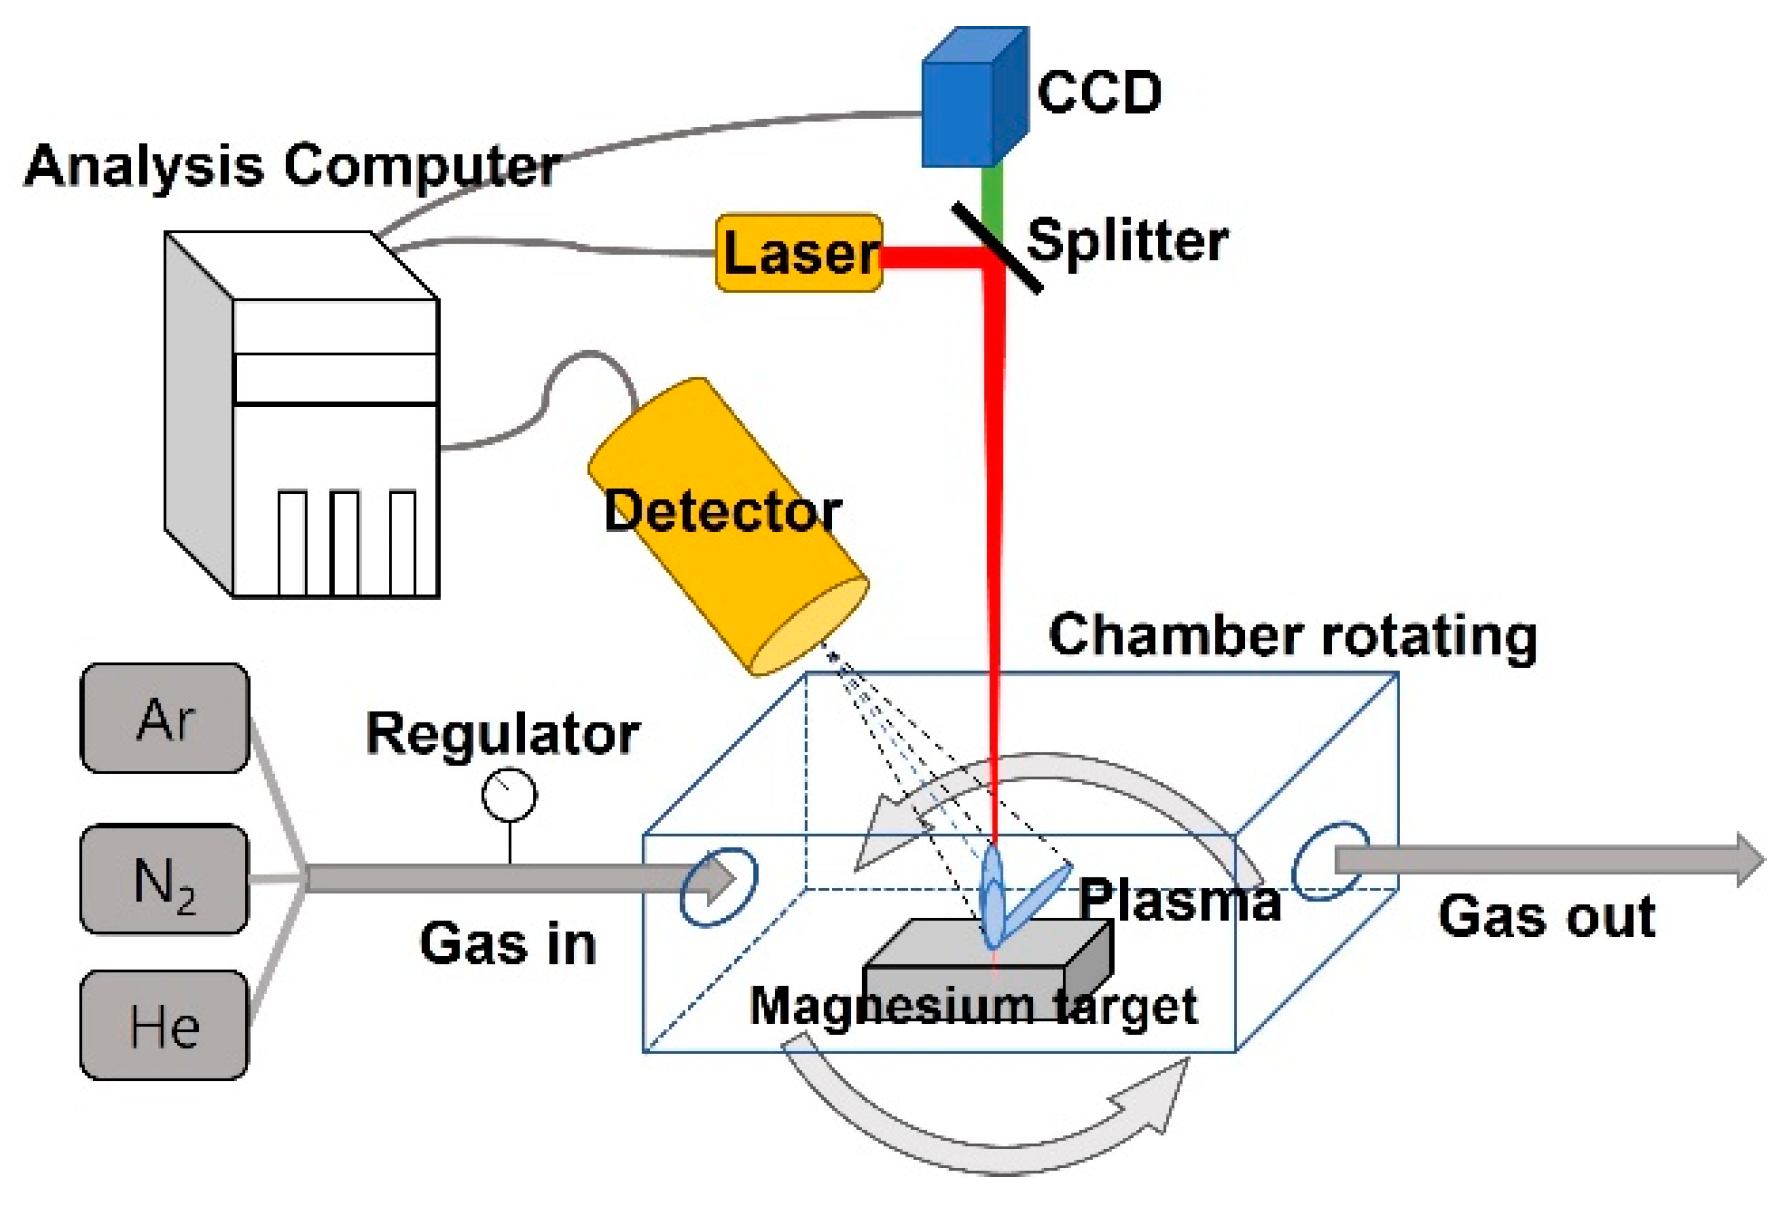
The experimental setup is shown in
Figure 3. To examine the effect of gas flow on plasma, a flow device using a chamber was designed. In a rectangular acrylic chamber with a width of 50 mm, length of 50 mm, and height of 30 mm, three gases (Ar, N
2, and He) flowed over the specimen in one direction. Plasma was generated by irradiating the specimen with a laser beam, and the spectral signal from the plasma was measured. The flow direction of the gas and incident path of the laser were both set up vertically, with the left side of the chamber set to 0°. The inlet flow direction of each gas flowing in the chamber was changed to 360° by rotating 30° counterclockwise from this reference point. The direction of gaseous flow induced by the influence of the outer wall of the chamber and the interference of the specimen setup for LIBS measurement did not match the direction of the surface on which the specimen was placed. Therefore, by changing the direction of the inlet flow by 360° and analyzing the resulting LIBS spectrum, meaningful results regarding the correlation between the gas flow and LIBS signal could be derived. This step was included in order to determine the inlet and outlet directions of the flowing gas, which showed a similar tendency to the modeling results. Through this process, it was possible to proceed with analysis of the change in signal of the LIBS according to the characteristics of the flow. The flowing gas was maintained at a volumetric flow rate of 300–420 cm
3/s inside the chamber; in this state, plasma was generated on the specimen through the laser. Generating plasma by focusing a laser beam directly into the flow stream without any solid target is ideal for verifying the relationship, but this requires a high-quality, high-energy laser beam source. In addition, it is relatively difficult to maintain consistency in terms of the generation of plasma in the flowing gas during the experiment.
A magnesium (Mg) alloy with the elemental composition shown in
Table 1 was used as a target medium for generating plasma by laser ablation. The signal detector that acquired the LIBS plasma signal was fixed in a specific direction, as shown in
Figure 3. In this setup, the change in plasma signal induced by gas flow could be expressed as a function of the angle of the detector and inlet direction of the flowing gas. In the LIBS setup used in the experiment (RT100; Applied Spectra), an Nd:YAG pulsed laser with a wavelength of 1064 nm was used as the laser beam source (
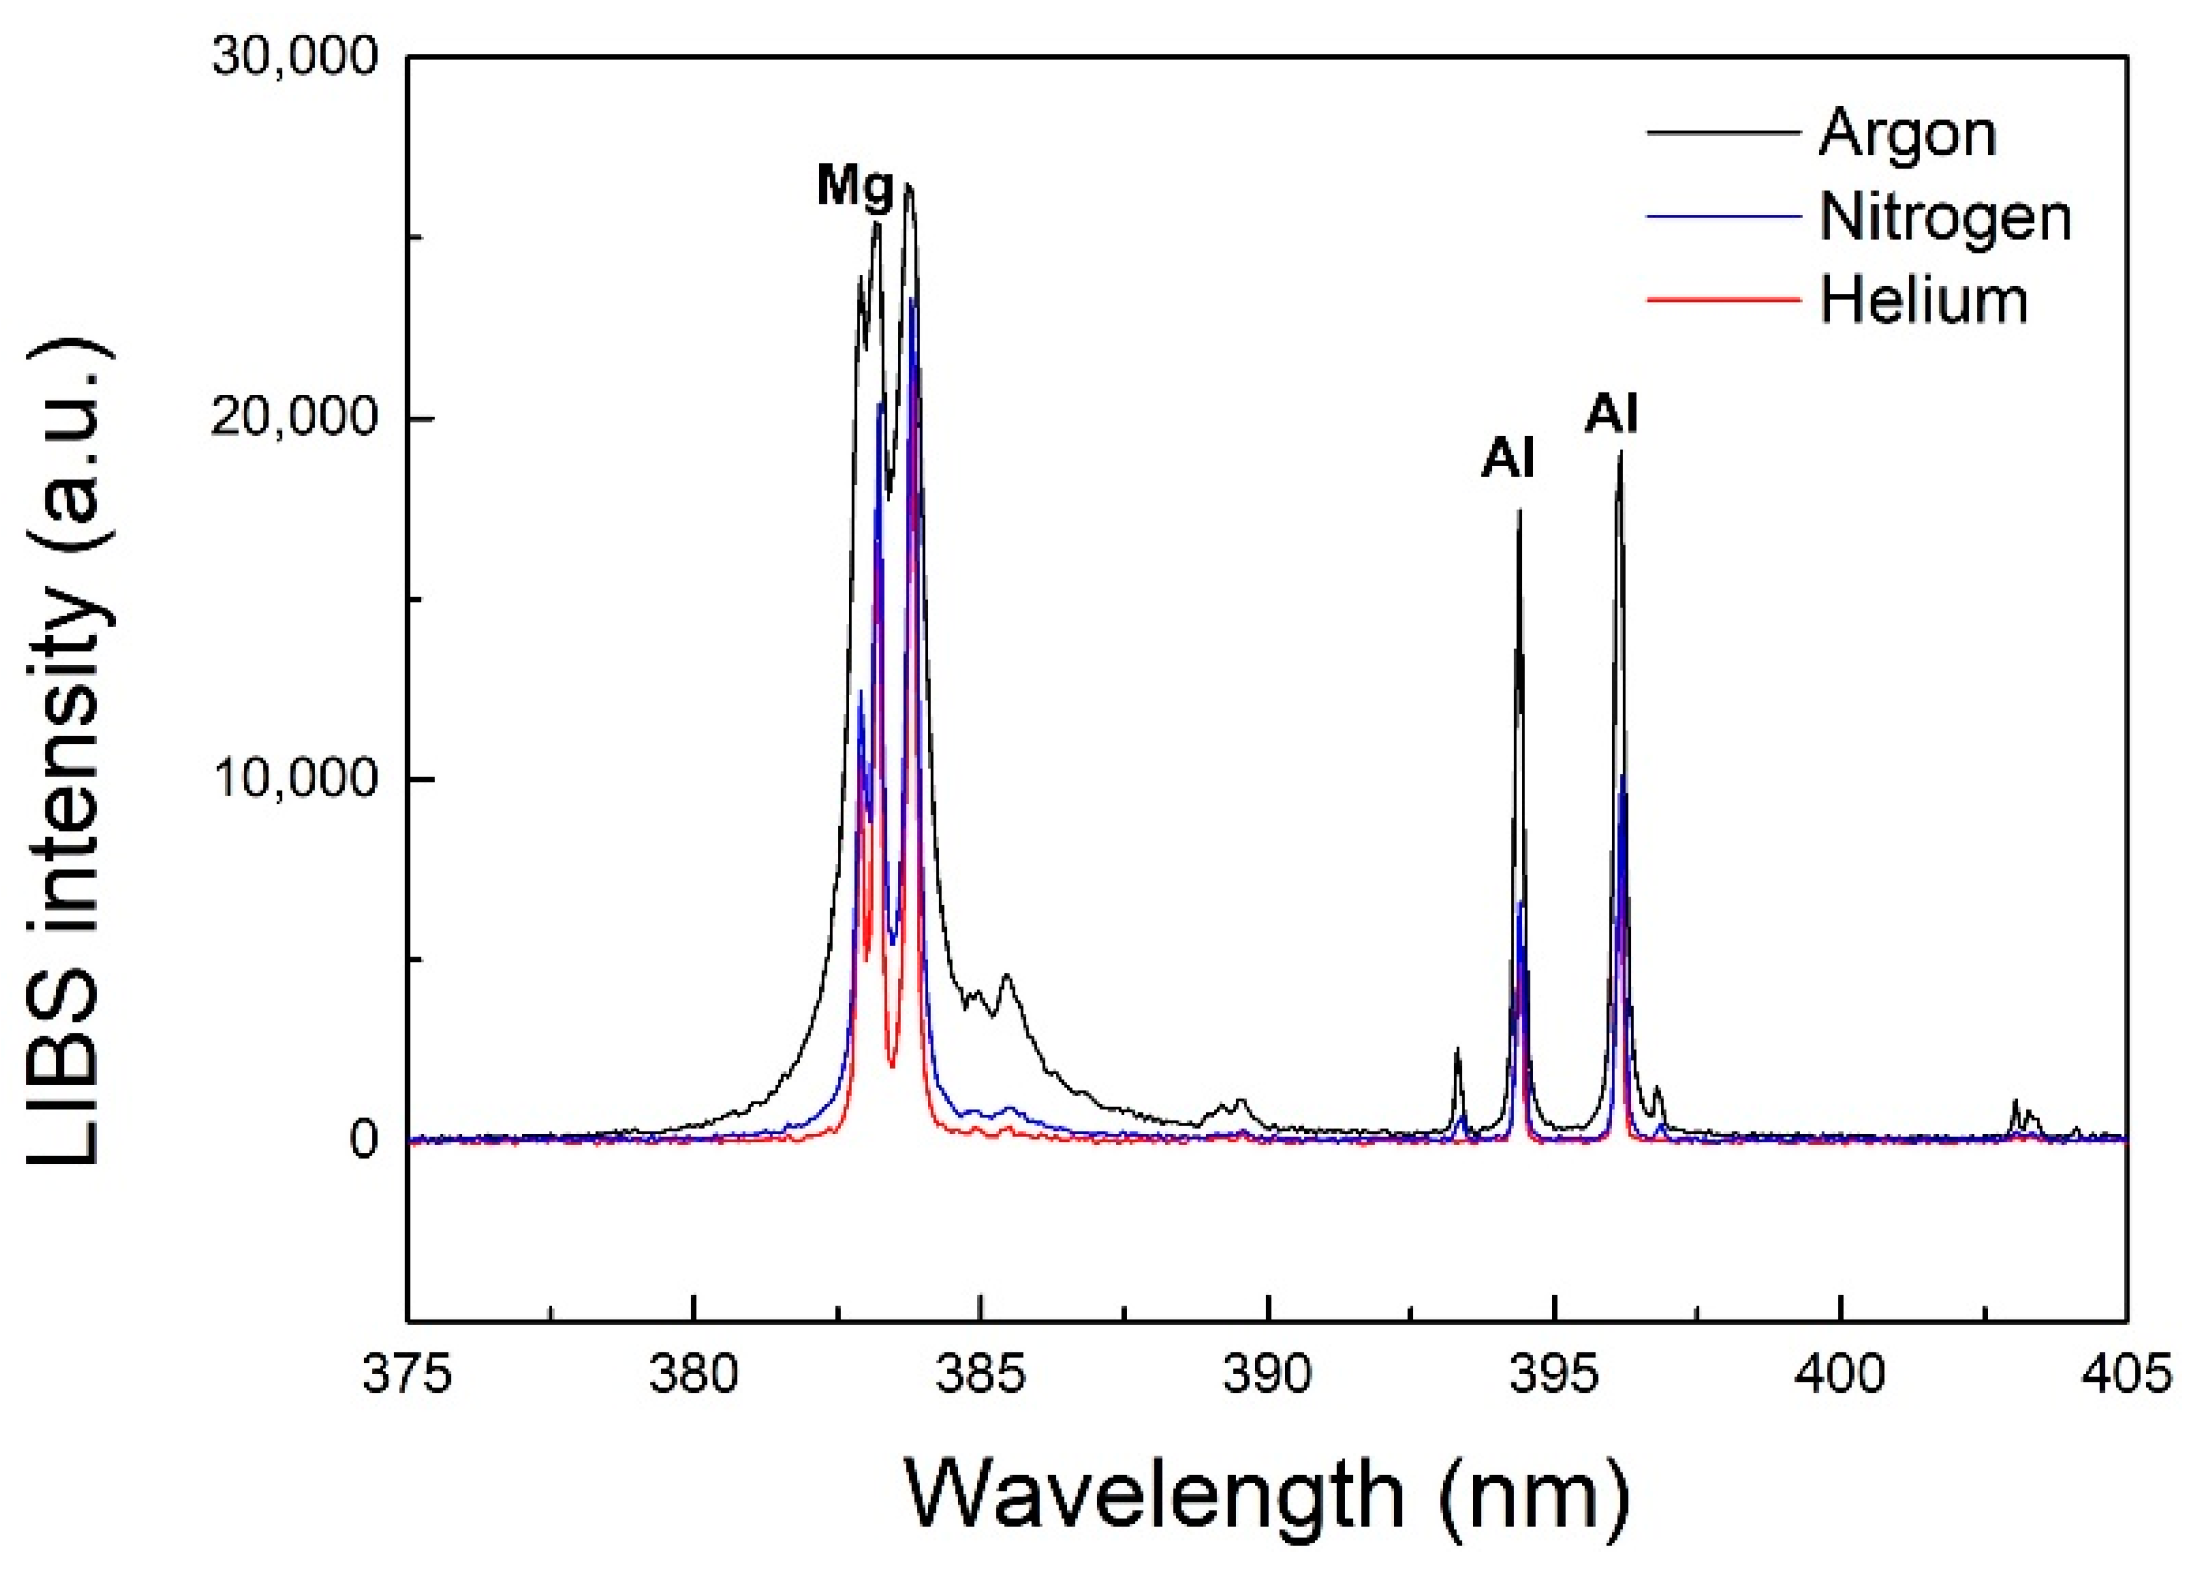
Table 2). This laser source irradiated the material with an energy of 16 mJ per pulse. The temporal pulse width of the laser was 5 ns, and the size of the spot focused by a lens on the surface of the laser beam was around 100 μm. Plasma generated by the laser beam was collected in the form of a spectral line using a signal detector. The gate delay time of the signal detector was set to 0.1 μs. Quantitative analysis of specific elements in the sample was performed using the data of the signal detected in the plasma to confirm the flow characteristics. The surface of the Mg alloy specimen was irradiated with the laser a total of 30 times, and the analysis was performed using an average of 29 spectral signals (excluding the first signal on the top surface). As the surface of the target was irradiated with the laser, ablation at a depth of about 2 μm was observed each time the sample was irradiated. Simultaneous with the laser ablation, a blind hole was created on the surface of the specimen. There may be differences in the plasma signal measurement depending on the microscopic shape of the sample surface. However, as the size of the generated micro-holes was thought to be small compared to the size of the plasma, the effect on gas flow of the holes created on the surface was negligible. Examples of the spectral signal and signal intensity of the Mg specimen used in this experiment are shown in
Figure 4. The line spectrum of the Mg alloy specimen had a high signal intensity value even with a low-energy laser pulse. Due to this characteristic, sensitivity was relatively low in terms of confirming the correlation with gas flow. Therefore, spectral analysis of Mg was not appropriate. On the other hand, in the case of other elements in the alloy, such as aluminum (Al), changes in the intensity of the spectrum could be clearly seen according to the change in plasma. In this study, the spectrum of Al in Mg alloy with a wavelength of 396.152 nm was analyzed.
Table 3 shows the experimental parameters and conditions for each case.
3. Results and Discussion
3.1. View Factor Evaluation According to the Shape of Plasma
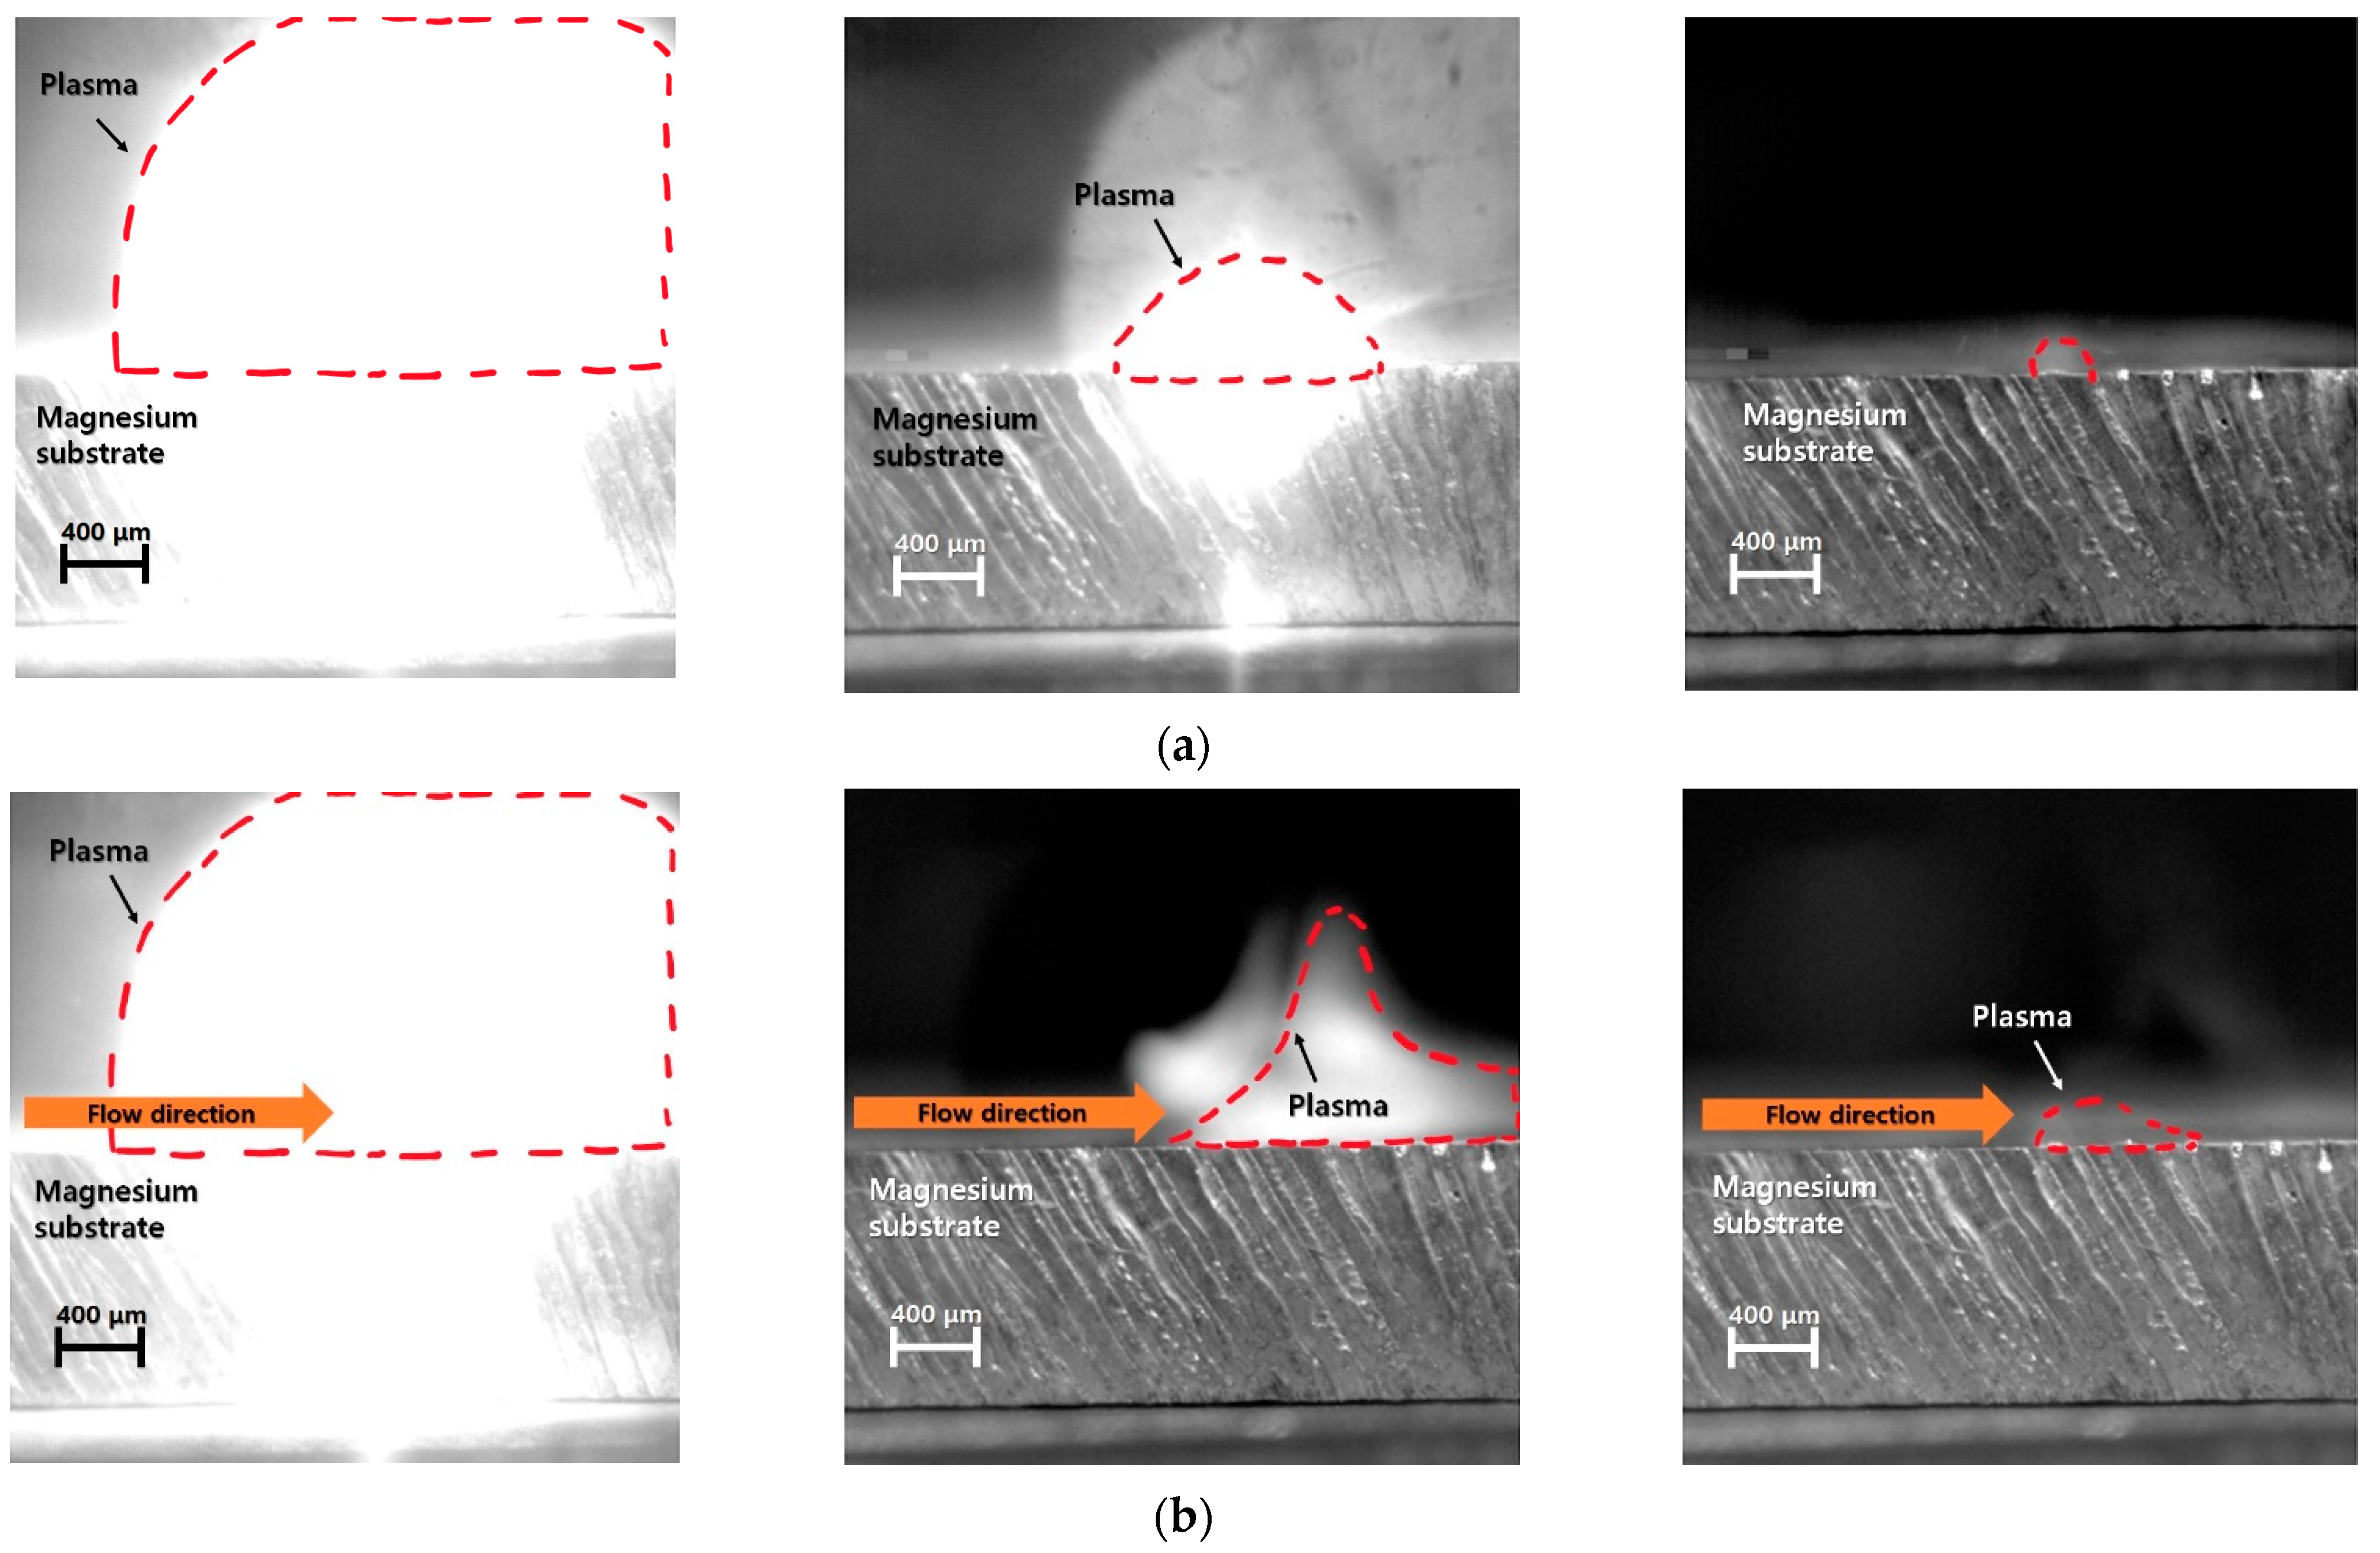
Figure 5 shows a photograph of the laser-induced plasma taken with a high-speed camera. The shape, diffusion, and extinction of the plasma could be confirmed.
Figure 5a shows a symmetrical shape with no flow, and the generation and extinction of plasma.
Figure 5b shows the shape of plasma with N
2 gas flowing at a rate of 350 cm
3/s from left to right. The plasma was affected by the gas flow; the shape was not symmetrical and appeared somewhat unstable. It is clear that the plasma was affected by the flow pressure. In this case, the shape of the plasma was inclined in the flow direction; if it matched the direction of the signal detector, it could be expected that the magnitude of the plasma signal would change according to the observation direction.
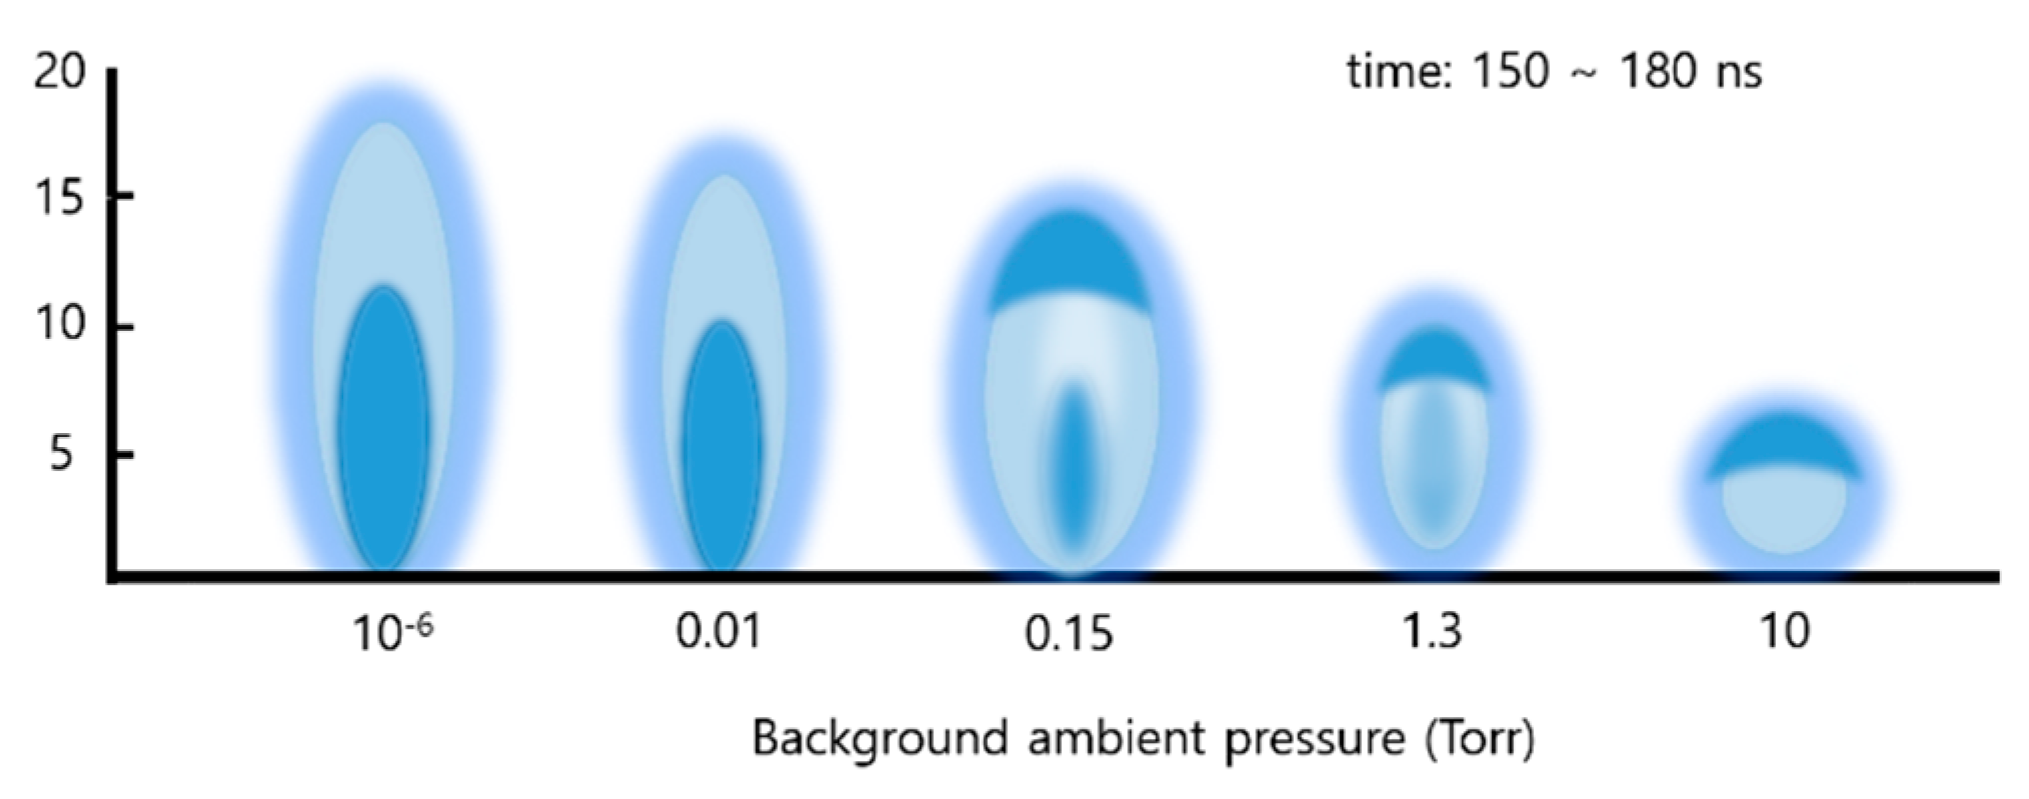
Harilal et al. reported that the size and shape of laser-induced plasma are affected by ambient atmospheric pressure [
4]. Plasma generated on the surface of a material by a laser goes through the stages of generation, diffusion, and extinction. In previous studies, the size of plasma was represented schematically (as shown in
Figure 6) according to time and ambient pressure [
4]. In this study, the shape of plasma after 0.1 μs had elapsed under atmospheric pressure was used as a model, and for simplicity of calculation, the plasma was assumed to be a cylinder with a diameter of 1 mm and height of 10 mm.
The effect of ambient gas flow on plasma can be predicted by numerically simplifying its effect on plasma signal measurements. In LIBS, a plasma signal is acquired from plasma received by a signal detector. This process can predict interactions of the radiator and signal detector through simplified modeling, and these results can be compared in a limited manner with experimental values. The radiation of the plasma surface can be measured by the signal detector, and the signal acquired by the signal detector varies according to the shape or projected area of the plasma surface. To apply this principle, the plasma is assumed to have a simple hemispherical, elliptical, or cylindrical shape. If the change in strength of the radiation measured on the simplified surface is verified, it is possible to predict the change in the strength of the signals from the detector with respect to the change in plasma shape.
In terms of radiation, the ratio between the amount of the surface of the radiator and surface of the absorber that can be viewed in the observation direction is called the view factor (
Figure 7). The view factor can be expressed as a function of the projected area of the surfaces where radiation occurs and the distance between the two bodies. The shape factor depends on the geometry of the body, or on the irradiation and radiation on the surface of the object. Moreover, it is a purely geometric parameter independent of surface properties, such as temperature.
The most widely used methods for deriving shape factors include direct integration [
26], ray casting [
27], and the Monte Carlo method [
28]. In this study, the shape factor was modeled using a direct integration method. The objects in the model are a plasma and a signal detector, which are assumed to be related as two blackbody radiators. The plasma has an area of
A1 and the signal detector has an area of
A2, taking into account the radiation between the two. The two objects are separated by a distance
r, and the normals (
n1,
n2) on the surface of each object have angles of
and
with respect to the line connecting them (
Figure 7). The shape factor between two surfaces is determined by integrating over the entire area of these bodies using the following Equation:
where
F12 is the fraction of radiation entering surface 2 from surface 1.
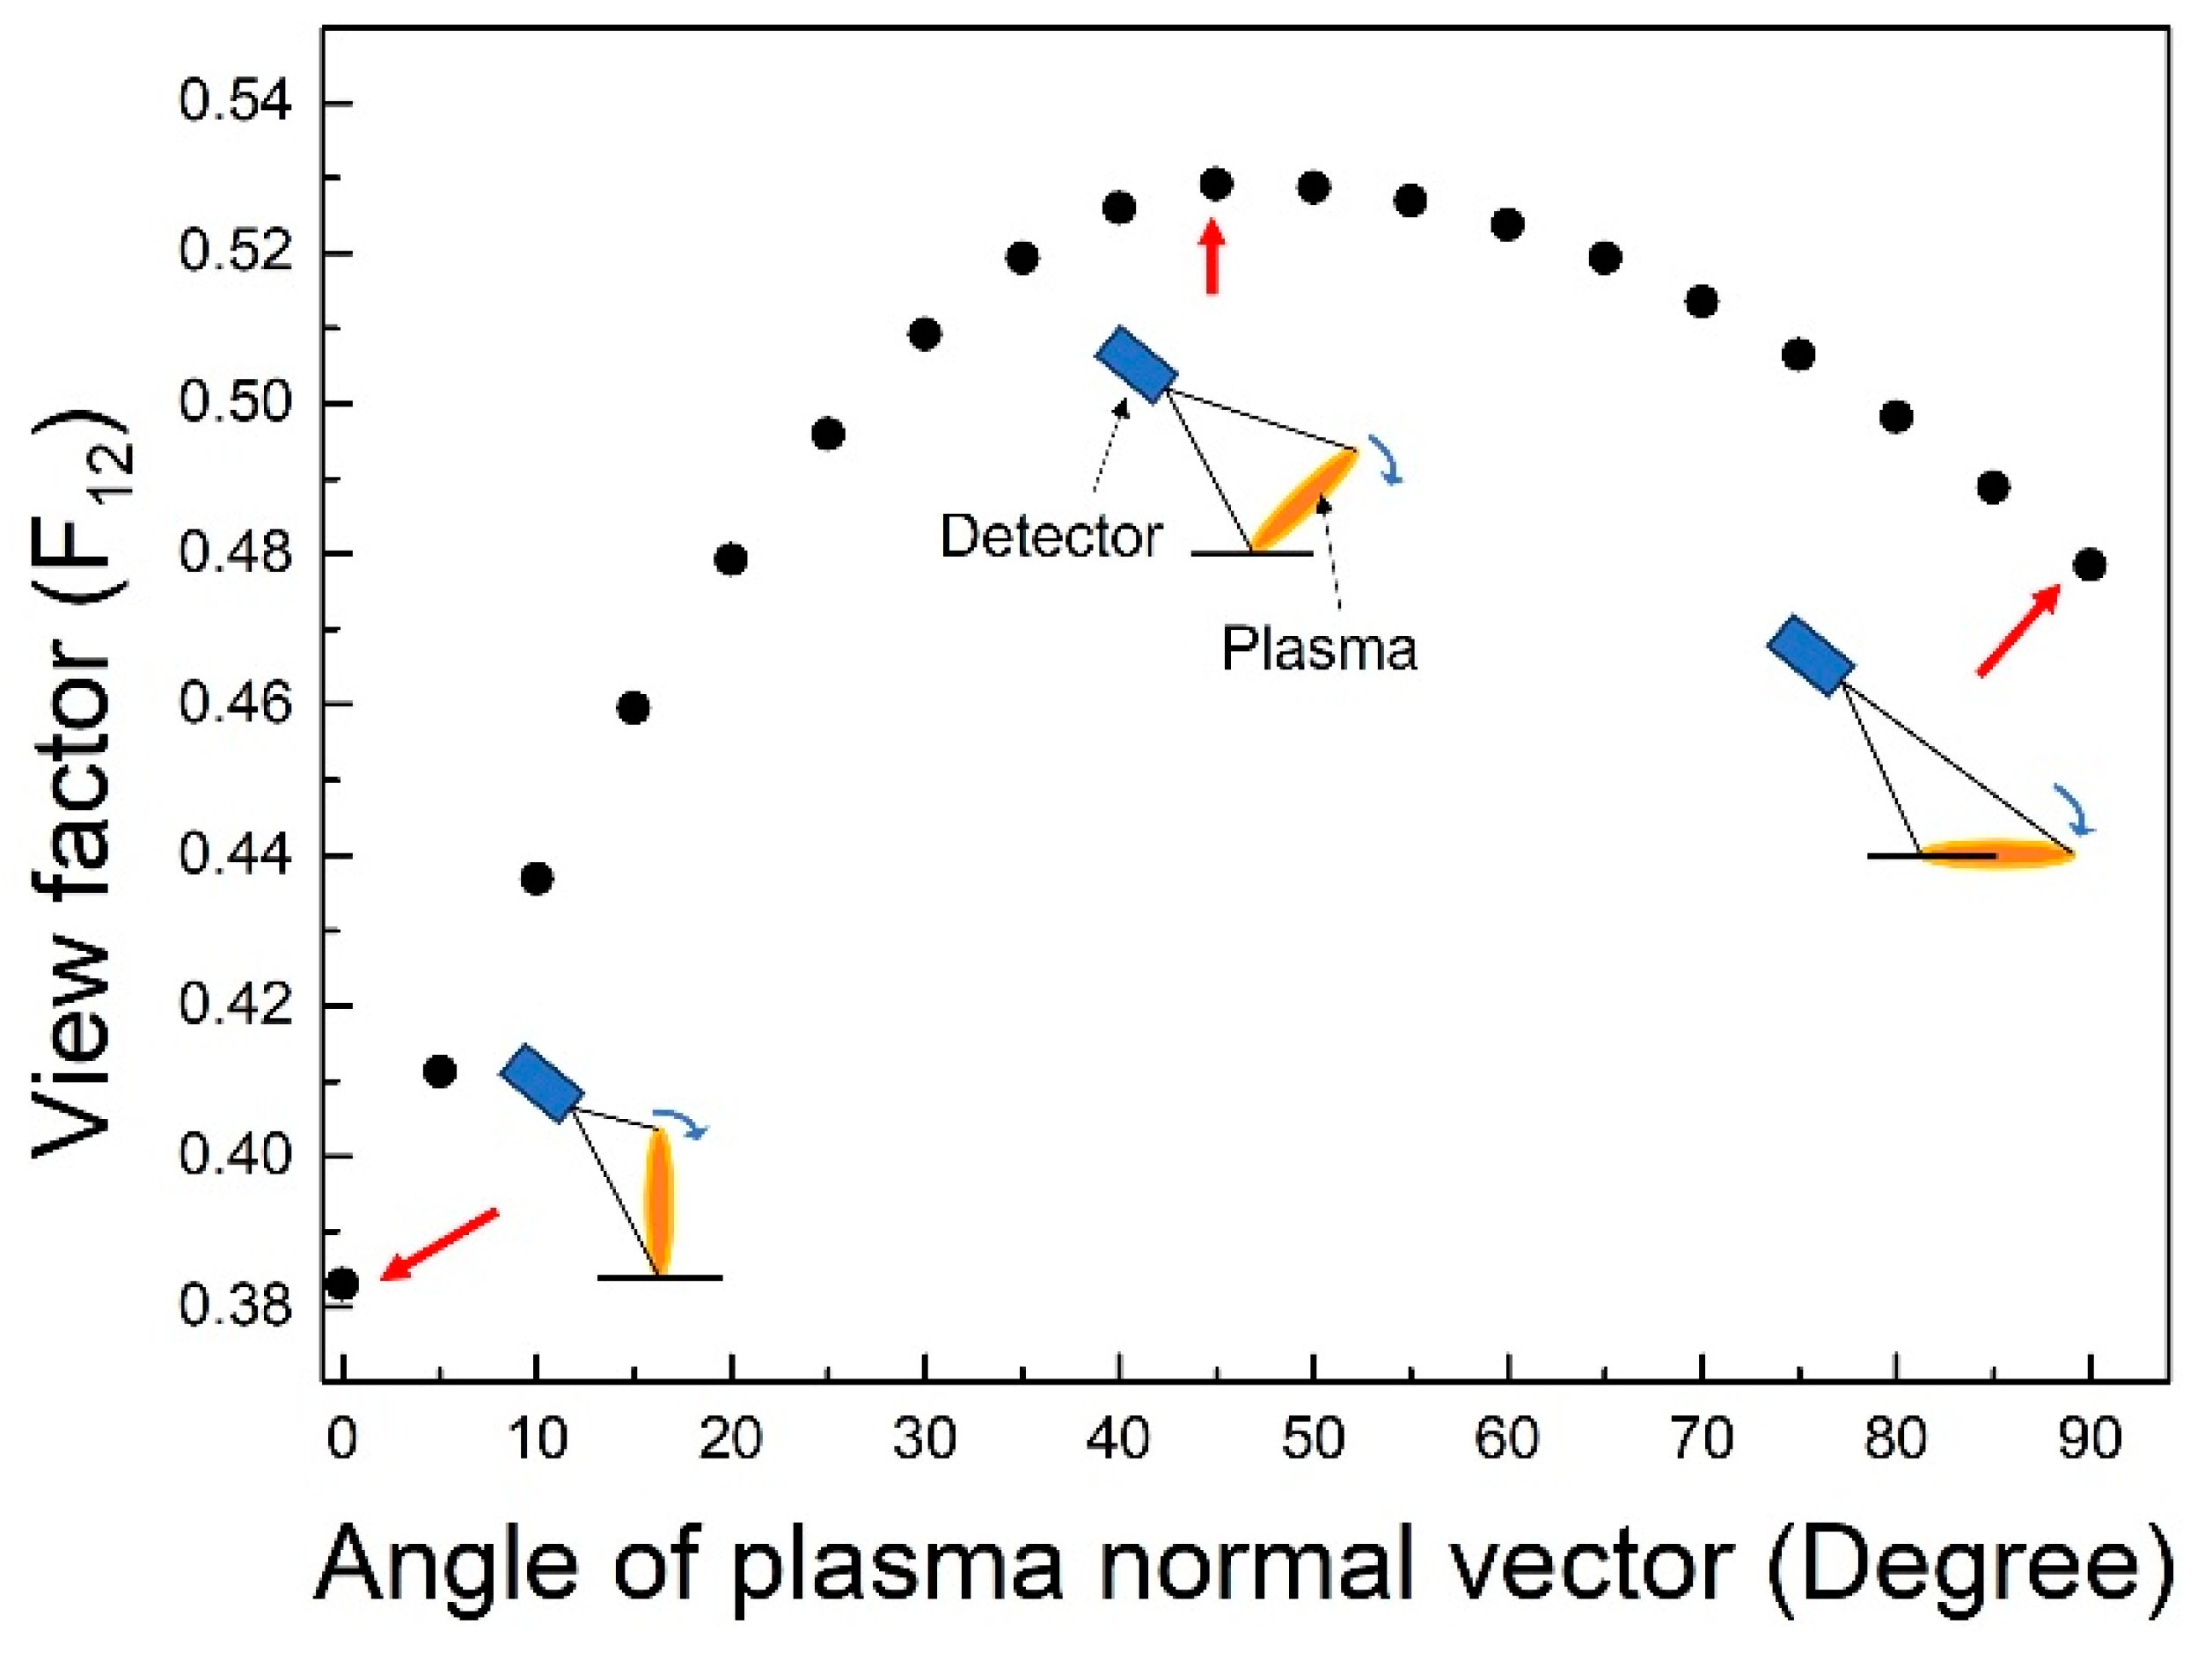
As described previously, when the vector of gas flow is on a virtual surface, including the plasma and signal detector, it is possible to calculate the view factor between the plasma and signal detector based on the zenith angle (range: 0°–90°). The change in view factor according to the observation angle of the plasma of the signal detector is shown in
Figure 8, which was generated using Equation (1). When the normal vector of the plasma coincides with the normal vector of the detector, the view factor had a maximum value of 0.53. In the plasma or detector position at this angle, the value of the shape factor decreases. These results show that the flow can change the value of the plasma signal acquired from the detector. In addition, the decrease in the view factor was larger when the plasma changed shape as it moved toward, rather than away from, the detector. Therefore, the sensitivity of the gas flow measurement changes according to whether the flow is directed toward or away from the detector. This view factor changes according to the change in strength of the plasma signal, which is affected by flow in the LIBS system.
3.2. Numerical Analysis Using Wave Equation
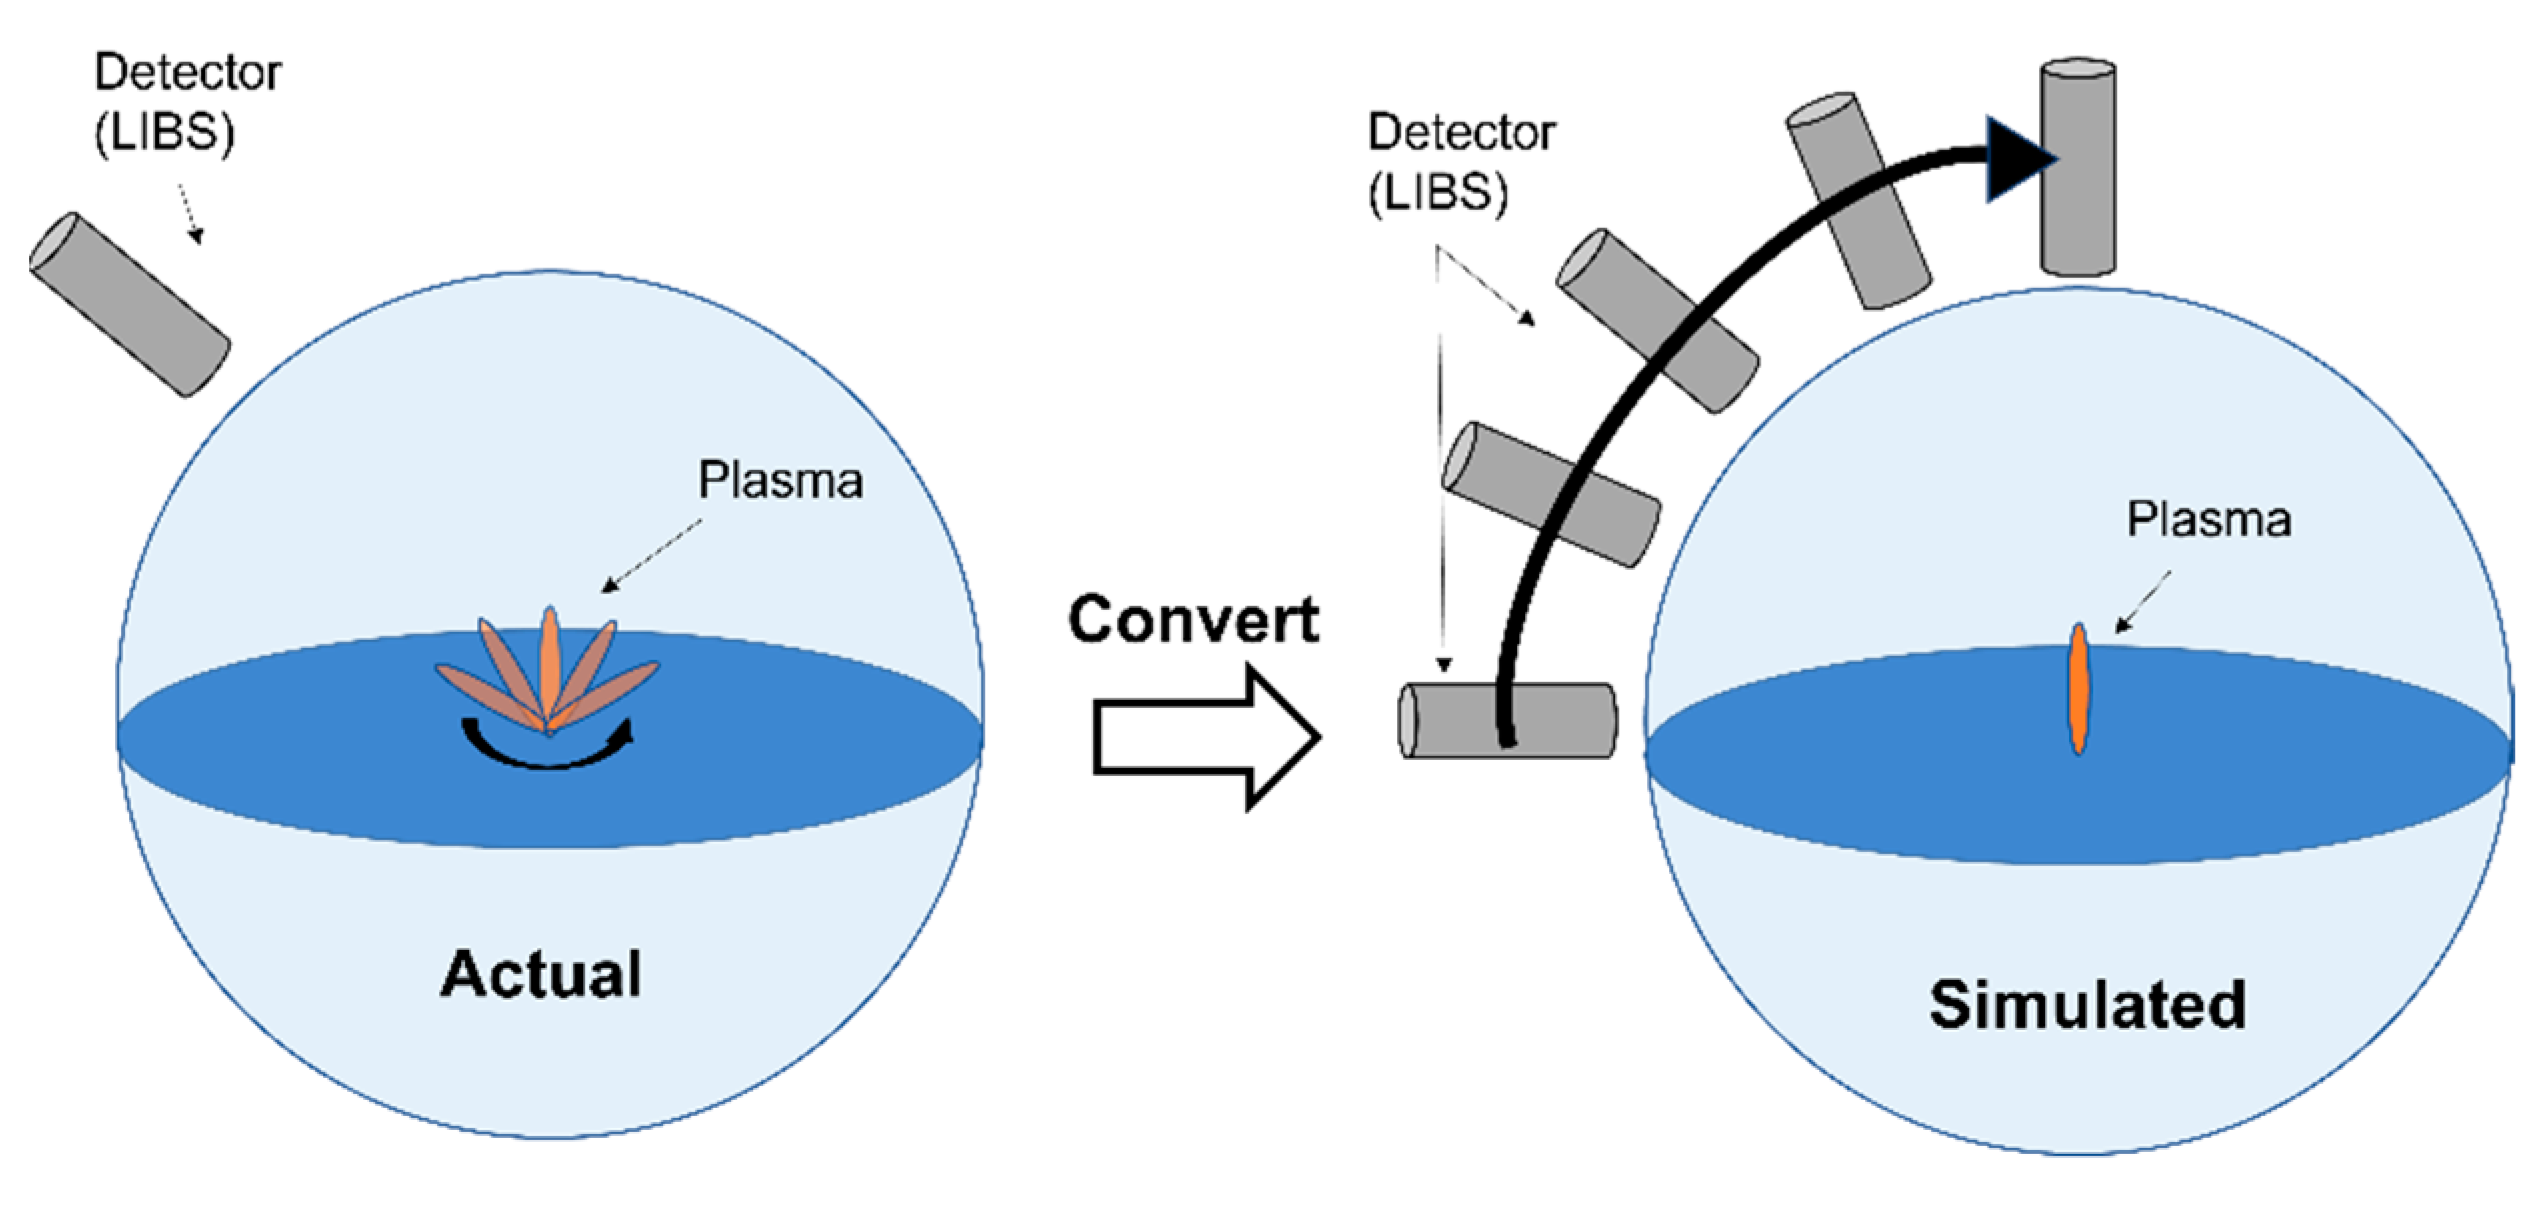
In addition to analysis of the view factor, the propagation of plasma can be studied by numerical methods using the wave equation. In the analysis of the view factor, only the change in projection shape detected by the detector was considered. In the analysis using the wave equation, the radiation energy at the surface of the plasma was regarded as an electromagnetic wave radiating in all directions. When the electromagnetic wave generated by plasma is propagated from a finite-area source rather than a point source, the intensity value of the electromagnetic wave differs depending on the location of the detector. In reality, the shape of the plasma changes according to the flow conditions, and the detector is fixed. In the simulation, only the relative values of the two bodies were important, so for modeling convenience the plasma signal size was calculated by fixing the plasma and changing the position of the detector (
Figure 9).
Commercial software (Multiphysics; COMSOL) was used to confirm the propagation of electromagnetic waves, and to calculate the magnitude of the electromagnetic field signal at a specific location. The simulation was conducted by setting the electric field source corresponding to the plasma at the left boundary of the quadrant and emitting an electric field from the source (
Figure 10a). The magnitude of the superimposed wavelength of the electric field wave at nine positions, separated by a zenith angle of 1/4 arc of the electric field radiated from the source, was calculated. The governing equation used in the simulation was as follows:
where
μ is relative permeability, ε is relative permittivity,
t is time, and
E is the electric field. Perfect electric conductor and scattering boundary conditions were chosen. In the quarter hemisphere, the symmetrical interface was set as a perfect electric conductor. The condition for this boundary can be expressed by the following Equation:
In the remaining region, the scattering boundary condition was set so that the electric field was completely propagated outside the domain and did not affect its interior.
Figure 10b shows the two-dimensional shape of the propagated electromagnetic wave. Similar to the analysis of the view factor, the magnitude of the electric field was strong at the position where it could be well intercepted.
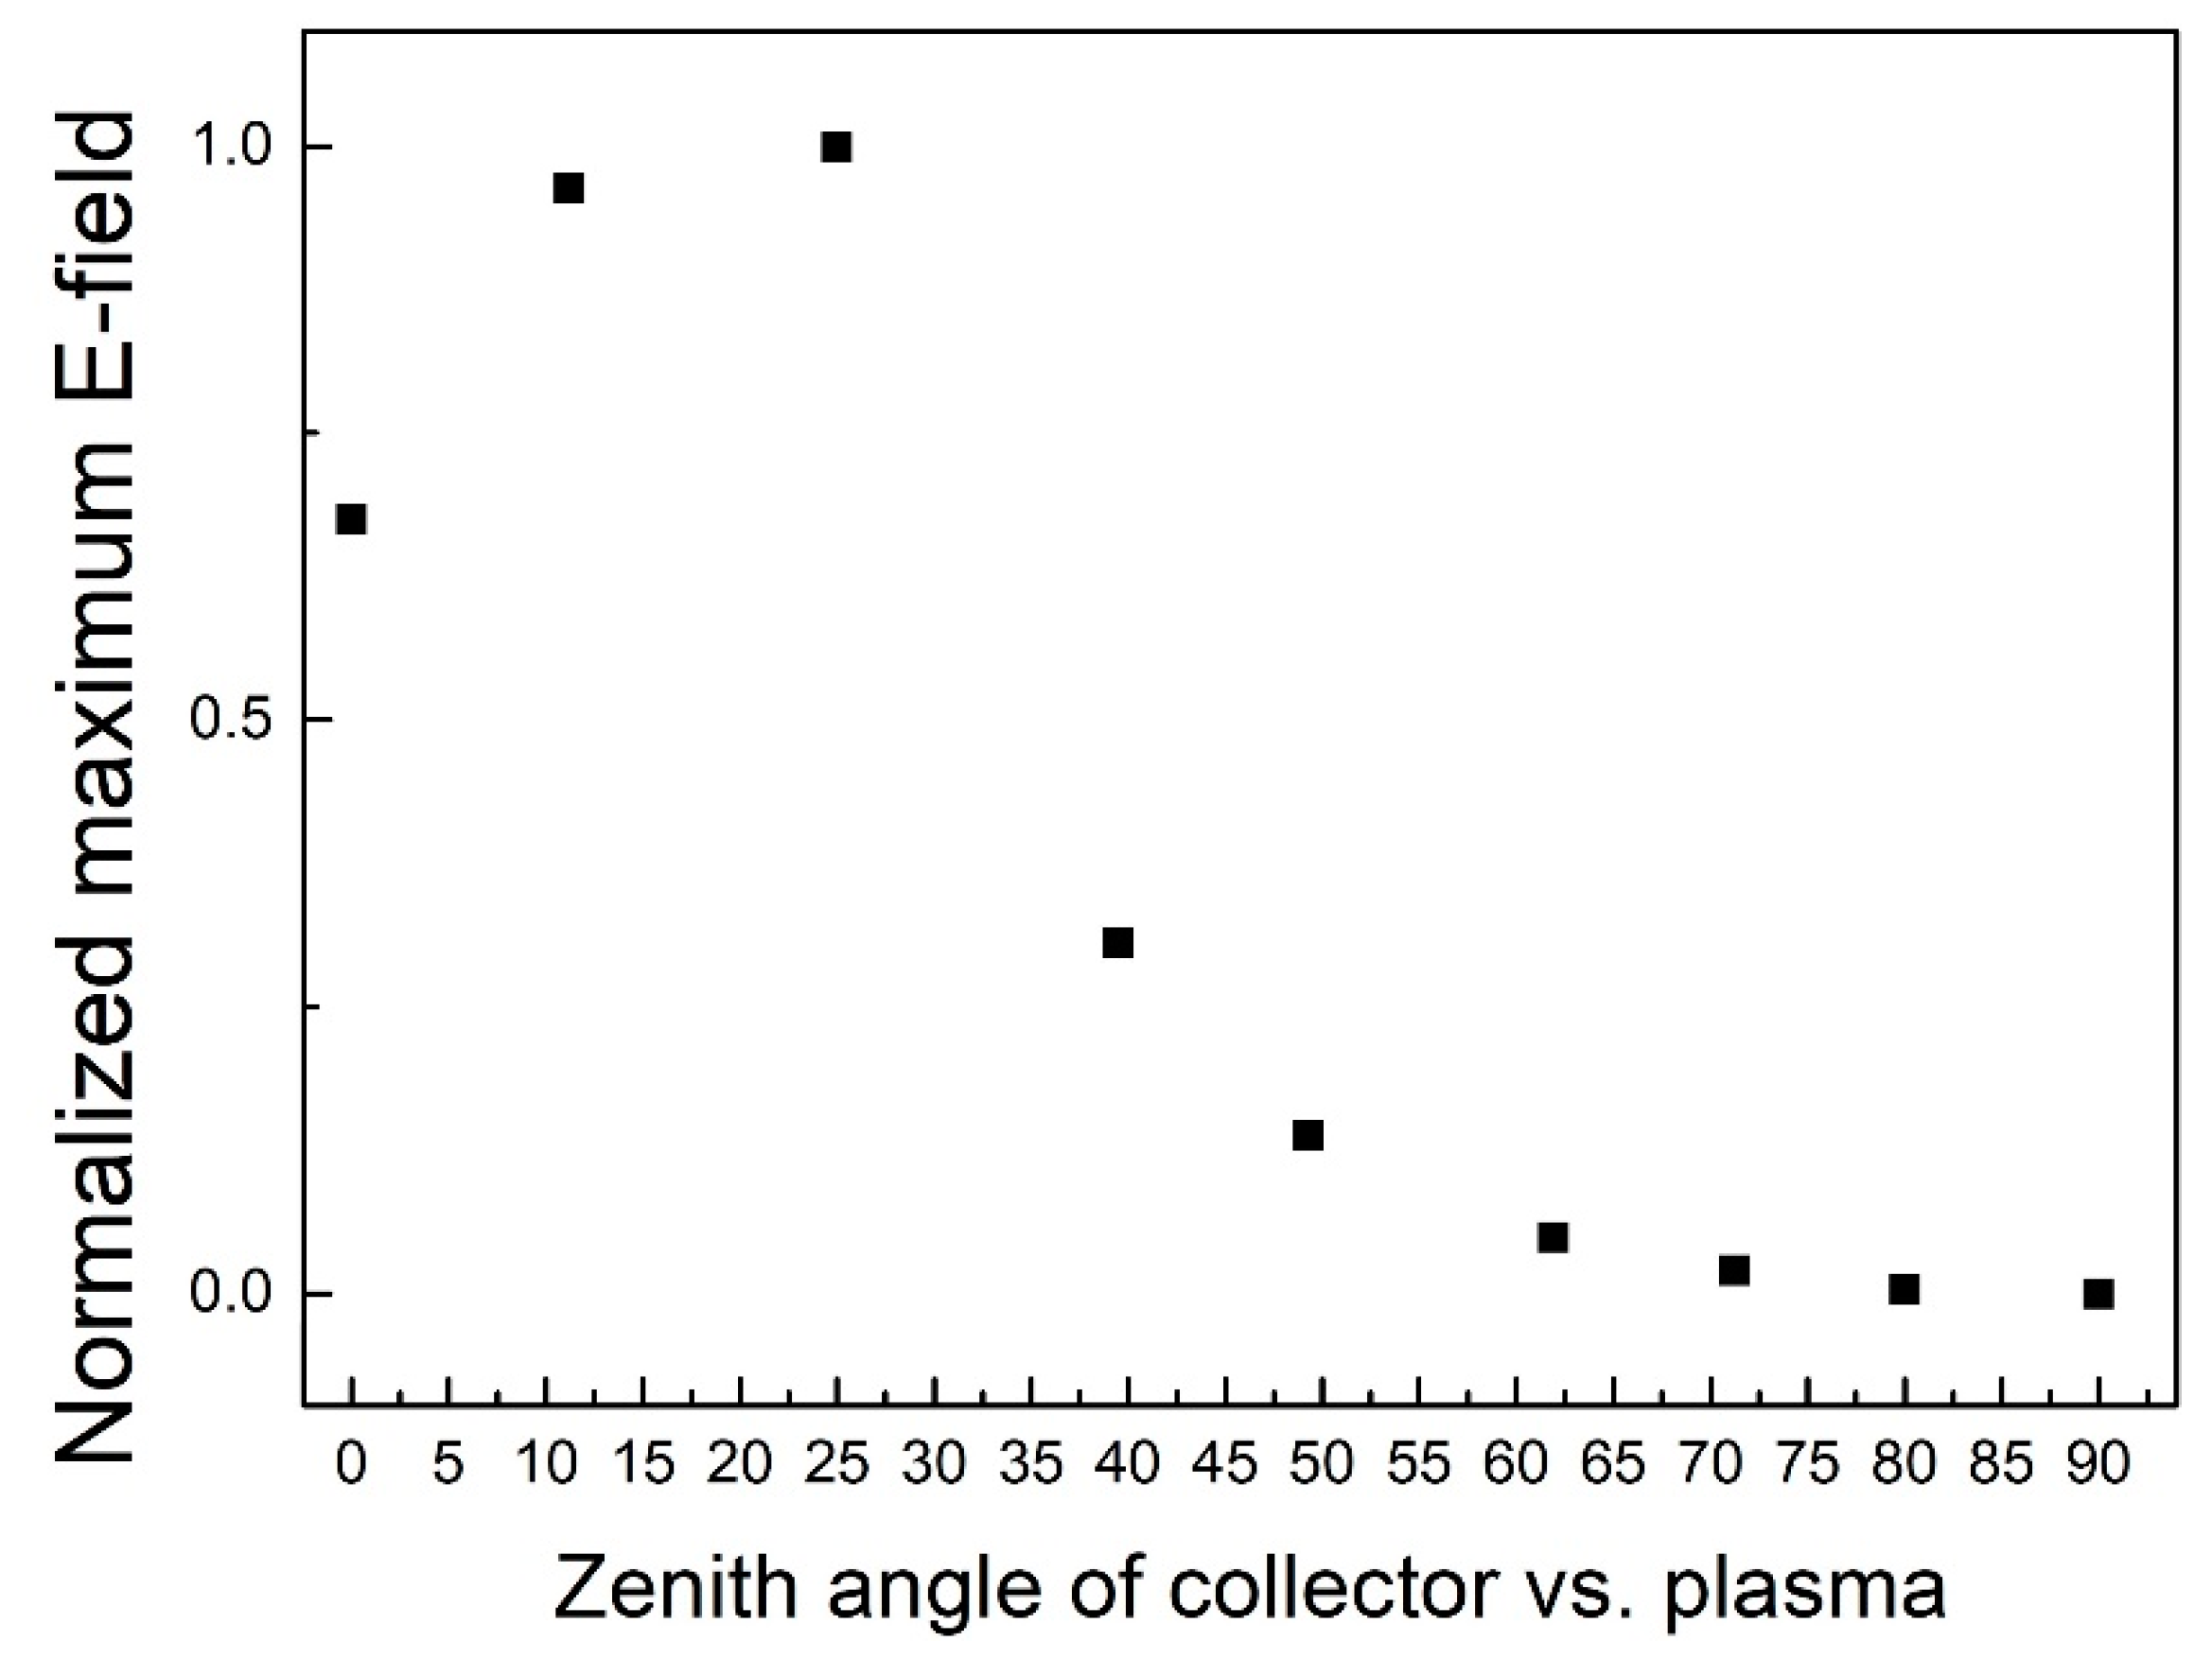
Figure 11 shows the maximum intensity value of the electric field, calculated by dividing the boundary of the quadrant into nine equal parts. The calculated electric field was normalized based on the intensity in the quadrant relative to the electric field intensity at the source. For modeling, the observation direction of the signal detector and plasma was set to a zenith angle of 0°–90° with respect to the point of plasma generation. The peak intensity of the electromagnetic wave generated from the linear source increased to approximately 24.35% as the observation direction changed from 0° to approximately 35°, and decreased thereafter. The minimum value was about 4.27% at a zenith angle of 90°. In addition, regarding the change of the electric field signal, an increase was calculated between 0° and 35°, followed by a decrease above 35°. Thus, when there is a change in the shape of the plasma due to flow, the signal value changes according to the relative position of the detector. From these results, a specific relationship can be inferred between the plasma signal acquired and position of the detector. In addition, it can be expected that the change in plasma shape, induced by flow, will appear similar to the change in electric field signal according to the amount of flow.
It should be noted that, unlike the actual experiment, in this analysis the effect of various flowing gases was not considered. Plasma is diffused and condensed according to the type of flowing gas. This effect can be compensated for by comparison of the relative strength of the signals for various flowing gases. In addition, the case in which reflection of the radiation occurs at the bottom interface (where the plasma was generated) was not considered in the analysis of the radiation of the plasma; the deviation was not quantified. Although this simulation had clear limitations, it is still meaningful as it allowed assessment of plasma energy propagation according to the relative positions of the plasma and detector, where the relative shape change of plasma in such a simulation can be interpreted as a function related to the flow of gas. This can then be confirmed by comparison with experiments.
3.3. Experimental Analysis of LIBS Signal Changes in Flow Fields
In the LIBS experiment, the locations of the plasma generator, detector, and inlet and outlet ports for gas flow are fixed. However, it is difficult to accurately predict the flow direction that most affects the plasma, due to the presence of chamber walls, the jig for the target, and the laser delivery optics where the flow exists. Therefore, it is necessary to determine the azimuth of an inlet port capable of obtaining a meaningful LIBS signal assuming a fixed detector. If the direction (azimuth) of a specific flow is determined experimentally, the relationship between the flow rate and the signal can be predicted.
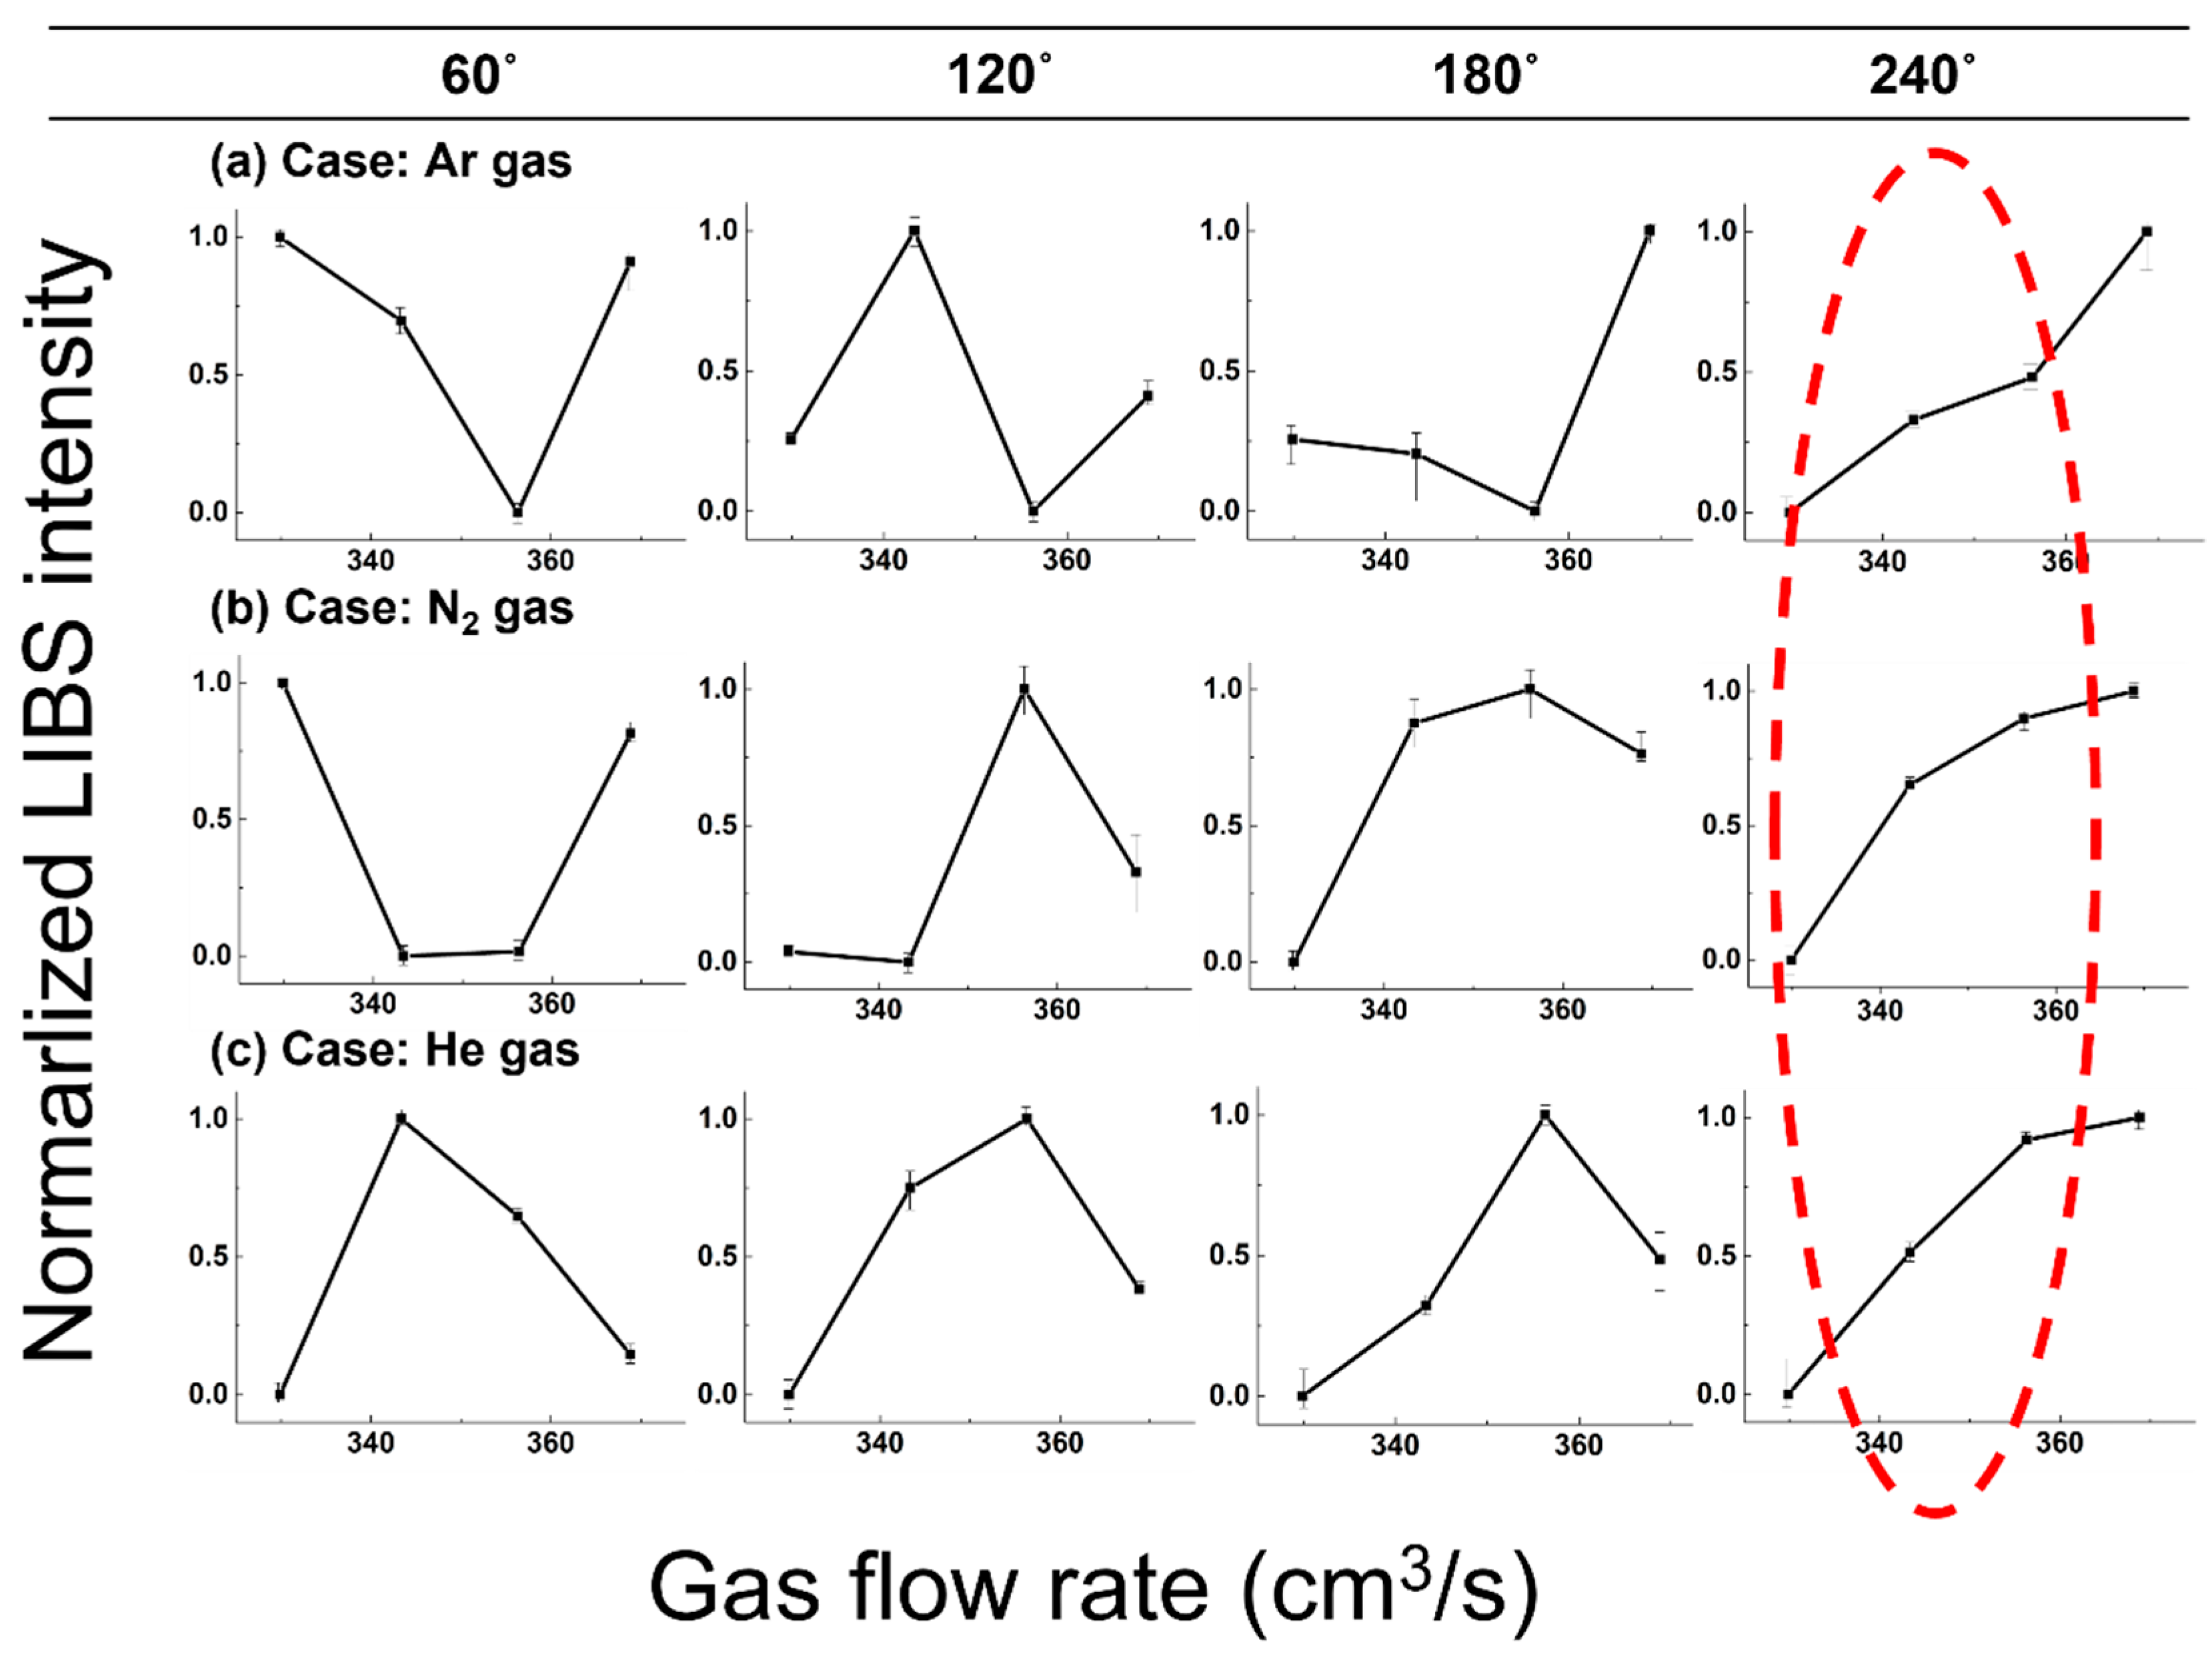
Figure 12 shows the change in LIBS signal amplitude according to the flow direction (azimuth) of the flowing gas. The changes in intensity of the LIBS signal were measured while the flowing gas was rotated around the plasma generated by the laser. The flowing gases used in the experiment were Ar, N
2, and He, and the signal changes of the Al element (wavelength = 396.152 nm) were measured in the counterclockwise direction relative to the reference point described above. The gas flow rate confirmed the change in plasma signal in the range of 300–420 cm
3/s. Combined with the measurement results, the correlation between the flow rate and signal was relatively clear with a gas outflow direction of 240° and specific azimuth angle for Ar, N
2, and He. At this angle, as the flow rate increased, the LIBS signal strength tended to increase. On the other hand, the flow rate change and LIBS signal strength changed irregularly at 60°, 120°, and 180°. Therefore, 240° coincided with the gas flow and detector directions, indicating that it is a suitable angle for gas flow measurement in this experimental setup.
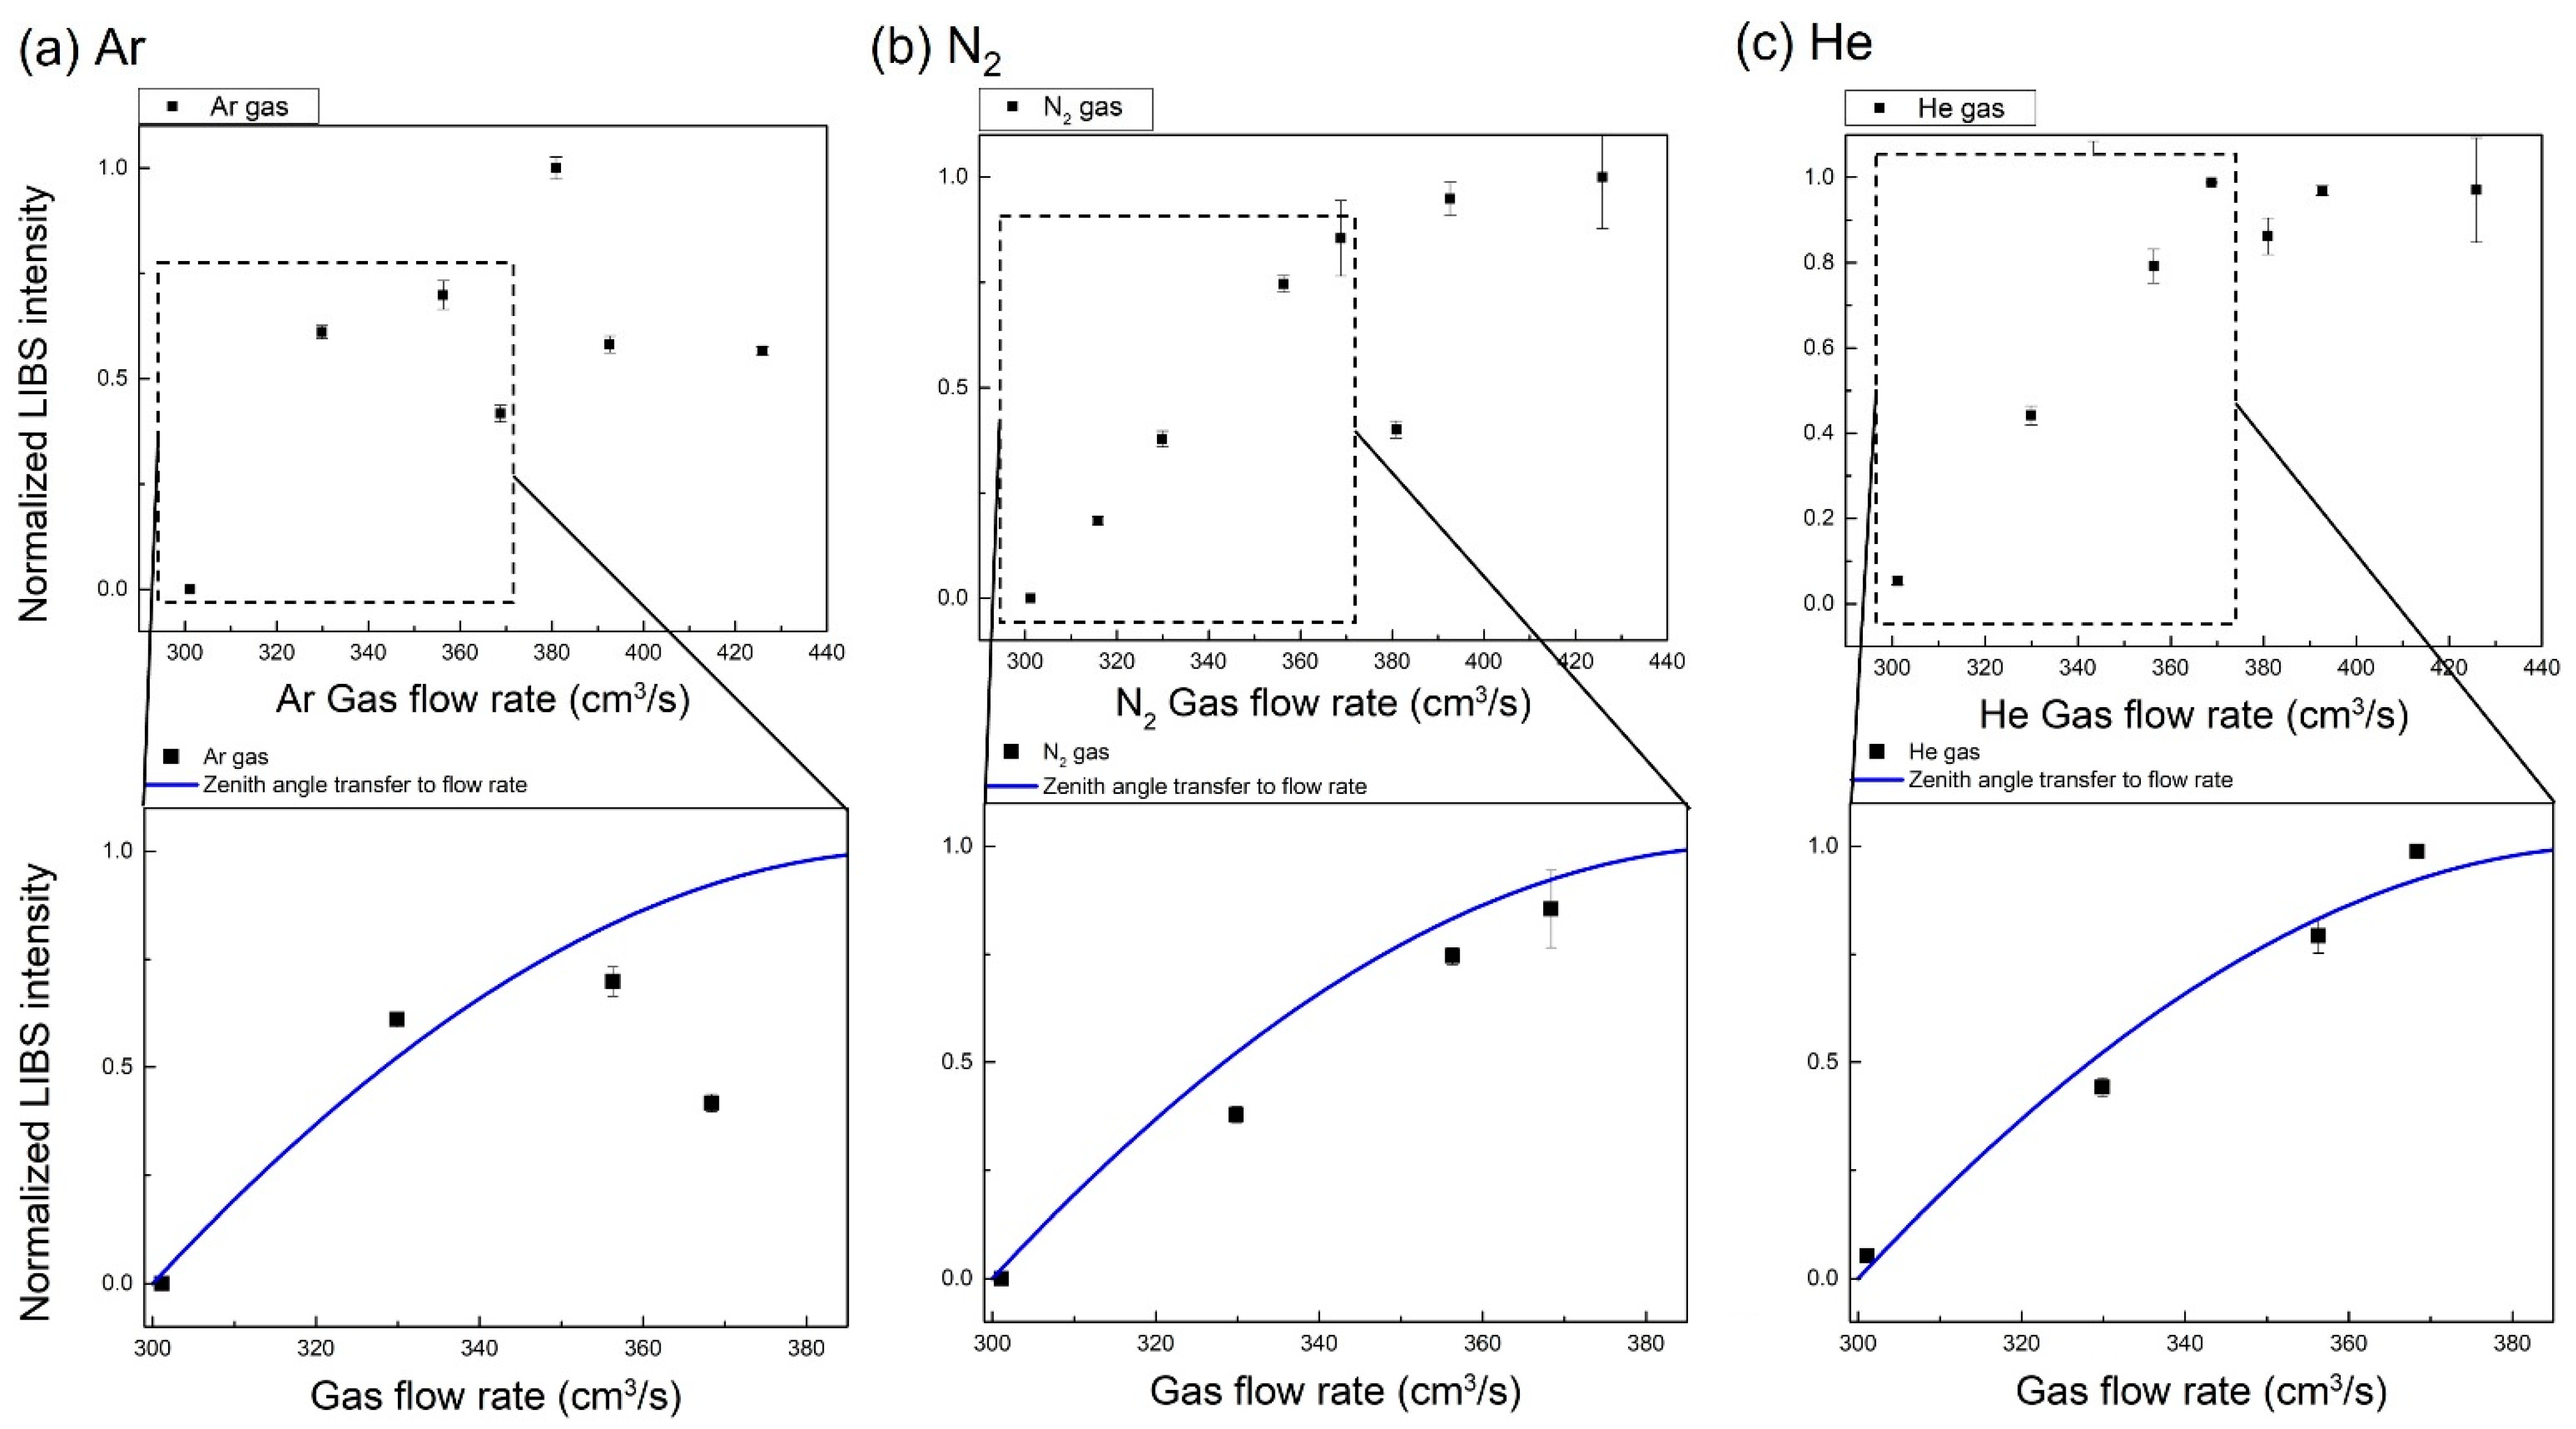
When the direction of gas flow is properly aligned in this setup, the LIBS signal strength changes according to gas flow in atmospheres of Ar, N
2, and He (
Figure 13). To allow comparison, the experimentally obtained LIBS signal was normalized, based on the maximum signal strength. The results suggested that the plasma signal increases up to a certain flow rate as the gas flow rate increases. However, for our flow device, the association of LIBS signal intensity and flow rate was weakened at a flow rate ≥ 370 cm
3/s. There are several possible reasons for this observation, but the main cause is that the value of the signal at the detector decreases due to the mutual geometry between the plasma and detector above a certain zenith angle, as shown by the simulation results described above. The occurrence of fluid turbulence due to an increase in flow rate can be considered as another cause. In this case, the flow direction of the plasma appears inconsistent, and the signal is irregular. Therefore, the flow rate affecting the plasma is limited.
The graphs in the bottom row of
Figure 13 show the similar trends of the simulation and experimental results. The solid lines are theoretical values that non-dimensionalize the intensity of the electric field signal when the plasma affected by the flow is tilted from 0° to 35° during modeling. In the simulation, it was assumed that the plasma would be deformed in the flow direction. According to this assumption, a larger zenith angle would be associated with a greater influence of the flow. In the numerical prediction, the effect of the type of gas was not taken into account. In the simulation, the slope of the plasma can be analyzed at a zenith angle of 0°–35°, synchronous with a gas flow rate of 300–370 cm
3/s in the gas flow experiment. These results show the possibility of predicting the flow rate according to changes in the plasma signal in a limited system. More precise LIBS measurement can be achieved by adjusting the LIBS signal when the flow direction and amount are known.
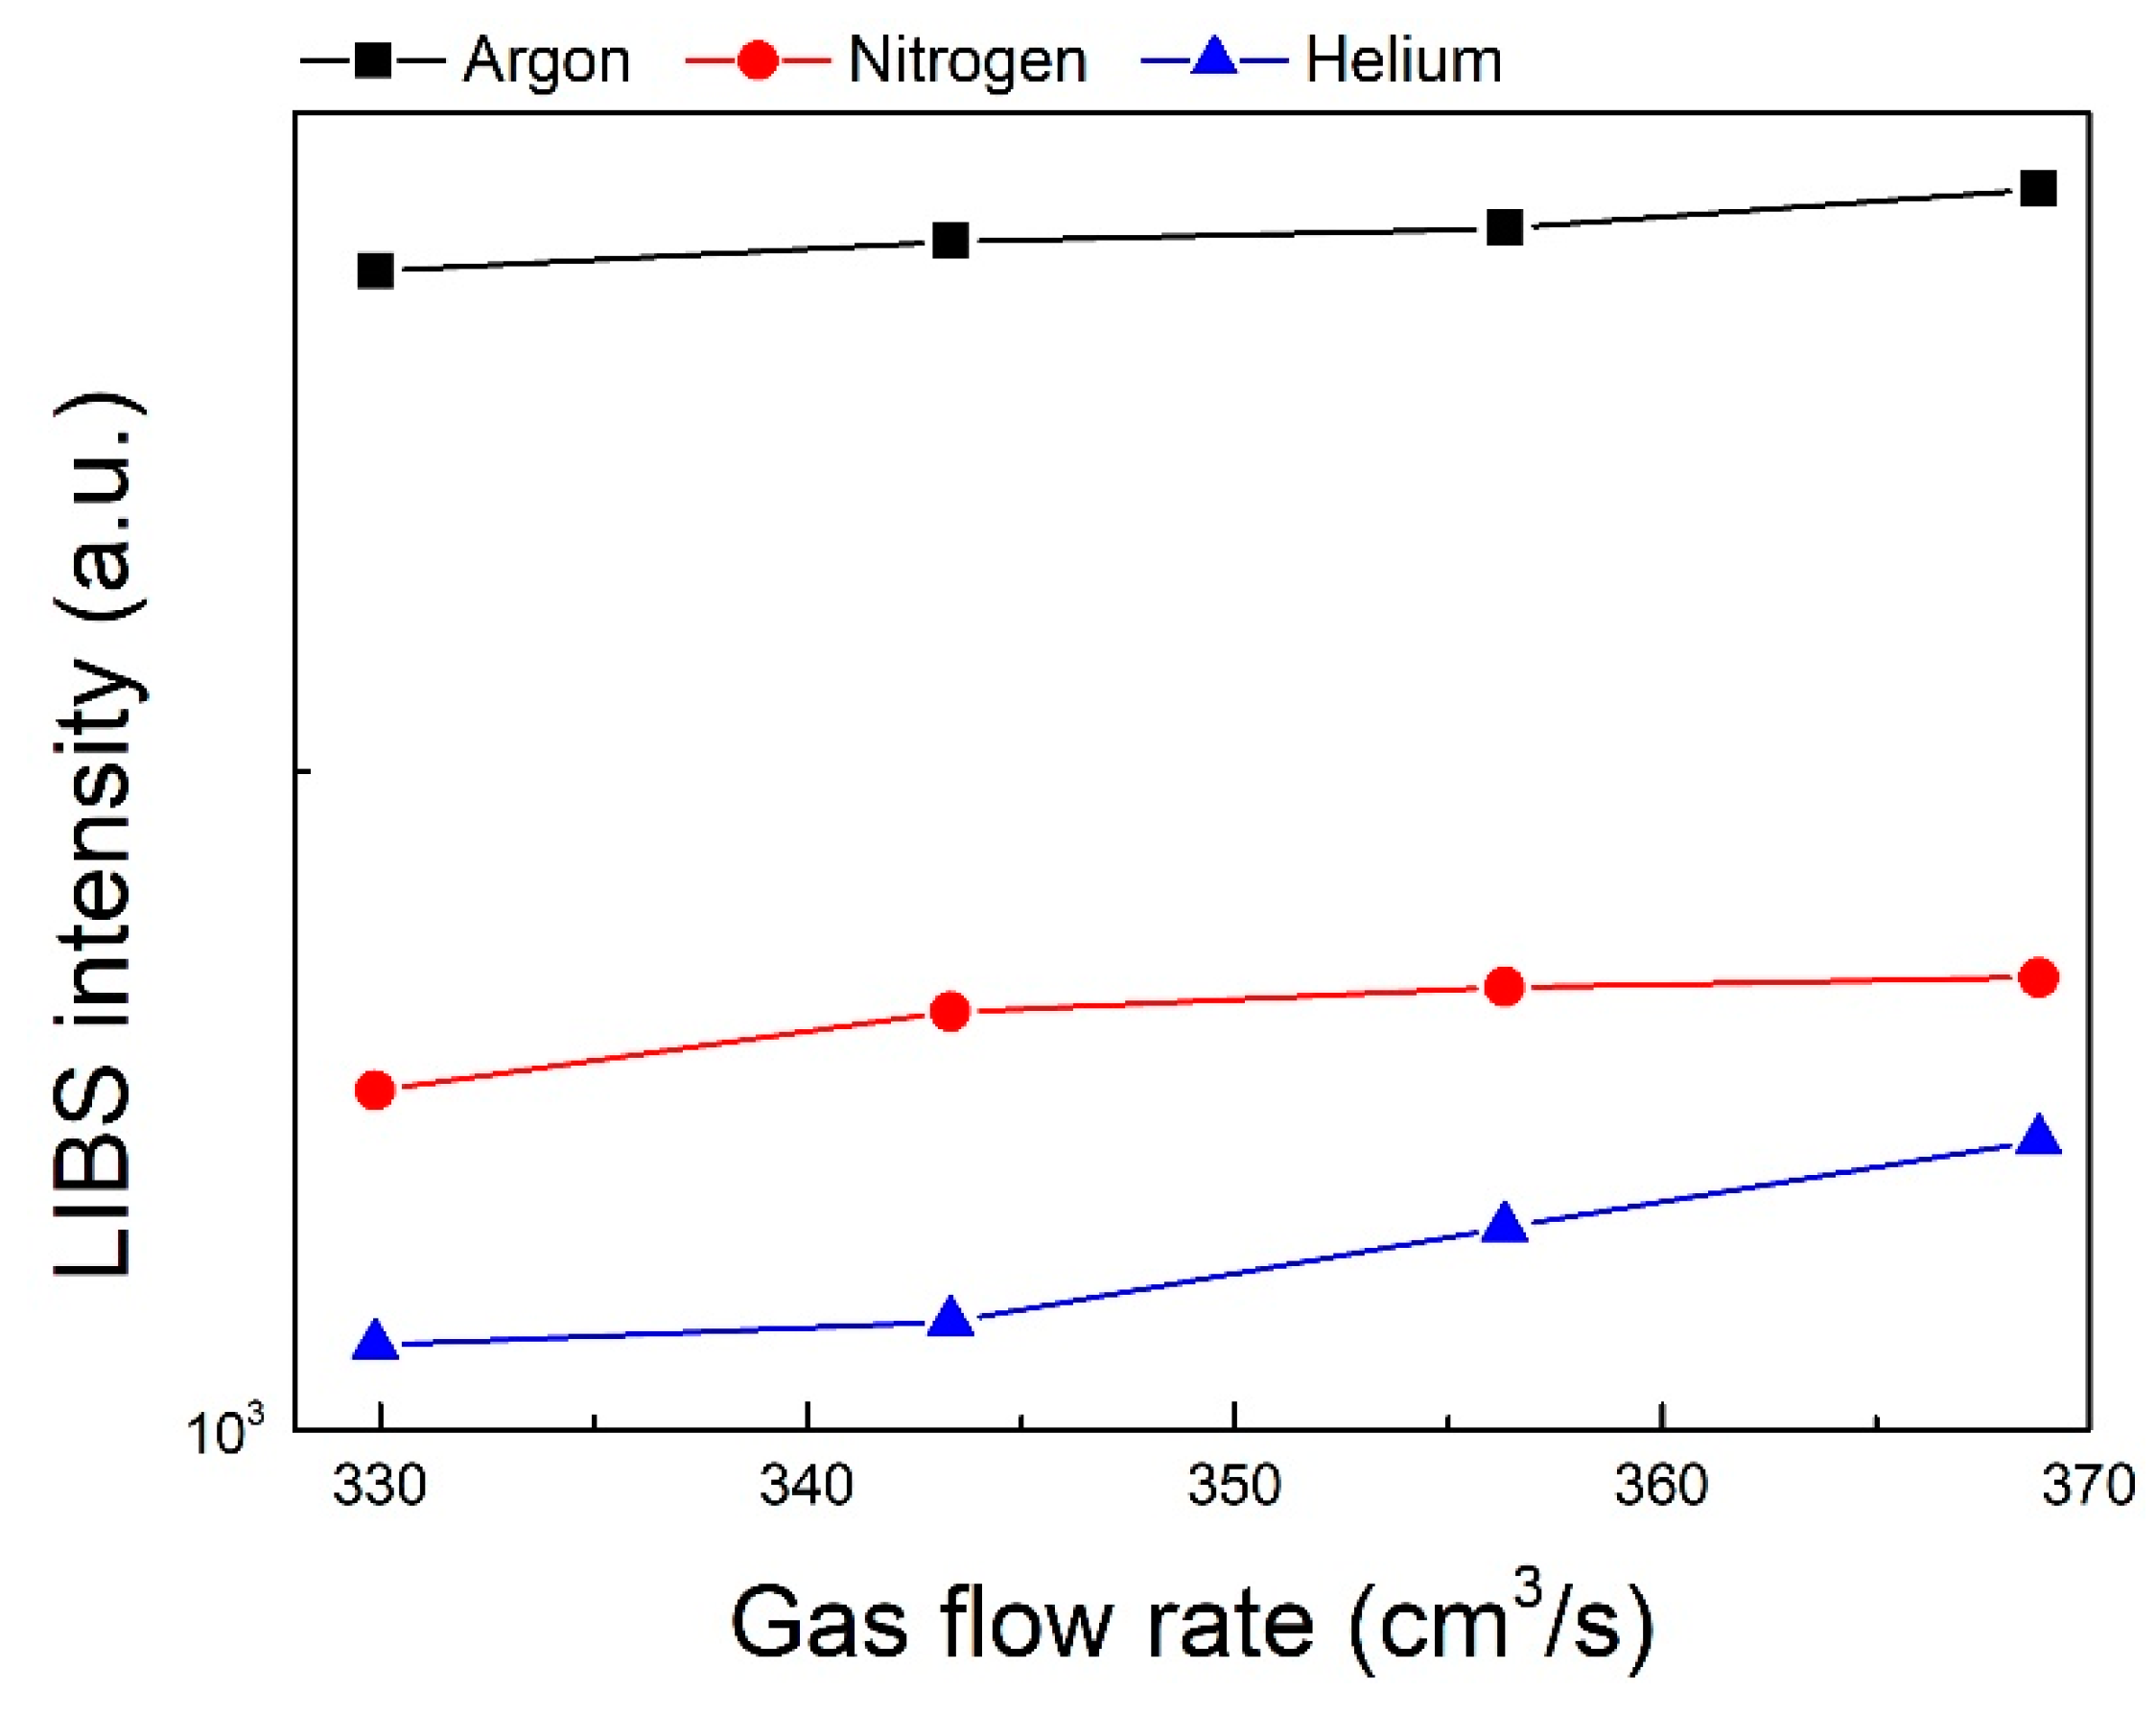
Comparative analysis of the signal strength according to the flow rate of each gas was performed (
Figure 14). Under the same conditions, the LIBS signal strength was highest with Ar gas and lowest with He gas. Ar gas raised the temperature of the plasma, and LIBS signal intensity increased accordingly. On the other hand, He gas lowered the temperature of the plasma, and thus the absolute signal intensity was low.
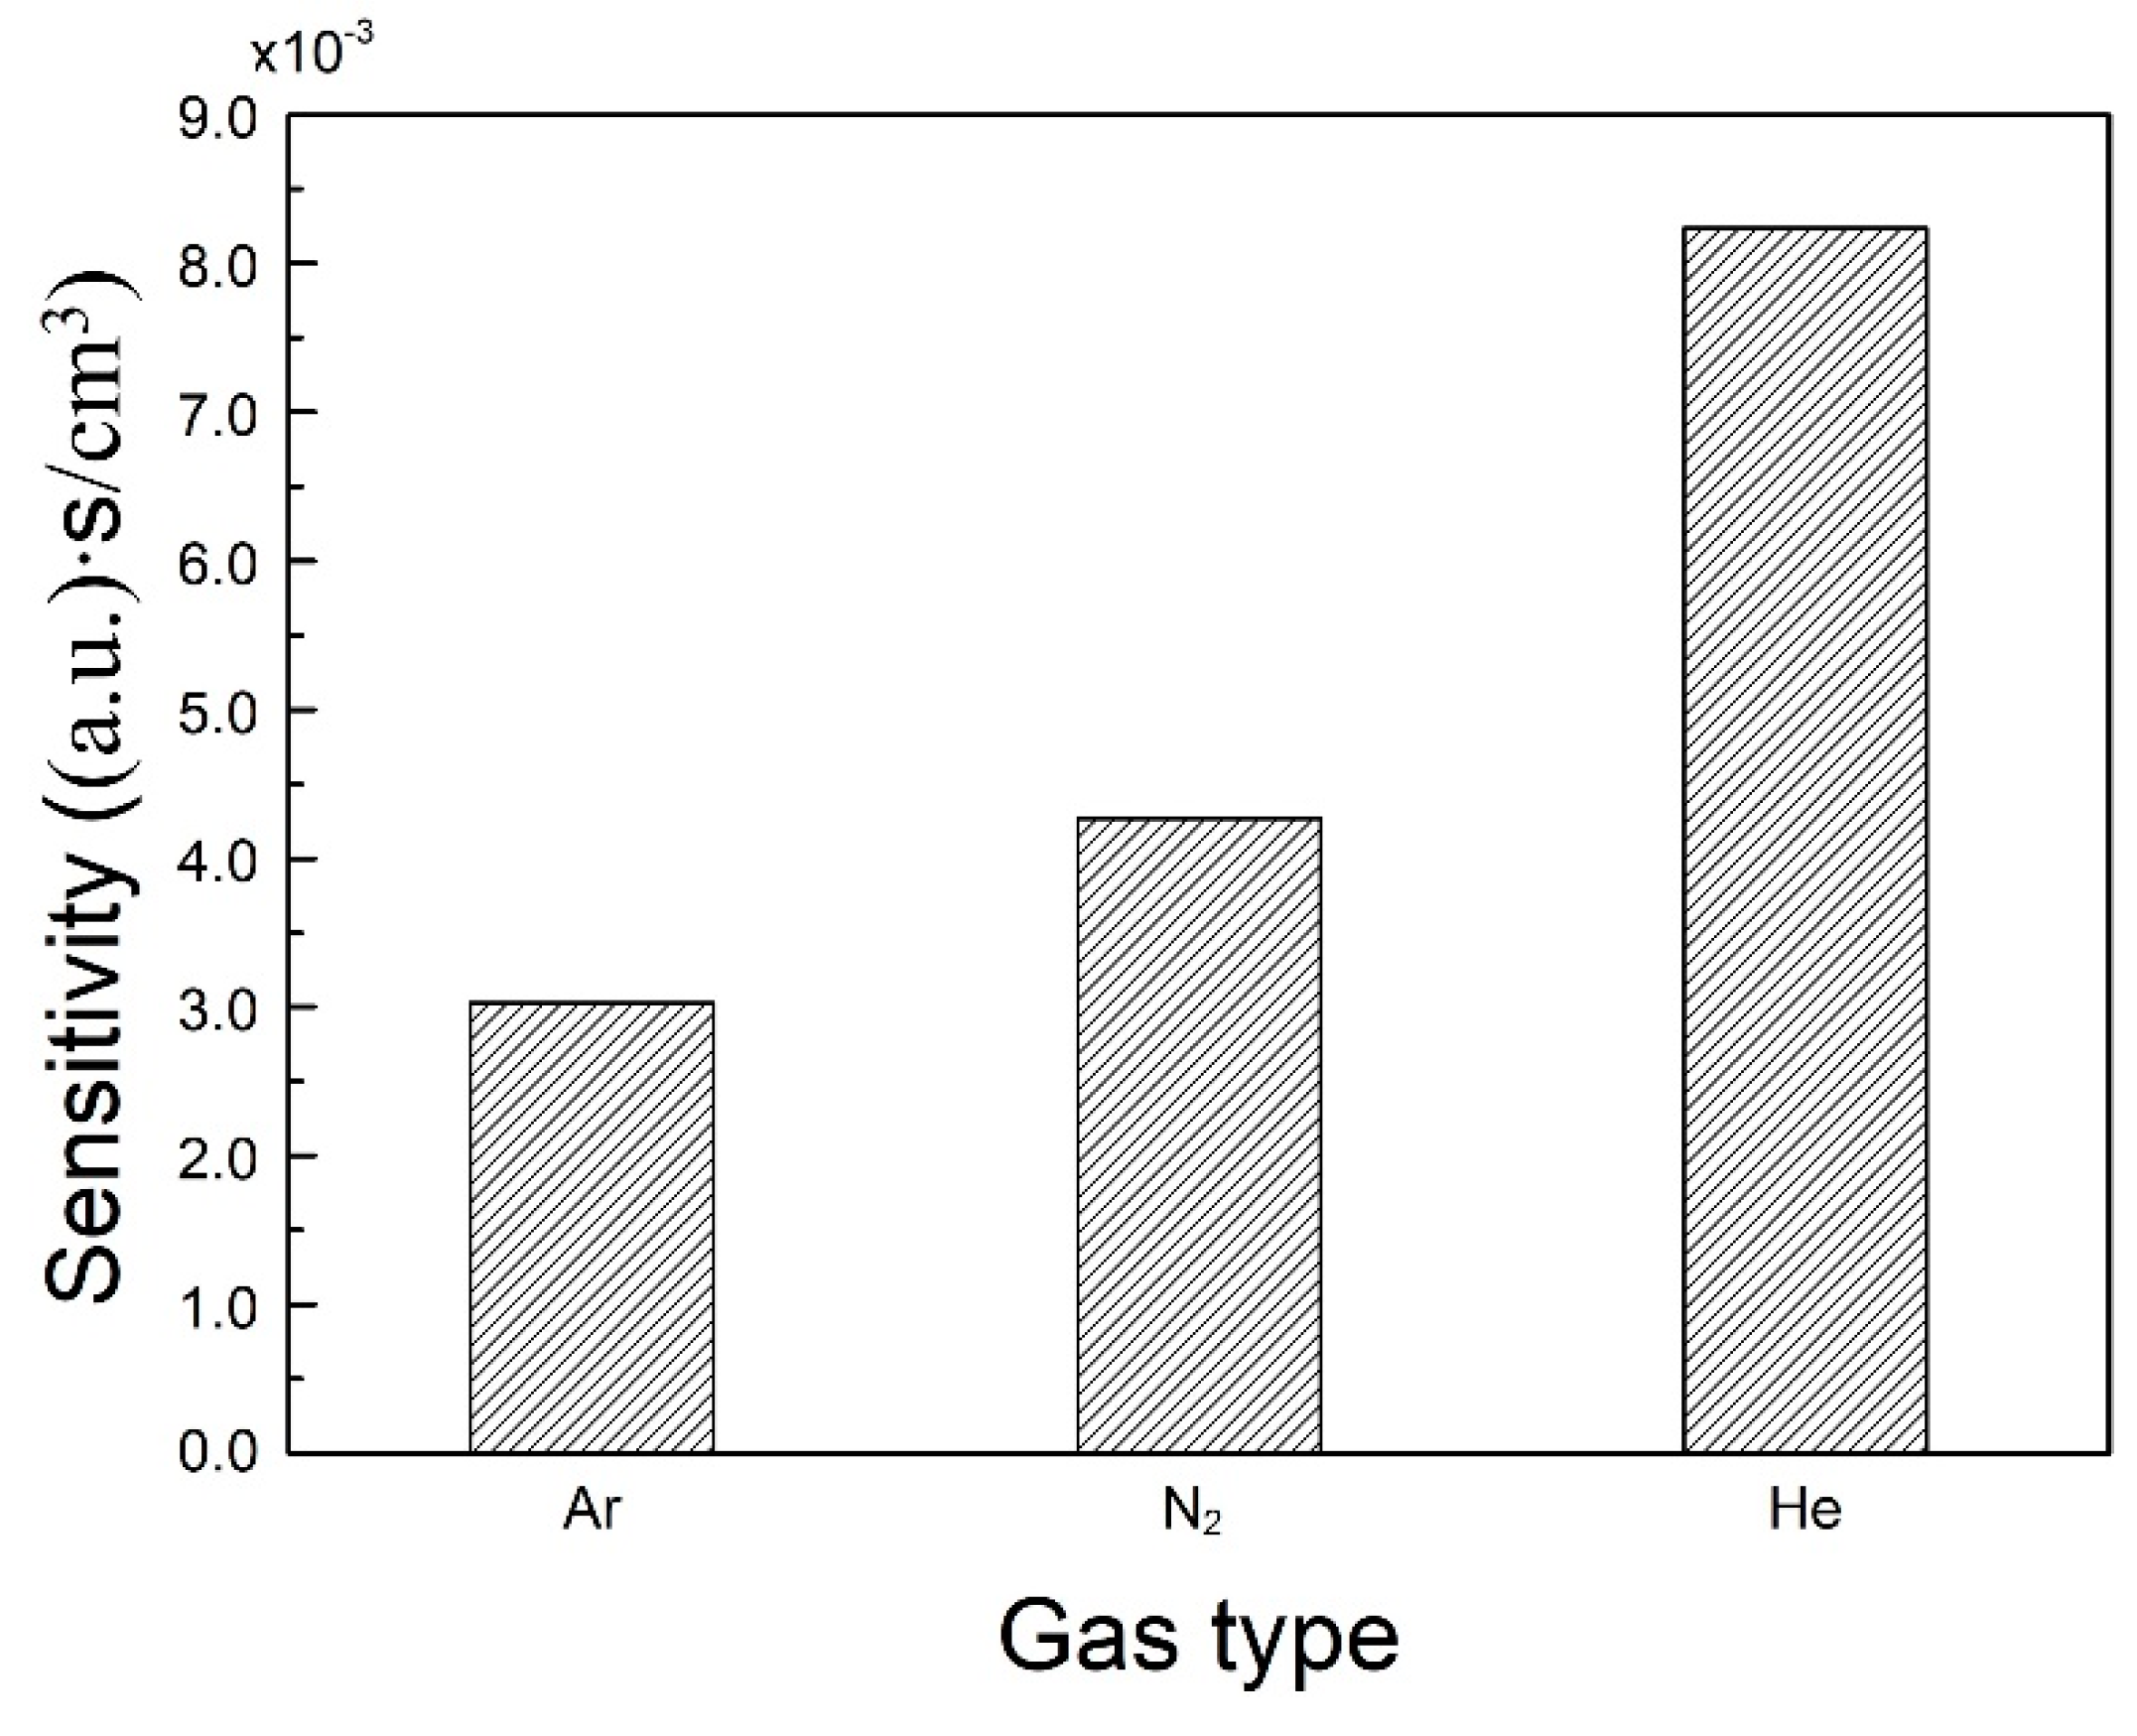
The ratio of the increase in signal strength to the increase in gas flow rate can be used to quantify the measurement sensitivity for each gas. N
2 was regarded as an atmospheric gas. For Ar gas, this ratio had a value of 3.03 s/cm
3. In the case of He gas, the ratio was 8.24 s/cm
3 (
Figure 15). Considering N
2 as the reference atmospheric environment, the measurement sensitivity for Ar was low and that for He gas was high. Therefore, we concluded that the change in plasma according to gas flow can be measured relatively easily when using He gas. In the overall analysis, the ratio between the magnitude of the LIBS signal and the gas flow rate was reliable within a limited gas flow measurement range. It should be noted that the flow is greatly affected by the external environment in actual applications, and therefore the results should be adjusted to obtain valid experimental values.
4. Conclusions
This study was performed to confirm the correlation between gas flow and the LIBS spectral signal, by measuring changes in the plasma signal according to the gas flow. In the LIBS system, the shape of the plasma generated by the laser changed with the gas flow, as did the strength of the signal detected by the detector. This signal change can be used to determine the gas flow rate. In addition, based on the gas flow rate, the LIBS signal can be accurately calibrated. The change in plasma signal according to the observation direction was predicted by modeling the view factor and wave equation. Although modeling requires simplified assumptions, the trend of the signal change according to deformation of the plasma was confirmed. In the simulation, the LIBS spectral intensity changed according to the increase in gas flow rate, and the largest signal amplitude was seen when the angles of the plasma and signal detector coincided. In the experiment, the LIBS signal change was measured on a Mg alloy surface in the presence of gas flow. Meaningful LIBS plasma signals were observed at a flow rate of 300–370 cm3/s. In this range, the intensity of the plasma signal increased with increasing flow rate. At flow rates above this range, the signal was inconsistent, which was inferred to be a result of instability of the plasma due to the flow and reduction of the view factor. In the experiment with three different gas flows, the sensitivity of the LIBS signal to the flow rate change was highest in the order of He, N2, and Ar. In addition, the measured flow rate change for He gas showed the highest similarity to the theoretical calculation.
This study showed that the change in LIBS signal can be measured in the presence of gas flow. The results could be used to calibrate the LIBS signal measured in similar environments. In addition, our measurement method could be used to indirectly predict the characteristics of gas flow based on changes in the plasma signal.


