Article

Regional Climate Change in Southeast Mexico-Yucatan Peninsula, Central America and the Caribbean

by
Mercedes Andrade-Velázquez
1,
Ojilve Ramón Medrano-Pérez
1,*,
Martín José Montero-Martínez
2 and
Alejandro Alcudia-Aguilar
1
1
Cátedras CONACYT—Centro del Cambio Global y la Sustentabilidad (CCGS), Calle Centenario del Instituto Juárez S/N, Col. Reforma, Villahermosa, Tabasco CP 86080, Mexico
2
Instituto Mexicano de Tecnología del Agua, Subcoordinación de Hidrometeorología, Paseo Cuauhnáhuac 8532 Col. Progreso, Jiutepec, Morelos CP 62550, Mexico
*
Author to whom correspondence should be addressed.
Appl. Sci. 2021, 11(18), 8284; https://doi.org/10.3390/app11188284
Submission received: 10 June 2021 / Revised: 13 August 2021 / Accepted: 29 August 2021 / Published: 7 September 2021

Abstract

:

Featured Application

The present study shows the importance of determining the climate change scenario from Representative Concentration Pathways for the study of impacts on ecosystems and social systems (ecosocial systems). In addition, the study investigates the influence of climate drivers and climate change and brings these to bear on the local and regional impacts in the study region.

Abstract

This study analyzes the mean, maximum, and minimum temperatures and precipitation trends in southeast Mexico-Yucatan Peninsula, Central America and the Caribbean regions. The Climate Research Unit (CRU) TS 4.01, with a spatial resolution of 0.5° × 0.5°, was the database used in this research. The trends of the four selected climate variables cover the period from 1960 to 2016. The results obtained show a clear and consistent warming trend, at a rate of about 0.01 °C/year for the entire study region. These results are consistent with some previous studies and the IPCC reports. While the trends of precipitation anomalies are slightly positive (~0.1 mm/year) for southeast Mexico-Yucatan Peninsula and almost the entire Caribbean, for Central America (CA) the trends are negative. The study also presents the correlation between temperatures and precipitation versus El Niño Southern Oscillation (ENSO), Pacific Decadal Oscillation (PDO), and Atlantic Multidecadal Oscillation (AMO) drivers, indicating global warming and frequency signals from the climate drivers. In terms of the near future (2015–2039), three Representative Concentration Pathways (RPC) show the same trend of temperature increase as the historical record. The RCP 6.0 has trends similar to the historical records for CA and southeast Mexico-Yucatan Peninsula, while the Caribbean corresponds to RCP 4.5. In terms of the far-future (2075–2099), RCP 6.0 is more ad-hoc for southeastern Mexico-Yucatan Peninsula, and RCP 8.5 corresponds to Central America. These results could help to focus actions and measures against the impacts of climate change in the entire study region.

1. Introduction

Recent data indicate that humanity releases 51 billion tons of greenhouse gases per year into the atmosphere [1], directly resulting in global warming and climate change. Climate change is considered to be the greatest threat of the 21st century [2,3]. It manifests itself in increases in the frequency and magnitude of extreme weather events, such as droughts and floods [4,5], and its negative impacts on the natural, environmental, economic, and social spheres [6]. In addition, the differentiated effect of climate change occurs in tropical and arid areas [4], urban and rural areas, and in developing countries [3,7,8].
Mexico is characterized by a multi-diversity of climates and biomes. Due to its location and geographical and socioeconomic factors, the territory of Mexico is particularly affected by hydrometeorological events, presenting a high vulnerability to the adverse effects associated with extreme weather events and climate change [8]. Precipitation in southern Mexico is driven by tropical circulation, tropical cyclones, orographic precipitation, easterly waves, the Mid-Summer Drought (MSD), and the Caribbean low-level jet (CLLJ), among other factors [9]. There are some changes in the climate already reported in this region. For instance, the temperature of the Usumacinta basin increased, and precipitation decreased during 1961–2013 [10] and 1965–1994 [11]. In [12], the authors report that the temperature is also increasing in the state of Tabasco, in southern Mexico. MSD [13,14] reaches its maximum in July and August. Annual precipitation in southern Mexico is approximately 2000 mm, and annual mean temperatures are between 20 °C and 35 °C. Furthermore, the great climate modulators (El Niño Southern Oscillation (ENSO); Pacific Decadal Oscillation (PDO); Atlantic Multidecadal Oscillation (AMO) and Low-Level Jet (LLJ)) effects are also present, such as high precipitation or severe drought events [3,7,13,14,15,16,17,18].
The Central America (CA) region is identified as a unique climate region and a key point of tropical climate change due to its location between two main water bodies: the Pacific Ocean and Caribbean Sea [19,20,21]. CA experiences the influence of both oceans in terms of precipitation from the meteorological systems, including trade winds, east waves, tropical cyclones, and the intertropical convergence zone [22], in addition to the intensity of the subtropical high-pressure system over the Caribbean Sea and of the Caribbean Low-Level Jet (CLLJ) [21]. In general, [23] point out that the prevailing climate in this region can be classified as dry tropical winter with very intense rains during the rainy season. However, the CA north regions facing the Caribbean Sea are wet almost all year, while the regions facing the Pacific Ocean have a dry season from December to May [21,24]. In [13], the authors argue that in CA, there is an increase in the minimum and maximum temperatures and related extreme events, such as heavy rains. In addition, [13] report that the larger region of CA is warming, there were no significant changes in the precipitation in the period of 1971–2000 compared to the 1961–2003 period. According to [20,25], observed changes to the climate, including increasing temperature and changing precipitation patterns, are expected to intensify hydrological extremes (floods and droughts) in the near future for this region.
Caribbean island states have repeatedly emphasized the threats of climate change and their vulnerability to climate variations in key areas related to water and energy supplies and agriculture [26]. For the Caribbean region, temperature increases are also observed [27,28]. In its turn, precipitation has a slightly decreasing trend in some regions [27,29], and in other regions, precipitation is increasing [27,30]. The Caribbean climate is categorized as dry winter tropical [31], with precipitation occurring in bimodal seasonal patterns: early in the year in April–June and later in August–November [32], with the minimum between both seasons known as inter-season drought [14]. This pattern is predominant throughout the southeast Mexico-Yucatan Peninsula (SM-YP) [9,33] and CA. According to [33], the Caribbean region experiences changes due to the increase in global temperature, including significant variability in average annual rainfall levels, more frequent floods and droughts, more intense hurricanes and tropical storms, and sea level rise.
In this context, SM-YP, CA, and the Caribbean are affected by a high vulnerability to extreme hydro-climatological phenomena. These phenomena are reported in southeastern Mexico [3,7,19,34,35] and could affect the productivity of agricultural crops and the distribution of ecosystems [36]. Crop production is directly influenced by precipitation and temperature. Precipitation co-determines the availability of water and the level of soil moisture, which are critical factors for crop growth, while the temperature and humidity of the soil determine the duration of the growing season, crop development, and water needs [37]. Thus, climate-related changes in the magnitude and distribution of precipitation and temperature will have negative impacts on agricultural performance [38]. Likewise, these changes affect the food security of developing countries [39], including countries in CA [36]. Furthermore, in relation to ecosystems, climate change can reduce genetic diversity [40]. For example, [41] report changes in the distribution of fish in southeast Mexico as a result of climate change.
Despite these alarming changes, in the study region, there has been low response and adaptation measures to the extreme climate events, mainly due to a lack of information and high vulnerability in the social, institutional, and economic systems [3,7,8,20,25]. Nevertheless, the analysis of changes in regional hydroclimatic conditions is considered to be a key in reducing adverse effects on agriculture, environment, economy, society, and ecosystems [42]. General Circulation Models/Global Climate Models (GCMs) and Regional Climate Models (RCMs) have been used to reveal the climate change impacts in SM-YP, CA and the Caribbean [3,43]. These models could be a great tool to provide information about climate change impacts. These models have been developed by the Coupled Models Intercomparison Project (CMIP), in the CMIP3 [44] and CMIP5 [45]. Ref. [46] demonstrate that the CMIP5 models have better performance for tropical regions from the CMIP3.
For this reason, the present study shows historic analyses of climate variables with the climate regional drivers. In addition, this study uses the mean trends of temperature and precipitation in the historical period (1960–2016) and their projections for the periods of 2015–2039 and 2075–2099, from the CMIP5 models in the SM-YP, CA and Caribbean region, in order to determine the most probable scenario. This study is carried out in 17 locations in the region, close to large cities, in order to study the impacts of climate change in these areas.

2. Materials and Methods
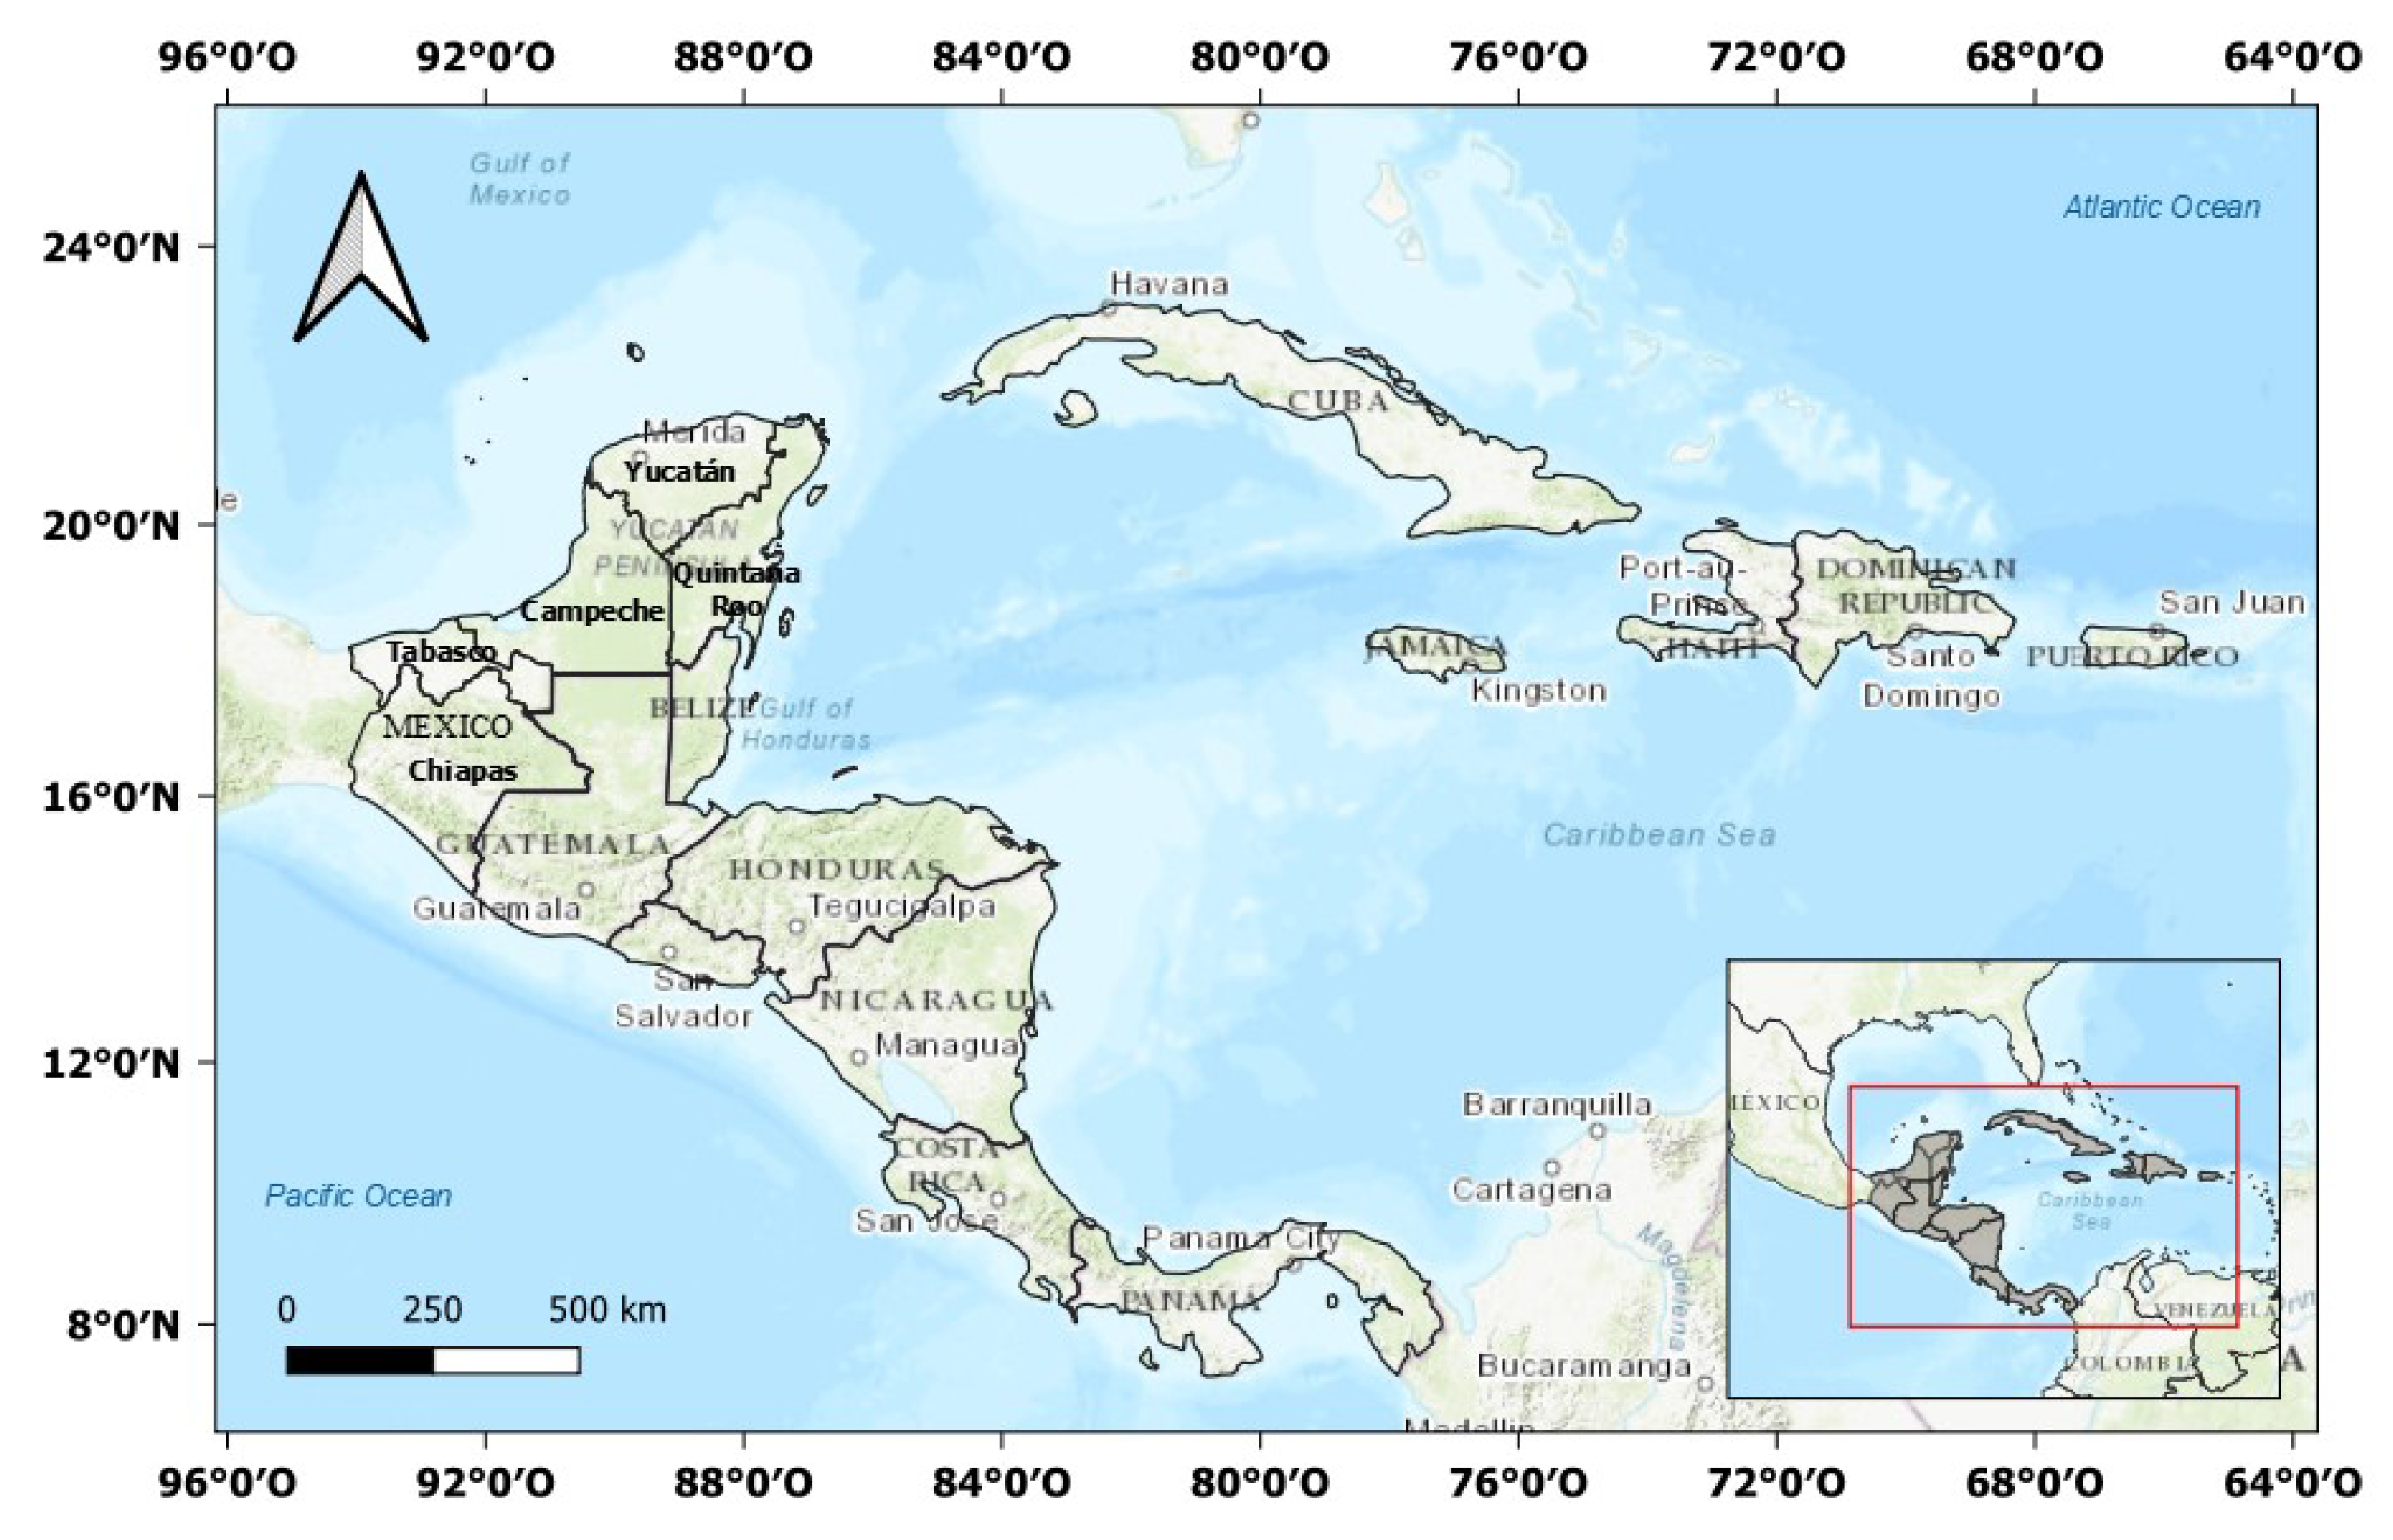
2.1. Study Region

The geographical focus of the present study is southeast Mexico and the Yucatan Peninsula [9,33], due to these regions having a similar climatology [14] to Central America (Belize, Costa Rica, El Salvador, Guatemala, Honduras, Nicaragua, Panama), which is understood here to include the bigger islands of the Caribbean (Cuba, Dominican Republic, Haiti, Jamaica, and Puerto Rico), due to data availability. This region is characterized by its natural, water, and cultural richness. It comprises an area of 941,095 km2 (Figure 1) and a population of approximately 78.9 million people. Socio-economic dynamics are based on the sectors of energy (oil) and hydroelectricity, agriculture, fisheries, and tourism, all of which are particularly sensitive to climate variations.

2.2. Data

The historical data is obtained from the Climate Research Unit (CRU) monthly database CRUTS4.01, which is a regular grid with a spatial resolution of 0.5° × 0.5° [47]. The chosen climate variables are precipitation (Pre) and median, minimum, and maximum temperatures (Tmp, Tmx, Tmn) during the 1960–2016 period. The advantage of the CRU data over the observation data is that it provides information on the overall study time records with high-quality control in the regions with a lack of data [7]. Spatial interpolation from weather station observations is used to achieve spatially complete data, with the number of nearby stations used as an indicator of data reliability [47]. CRU data has been improved for climate change analyses [2,44]. Historically, CRU has been widely used as a verification dataset of GCM historical simulations [48,49,50,51,52], including some examples in SM-YP, CA and the Caribbean [49,53,54].
The model’s data related to climate change are taken from the Intergovernmental Panel on Climate Change, obtained from CMIP5 [55]. They are listed in Table 1. These data were processed by [56], using the Reliability Ensemble Averaging method (REA) [57]. These data have the same spatial resolution as the CRU data and cover periods of 25 years (2015–2039 and 2075–2099). The REA method has two criteria to evaluate each model used and generates projections by assembling those models. The criteria are known as performance criteria (in terms of the historical part) and convergence criteria (in terms of the future part), which are convolutionary to obtain the overall evaluation of the model by the grid point at the regional level [9,47,57,58,59]. REA is a flexible tool that can be used for both global and regional scale studies [60]. REA has been applied at the continental scale [57], in grid boxes of 2.5° × 2.5° and 1° × 1° [60] and in small subregions in the northeastern United States.
The criteria for selecting the study points are based on human settlements where climate change is a stressor for the population. Furthermore, these study points have been selected at a point close to a close city. This criterion has been the same for the SM-YP, CA and the Caribbean (the main islands) (Figure 2 and Table 2). In addition, the selected points were extracted from both gridded data (CRU and REA method).

2.3. Historical Trends

In the first step of the study, the anomalies of the selected climate variables (Tmp, Tmx, Tmn, and Pre) are calculated by 1960–2016 over 1960–1990 (for the long historical period). This provides the long-term trend, with a baseline of 30 years. In the second step, the historic anomalies were determined by 1991–2015 over 1961–2000. The calculation results are presented in Table 3 (25-years comparison period), and provide the same baseline time period of the projected anomalies. In the third step, the trends, at each point, were determined using linear regression. The trend was obtained by adjusting for the 57- and 25-years periods, the long-term period and the comparison time period, respectively. The trends were applied using simple linear regression. This allowed us to fit the trend signal onto the historical record only. The same fit is applied on the projection data (see next section). The goal is to determine if the same trend is applicable to the long-term period, in this case 25 years, and if this signal is found on the RPCs projections. In this case, the trend was identified in order to determinate the ad-hoc scenario for the study region.

2.4. Projections under Climate Change

The trends of the projected changes for all points were calculated in the same way as when determining the historical trend. The trends were calculated for three scenarios: RCP 4.5, RCP 6.0, and RCP 8.5. These data were used in other studies for the Mexico south, where RCP 6.0 had a high reliability [58,59].
The historical and projection data trend comparison was carried out for the same time length of 25 years. In order to determine the comparative significance of the trend, the following equation was applied, and we follow the interpretation of [61,62], and are in agreement with those authors on the rate comparison:
z = ( m 1 m 2 ) ( ( S E m 1 ) 2 + ( S E m 2 ) 2 )
where m1 and m2 are the slopes of the historical and future projections once adjusted; and SEm1 and SEm2 are the standard errors of each adjustment. This equation is used to identify the trend comparison between the two different fits. Our interpretation of the equation is the same as the known z-test, in which the significance is found when z-eq (Equation (1)), with the outer values taken to be (−19.6 to 1.96). The calculation results are presented in Table S1.

3. Results

3.1. Trends

The historical Tmp trends are positive for the 17 points. This result is in agreement with the IPCC reports, in which this warming is attributed to greenhouse gas (GHG) emissions. All increasing trends are of the same order of ~0.01 (°C/year). This suggests that the warming is the same for all regions. This behavior is similar for Tmx and Tmn. However, there is one point at which the Tmx trend displays the inverse behavior. This point is located in Panama, in the south of all regions. In [63], the authors report that temperature anomalies in the Caribbean are positive from the 1970s. For the Caribbean north (points 13, 14, 15, 16, and 17), the warming is present from the 1960s, and for the Caribbean west, near Belize, warming is present from the 1950s. However, the warming there occurred during the 1901–2012 period (Table 3).
The precipitation anomaly trends are positive for points in Mexico and the Caribbean. However, in the Caribbean, there is one point with inverse behavior, located in Jamaica. In [63], the authors report that, for the Caribbean, there are no trends of precipitation for the period of 1901–2012. Although, their study shows that, for this decade, wet and dry events are identified. In the present study, change rates for the precipitation variable are positive, in the order of 0.1 mm/year for Mexico and the Caribbean. However, the CA precipitation trends are negative, with a decline in the order of 0.01 mm/year (Table 3).

3.2. Climate Regional Drivers

3.2.1. Precipitation

Recently, [7] showed an ENSO relation with precipitation for the southeast of Mexico. This relation follows an inverse correlation, in which the significant rain events are present due to the negative-phase of ENSO (La Niña phase), and severe dry conditions occur when the positive-phase is presented (El Niño) [7]. These results agree with previous studies for the area [14,16,64,65,66,67,68]. This effect is also present in other areas of this study (CA and Caribbean) (see Figure 3). The same behavior is present for the PDO. The duration of the PDO variability cycle is approximately ten years and, in agreement with the trend, Mexico and the Caribbean show a precipitation increase but CA shows a precipitation decrease. It is important to note that the climate in CA is driven by other climate regional factors, such as LLJ [69]. Although AMO shows a positive relation with the precipitation for all three study areas of the region, AMO variability is more than ten years, and it has a low frequency signal [70] that is reflected by the low spread in the data shown in Figure 3. The AMO phase is cold from the 1960s and hot since the 1990s. Although it is not clear from the data, the warm phase may have had an increased incidence of hurricanes, and there could be years that were wetter [71]. The frequency of ENSO and PDO is more widespread than AMO, and Figure 3 also shows this.

3.2.2. Temperatures

Similar to other studies [16,72,73], the results of this study support the significant role that AMO and ENSO play in the variability and trends of precipitation and temperature of CA and Mexico. However, Figure 4 shows a low AMO signal in terms of temperature behavior. This is detected in other regions [74]; there are studies [75,76] which report that during the AMO warm phase, the occurrence of droughts is associated with higher temperatures.
AMO and PDO with temperature relations are positive in both cases. The AMO and PDO effects on the Northern Hemisphere climate are similar and could trigger droughts [77]. Both teleconnections have longer frequencies than ENSO for the whole study region. In terms of temperature (Figure 4), the three oscillations are clearly discernible from each other. The extension (variance) of the results is clearly minimal, as expected, with the AMO, given its greater temporal extension and geographic influence as compared to ENSO and PDO. ENSO showed a higher variability, and Figure 4 shows that there is a negative correlation for the Caribbean. This could be due to other geographic factors, such as the small size of the territory and presence of ocean borders. ENSO shows a different signal for the study region temperature, particularly in relation to the Caribbean, while AMO and PDO maintain the same behavior in relation to temperature.

3.3. Projected Trends

The trend comparison for the four variables under climate change over CRU during 2015–2039 and 2075–2099 are shown in Figure 5, and the supplementary material section (Table S1). The RCPs results show increases in the temperature and the same order (0.01 °C/year) as CRU (historical). This suggests that the warming speed is the same for the all regions and for the next years (2015–2039), i.e., the trend will continue in the near future. However, there is one point of discrepancy in terms of the CRU temperature variables. This warming in the study region agrees with previous studies, such as [13,73] (Tables S2–S5).
On the other hand, this study shows the most ad-hoc scenario for the region, due to its radiative forcing. That is, the trend has been maintained throughout the historical period, and thus the projected trend could reflect the same behavior and determine which scenario shows it. The RCP 6.0 trends are more similar than the CRU trends for a high number of the points in across all regions (SM-YP, CA and Caribbean), but particularly in relation to CA and southeast Mexico. For the Caribbean, RCP 4.5 displays this behavior. The variable with better similitude is Tmp, then Tmn, Tmx, and the last Pre. This result is also in agreement with the model’s performance, indicating that the temperature variables agree better with the observed climate than with the Pre variable [9,22,78].
In addition, the CRU and RCP data cover two years: 2015 and 2016. In this case, we have compared this year’s anomalies for both data. The historical anomalies do not match the RCPs results: there is a difference of the 0.4 °C for Tmp, which is lower with RCPs (i.e., the RCPs underestimate the warming record). This behavior is similar to Tmx. However, for Tmn, the underestimation is between 0.1 °C and 0.3 °C. For Pre, the main difference is in the sense of the anomalies’ change between historical and RCPs. In Mexico, Tmp is the variable with better performance for RCPs with CRU in 2015. This is also the case for Tmx in 2016, followed by Tmn. For Pre, there is only one point with correspondence, which is point 1. CA has more points with correspondence between RCPs and CRU for both years. RCP 4.5 is the scenario that has more results in agreement. This scenario has a lower radiative force than the three RCPs. This suggests that in these years, starting in the near future, the climate change effects correspond to low GHG emissions. These results reveal which scenario is more ad-hoc in these two years, and also highlight where these three scenarios have similar behavior throughout the radiative forcing.

4. Discussion

4.1. Historical Trends

The main results of the present study show that throughout the 57 years from 1960 to 2016, all 17 points of the region (SM-YP, CA and the Caribbean) have the same warming (~0.01 °C/year) in terms of temperature anomaly trends. The study of [31] reported an increase in warm events for the Caribbean. In the SM-YP region, this result is in agreement with other studies [11,13,73]. For example, [73] report that the warming trend for the southeast of Mexico is 0.1 (°C/decade) over a short period, from 1980 to 2010. Among all selected points in the study region, there are three points with notable discrepancies: one is at Panama and the other in Haiti and Jamaica (points 6, 14 and 16 in Table 3, respectively). Several studies performed over SM-YP, CA and the Caribbean region have already reported a persistent warming trend over this area [13,73,79,80,81]. The results presented here are consistent with these previous studies and certainly support claims that the SM-YP, CA and Caribbean regions could be one of the main climate change hot spots at the global level [43,44,82].
The quantitative temperature trends found in this study have approximately the same magnitude as those reported by [50] for the mid-summer drought region. In [73], the authors revealed a 0.23 °C/decade temperature trend during 1980–2010, while this study found a temperature trend of approximately 0.2 °C/decade during 1960–2016. Similarly, [73] also reported that the geographical extension of those values covered the Caribbean and Central America. The agreement found for the Tmp and Pre trends with previous studies is also detected by the spatial analyses of this study (see Table S6). In this case, performing a specific or spatial analysis shows the same trend behavior for the study region.
Precipitation trends have a larger variability depending on the regions and periods of analysis [13,73], which is also consistent with this study’s results (Table 3). In terms of precipitation, the maximum values reported by [73] were around ±30 mm/decade, which was significantly larger than the ±6 mm/decade found here, but this could be explained by the differences in the reference period and the higher sensitivity of precipitation associated with this [3,11]. In [20], the authors report a drier trend for CA; this result agrees with the results found here. In the case of the Caribbean, the results show an increase in precipitation, whereas in [29] the authors report different non-significant trends. However, Ref. [31] report increasing trends, too, in terms of rainfall events along 50/25 years in the Caribbean.
The Taylor diagram, as a statistical tool, allowed us to show the correlation between the climatic drivers (ENSO, PDO, AMO) with the temperature and precipitation variables. In both cases, there is a dispersion of data (this is also found in other studies [22,73]) and a weak correlation which could be associated with global warming. In [73], the authors show that the correlation between the climate drivers and temperature and precipitation variables is stronger when the trend is erased. In addition, there are other factors involved in the local climate. In [22], the authors report that ENSO is not the only teleconnection that influences CA. The Taylor diagrams show the climate drivers’ (AMO, PDO, ENSO) frequency; this can be seen in the data spread, for the AMO particularly, where there is a multidecadal frequency. It is clear that the signal of ENSO and PDO, on the precipitation variable, produces an inverse correlation. PDO and AMO show a positive correlation with the temperature variable.
The climate drivers maintain the same behavior with the precipitation variable on the SM-YP and CA, and the combination of the ENSO and PDO [16]. In [20], the authors show that the drier events are presented during the EL Niño phase, suggesting that this signal is weak for the Caribbean side and stronger in CA. In [73], the authors show that this also happens with the addition of the cold phase of AMO. For the Caribbean, [31] report that, in terms of the AMO warm phase, the wetter events are present, which agrees with the present results, while the temperature is warmer with the AMO warm phase.

4.2. Projections Trends under Climate Change Scenarios

The 25-year trends indicate that the RCP 6.0 trends will remain in both future periods over the CRU trends for the temperature anomalies. In the case of the Pre, anomalies are positive for Mexico and are inverse for CA and the Caribbean. This last result is in agreement with the studies by [13,73]. While high latitudes show increasing precipitation, lower latitudes show decreasing precipitation. CA is shown to be dry in the future, with the exception of Guatemala. In [20], the authors report the same results. In [26], the authors state that precipitation would decrease under the Special Report of the Emission Scenarios (SRES) during 2071–2100 [83].
Pre trends show some discrepancies in terms of the behavior of temperatures (i.e., RCPs trends are negative for 2015–2039). In the period of 2075–2099, the trends show same negative difference. This result confirms that the GCMs performance has low confidence for the Pre variable [9,22,58,84].
The present results are only preliminary for each point, and a complete spatial study should follow. This study suggests a better RCP scenario of the three ones for the study points of the entire region, from the comparison of the trends for each scenario RCP over the CRU trends. There is a good consensus that, during 2015–2039, the trends will maintain the speed of the historical trends. For the far-future (2075–2099), the radiative forcing evolution [2] will be reflected in the trends. Two RCP scenarios are marked with this method, and RCP 6.0 is more ad-hoc for SM-YP and CA. For the CA, RCP 8.5 could likely produce the same result; this is in agreement with [85]. For the Caribbean, the RCP 4.5. The [3] study method to determine the most probable scenario is consistent with this for SM-YP. These results, presented in Figure 5, suggest that the radiative force is higher for the SM-YP and CA region than for the Caribbean, as the Caribbean is influenced by other climate factors (see Section 3.2). In [29] shows that, for the Caribbean, the warming could be greater for the last century, close to 2.5 °C. This is the case according to the current result, and [2] reports that RCP 4.5 has an average probability of going from 2 °C (11 to 2.6 °C). This study proposes that the historical trend could discriminate the RCP between the three scenarios. Furthermore, the historical results show that the same warming exists throughout the study region.
In [3], the authors show the probability for each of these three scenarios (RCP 4.5, RCP 6.0, and RCP 8.5). For the south-southeast of Mexico, RCP 4.5 and RCP 6.0 are the most accepted scenarios. The three scenarios show different behavior for the SM-YP region, and the RCP 6.0 scenario is the most ad-hoc. It is known that the driest scenario is RCP 8.5, and the least dry is RCP 4.5 for the SM-YP, while RCP 6.0 is dry in the first projected timeframe (2015–2039), but it could change in the second middle of the century from dry to wet. As such, the RCP 6.0 scenario could be the trend scenario for the entire study region. This exercise is the first step in this direction to determine what ad-hoc scenario best fits the region.

4.3. Local Impacts on the Population, Agriculture, and Aquatic Ecosystems

The SM-YP, CA and Caribbean regions are vulnerable to extreme hydroclimatological phenomena, such as floods and droughts [3,21,34]. According to [3] they warn that the adverse effects of floods could be exacerbated in the states of Tabasco, Chiapas, and Veracruz, while the states of Oaxaca, Tabasco, and Yucatan in southern Mexico will have the potential effects of climate change. On the other hand, in Central America, [35] report tropical cyclones to be one of the most important causes of disasters in this region, with direct impacts on different agricultural sectors and impacts on the population. Precipitation patterns in this region are also expected to intensify hydrological extremes (floods and droughts) in the near future [20,25]. In the case of the Caribbean region, island states have been recognized as facing the constant threat of climate change and its manifestations in more frequent floods and droughts, more intense hurricanes and tropical storms, and sea-level rise, in particular [34].
Crops are sensitive to the impacts of climate change, including changes in temperature and precipitation [86]. Among the changes, increasing temperature has the most likely negative impact on crop yield [86,87]. Yields will be better in colder environments and worse in warmer environments [88]. According to [36], in Guatemala, Honduras, and Nicaragua, more than two-thirds of the population depend on seasonal agriculture; increased rainfall or irrigation will reduce the yield gap between rainfed agriculture and irrigated agriculture, but can also have a negative impact if extreme rainfall causes flooding [19].
Regional studies have shown that climate change will affect climatic suitability for Arabica coffee (Coffea arabica) within the current regions of production. This is the case in countries in SM-YP, CA and the Caribbean [87]. Likewise, the increase in temperature and precipitation patterns will have the effect of increasing the pressure of pests and diseases, for example, coffee rust (Hemileia vastatrix) in Mexico [88].
In [89], the authors state that the climatic preferences of the Atractosteus tropic fish will potentially increase due to climate change in areas of the CA mountain range. This species would benefit from the climate change-related increase in temperature. For the Petenia Splendida fish, in contrast to what will happen with the A. tropic, there will be a loss of habitat due to climate change. This loss of distribution areas is related to the decrease in precipitation that the Usumacinta River will suffer in the future. The fish populations must acclimatize or migrate to avoid extinction. It is worth mentioning that changes in distribution patterns could affect the income of families who are reliant on fishing and lead to changes in the food chain, such as an increase in prey populations. Climate change will also affect freshwater fish in southeast Mexico and northern CA in different ways.
In general, the impacts of climate change on different sectors and social spheres will have repercussions on the economic structure and well-being of the SM-YP, CA, and Caribbean regions. To adapt and respond to a different climate, we first need to know how the climate is changing at the global, regional, and local levels [42].

5. Conclusions

The SM-YP, CA and Caribbean regions show warming at a similar increasing trend for the median, maximum, and minimum temperatures. This result is in agreement with the IPCC reports on regional warming. In the period of 1960–2016 the Pre trend is positive for SM-YP and the Caribbean, while CA showed decreasing trend in 1960–2016. These results agree with previous studies on the region. The agreement found for the Tmp and Pre trends with previous studies is also detected by the spatial analyses of this study (see Table S6). In this case, performing a specific or spatial analysis shows the same trend behavior for the study region.
The Taylor diagram presented here reveals the different “signals” of climate drivers in the SM-YP, CA and Caribbean (Figure 3 and Figure 4), with respect to the temperature and precipitation. The results are in agreement with the other previous research. While the ENSO and PDO relation with the precipitation variable is inverse, in regard to AMO it is positive. For temperatures, the positive correlation is present with AMO and PDO, while ENSO is positive for SM-YP and CA, and negative for the Caribbean. An AMO signal is clearly discernible from the other two (PDO and ENSO), and ENSO and PDO are more mixed on the different target points, but their signal is spread. This could reflect the frequency signal of all three teleconnections. This could be the frequency of teleconnections and geographic factors, particularly on the Caribbean. It is noted that the study presents the global warming signal as having a weak correlation with the climate drivers in accordance with previous studies [7,11,73]. Therefore, the signal is intended to strengthen in future studies.
For the CRU trend, over RCPs trends for the 25 years, RCP 6.0 shows a better performance for the SM-YP and CA trends. This agrees with the previous study for Mexico southeast [3]. However, the RPC4.5 scenario projections could apply to the Caribbean, in agreement with previous studies. Concerning the current climate change projections, RCP 4.5 shows a better agreement for the anomalies of 2015 and 2016. It means that RCP 4.5 is the lower scenario which agrees with the current years of the study, and in this case the impacts are minor, but the other two scenarios could coincide [2]. For the variable Pre, in these two years, there is no RCP scenario that agrees with the CRU record.
It is a challenge to determine the impacts of climate change in SM-YP and CA, and the Caribbean in certain urban cities when there are multiple RCPs. This study provides a method to choose a most likely (ad-hoc) PCR scenario for the study region and the results agree with previous similar studies. With this, future climate studies that could suggest better adaptation decisions and policy measures for ecosystems and human settlements. In the case of aquatic ecosystems, it is necessary to evaluate each species in terms of their climate change vulnerability. The results of such studies will support informed decisions, adaptation, and conservation measures for freshwater fish species, and provide assistance to face disaster events due to the impacts of climate change.

Supplementary Materials

The following are available online at https://www.mdpi.com/article/10.3390/app11188284/s1, Table S1 shows z-eq values for the climate variables and the three RCPs scenarios. Tables S2–S5 show the climate variable trends for the observed four climate variables and their projections by RCPs. Table S6 shows the comparison between point and spatial analyses.

Author Contributions

M.A.-V.—investigation, scientific supervision of research; formulation of scientific hypotheses; climate analysis of the historic and future projections periods; interpretation of the results obtained, develop of climate drivers and climate change analysis and results. Writing—Original Draft Preparation, Writing—Review & Editing. Abstract, Introduction, Methodology, Results, Discussion Conclusion and References, and cross-reference. O.R.M.-P.—conceptualization and contributions to introduction and study region sections; M.J.M.-M.—contributions to discussion and conclusions, cross-reference of citations. Writing—Review & Editing. A.A.-A.—Writing—Review & Editing. Contributions to Introduction and Discussion. All authors have read and agreed to the published version of the manuscript.

Funding

Projects of Cátedra-CONACYT program number 945 (MAV) and 963 (ORMP).

Institutional Review Board Statement

Not applicable.

Informed Consent Statement

Not applicable.

Data Availability Statement

Data available in a publicly accessible repository the data presented in this study are openly available in [Harris I.; Jones P.; Osborn T.; Lister D. Updated high-resolution grids of monthly climatic observations the cru ts3.10 dataset. International Journal of Climatology. 2014. 34 (3), 623642. https://doi.org/10.1002/joc.3711]. Data available in a publicly accessible repository that does not issue DOIs Publicly available datasets were analyzed in this study. This data can be found here: [https://esgf-node.llnl.gov/search/cmip5/ (accessed date: 31 August 2021)].

Acknowledgments

We are grateful to the Cátedra-CONACYT program, particularly projects 945 (M.A.-V.) and 963 (O.R.M.-P.). Additionally, we acknowledge the World Climate Research Programme’s Working Group on Coupled Modelling, which is responsible for CMIP, and we thank the climate modeling groups for producing and making available their model output. We are thankful to CMIP of the U.S. Department of Energy’s Program for Climate Model Diagnosis and Intercomparison for providing coordination and leading the development of software infrastructure in partnership with the Global Organization for Earth System Science Portals. This study is carried out under the 305079 PRONACES-AGUA-CONACYT-MEXICO project partnerships (M.A.-V., M.J.M.-M., O.R.M.-P.).

Conflicts of Interest

The authors declare no conflict of interest.

References

  1. Gates, B. How to Avoid a Climate Disaster: The Solutions We Have and the Breakthroughs We Need, 1st ed.; Penguin Books Limited: New York, NY, USA, 2021; pp. 1–349. [Google Scholar]
  2. IPCC. Climate Change 2013: The Physical Science Basis. Contribution of Working Group I to the Fifth Assessment Report of the Intergovernmental Panel on Climate Change; Stocker, T.F., Qin, D., Plattner, G.-K., Tignor, M.M.B., Allen, S.K., Boschung, J., Nauels, A., Xia, Y., Bex, V., Midgley, P.M., Eds.; Cambridge University Press: Cambridge, UK; New York, NY, USA, 2013. [Google Scholar]
  3. Andrade-Velázquez, M.; Medrano-Pérez, O.R. Historical precipitation patterns in the South-Southeast region of Mexico and future projections. Earth Sci. Res. J. 2021, 25, 69–84. [Google Scholar] [CrossRef]
  4. UNESCO. UN-Water. United Nations World Water Development Report 2020: Water and Climate Change; UNESCO: Paris, France, 2020; pp. 1–219. [Google Scholar]
  5. United Nations. The United Nations World Water Development Report 2021: Valuing Water; UNESCO: Paris, France, 2021; pp. 1–186. [Google Scholar]
  6. Mora, C.; Spirandelli, D.; Franklin, E.C.; Lynham, J.; Kantar, M.B.; Miles, W.; Smith, C.Z.; Freel, K.; Moy, J.; Louis, L.V.; et al. Broad threat to humanity from cumulative climate hazards intensified by greenhouse gas emissions. Nat. Clim. Chang. 2018, 8, 1062–1071. [Google Scholar] [CrossRef]
  7. Andrade-Velázquez, M.; Medrano-Pérez, O.R. Precipitation patterns in Usumacinta and Grijalva basins (southern Mexico) under a changing climate. Rev. Bio Cienc. 2020, 7, 1–22. [Google Scholar] [CrossRef]
  8. Arceo-Gómez, E.O.; Hernández-Cortés, D.; López-Feldman, A. Droughts and rural households’ wellbeing: Evidence from Mexico. Clim. Chang. 2020, 162, 1197–1212. [Google Scholar] [CrossRef]
  9. Colorado-Ruiz, G.; Cavazos, T.; Salinas, J.A.; De Grau, P.; Ayala, R. Climate change projections from Coupled Model Intercomparison Project phase 5 multi-model weighted ensembles for Mexico, the North American monsoon, and the mid-summer drought region. Int. J. Climatol. 2018, 38, 5699–5716. [Google Scholar] [CrossRef]
  10. Bravo-Cabrera, J.L.; Azpra-Romero, E.; Zarraluqui-Such, V.; Gay-García, C. Effects of El Niño in Mexico during rainy and dry seasons: An extended treatment. Atmósfera 2017, 30, 221–232. [Google Scholar] [CrossRef] [Green Version]
  11. Montero-Martínez, M.J.; Santana-Sepúlveda, J.S.; Pérez-Ortiz, N.I.; Pita-Díaz, O.; Castillo-Liñan, S. Comparing climate change indices between a northern (arid) and a southern (humid) basin in Mexico during the last decades. Adv. Sci. Res. 2018, 15, 231–237. [Google Scholar] [CrossRef]
  12. Rivera-Hernández, B.; Aceves-Navarro, L.A.; Arrieta-Rivera, A.; Juárez-López, J.F.; Méndez-Adorno, J.M.; Ramos-Alvarez, C. Evidencias del cambio climático en el estado de Tabasco durante el periodo 1961–2010. Rev. Mex. Cienc. Agrícolas 2016, 7, 2645–2656. [Google Scholar] [CrossRef] [Green Version]
  13. Aguilar, E.; Peterson, T.C.; Obando, P.R.; Frutos, R.; Retana, J.A.; Solera, M.; Soley, J.; García, I.G.; Araujo, R.M.; Santos, A.R.; et al. Changes in precipitation and temperature extremes in Central America and northern South America, 1961–2003. J. Geophys. Res. Atmos. 2005, 110, 1–15. [Google Scholar] [CrossRef]
  14. Magaña, V.; Amadros, J.A.; Medina, S. The midsummer drought over Mexico and Central America. J. Clim. 1999, 12, 1577–1588. [Google Scholar] [CrossRef]
  15. Méndez-González, J.; Ramírez-Leyva, A.; Cornejo-Oviedo, E.; Zárate-Lupercio, A.; Cavazos-Pérez, T. Teleconexiones de la Oscilación Decadal del Pacífico (PDO) a la precipitación y temperatura en México. Investig. Geogr. 2010, 73, 57–70. [Google Scholar] [CrossRef]
  16. Méndez, M.; Magaña, V. Regional aspects of prolonged meteorological droughts over Mexico and Central America. J. Clim. 2010, 23, 1175–1188. [Google Scholar] [CrossRef] [Green Version]
  17. Andrade-Velázquez, M. Visión climática de la precipitación en la cuenca del Río Usumacinta. In La Cuenca del Río Usumacinta desde la Perspectiva del Cambio Climático; Soares, D., García, G.A., Eds.; Instituto Mexicano de Tecnología del Agua: Juitepec, Morelos, México, 2017; pp. 1–417. [Google Scholar]
  18. Fuentes-Franco, R.; Giorgi, F.; Pavia, E.G.; Graef, F.; Coppola, E. Seasonal precipitation forecast over Mexico based on a hybrid statistical-dynamical approach. Int. J. Climatol. 2018, 38, 4051–4065. [Google Scholar] [CrossRef]
  19. Imbach, P.; Chou, S.C.; Lyra, A.; Rodrigues, D.; Rodríguez, D.; Latinovic, D.; Siqueira, G.; Silva, A.; Garofolo, L.; Georgiou, S. Future climate change scenarios in Central America at high spatial resolution. PLoS ONE 2018, 13, e0193570. [Google Scholar] [CrossRef] [PubMed] [Green Version]
  20. Muñoz-Jiménez, R.; Giraldo-Osorio, J.D.; Brenes-Torres, A.; Avendaño-Flores, I.; Nauditt, A.; Hidalgo-León, H.G.; Birkel, C. Spatial and temporal patterns, trends and teleconnection of cumulative rainfall deficits across Central America. Int. J. Climatol. 2019, 39, 1940–1953. [Google Scholar] [CrossRef]
  21. Hidalgo, H.G. Climate variability and change in Central America: What does it mean for water managers? Front. Water 2021, 2, 1–5. [Google Scholar] [CrossRef]
  22. Fuentes-Franco, R.; Coppola, E.; Giorgi, F.; Pavia, E.G.; Diro, G.T.; Graef, F. Inter-annual variability of precipitation over Southern Mexico and Central America and its relationship to sea surface temperature from a set of future projections from CMIP5 GCMs and RegCM4 CORDEX simulations. Clim. Dyn. 2014, 45, 425–440. [Google Scholar] [CrossRef]
  23. Guillén-Oviedo, H.S.; Cid-Serrano, L.R.; Alfaro-Martínez, E.J. Comparación de parámetros de valor extremo de la distribución generalizada asociada a eventos de precipitación extrema en América Central. Uniciencia 2020, 34, 111–128. [Google Scholar] [CrossRef]
  24. Vargas-Ulate, G. Las lluvias en América central: Una climatología geográfica. Anu. Estud. Centroam. 2001, 27, 7–19. [Google Scholar] [CrossRef]
  25. González, J.E.; Georgescu, M.; Lemos, M.C.; Hosannah, N.; Niyogi, D. Climate change’s pulse is in Central America and the Caribbean. Eos 2017, 98. [Google Scholar] [CrossRef]
  26. Campbell, J.D.; Taylor, M.A.; Stephenson, T.S.; Watson, R.A.; Whyte, F.S. Future climate of the Caribbean from a regional climate model. Int. J. Climatol. 2011, 31, 1866–1878. [Google Scholar] [CrossRef]
  27. Singh, B. Climate changes in the greater and southern Caribbean. Int. J. Climatol. 1997, 17, 1093–1114. [Google Scholar] [CrossRef]
  28. Karmalkar, A.V.; Taylor, M.A.; Campbell, J.; Stephenson, T.; New, M.; Centella, A.; Benzanilla, A.; Charlery, J. A review of observed and projected changes in climate for the islands in the Caribbean. Atmósfera 2013, 26, 283–309. [Google Scholar] [CrossRef] [Green Version]
  29. Taylor, M.A.; Enfield, D.B.; Chen, A.A. Influence of tropical Atlantic versus the tropical Pacific on Caribbean rainfall. J. Geohys. Res. 2002, 107, 1–10. [Google Scholar] [CrossRef] [Green Version]
  30. Martin, H.C.; Weech, P.S. Climate change in the Bahamas? Evidence in the meteorological records. Bahamas J. Sci. 2001, 5, 22–32. [Google Scholar]
  31. Stephenson, T.S.; Vincent, L.A.; Allen, T.; Van Meerbeeck, C.J.; McLean, N.; Peterson, T.C.; Taylor, M.A.; Aaron-Morrison, A.P.; Auguste, T.; Bernard, D.; et al. Changes in extreme temperature and precipitation in the Caribbean region, 1961–2010. Int. J. Climatol. 2014, 34, 2957–2971. [Google Scholar] [CrossRef]
  32. Chen, A.A.; Taylor, M. Investigating the link between early season Caribbean rainfall and the El Niño year. Int. J. Climatol. 2002, 22, 87–106. [Google Scholar] [CrossRef]
  33. Giddings, L.; Soto, M.; Rutherford, B.M.; Maarouf, A. Standardized precipitation index zones for México. Atmósfera 2005, 18, 33–56. [Google Scholar]
  34. Campbell, J.D.; Taylor, M.A.; Bezanilla-Morlot, A.; Stephenson, T.S.; Centella-Artola, A.; Clarke, L.A.; Stephenson, K.A. Generating projections for the Caribbean at 1.5, 2.0, and 2.5 °C from a high-resolution ensemble. Atmosphere 2021, 12, 328. [Google Scholar] [CrossRef]
  35. Hidalgo, H.G.; Alfaro, E.J.; Hernández-Castro, F.; Pérez-Briceño, P.M. Identification of tropical cyclones’ critical positions associated with extreme precipitation events in central america. Atmosphere 2020, 11, 1123. [Google Scholar] [CrossRef]
  36. Hannah, L.; Donatti, C.I.; Harvey, C.A.; Alfaro, E.; Rodriguez, D.A.; Bouroncle, C.; Castellanos, E.; Diaz, F.; Fung, E.; Hidalgo, H.G.; et al. Regional modeling of climate change impacts on smallholder agriculture and ecosystems in Central America. Clim. Chang. 2017, 141, 29–45. [Google Scholar] [CrossRef] [Green Version]
  37. Calzadilla, A.; Rehdanz, K.; Tol, R.S.J. Water scarcity and the impact of improved irrigation management: A computable general equilibrium analysis. Agric. Econ. 2011, 42, 305–323. [Google Scholar] [CrossRef]
  38. Calzadilla, A.; Zhu, T.; Rehdanz, K.; Tol, R.S.; Ringler, C. Economywide impacts of climate change on agriculture in Sub-Saharan Africa. Eco. Econ. 2013, 93, 150–165. [Google Scholar] [CrossRef] [Green Version]
  39. Yadav, S.S.; Hegde, V.S.; Habibi, A.B.; Dia, M.; Verma, S. Climate change, agriculture and food security. In Food Security and Climate Change, 1st ed.; Yadav, S.S., Redden, R.J., Hatfield, J.L., Ebert, A.W., Hunter, D., Eds.; JohnWiley & Sons Ltd.: Hoboken, NJ, USA, 2019; pp. 1–24. [Google Scholar]
  40. Fei, Q.; Li, J.; Luo, Y.; Ma, K.; Niu, B.; Mu, C.; Gao, H.; Li, X. Plant molecular responses to the elevated ambient temperatures expected under global climate change. Plant Sig. Behav. 2018, 13, 1–16. [Google Scholar] [CrossRef] [Green Version]
  41. Sauz-Sánchez, J.J.; Rodiles-Hernández, R.; Andrade-Velázquez, M.; Mendoza-Carranza, M. Modelling the potential distribution of two tropical freshwater fish species under climate change scenarios. Aquat. Conserv. Mar. Freshw. Ecosyst. In press.
  42. Heidari, H.; Arabi, M.; Warziniack, T.; Kao, S.C. Assessing shifts in regional hydroclimatic conditions of U.S. River basins in response to climate change over the 21st century. Earth’s Future 2020, 8, 1–14. [Google Scholar] [CrossRef]
  43. Giorgi, F. Climate change hot-spots. Geophys. Res. Lett. 2006, 33. [Google Scholar] [CrossRef]
  44. Meehl, G.A.; Covey, C.; Delworth, T.; Latif, M.; McAvaney, B.; Mitchel, J.F.B.; Stouffer, R.J.; Taylor, K.E. The WCRP CMIP3 Multimodel Dataset: A New Era in Climate Change Research. Bull. Am. Meteorol. Soc. 2007, 88, 1383–1394. [Google Scholar] [CrossRef] [Green Version]
  45. Taylor, K.E.; Stouffer, R.J.; Meehl, G.A. A summary of the CMIP5 experiment design. Bull. Am. Meteorol. Soc. 2012, 93, 485–498. [Google Scholar] [CrossRef] [Green Version]
  46. Knutti, R.; Sedlácek, J. Robustness and uncertainties in the new CMIP5 climate model projections. Nat. Clim. Chang. 2012, 3, 369–373. [Google Scholar] [CrossRef]
  47. Harris, I.; Jones, P.D.; Osborn, T.J.; Lister, D.H. Updated high-resolution grids of monthly climatic observations - the CRU TS3.10 Dataset. Int. J. Climatol. 2014, 34, 623–642. [Google Scholar] [CrossRef] [Green Version]
  48. Hidalgo, H.G.; Alfaro, E.J. Skill of CMIP5 climate models in reproducing 20th century basic climate features in Central America. Int. J. Climatol. 2015, 35, 3397–3421. [Google Scholar] [CrossRef] [Green Version]
  49. Sperna Weiland, F.C.; Van Beek, L.P.H.; Kwadijk, J.C.J.; Bierkens, M.F.P. The ability of a GCM-forced hydrological model to reproduce global discharge variability. Hydrol. Earth Syst. Sci. 2010, 14, 1595–1621. [Google Scholar] [CrossRef] [Green Version]
  50. Elshamy, M.E.; Seierstad, I.A.; Sorteberg, A. Impacts of climate change on Blue Nile flows using bias-corrected GCM scenarios. Hydrol. Earth Syst. Sci. 2009, 13, 551–565. [Google Scholar] [CrossRef] [Green Version]
  51. Diallo, I.; Sylla, M.B.; Giorgi, F.; Gaye, A.T.; Camara, M. Multimodel GCM-RCM Ensemble-Based Projections of Temperature and Precipitation over West Africa for the Early 21st Century. Int. J. Geophys. 2012, 2012, 972896. [Google Scholar] [CrossRef] [Green Version]
  52. Shiru, M.S.; Chung, E.S.; Shahid, S.; Alias, N. GCM selection and temperature projection of Nigeria under different RCPs of the CMIP5 GCMS. Theor. Appl. Climatol. 2020, 141, 1611–1627. [Google Scholar] [CrossRef]
  53. Karmalkar, A.V.; Bradley, R.S.; Diaz, H.F. Climate change in Central America and Mexico: Regional climate model validation and climate change projections. Clim. Dyn. 2011, 37, 605–629. [Google Scholar] [CrossRef] [Green Version]
  54. Vichot-Llano, A.; Martinez-Castro, D.; Giorgi, F.; Bezanilla-Morlot, A.; Centella-Artola, A. Comparison of GCM and RCM simulated precipitation and temperature over Central America and the Caribbean. Theor. Appl. Climatol. 2020, 143, 389–402. [Google Scholar] [CrossRef]
  55. Moss, R.; Babiker, M.; Brinkman, S.; Calvo, E.; Carter, T.; Edmonds, J.; Elgizouli, I.; Emori, S.; Erda, L.; Hibbard, K.; et al. Towards New Scenarios for Analysis of Emissions, Climate Change, Impacts, and Response Strategies; Intergovernmental Panel on Climate Change (IPCC): Geneva, Switzerland, 2008; p. 25. [Google Scholar]
  56. Cavazos, T.; Salinas, J.A.; Martínez, B.; Colorado, G.; De Grau, P.; Prieto, R.; Conde, C.; Quintanar, A.; Santana, J.S.; Romero, R.C.; et al. Actualización de Escenarios de Cambio Climático para México como Parte de los Productos de la Quinta Comunicación Nacional. 2013. Available online: https://www.researchgate.net/publication/321274898 (accessed on 31 August 2021).
  57. Giorgi, F.; Mearns, L.O. Calculation of Average, Uncertainty Range, and Reliability of Regional Climate Changes from AOGCM Simulations via the Reliability Ensemble Averaging (REA) Method. J. Clim. 2002, 15, 1141–1158. [Google Scholar] [CrossRef]
  58. Andrade-Velázquez, M.; Montero-Martínez, M.J. Fiabilidad de los modelos del CMIP5 para la cuenca del río Usumacinta bajo el método REA. Digit. Cienc. 2019, 12, 14–21. Available online: http://ciencia.uaq.mx/index.php/ojs/article/view/26 (accessed on 31 August 2021).
  59. Aguilar, C.M.Z.; Velázquez, M.A.; Manzanilla, A.V. Proyecciones de Cambio Climático para la zona centro e Villahermosa, Tabasco. Kuxulkab 2020, 26, 21–26. [Google Scholar] [CrossRef]
  60. Xu, Y.; Gao, X.; Giorgi, F. Upgrades to the reliability ensemble averaging method for producing probabilistic climate-change projections. Clim. Res. 2010, 41, 61–81. [Google Scholar] [CrossRef] [Green Version]
  61. Clogg, C.C.; Petkova, E.; Haritou, A. Statistical methods for comparing regression coefficients between models. Am. J. Sociol. 1995, 100, 1261–1293. Available online: http://www.jstor.org/stable/2782277 (accessed on 31 August 2021). [CrossRef]
  62. Paternoster, R.; Brame, R.; Mazerolle, P.; Piquero, A. Using the correct statistical test for the equality of regression coefficients. Criminology 1998, 36, 859–866. [Google Scholar] [CrossRef]
  63. Jones, P.D.; Harpham, C.; Harris, I.; Goodess, C.M.; Burton, A.; Centella-Artola, A.; Taylor, M.A.; Bezanilla-Morlot, A.; Campbell, J.D.; Stephenson, T.S.; et al. Long-term trends in precipitation and temperature across the Caribbean. Int. J. Climatol. 2016, 36, 3314–3333. [Google Scholar] [CrossRef] [Green Version]
  64. Giannini, A.; Kushnir, Y.; Cane, M.A. Interannual Variability of Caribbean Rainfall, ENSO, and the Atlantic Ocean. J. Clim. 2000, 13, 297–311. [Google Scholar] [CrossRef]
  65. Anchukaitis, K.J.; Taylor, M.J.; Martin-Fernandez, J.; Pons, D.; Dell, M.; Chopp, C.; Castellanos, E.J. Annual chronology and climate response in Abies guatemalensis Rehder (Pinaceae) in Central America. Holoceno 2012, 23, 270–277. [Google Scholar] [CrossRef]
  66. Anchukaitis, K.J.; Taylor, M.J.; Leland, C.; Pons, D.; Martin-Fernandez, J.; Castellanos, E. Tree-ring reconstructed dry season rainfall in Guatemala. Clim. Dyn. 2014, 45, 1537–1546. [Google Scholar] [CrossRef]
  67. Stahle, D.W.; Cook, E.R.; Burnette, D.J.; Villanueva, J.; Cerano, J.; Burns, J.N.; Griffin, D.; Cook, B.I.; Acuña, R.; Torbenson, M.C.A.; et al. The Mexican Drought Atlas: Tree-ring reconstructions of the soil moisture balance during the late pre-Hispanic, colonial, and modern eras. Quat. Sci. Rev. 2016, 149, 34–60. [Google Scholar] [CrossRef] [Green Version]
  68. Quesada-Román, A.; Ballesteros-Cánovas, J.A.; Guillet, S.; Madrigal-González, J.; Stoffel, M. Neotropical Hypericum irazuense shrubs reveal recent ENSO variability in Costa Rican páramo. Dendrochronologia 2020, 61, 1–10. [Google Scholar] [CrossRef]
  69. Corrales-Suastegui, A.; Fuentes-Franco, R.; Pavia, E.G. The mid-summer drought over Mexico and Central America in the 21st century. Int. J. Climatol. 2020, 40, 1703–1715. [Google Scholar] [CrossRef]
  70. Kim, H.-J.; An, S.-I.; Kim, D. Timescale-dependent AMOC–AMO relationship in an earth system model of intermediate complexity. Int. J. Climatol. 2021, 41, 3298–3306. [Google Scholar] [CrossRef]
  71. NOAA, AMO (Atlantic Multidecadal Oscillation) Index. Climate Timeseries. 2021. Available online: https://psl.noaa.gov/data/timeseries/AMO/ (accessed on 10 August 2021).
  72. Hidalgo, H.G.; Alfaro, E.J.; Quesada-Montano, B. Observed (1970–1999) climate variability in Central America using a high-resolution meteorological dataset with implication to climate change studies. Clim. Chang. 2016, 141, 13–28. [Google Scholar] [CrossRef] [Green Version]
  73. Cavazos, T.; Luna-Niño, R.; Cerezo-Mota, R.; Fuentes-Franco, R.; Méndez, M.; Martínez, L.F.; Valenzuela, E. Climatic trends and regional climate models intercomparison over the CORDEXCAM (Central America, Caribbean and Mexico) domain. Int. J. Climatol. 2019, 40, 1396–1420. [Google Scholar] [CrossRef]
  74. Singh, A.; Thakur, S.; Adhikary, N.C. Influence of climatic indices (AMO, PDO, and ENSO) and temperature on rainfall in the Northeast Region of India. SN Appl. Sci. 2020, 2, 1–15. [Google Scholar] [CrossRef]
  75. Schoennagel, T.; Veblen, T.; Kulakowski, D.; Holz, A. Multidecadal climate variability and climate interactions affect subalpine fire occurrence, western Colorado (USA). Ecology 2007, 88, 2891–2902. [Google Scholar] [CrossRef] [Green Version]
  76. Bonomo, S.; Ferrante, G.; Palazzi, E.; Pelosi, N.; Lirer, F.; Viegi, G.; La Grutta, S. Evidence for a link between the Atlantic multidecadal oscillation and annual asthma mortality rates in the US. Sci. Rep. 2019, 9, 1–12. [Google Scholar] [CrossRef]
  77. McCabe, G.J.; Palecki, M.A.; Betancourt, J.L. Pacific and Atlantic Ocean influences on multidecadal drought frequency in the United States. Proc. Natl. Acad. Sci. USA 2004, 101, 4136–4141. [Google Scholar] [CrossRef] [PubMed] [Green Version]
  78. Cabos, W.; Sein, D.V.; Durán-Quesada, A.; Liguori, G.; Koldunov, N.V.; Martínez-López, B.; Alvarez, F.; Sieck, K.; Limareva, N.; Pinto, J.G. Dynamical downscaling of historical climate over CORDEX Central America domain with a regionally coupled atmosphere–ocean model. Clim. Dyn. 2018, 52, 4305–4328. [Google Scholar] [CrossRef] [Green Version]
  79. Kumar, S.; Kinter, J.; Dirmeyer, P.A.; Pan, Z.; Adams, J. Multidecadal Climate Variability and the? Warming Hole? in North America: Results from CMIP5 Twentieth- and Twenty-First-Century Climate Simulations. J. Clim. 2013, 26, 3511–3527. [Google Scholar] [CrossRef]
  80. Kumar, S.; Merwade, V.; Kinter, J.L.; Niyogi, D. Evaluation of Temperature and Precipitation Trends and Long-Term Persistence in CMIP5 Twentieth-Century Climate Simulations. J. Clim. 2013, 26, 4168–4185. [Google Scholar] [CrossRef]
  81. Wang, J.; Xu, C.; Hu, M.; Li, Q.; Yan, Z.; Jones, P. Global land surface air temperature dynamics since 1880. Int. J. Climatol. 2018, 38, 466–474. [Google Scholar] [CrossRef]
  82. Diffenbaugh, N.S.; Giorgi, F. Climate change hotspots in the CMIP5 global climate model ensemble. Clim. Chang. 2012, 114, 813–822. [Google Scholar] [CrossRef] [Green Version]
  83. IPCC. Special report on emissions scenarios. In A Special Report of Working Group III of the Intergovernmental Panel on Climate Change; Cambridge University Press: Cambridge, UK, 2000; 599p, Available online: https://www.ipcc.ch/report/emissions-scenarios/ (accessed on 31 August 2021).
  84. Fuentes-Franco, R.; Coppola, E.; Giorgi, F.; Graef, F.; Pavia, E.G. Assessment of RegCM4 simulated inter-annual variability and daily-scale statistics of temperature and precipitation over Mexico. Clim. Dyn. 2013, 42, 629–647. [Google Scholar] [CrossRef] [Green Version]
  85. Maurer, E.P.; Roby, N.; Stewart-Frey, I.T.; Bacon, C.M. Projected twenty-first-century changes in the Central American mid-summer drought using statistically downscaled climate projections. Reg. Environ. Chang. 2017, 17, 2421–2432. [Google Scholar] [CrossRef]
  86. Rosenzweig, C.; Elliott, J.; Deryng, D.; Ruane, A.C.; Müller, C.; Arneth, A.; Boote, K.J.; Folberth, C.; Glotter, M.; Khabarov, N.; et al. Assessing agricultural risks of climate change in the 21st century in a global gridded crop model intercomparison. Proc. Natl. Acad. Sci. USA 2014, 111, 3268–3273. [Google Scholar] [CrossRef] [Green Version]
  87. Wheeler, T.; Braun, J. von Climate Change Impacts on Global Food Security. Science 2013, 341, 508–513. [Google Scholar] [CrossRef]
  88. Donatti, C.I.; Harvey, C.A.; Martinez-Rodriguez, M.R.; Vignola, R.; Rodriguez, C.M. Vulnerability of smallholder farmers to climate change in Central America and Mexico: Current knowledge and research gaps. Clim. Dev. 2018, 11, 264–286. [Google Scholar] [CrossRef] [Green Version]
  89. Sauz-Sánchez, J.J.; Andrade-Velázquez, M.; Rodiles-Hernández, R.; Mendoza-Carranza, M. El Futuro del Pejelagarto y la Tenguayaca, Impacto del Cambio Climático Sobre la Distribución de Peces Dulceacuícolas en ¿Qué y Cómo Estudiamos las Especies que Habitan el Trópico? Universidad de Ciencias y Artes de Chiapas: Chiapas, Mexico, 2021. [Google Scholar]
Figure 1. Study region (Southeast Mexico, Central America, and the Caribbean).
Applsci 11 08284 g001
Figure 2. Spatial distribution of the analyzed points (in blue). Southeast Mexico, Central America, and the Caribbean are in green color. Note. The numbers correspond to the study points in Table 2.
Applsci 11 08284 g002
Figure 3. Taylor diagram for the 1060–2016 precipitation and climate drivers (ENSO-blue, PDO-red, AMO-green). Southern Mexico is represented by the points 1–5, Central America by the points 6–12, and the Caribbean by 13–17.
Applsci 11 08284 g003
Figure 4. Taylor diagram for the 1060–2016 Temperature and climate drivers (ENSO-blue, PDO-red, AMO-green). Mexico southern is represented by the points 1–5, Central America by the points 6–12, and the Caribbean by 13–17.
Applsci 11 08284 g004
Figure 5. Plots of z-eq for the four variables, (a) Tmx, (b) Tmn, (c) Tmp, and (d) Pre, in each study point and for each RCP scenario. The significant difference between the trends (historic and projected) is shown by the dark colors (red and blue).
Applsci 11 08284 g005
Table 1. Fifteen Global Coupled Models from CMIP5-IPCC.
IdModelsScenarios RCP
1BCC-CSM4.5, 6.0, 8.5
2CanESM24.5, 8.5
3CNRM-CM54.5, 8.5
4CSIRO-Mk3-6-04.5
5GFDL6.0, 8.5
6GISS-E2-R4.5, 6.0, 8.5
7HadGEM2-ES4.5, 6.0, 8.5
8inmcm44.5, 8.5
9IPSL-CM5A-LR4.5, 6.0, 8.5
10MIROC54.5, 6.0, 8.5
11MIROC-ESM-CHEM4.5, 6.0
12MIROC-ESM4.5, 6.0, 8.5
13MPI-ESM-LR4.5, 8.5
14MRI-CGCM3-M4.5, 8.5
15NorESM1-M4.5, 6.0, 8.5
Source. https://pcmdi.llnl.gov/mips/cmip5/ (accessed date: 31 August 2021).
Table 2. Geographic coordinates of 17 points of the study region.
IDLatitudeLongitudeCountry/StateClose City
Southeast Mexico-Yucatan Peninsula
116.75°−92.25°ChiapasSan Cristobal
217.75°−92.25°TabascoVillahermosa
318.75°−89.25°CampecheChampoton
420.25°−87.75°Quintana RooFelipe Carrillo Puerto
521.25°−88.75°YucatanBuctzotz
Central America
69.25°−79.25°PanamaPanama City
79.75°−84.25°Costa RicaSan José
812.25°−86.25°NicaraguaManagua
913.75°−89.25°El SalvadorSan Salvador
1014.25°−87.25°HondurasTegucigalpa
1114.25°−90.25°GuatemalaGuatemala
1217.25°−88.75°BelizeBelmopan
Caribbean
1322.75°−81.75°CubaLimonar
1419.25°−72.75°HaitiAribonite
1519.25°−69.75°Dominican RepublicMaría Trinidad Sánchez
1618.25°−77.25°JamaicaSt. Ann Parish
1718.25°−65.75°Puerto RicoSan Juan
Table 3. Climate anomaly trends for the mean, maximum, and minimum temperatures and precipitation during 1960–2016. These trends correspond to the CRU data.
NumTmp (°C/year) (std err)Tmx (°C/year) (std err)Tmn (°C/year) (std err)Pr (mm/year) (std err)
1+0.0235 (0.00191)+0.0282 (0.00281)+0.0187 (0.00205)+0.162 (0.164)
2+0.0215 (0.0019)+0.0263 (0.00281)+0.0164 (0.00204)+0.195 (0.24)
3+0.0196 (0.00202)+0.0186 (0.00297)+0.0204 (0.00236)+0.265 (0.0958)
4+0.0183 (0.0022)+0.0185 (0.00289)+0.0184 (0.00281)+0.248 (0.117)
5+0.0167 (0.00259)+0.0162 (0.00323)+0.0172 (0.003)+0.175 (0.0905)
6+0.0134 (0.00224)−0.00278 (0.00365)+0.0293 (0.00303)−0.0364 (0.288)
7+0.0155 (0.0027)+0.0155 (0.0027)+0.0155 (0.0027)−0.386 (0.221)
8+0.0192 (0.00217)+0.0216 (0.00234)+0.0173 (0.00272)−0.312 (0.145)
9+0.0236 (0.00191)+0.0286 (0.00261)+0.0189 (0.00228)−0.064 (0.195)
10+0.0224 (0.00202)+0.0257 (0.00261)+0.0188 (0.00254)−0.0657 (0.163)
11+0.0252 (0.00191)+0.03 (0.00275)+0.0203 (0.00211)−0.0488 (0.258)
12+0.0217 (0.00178)+0.0205 (0.00258)+0.023 (0.00239)+0.137 (0.171)
13+0.0207 (0.00268)+0.0152 (0.00291)+0.0263 (0.00269)+0.215 (0.18)
14+0.017 (0.00258)+0.0071 (0.00324)+0.0269 (0.00287)+0.0402 (0.148)
15+0.0143 (0.00238)+0.0115 (0.00256)+0.0172 (0.00281)+0.640 (0.236)
16+0.0245 (0.00212)+0.00928 (0.00253)+0.0396 (0.00278)−0.0681 (0.328)
17+ 0.0144 (0.00192)+0.015 (0.00231)+0.0141 (0.00201)+0.617 (0.323)
Publisher’s Note: MDPI stays neutral with regard to jurisdictional claims in published maps and institutional affiliations.

