Article

Effect of Heat Treatment on Microstructure and Creep Behavior of Fe-40Ni-24Cr Alloy

1
Faculty of Engineering, Universiti Teknologi Malaysia, Johor Bahru 81310, Malaysia
2
Advanced Materials Research Center, Department of Materials Engineering, Najafabad Branch, Islamic Azad University, Najafabad , Iran
3
Department of Mechanical and Industrial Engineering, Norwegian University of Science and Technology, 7491 Trondheim, Norway
*
Authors to whom correspondence should be addressed.
Appl. Sci. 2021, 11(17), 7951; https://doi.org/10.3390/app11177951
Submission received: 4 August 2021 / Revised: 21 August 2021 / Accepted: 22 August 2021 / Published: 28 August 2021
(This article belongs to the Special Issue New Trends in Fracture Mechanics and Fatigue Design)

Abstract

:
Iron-nickel-chromium (Fe-Ni-Cr) alloy Haynes HR120 is an iron-nickel-based superalloy, which is extensively used in gas turbines. Hence, the materials for the fabrication of steam turbine blades should present great mechanical characteristics and creep properties. In this study, Fe-40Ni-24Cr was heat-treated at temperatures from 950 to 1250 °C. High temperature creep behavior and microstructure evolution of the selected heat-treated (1050 °C, 1200 °C, 1225 °C and 1250 °C) Fe-40Ni-24Cr alloy were assessed at temperatures of 800 °C and 900 °C under 100 MPa stress. The alloy consisted of titanium and niobium rich precipitates, namely NbC, (Nb,Ti)C, TiN and Ti(C,N) distributed in the matrix grain boundaries, which enhance the creep properties of the alloy. The hardness of heat-treated Fe-40Ni-24Cr alloy decreased with increasing temperature and grain size. The creep strain of the Fe-40Ni-24Cr alloy increased with escalation in the creep time and the temperature being under constant applied stress. Fe-40Ni-24Cr alloy shows a decrease in steady-state creep rate with an increase in grain size from 62 μm to 183 μm due to the grain boundary sliding mechanism and 183 μm to 312 μm due to the occurrence of dislocation climb. This result exhibited that grain size has a significant influence on the alloys’ high temperature creep properties.

1. Introduction

Superalloys are known to be heat resistant alloys; they are named nickel-based, iron nickel-based and cobalt-based alloys. They are generally used at a temperature above 540 °C [1,2,3,4,5] and some exceed 85% of their initial melting temperatures, such as gas turbines and steam generators [6,7,8]. These superalloys need to exhibit combinations of good high strength and high creep resistance, and the potential to work at high temperatures for long periods [9,10,11,12,13,14]. Generally, for application at very high temperatures, nickel-based alloys are used, followed by cobalt-based alloys and then lastly iron-nickel alloys. The strengthening of superalloys can be achieved by solid solution hardening mechanism and precipitation hardening [15,16,17,18,19,20,21]. A combination of precipitate hardening, the existence of carbides at the grain boundaries and solid solution hardening can strengthen both Ni and Fe-Ni-based superalloys [22,23]. In this perspective, the majority of Fe-Ni-based superalloys consist of 25–45% Ni and 15–60% Fe [24]. For oxidation resistance at high temperature, 15 to 28% Cr is added, whereas, for solid solution strengthening, 1–6% Mo is added. Meanwhile, for precipitation hardening effects, Al, Ti and Nb elements are added [25]. At high temperatures, Ni alloys provide longer service life and higher strength compared to most of the alloys available today [26,27]. Fe-Ni-Cr alloys are included in the family of Ni-based superalloys that offer excellent strength at high temperature with oxidizing and carburizing environments. This renders them suitable for such parts as blades and disks in gas turbine engines [26,27,28].
In this context, Fe-40Ni-24Cr alloy (HAYNES® HR-120®) is a new solid-solution strengthened Fe-Ni-Cr-based superalloy which has excellent strength at high temperatures [15,29,30]. The alloy has a high resistance to sulfidizing and carburizing environments and its strength, at 1095 °C, is significantly higher compared to Ni-Cr alloys. Hence, Fe-40Ni-24Cr alloy was developed as a more affordable alternative to other Ni-based superalloys and also acted as an upgrade to stainless steels [31,32,33]. This alloy has been widely applied in industrial heating, gas-turbine, heat-treating equipment, and fixtures, thermal processing equipment such as bar frame heat-treating baskets, muffles retorts, radiant tubes, cast link belt pins, and mineral processing, land-based gas-turbine industries, and waste incinerator internals [6,29,34].
Since Fe-40Ni-24Cr alloy was exposed to a critical environment, it is important to fully understand the creep damage behaviour for the design and safety evaluation process of high-temperature structural material [6,35]. Creep can occur at temperatures that exceed absolute zero [35]. Creep often occurs in the material under load over an extended period with continuous deformation with slow behavior. For that reason, the creep behavior and properties of Fe-Ni-Cr alloy have been extensively studied. In this respect, creep can occur at temperatures approximately higher than 0.5 Tm in which Tm is the absolute melting temperature of the alloy [31,36]. Upon reaching up to the temperature above 0.4 Tm, the dislocations are no longer restricted to move in their slip planes. The dislocation climb process will occur in this free dislocation movement [36]. In this context, a total failure or rupture will occur even with the slightest millimeters of crack induced by creep if the crack is not being controlled [15,37,38,39,40,41]. A great deal of research was performed on developing mechanisms for creep deformation. The creep deformation mechanisms were classified as dislocation creep, dislocation glide, grain boundary sliding and diffusion creep [3,4]. Creep crack initiation and subsequent growth is a principal failure mechanism of components operating at elevated temperatures [5]. Specific to creep rupture is the fact that the nucleation and the stable growth are time dependent and occur at a constant stress. Furthermore, typically for creep rupture, it occurs by intergranular cracking only. It seems to be generally accepted that creep rupture occurs by the formation of two alternative types of cracks [4], namely, intergranular cavities and intergranular wedge cracks. Fe-Ni-Cr alloy subjected to long term thermal and pressure conditions would result in precipitates formation and materials creep failure due to constant high temperature and pressure. The high temperature creep test on Fe-Ni-Cr alloys would give a better understanding in creep damage behavior, microstructure changes, failure mechanism after creep test and safety evaluation process of high temperature structural material [3,4,5,26]. While many investigations have been carried out regarding microstructural changes and mechanical properties of Fe-Ni-Cr superalloy, limited study has been conducted regarding microstructure change and creep behavior of Fe-40Ni-24Cr alloy development concerning the application of this alloy in gas-turbine industries in the future. Hence, it is vital to comprehensively understand the creep mechanism and behavior of Fe-40Ni-24Cr alloy at higher temperatures. Therefore, the main approach of the present study is to evaluate the creep properties and creep microstructure evolution on selected heat-treated (1050 °C, 1200 °C, 1225 °C and 1250 °C) Fe-40Ni-24Cr alloy at temperatures of 800 °C and 900 °C under 100 MPa stress.

2. Experimental Procedure

The materials used in this research were commercial Fe-40Ni-24Cr alloy (HAYNES® HR-120®) supplied by Haynes. The alloy received was in sheet form with dimensions 300 (l) × 100 (w) × 3 (t) mm using electrical discharge machining (EDM). Then the specimen underwent mounting, followed by grinding, polishing and etching in order to conduct microstructure investigation on the materials.
Table S1 in the Supplementary Materials shows the chemical composition of the materials. The chemical composition was analyzed by using an optical emission spectrometer (OES). Then the specimens underwent solution treatment at temperatures 950 °C, 1000 °C, 1050 °C, 1100 °C, 1150 °C, 1200 °C, 1225 °C and 1250 °C with heating rate 1 °C/min for 3 h (significant to transform all the room temperature microstructures to austenitic structures), followed by a water quenching process. Hitachi SU8000 scanning electron microscope (SEM) and ZEISS-SUPRA 3 SVP field emission scanning electron microscope (FESEM) were used to analyze the microstructure detail and fracture morphology of the specimens. Energy-dispersive X-ray spectrometer (EDS) with FESEM was used to determine the chemical element in the specimens. The transmission electron microscope (TEM) that was used in the research was Tecnai F20ST, FEI at WinTech Nano-Technology Services Pte. Ltd., Singapore. The TEM operated at 200 keV with a point to point of 0.24 nm and a camera length of 100 mm. TEM is used to analyze selected area diffraction (SAD) pattern, high-resolution imaging (HRTEM) and energy dispersive X-ray spectrometer (EDS). The diameter size for the SAD was between 280 nm to 300 nm.
EBSD analysis was conducted at Bruker Singapore Pte. Ltd. by using an e-Flash Bruker detector attached to a ZEISS scanning electron microscope (SEM). For EBSD analysis, a very fine, flat polished surface was required where the specimen preparation procedure was similar to the specimen preparation for scanning electron microscope (SEM) analysis; an ion milling was performed after fine polishing to obtain a smoother surface. D5000 Siemens X-ray diffraction equipment was used to conduct XRD analysis at room temperature. The XRD analysis machine employed a monochromatic X-ray source of CuKα radiation, where λ = 1.5406 Å with a tube current of 30 mA and voltage of 40 kV. A range of 10° to 100° of 2θ was selected with a step size of 0.05°. The specimens for hardness test analysis were initially mechanically ground using grit 600. The specimens were then tested using the Matsuzawa-DVK II series Vickers Hardness Tester with a load of 30 kg at room temperature. Indentation tests were performed using a diamond pyramid indenter pressed in a perpendicular direction into the specimens’ surface. Five indentations were performed on the surface of the specimens and the average of the hardness value was taken as the hardness value of the alloys.
The specimens were prepared for the creep test by cutting the plate into a rectangular shape using electrical discharge machining (EDM). The dimensions of the specimens were in accordance with ASTM E139, as shown in Figure S1 (presented in the Supplementary Materials). To conduct a creep test, the MAYES TC 20 creep machine was used in the research, as shown in Figure S2 (presented in the Supplementary Materials). The creep machine’s load and furnace temperature was calibrated by using a standard load cell and thermocouple prior to the actual creep test. The Fe-40Ni-24Cr alloy in plate form was initially used in the research. An EDM wire cut machine was used to cut the specimens into a rectangular form of shape. The specimens were then subjected to the heat-treatment process. In this regard, this test was conducted in a dead-load knife-edge lever creep machine with a ratio of 1:10 in a three-zone furnace. The specimen was assembled onto the machine with a specimen holder. At least three samples were examined to ensure reproducibility of the results. A chromel–alumel (K-type) thermocouple was connected to the specimen to monitor the temperature, and the temperature was maintained at ±3 °C during creep tests at 800 °C and 900 °C. The high-temperature extensometer was also connected to the four edges of the specimen to detect and record any changes in the specimen length. This was connected to a linear variable differential transformer (LVDT) to convert data to a data logger linked to a computer with software TDS 7130 to measure the percentage of strain elongation. All creep tests were conducted until the specimen fractured.

3. Result and Discussion
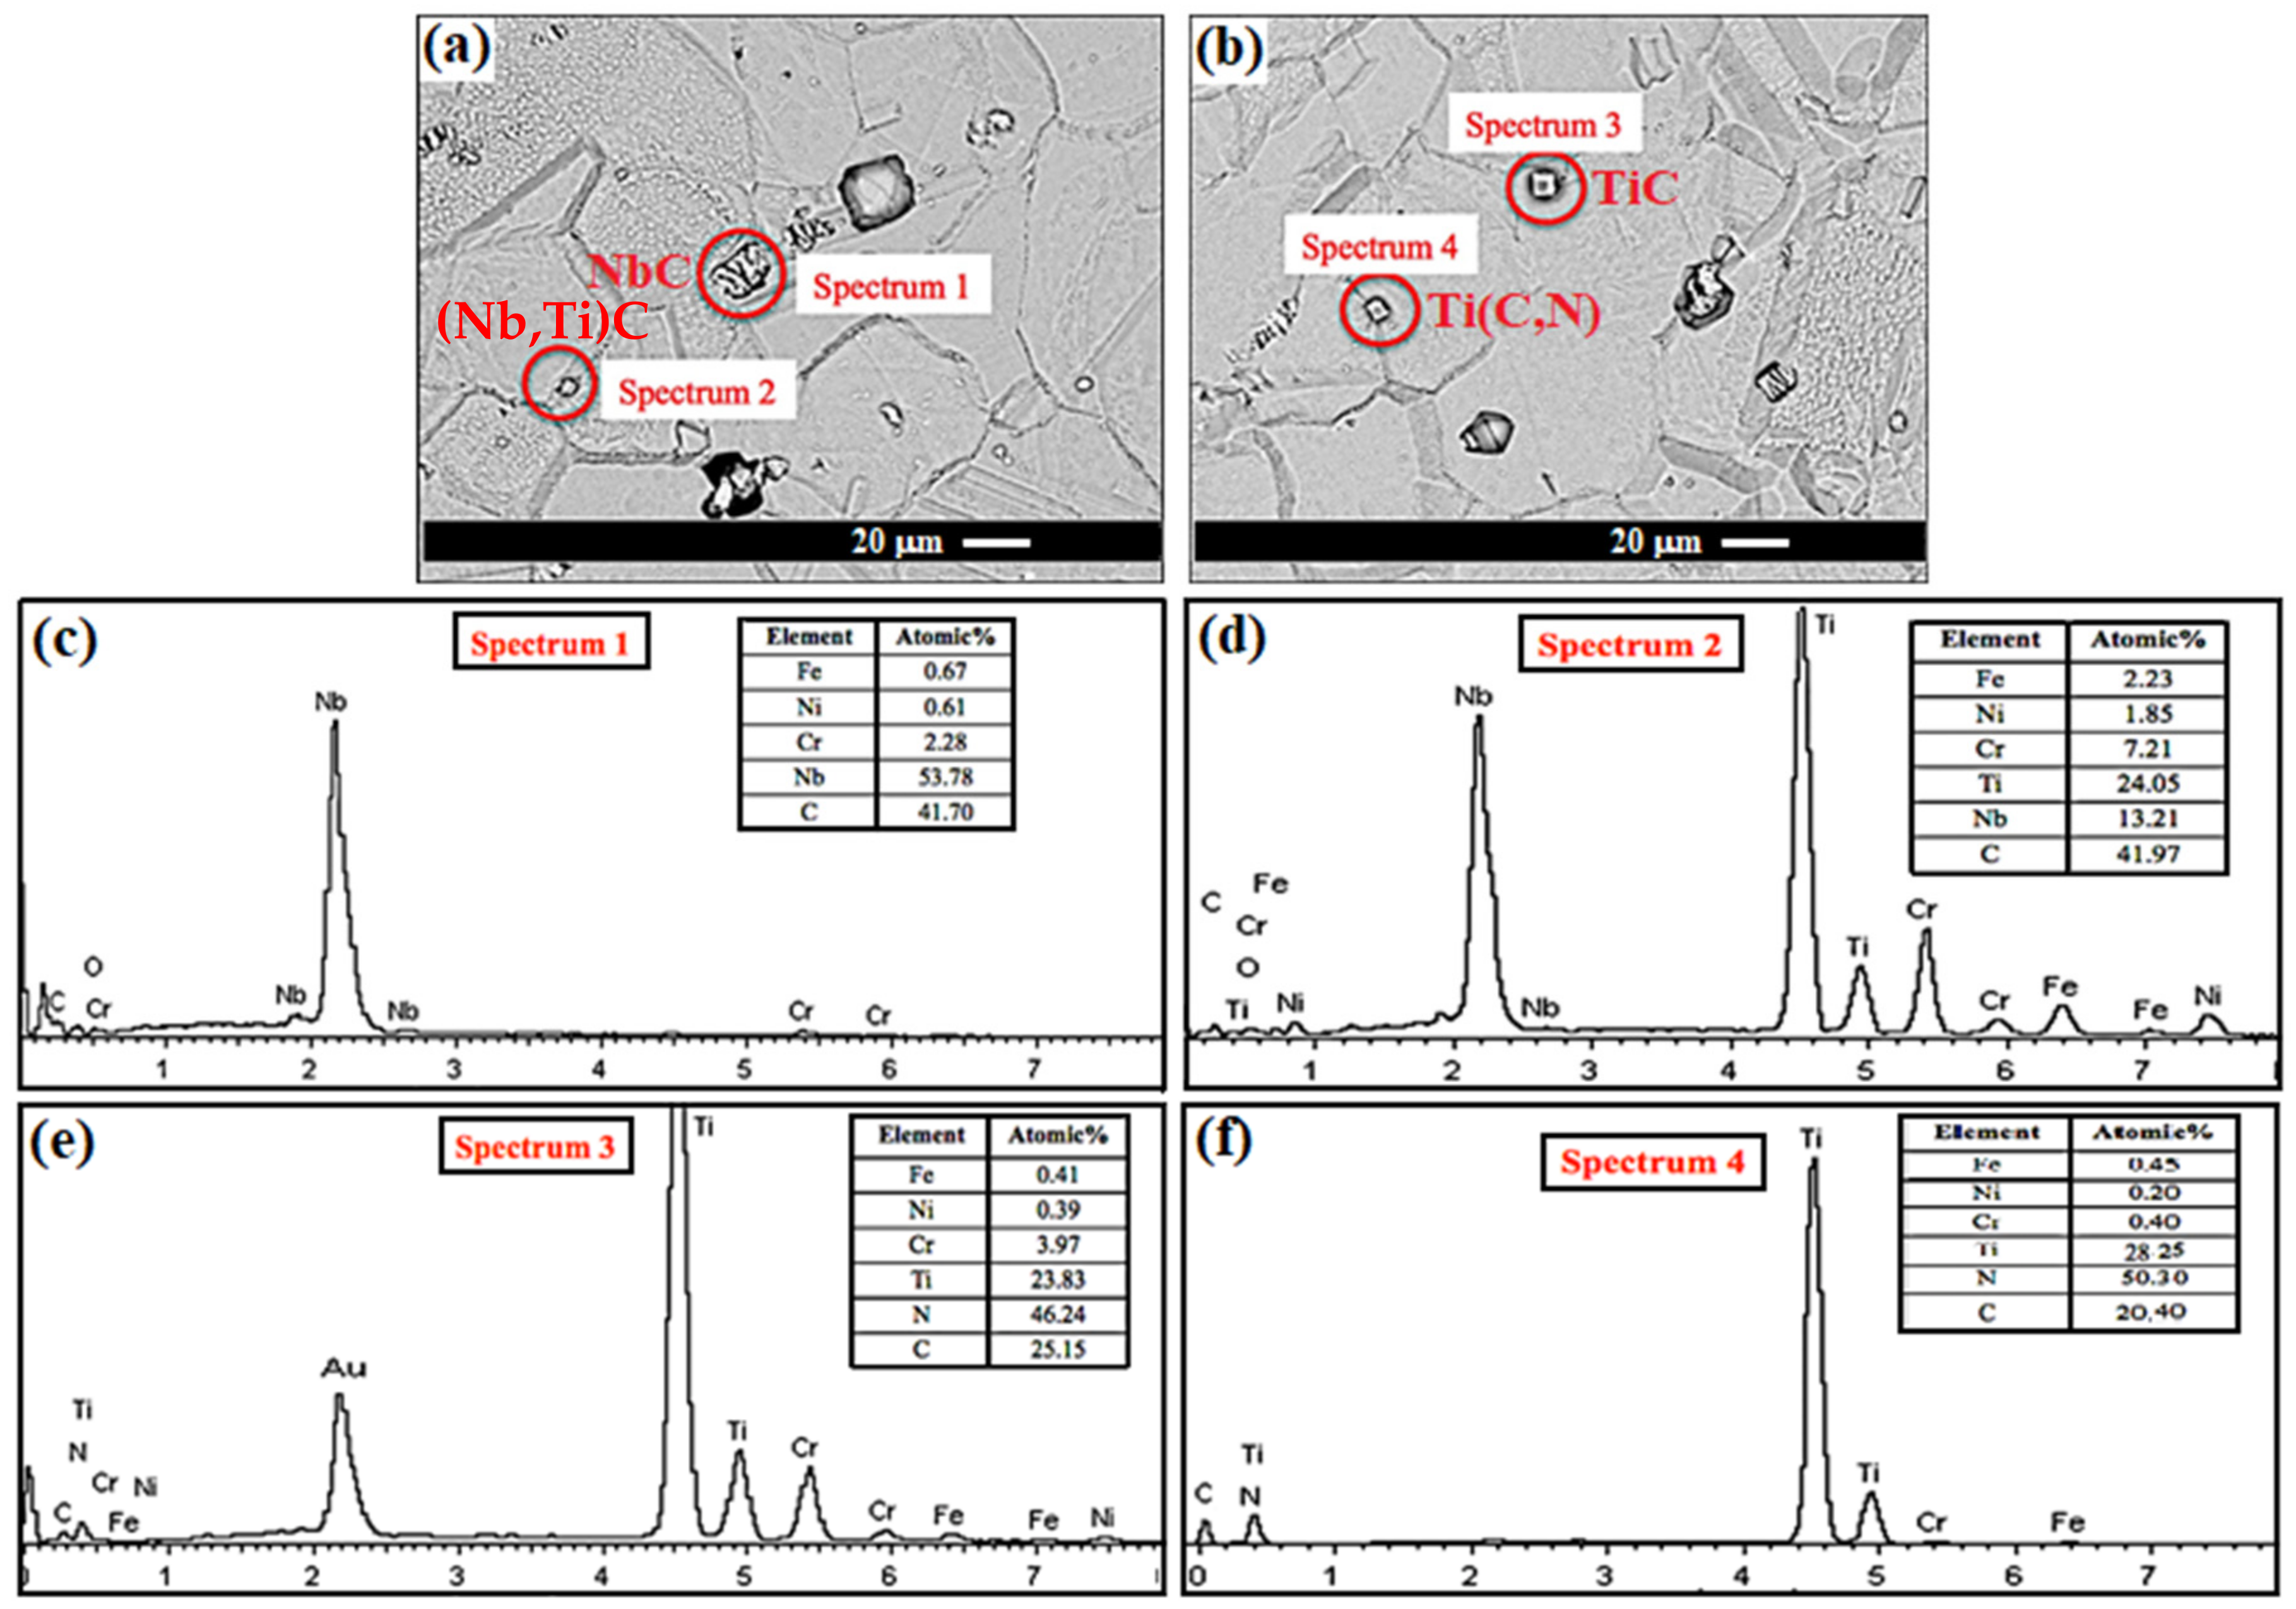
3.1. Microstructure

The microstructure of the as-received alloy (Figure 1a) showed a fully austenitic equiaxed matrix with a few annealing twins across the grains. An annealing twin will form during cooling due to transformation and rearrangement from unstable to stable crystal structure. The atoms reposition themselves and the resulting formation of stacking faults in a deformed crystal. Annealing twins show a mirror image of the structure existing across a boundary. The microstructure of heat-treated Fe-40Ni-24Cr alloy at a temperature of 950 °C to 1250 °C for 3 h followed by rapid water quench is shown in Figure 1b–h. Heat-treated specimens also showed the austenite matrix fully with annealing twin (red arrows) and precipitates (yellow arrows). The grain size was observed from the optical image to increase with the increase of heat treatment temperature from 950 °C to 1150 °C, where the grain size of the as-received Fe-40Ni-24Cr alloy was 53 μm. The as-received specimen’s grain size was smaller than the specimen that had been heat-treated at 950 °C due to the higher heat treatment temperature. Similarly, the as-received specimen’s grain size was smaller than the specimen that had been heat-treated at 1000 °C due to the short soaking time. Abnormal grain growth is observed in higher heat treatment temperature. Due to a decrease in the amount of carbide precipitates, the Zener pinning effect on the high-temperature grain growth is lowered, causing coarsening in the grains. This was proved by the sudden abnormal grain growth on heat-treated specimens at 1200 °C, and 1250 °C, respectively. FESEM images of the as-received Fe-40Ni-24Cr and the solution-treated Fe-40Ni-24Cr at 1200 °C also further confirmed that grain growth takes place after solution treatment due to the movement of grain boundaries, with large grains consuming the smaller grains (see Figure S3 presented in the Supplementary Materials).
Figure 2a,b shows the SEM image of Fe-40Ni-24Cr alloy. The images display four different types of precipitates. Fe-40Ni-24Cr alloy contains 0.441 wt% niobium, 0.029 wt% titanium, 0.206 wt% nitrogen and 0.048 wt% carbon. Hence, Fe-40Ni-24Cr alloy tends to form NbC, (Nb,Ti)C, TiN and Ti(C,N) precipitate during a high-temperature casting. These precipitates’ elemental composition was determined by EDX analysis (recorded in atomic %), as shown in Figure 2c–f. Precipitates with irregular shapes were identified as niobium (Nb,Ti)C. The blocky precipitate observed in spectrum 1 indicates the presence of NbC due to the high atomic % of niobium and carbon (Figure 2c), while spectrum 2 indicates the presence of (Nb,Ti)C (Figure 2d). Spectrums 3 and 4 in Figure 2e,f showed high atomic % in terms of titanium, carbon and nitrogen elements, which indicated the presence of TiC and Ti(C,N) particles with a cubical shape. Even at high soaking temperatures, these precipitates do not easily dissolve during heat annealing. Dehmolaei et al. [39] reported that TiN and Ti(C,N) precipitates formed during solidification from the melt and could not easily be dissolved at high soaking heat annealing temperatures. All precipitates were found along the grain boundaries as well as in the matrix, and they were formed during the solidification process from the melt. Similar observations were reported by Chen et al. [42], Dutta [43] and Tan et al. [44]. The fracture toughness of the material was enhanced due to particle coherency strengthening concerning the matrix [45,46,47,48]. Figure S4, presented in the Supplementary Materials, shows the elemental mapping analysis conducted on the precipitates and matrix, while Figure S5a–h, presented in the Supplementary Materials, shows the XRD patterns of the samples.

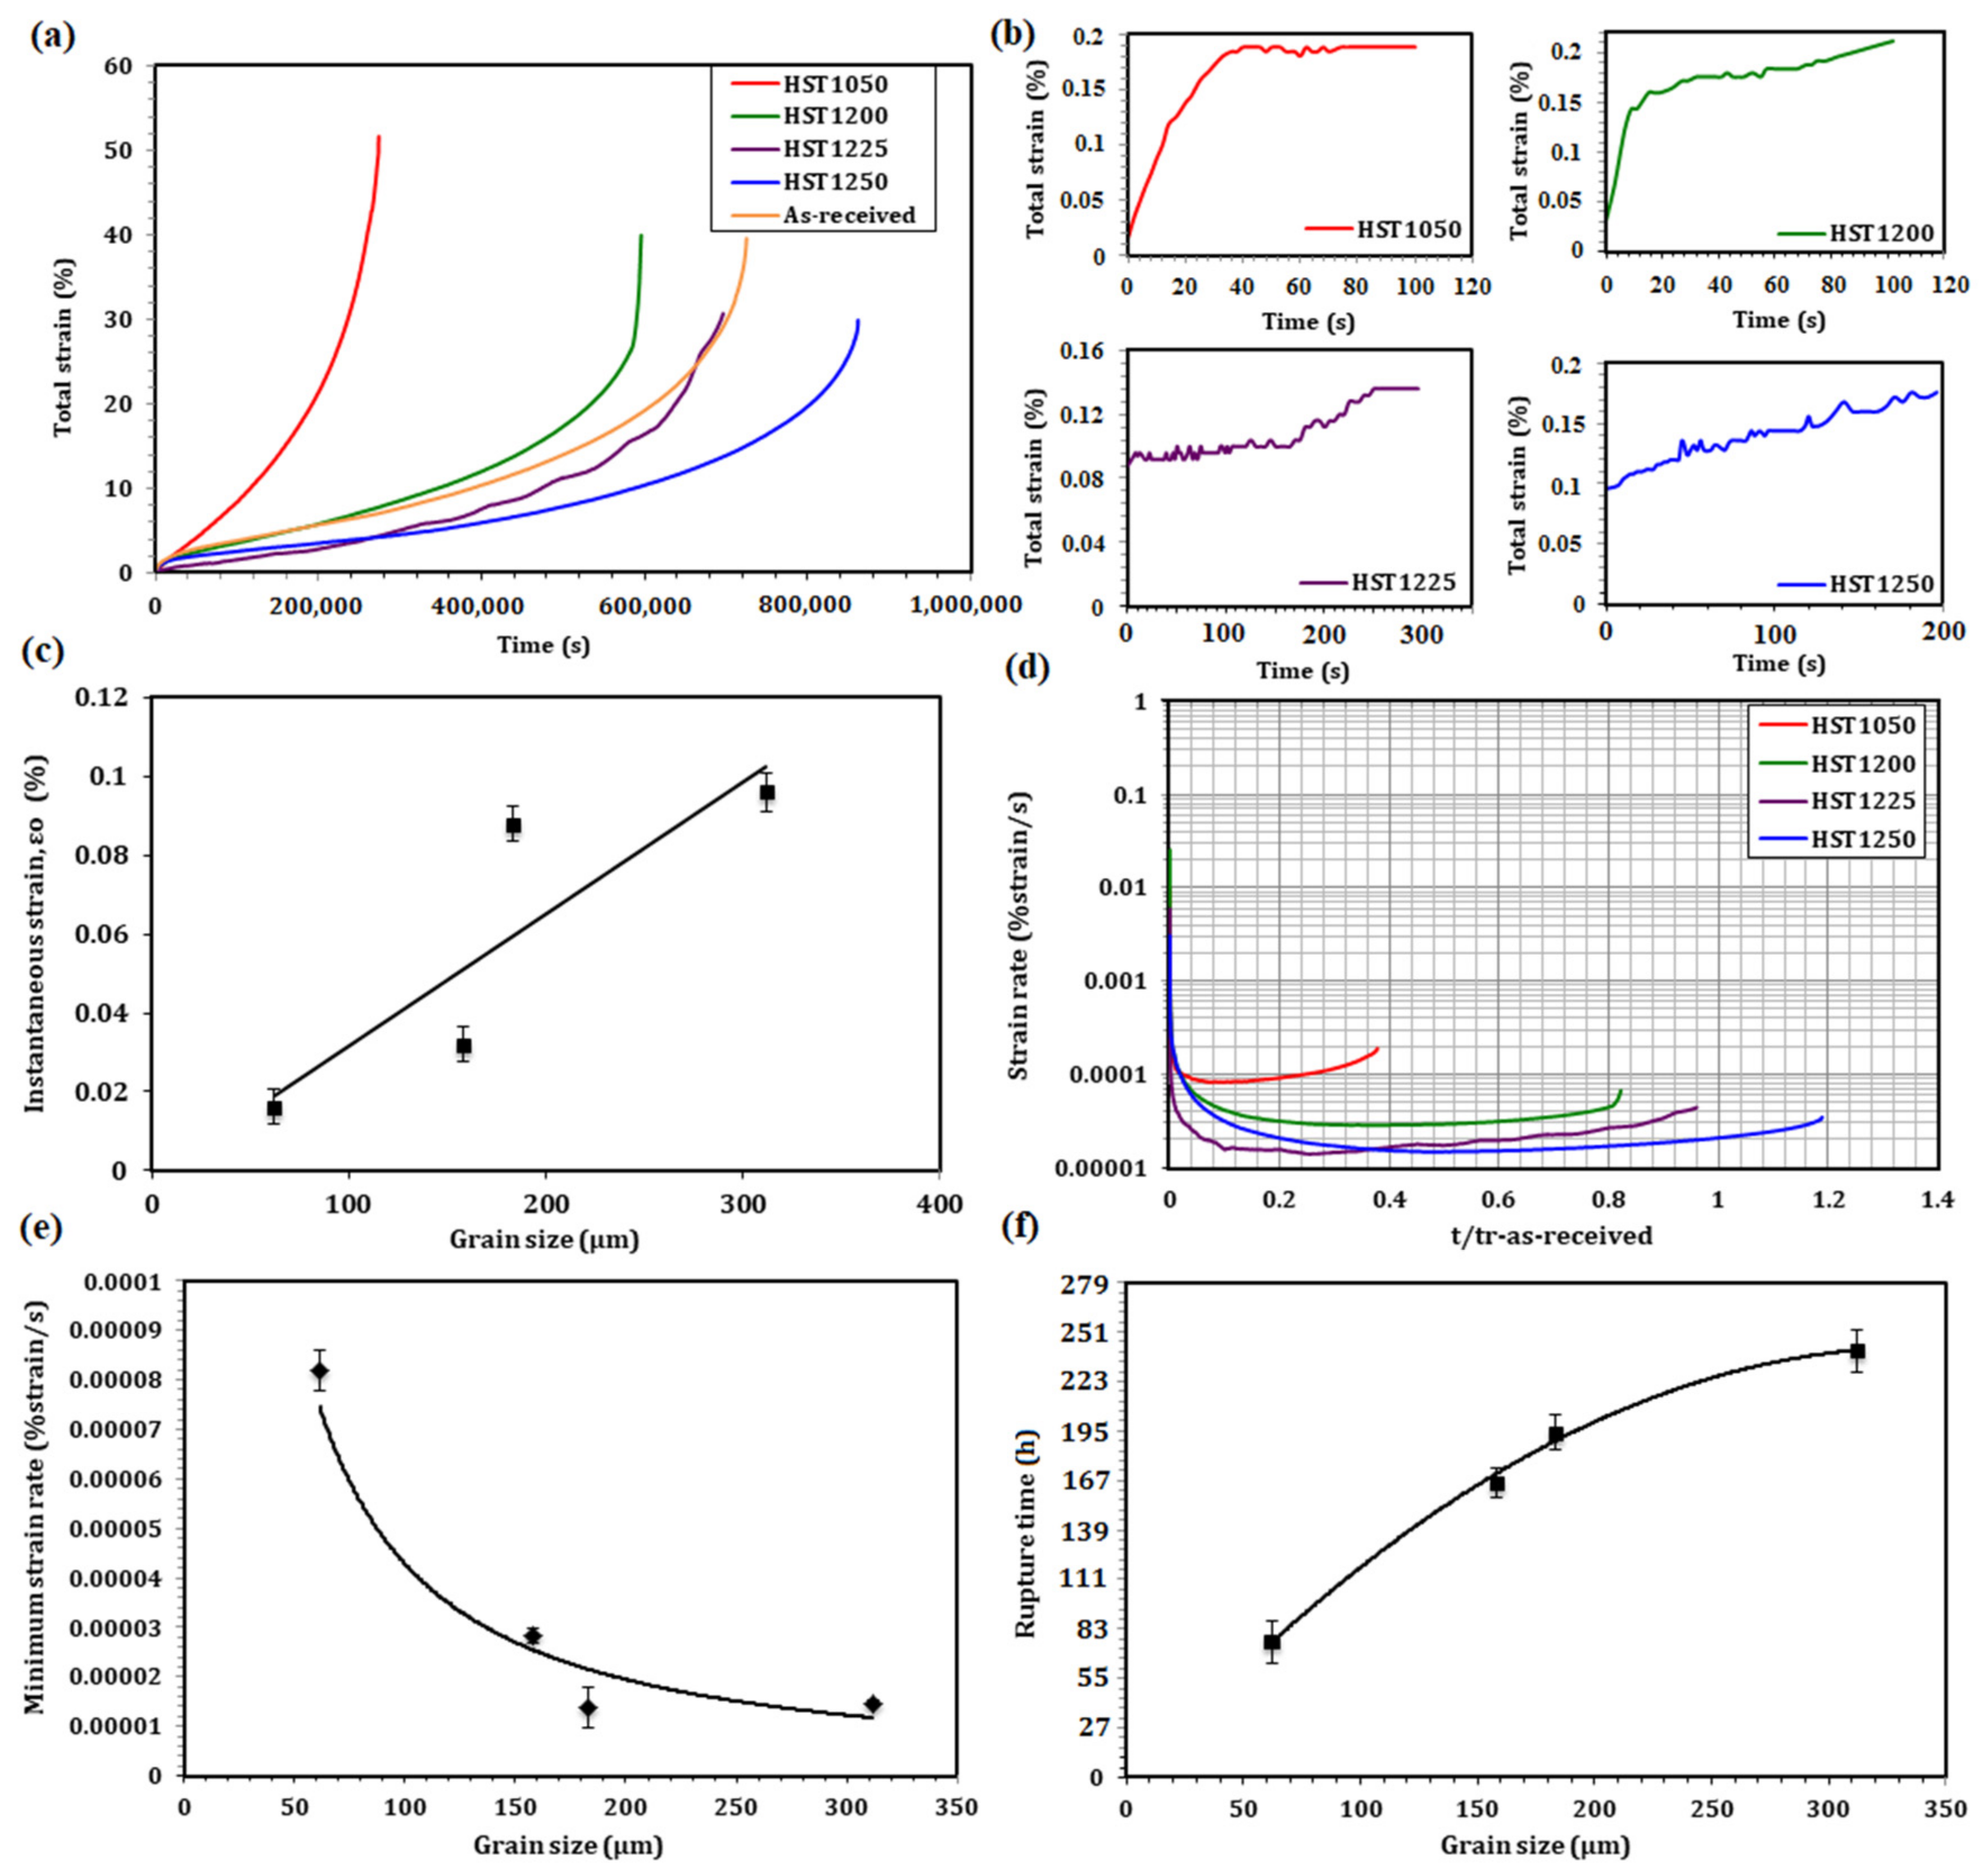
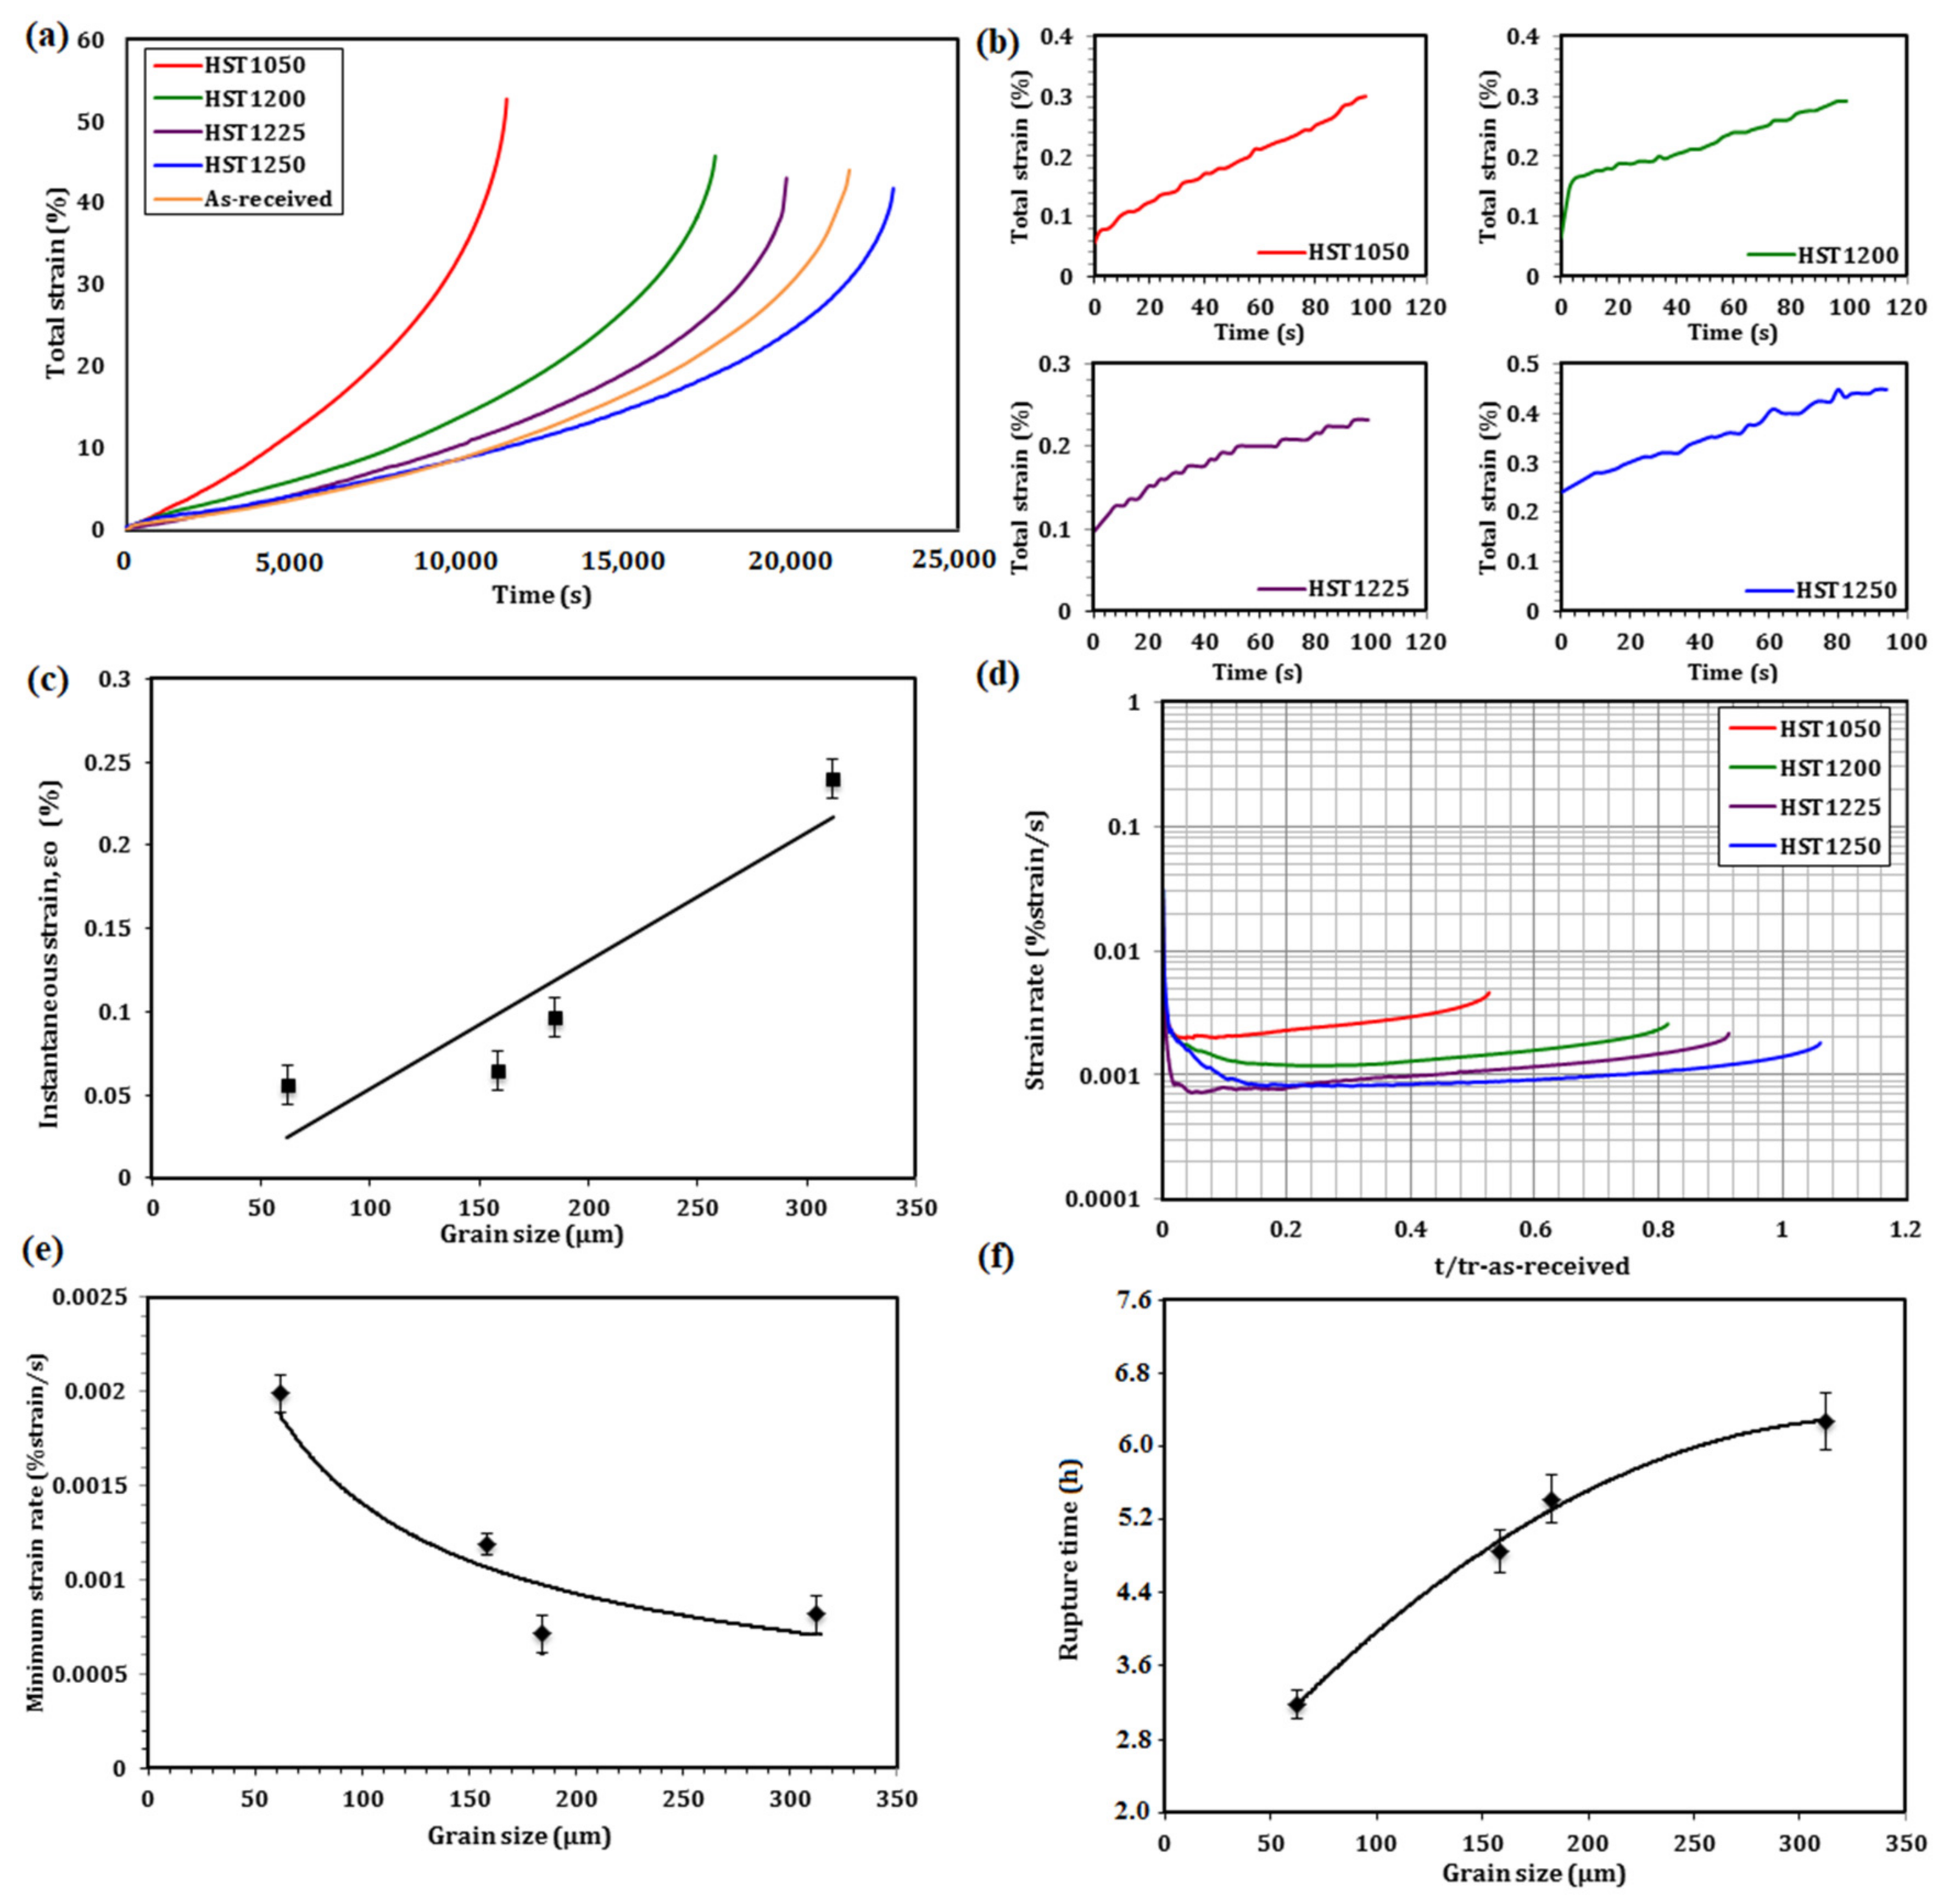
3.2. Creep Characteristic

Figure 3a–d illustrates the creep strain of heat-treated Fe-40Ni-24Cr alloy at a temperature 800 °C and initial stress of 100 MPa. The specimen heat-treated at 1200 °C, 1225 °C and 1250 °C showed longer secondary creep than the specimen heat-treated at 1050 °C. The specimen heat-treated at 1050 °C showed limited primary creep and immediately entered the secondary and tertiary creep stage, as shown in Figure 3a. The creep curves for four different grain sizes—62 μm (HST1050/heat-treated at 1050 °C), 158 μm (HST1200/heat-treated at 1200 °C), 183 μm (HST1225/heat-treated at 1225 °C) and 312 μm (HST1250/heat-treated at 1250 °C)—were evaluated in this research. At the primary stage, a sudden increase in creep strain value is referred to as instantaneous creep strain due to the sudden load application, as shown in Figure 3b,c. The specimen with the smallest grain size, heat-treated at 1050 °C, had the highest grain boundary per area and gave the smallest instantaneous value, 0.016% strain. This was followed by 0.032% strain for the specimen heat-treated at 1200 °C, 0.088% strain for the specimen heat-treated at 1225 °C and 0.096% strain for the specimen heat-treated at 1250 °C. The grain boundaries can retard the dislocation movement from the sudden stress application. Figure 3d shows the logarithmic scale plot of the strain rate for heat-treated Fe-40Ni-24Cr alloy. The graphs clearly show that the creep rate decreased to a minimum value before rapidly increasing at the end of the creep test.
The minimum value of the curves was known as the minimum steady-state creep rate. Figure 3e shows the minimum strain rate value versus grain size. The relationship between strain rate and grain size can be written as follows: y = 0.0081x−1.139, where y is grain size and x is minimum strain rate [49,50,51,52]. The minimum strain rate value decreased from grain size 62 to 183 μm and slightly increased from 183 to 312 μm. For the small grain size in the specimen range, 62 μm (heat-treated at 1050 °C) to 183 μm (heat-treated at 1225 °C), the increase of the minimum creep rate value with the decrease of grain size was due to the grain boundary sliding mechanism. Grain boundary sliding is a deformation mechanism of materials that includes the displacement of grains against each other. Grain boundary sliding is a mechanism that occurs in polycrystalline materials at a temperature 0.4 times and above the absolute melting temperature. This strain rate mechanism agreed with Garofalo’s model [49], which stated cavitation could form from grain boundary sliding and dislocation pile up at the grain boundaries and particles. Small grain size has more ratio of grain boundaries surface area per unit volume. These cause more cavitation to form at the grain boundaries in the smaller grain size specimens than the larger grain size specimens due to grain boundary sliding. Grain boundary sliding leads to cavitation and is often accompanied by a diffusion process. Grain boundary sliding can also cause cavitation at the particles located at the grain boundary. Due to the small grain size having more grain boundary surface area per unit volume, these caused the grain boundaries to react as dislocation sources. Dislocations pile up at the grain boundaries and form cavities at the boundaries. The cavity is often formed in more spherical rather than plate-like or lenticular shapes and tends to grow larger under the grain boundary sliding process.
For the large grain size in the specimen range, 183 μm (heat-treated at 1225 °C) to 312 μm (heat-treated at 1250 °C), the results show a slight increase in minimum strain rate with an increase in grain size dominant by the dislocation climb phenomenon. At high temperature and stress, dislocation climb controlled the power-law creep. Dislocation creeps (dislocation glide and dislocation climb) involve the vacancies or interstitial diffusion mechanism, and the dislocation glide movement overcomes the barrier by being thermally assisted where 10−5 < σ/G < 10−2 and T > 0.4Tm, as referred to in the deformation mechanism map. Dislocation climb is a dislocation motion mechanism. It allows an edge dislocation to move perpendicularly out of its lattice slip plane. The dislocation climb mechanism involves atom movement from the edge dislocation line to fill the vacancy. Smaller grain size has a greater ratio of grain boundaries surface area per unit volume; more grain boundaries react as barriers for dislocation mobility. When a dislocation is brought to a halt by an obstacle (precipitate) and barrier (grain boundary), the dislocation requires energy to overcome the obstacle and become mobile again [49,50,51,52]. Dislocation climb requires a high temperature for an atom to dislocate from its lattice. Due to the specimen heat-treated at 1225 °C having smaller grain size with more ratio of grain boundaries surface area per unit volume compared to specimen heat-treated at 1250 °C, the grain boundaries can retard the dislocation mobility, and more energy is required for the dislocations to overcome the barriers and continue to glide. Figure 3f shows the creep rupture time versus grain size. The creep rupture time for a grain size of 62 μm (heat-treated at 1050 °C) was 76 h, for 158 μm (heat-treated at 1200 °C) it was 166 h, for 183 μm (heat-treated at 1225 °C) it was 193 h and for 312 μm (heat-treated at 1250 °C) it was 239 h. The graph shows that the creep rupture time increases with grain size. The creep rupture time was affected by the steady-state creep rate results. As the steady-state creep rate decreases with grain size, the creep rupture time increases with the increase in the grain size.
Figure 4a illustrates the creep strain versus time curve of heat-treated Fe-40Ni-24Cr at temperature 900 °C and the initial stress of 100 MPa. All the creep curves show limited primary creep and immediately enter the secondary and tertiary creep stage due to high temperature and applied stress. The creep curves represented four different grain sizes—62 μm (HST1050/heat-treated at 1050 °C), 158 μm (HST1200/heat-treated at 1200 °C), 183 μm (HST1225/heat-treated at 1225 °C) and 312 μm (HST1250/heat-treated at 1250 °C)—which were evaluated in this research. A sudden jump in strain value due to the sudden application of load bar (stress) is referred to as instantaneous creep strain, as shown in Figure 4b,c. The specimen with the smallest grain size has the highest grain boundary per area. Due to grain boundaries that can retard the dislocation movement from the sudden stress application, the specimen heat-treated at 1050 °C with the smallest grain size had the lowest instantaneous value, 0.056% strain. This is followed by 0.064% strain for the specimen heat-treated at 1200 °C, 0.096% strain for the specimen heat-treated at 1225 °C and 0.24% strain for the specimen heat-treated at 1250 °C. Figure 4d shows the plot of the strain rate versus time for heat-treated Fe-40Ni-24Cr alloy. The graphs clearly showed that the creep rate decreased to a minimum steady-state value and later increased at the end of the creep test.
Figure 4e shows the minimum strain rate value at the secondary creep stage versus grain size. The minimum strain rate value for the specimen heat-treated at 1050 °C (62 μm) was 1.9914 × 10⁻³% strain/s, followed by the specimen heat-treated at 1200 °C (158 μm), which had 1.1890 × 10⁻³% strain; the specimen heat-treated at 1225 °C (183 μm) had 7.1875 × 10⁻⁴% strain and the specimen heat-treated at 1250 °C (312 μm) had strain rate of 8.2249 × 10⁻⁴%. The minimum strain rate value decreased from grain size 62 μm to 183 μm and slightly increased from 183 μm to 312 μm which showed the same high temperature creep mechanism result at temperature 800 °C. Figure 4f shows the creep rupture time of heat-treated Fe-40Ni-24Cr alloy crept at 900 °C and 100 MPa. The resulting trend shows the creep rupture time increase with grain size. The creep rupture time for the specimen heat-treated at 1050 °C (62 μm) is 3.2 h; for the specimen heat-treated at 1200 °C (158 μm) it is 4.9 h, followed by the specimen heat-treated at 1225 °C (183 μm), which is 5.5 h, and the specimen heat-treated at 1250 °C (312 μm), which is 6.4 h. The creep rupture time was affected by the steady-state creep rate results. As the steady-state creep rate decreases with grain size, the creep rupture time increases with the increase in grain size.

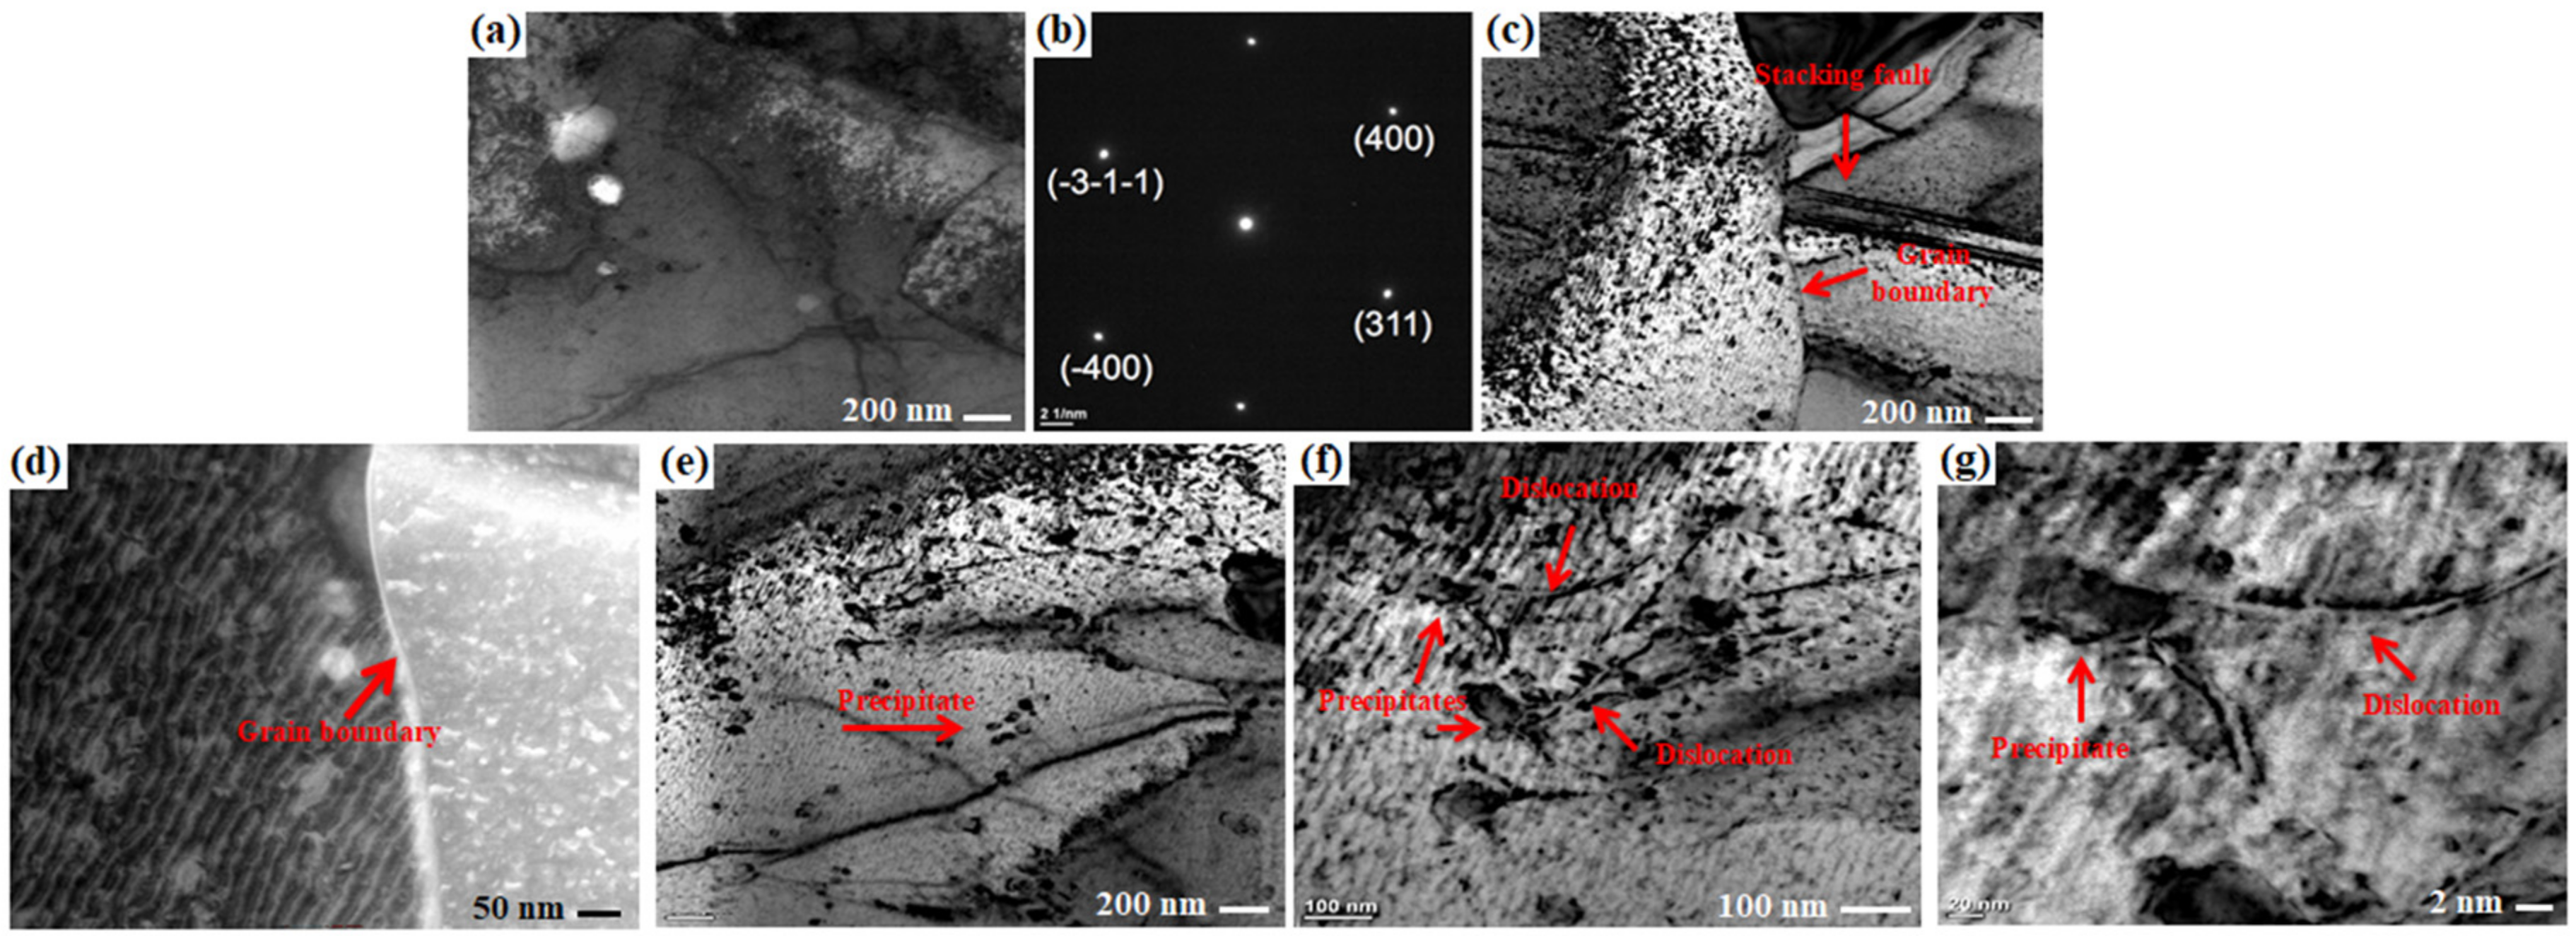
3.3. Microstructure Evolution during Creeping

The rupture surface of alloy Fe-40Ni-24Cr after undergoing a creep test is shown in Figure 5a–e. The rupture surface shows dimples characteristic of micro-void coalescence. The micro-void formed and coalesced to form a micro-crack. Figure 5a,b show only dimple rupture mode due to the small grain size. However, Figure 5c–e show a mix between intergranular and dimple rupture mode. A dimple type of rupture surface indicates a ductile rupture manner. Ductile rupture is characterized by a large amount of deformation calculated in the percentage of elongation. The percentage of elongation for the as-received specimen was 40%. The percentage of elongation for the heat-treated specimen was 51% for the specimen heat-treated at 1050 °C, 40% for the specimen heat-treated at 1200 °C, 31% for the specimen heat-treated at 1225 °C and 30% for the specimen heat-treated at 1250 °C, as shown in Figure 5f. The results show that the total elongation significantly decreased with an increase in grain size. The results are in agreement with the critical length criterion for intergranular creep rupture that Phan et al. [24] found to be applicable in Ni-Cr wrought alloy and 316 stainless steel. The grain size dependence of creep elongation is essentially due to the effect of grain size in the tertiary stage of the creep test. The tertiary creep stage involved the growth and inter-linkage of cracks and led to final rupture. In the fine grain (heat-treated at 1050 °C), there are a large number of triple junctions. A crack will form at the triple junction with low aspect ratio (length/width) compared to coarse grain size. By increasing the grain size (heat-treated at 1200 °C, 1225 °C and 1250 °C), the crack density decreased. The stress concentration at the crack tip is higher for coarse grain due to the aspect ratio for cracks increasing with an increase in the grain size. The cracks can therefore readily grow through the triple point boundaries and critical crack length is attained faster. This results in lower in ductility with increasing grain size. A large number of triple junctions in fine grain can limit the crack propagation.
The specimen heat-treated at 1200 °C was selected to undergo electron backscatter diffraction (EBSD) analysis to better understand the microstructure after undergoing a high temperature creep test. Figure 6 shows the EBSD results of the HST1200 specimen, which focused on the rupture necking area. Figure 6a shows the pattern quality (PQ) image. The PQ image generally showed a grayscale map because every point on the map is assigned a brightness based on the pattern quality for every point. They appeared similar to an SEM image. Grain boundaries were observed as dark linear features due to the low-quality pattern. The addition of grain coloring into the pattern quality map resulted in a rainbow-colored map, as shown in Figure 6b. Each color represents different grains. At the rupture boundary tip, recrystallized grains can clearly be observed. The specimen showed intergranular rupture mode along the recrystallized grains’ boundaries. Figure 6c shows the inverse pole figure (IPF) orientation map. For cubic phases, the full dark red, dark blue and dark green represent [001]γ, [111]γ and [101]γ axes directions, respectively, as shown in Figure 6c. Due to the recrystallized grains appearing as a new equiaxed grain that does not undergo deformation, recrystallized grains showed no color contrast within the recrystallized grains [12,31]. However, color contrast was shown in the grain due to the deformation that occurred during the creep test. Grain’s average misorientation (GAM) map is as shown in Figure 6d, which shows the average misorientation between the neighboring pair of measurement points within the grains. The misorientation angle was taken from 0° to 20°. The grains showed a high quantity of misorientation angle between 3° and 8°. However, recrystallized grain showed a high quantity at a lower misorientation angle, which is from 0° to 1°. The kernel average misorientation (KAM) map is a set of prescribed size points surrounding the interest scans point. A specific tolerance angle value from 0° to 3.5° was selected, and a 0.7° misorientation angle gave the highest KAM number count. The misorientation developed inhomogeneously due to the deformation. The KAM results also showed that the misorientation tended to be larger near the boundaries and decreased evidently towards the center of the grains, as shown in Figure 6e.
Figure 7 shows the TEM micrograph of the selected specimen (heat-treated at 1200 °C) after undergoing creep at 800 °C and 100 MPa. The analysis was focused on the rupture area (necking region) to investigate the rupture mode and how it occurred. Since the TEM analysis specimen was very small and about 15 μm × 15 μm in size, the result only represented the microstructure of recrystallized grain. The selected area diffraction (SAD) pattern of the grain (matrix) is shown in Figure 7a,b. From the spots indexing, the zone axis was determined as [0 1] (parallel to the electron beam). The stacking faults can be observed in Figure 7c. Stacking fault is a planar defect that characterizes the disordering of crystallographic planes. The stacking fault packets were formed during grain boundary migration, and can generate annealing twins [46,49]. The result showed no chromium-rich carbide precipitate distribution along the grain boundary (Figure 7d). Figure 7e shows only a few dislocation piles around the NbC precipitates. The identity of carbide precipitates was confirmed using EDX analysis. The TEM morphology of the dynamically recrystallized grain revealed that less dislocation could be observed. This is because the recrystallized grain was a newly reformed grain, which is free from dislocation [53,54,55]. Figure 7f,g show dislocation end at the interface of the precipitates and the matrix. Matrix distribution precipitates can retard the dislocation to glide through the grain and form microvoids at the grain boundaries.
Figure 8 shows the EBSD results of the selected specimen (heat-treated at 1200 °C) after undergoing a creep test at 800 °C and 100 MPa and interrupted at 110.7 h (to understand the high temperature creep mechanism at secondary stage). The analysis focused on the center area of the creep specimen. Figure 8a shows the pattern quality (PQ) image. PQ image generally showed a grayscale map because every point on the map is assigned the brightness based on the pattern quality for every point. Grain boundaries are referred to as low-quality pattern areas, and boundaries are observed as a dark linear feature. They appeared similar to the SEM image. The rainbow-colored map, as shown in Figure 8b was a pattern quality grain map. Each color represents different grains. The results show the grain microstructure with no recrystallization. The grains show less elongation due to the experiment being interrupted at the secondary stage of creep (110.7 h) with 12% elongation. The inverse pole figure (IPF) orientation map shows some minor color contrast within the grain due to the creep test. For cubic phases, the full dark red, dark blue, and dark green represent [001]γ, [111]γ and [101]γ axes directions, respectively, as shown in Figure 8c. The IPF map shows a random distribution of grain orientation and directions. The grain’s average misorientation (GAM) map is shown in Figure 8d. The GAM map is the average misorientation between the neighboring pair of measurement points within the grain. The misorientation angle was taken from 0° to 10°. The grains showed a large misorientation angle between 1° and 2°. The kernel average misorientation (KAM) map is a set of points of prescribed size surrounding the interest scans point. A specific tolerance angle value from 0° to 4.0° was selected, and a 0.8° misorientation angle gave the highest KAM number count. The misorientation developed inhomogeneously due to the deformation. The KAM result also showed that the misorientation tends to be larger near the boundaries and decreases evidently towards the center of the original grains, as shown in Figure 8e.
Figure 9 shows the TEM micrograph of the selected specimen (heat-treated at 1200 °C) after undergoing creep at 800 °C and 100 MPa and interrupted at 110.7 h. The TEM analysis focused on the center area of the creep specimen. The selected area diffraction (SAD) pattern of the grain (matrix) is shown in Figure 9a,b. From the spots indexing, the zone axis determined was [1 1 ¯ 0] direction (parallel to the electron beam). Figure 9 shows a random distribution of precipitates in the matrix. Precipitates that are uniformly distributed can retard the dislocations to glide through the grains and form microvoids at the grain boundaries. The TEM micrographs described the evolution of the dislocation structure during the creep test. A large number of dislocations were found in the matrix, and they were randomly distributed within the matrix. The dislocations piled up at the precipitates inducing the formation of a low-angle grain boundary (Figure 9c). Figure 9d shows some dislocations were pinned by the nano-precipitates. Straight segments dominated the dislocations’ character. The nano-scale precipitates were known to contribute to the precipitation strengthening. Sessile dislocation loops can be observed in Figure 9e. Discontinuous chains of chromium-rich (Cr23C6) carbide precipitates were found along the grain boundaries, as shown in Figure 9f. Cr23C6 carbides formed from the soluble carbon in matrix or the degeneration of the primary MC type of carbides during hot deformation, where M is titanium, niobium or tungsten, and tantalum [56]. These fine carbides can effectively pin at the grain boundaries and inhibit the formation of dynamic recrystallization. Figure 9g shows the block shape of Cr23C6 carbide particles at the grain boundary, which interact with dislocations and may lead to grain boundary serration. The selected area diffraction (SAD) pattern of the Cr23C6 particles located along the grain boundary and within the matrix is shown in Figure 9h–k. From the spot indexing, the zone axis for the grain boundary particle was determined as [0 1 1 ¯ ], while the zone axis for the matrix particle was [1 1 ¯ 0].
Figure 10a,b shows the FESEM analysis on Fe-40Ni-24Cr after undergoing creep test 800 °C and 100 MPa. Niobium carbide (NbC), niobium-titanium carbide ((Nb,Ti)C), titanium carbonitride (Ti(C,N)) and titanium nitride (TiN) precipitates were observed after creep test. They are insoluble at temperatures below the melting point. These precipitates tend to be located at the grain boundaries and austenitic matrix. These precipitates’ elemental composition was analyzed by EDX, as shown in Figure 10c–f. Spectrum 1 indicates the presence of NbC from the high atomic % of niobium and carbon. The cubical-shaped particle shown in Figure 10c was identified as TiN. Spectrum 2 (Figure 10d) shows the major atomic % in titanium and nitrogen elements. The irregular-shaped precipitates were identified as (Nb,Ti)C based on Spectrum 3 (Figure 10e). Spectrum 4 in Figure 10f shows high atomic % in titanium, carbon and nitrogen elements and indicates the presence of Ti(C,N) particles.
Besides (NbC), (Nb,Ti)C, Ti(C,N) and TiN precipitates, chromium-rich (Cr23C6) carbide precipitates also formed after high temperature creep. Due to the small size of the Cr23C6 precipitates (nanometer), they can only be detected using TEM analysis supported with EDX. Cr23C6 tend to precipitate along the grain boundaries and enhance the stress rupture properties of the material. The optimum distribution of Cr23C6 carbides existed as a discontinuous chain along the grain boundaries. The continuous thin strip Cr23C6 can accelerate the propagation of micro-cracks along the grain boundaries [57]. The carbides can hinder grain boundary sliding and migration during high temperature service. A block-shaped particle at the grain boundaries as shown in Figure 11a was identified as chromium rich (Cr23C6) carbides. EDX analysis spectrum 1 (Figure 11b) shows a high concentration of chromium element. Spectrum 2 in Figure 11c shows chromium-rich niobium carbide located in the matrix. Figure S6 shows the cross-sectional FESEM images of the recrystallized grains at the creep necking region. FESEM image and elemental mapping were as shown in Figure S7, presented in the Supplementary Materials.
Figure 12a shows EDX elemental mapping of selected specimens heat-treated at 1200 °C (heat-treated at 1200 °C) after undergoing a creep test at 800 °C and 100 MPa. Distribution of Cr23C6 along the grain boundaries can clearly be observed. Mapping results showed a random distribution of titanium (Ti) and niobium (Nb)-rich particles in the matrix. Figure 12b shows EDX elemental mapping of the selected specimen (heat-treated at 1200 °C) at the necking region. Mapping results also showed the distribution of Cr23C6 along the grain boundaries and Ti and Nb-rich particles in the matrix. A discontinuous chain of Cr23C6 carbides along the grain boundaries can clearly be observed in Figure 12c. Precipitation of Cr23C6 carbides can strengthen the grain boundaries and retard the dislocation movement and prevent grain boundary sliding and dynamic recrystallization [55]. Due to the carbide precipitates being harder and more brittle than the matrix of material, distribution along the grain boundaries affects the high temperature creep performance, ductility and strength. Continuous carbide films along the grain boundaries were not desired due to the continuous rupture paths causing brittleness. Cr23C6 carbides can precipitate as films, globules, platelets, lamellae and cells. Figure S8, presented in the Supplementary Materials, shows the XRD patterns of the samples after creep test at 800 °C and 100 MPa of stress. Figure S9, presented in the Supplementary Materials, shows the FESEM micrographs supported with EDX elemental mapping analysis of Fe-40Ni-24Cr alloy after undergoing a creep test at 900 °C. Figure S10 shows the rupture surface of alloy Fe-40Ni-24Cr after undergoing a creep test at 900 °C (presented in the Supplementary Materials).
Figure 13 shows the FESEM micrographs on Fe-40Ni-24Cr after undergoing a creep test at 900 °C; 100 MPa. TiN, NbC, Ti(C,N) and (Nb,Ti)C precipitates were observed after the creep test. They are insoluble at temperatures below the melting point. These precipitates tend to be located at the grain boundaries and austenitic matrix. The precipitates’ elemental composition was analyzed by EDX analysis. Square shaped precipitates were identified as TiN, as shown in EDX spectrum 1. The blocky precipitate was identified as NbC due to the high atomic % in Nb and C elements. EDX spectrum 3 indicated the presence of Ti(C,N) particles due to the high atomic % in Ti, C and N elements. EDX spectrum 4 was identified as (Nb,Ti)C precipitates. After the high- temperature test, chromium-rich carbide (Cr23C6) precipitates tend to form along the grain boundaries. Cr23C6 carbides can form by heat treatment or high-temperature service at a temperature between 760 °C and 982 °C. Cr23C6 carbides can form either from soluble carbon in the matrix or degeneration of primary MC type carbides, where M is titanium, niobium or tungsten, and tantalum [56]. Cr23C6 carbides can precipitate as films, globules, platelets, lamellae and cells. Continuous carbide films along the grain boundaries were not desired due to the continuous fracture paths, which would cause brittleness. The carbides can hinder grain boundary sliding and migration during high-temperature service [58,59,60]. Figure S11, presented in the Supplementary Materials, exhibits the X-ray diffraction patterns of the sample after undergoing a creep test at 900 °C and 100 MPa of stress.

4. Conclusions

In this study, the effect of heat treatment’s on the microstructure evolution and creep characteristic of Fe-40Ni-24Cr alloy was studied. Concerning Fe-40Ni-24Cr alloy, after heat treatment, 62 μm and 158 μm grain sizes are taken as fine-grain, whereas 183 μm and 312 μm grain size are coarse grain. The creep property for Fe-40Ni-24Cr alloy is improved by 51% with increasing temperature from 800 °C to 900 °C. Creep test at a temperature of 800 °C shows better creep properties compared to the test performed at temperature 900 °C. The minimum steady-state creep strain rate results for Fe-40Ni-24Cr at temperature 800 °C and 900 °C show 5% and 1% increase, respectively, with increased grain size. The microstructural evolution results also revealed that the grain boundaries acted simultaneously as dislocation sources and barriers for dislocation mobility. For small grain size alloy of 62 μm to 183 μm, the minimum creep rate increased with a decrease in grain size due to grain boundary sliding. The rupture morphology Fe-40Ni-24Cr alloys after creep test at 800 °C presented dimple ductile mode for fine grain alloys and mixed mode of intergranular and dimple rupture for coarse grains alloys. The rupture surface for Fe-40Ni-24Cr alloy undergoing creep at 900 °C presented dimple ductile mode. Creep test at high temperature caused chromium-rich carbides (Cr23C6) to precipitate along the grain boundaries in Fe-40Ni-24Cr alloy. The carbides can hinder grain boundary sliding and migration during high temperature creep service. Dynamic recrystallized grains are free from Cr23C6 carbides, and the rupture surface at the necking area showed intergranular rupture along the recrystallized grains’ boundaries. The TEM examination also exhibited the alloy’s dislocation substructure after mechanical assessment at high temperature and verified that dislocation climb over precipitates is the primary creep strain mechanism. This result indicates that the creep characteristic of Fe-40Ni-24Cr alloy is significantly dependent on microstructural change affected by the heat treatment regime.

Supplementary Materials

The following are available online at https://www.mdpi.com/article/10.3390/app11177951/s1, Figure S1 to Figure S11: Effect of Heat Treatment on Microstructure and Creep Behavior of Fe-40Ni-24Cr Alloy. Table S1: Effect of Heat Treatment on Microstructure and Creep Behavior of Fe-40Ni-24Cr Alloy.

Author Contributions

Writing—original draft preparation, methodology, formal analysis, M.M.; Conceptualization, supervision, formal analysis, writing—review and editing, E.H.; Conceptualization, writing—review and editing, H.R.B.-R.; Conceptualization, writing—review and editing, funding acquisition, F.B. All authors have read and agreed to the published version of the manuscript.

Funding

This research received no external funding.

Institutional Review Board Statement

Not applicable.

Informed Consent Statement

Not applicable.

Data Availability Statement

All data provided in the present manuscript are available to whom it may concern.

Acknowledgments

The authors would like to acknowledge the Universiti Teknologi Malaysia and Bruker Singapore Pte Ltd. for providing the EBSD facilities support.

Conflicts of Interest

The authors declare that they have no competing/financial conflict of interests in this paper.

References

  1. Wang, X.; Brünger, E.; Gottstein, G. The role of twinning during dynamic recrystallization in alloy 800H. Scr. Mater. 2002, 46, 875–880. [Google Scholar] [CrossRef]
  2. Chi, C.-Y.; Yu, H.-Y.; Dong, J.-X.; Liu, W.-Q.; Cheng, S.-C.; Liu, Z.-D.; Xie, X.-S. The precipitation strengthening behavior of Cu-rich phase in Nb contained advanced Fe–Cr–Ni type austenitic heat resistant steel for USC power plant application. Prog. Nat. Sci. 2012, 22, 175–185. [Google Scholar] [CrossRef] [Green Version]
  3. Tian, S.; Zhang, B.; Shu, D.; Wu, J.; Li, Q.; Jiang, C. Creep properties and deformation mechanism of the containing 4.5 Re/3.0 Ru single crystal nickel-based superalloy at high temperatures. Mater. Sci. Eng. A 2015, 643, 119–126. [Google Scholar] [CrossRef]
  4. Kim, W.-G.; Park, J.-Y.; Ekaputra, I.; Kim, S.-J.; Kim, M.-H.; Kim, Y.-W. Creep deformation and rupture behavior of Alloy. Eng. Fail. Anal. 2015, 58, 441–451. [Google Scholar] [CrossRef]
  5. Davies, C.; Dean, D.; Yatomi, M.; Nikbin, K. The influence of test duration and geometry on the creep crack initiation and growth behaviour of 316H steel. Mater. Sci. Eng. A 2009, 510, 202–206. [Google Scholar] [CrossRef] [Green Version]
  6. Chen, L.; Liaw, P.; Wang, H.; He, Y.; McDaniels, R.; Jiang, L.; Yang, B.; Klarstrom, D. Cyclic deformation behavior of HAYNES® HR-120® superalloy under low-cycle fatigue loading. Mech. Mater. 2004, 36, 85–98. [Google Scholar] [CrossRef]
  7. Parimin, N.; Hamzah, E. Influence of Solution Treatment Temperature on the Microstructure of Ni-based HR-120 Superalloy. IOP Conf. Ser. Mater. Sci. Eng. 2020, 957, 012003. [Google Scholar] [CrossRef]
  8. Kobayashi, S.; Hara, T. Effect of Different Precipitation Routes of Fe2Hf Laves Phase on the Creep Rate of 9Cr-Based Ferritic Alloys. Appl. Sci. 2021, 11, 2327. [Google Scholar] [CrossRef]
  9. Chen, X.-M.; Lin, Y.; Chen, M.-S.; Li, H.-B.; Wen, D.-X.; Zhang, J.-L.; He, M. Microstructural evolution of a nickel-based superalloy during hot deformation. Mater. Des. 2015, 77, 41–49. [Google Scholar] [CrossRef]
  10. Jiang, L.; Wang, H.; Liaw, P.K.; Brooks, C.R.; Chen, L.; Klarstrom, D.L. Temperature evolution and life prediction in fatigue of superalloys. Met. Mater. Trans. A 2004, 35, 839–848. [Google Scholar] [CrossRef]
  11. Wang, L.; Liu, Y.; Liang, J. Effect of Rejuvenation Heat Treatment on the Creep Property and Microstructural Evolution of a Ni-Base Superalloy. Appl. Sci. 2020, 10, 1187. [Google Scholar] [CrossRef] [Green Version]
  12. Mudang, M.; Hamzah, E.; Bakhsheshi-Rad, H.R.; Berto, F. Relationship between the microstructure and the heat treatment and creep behavior of Fe–33Ni–19Cr alloy. Fatigue Fract. Eng. Mater. Struct. 2021, 44, 1719–1738. [Google Scholar] [CrossRef]
  13. Zieliński, A.; Golański, G.; Sroka, M. Evolution of the microstructure and mechanical properties of HR3C austenitic stainless steel after ageing for up to 30,000 h at 650–750 °C. Mater. Sci. Eng. A 2020, 796, 139944. [Google Scholar] [CrossRef]
  14. Sroka, M.; Zieliński, A.; Śliwa, A.; Nabiałek, M.; Kania-Pifczyk, Z.; Vasková, I. The Effect of Long-Term Ageing on the Degradation of the Microstructure the Inconel 740h Alloy. Acta Phys. Pol. A 2020, 137, 355–360. [Google Scholar] [CrossRef]
  15. Hong, H.U.; Kim, I.S.; Choi, B.G.; Kim, M.Y.; Jo, C.Y. The effect of grain boundary serration on creep resistance in a wrought nickel-based superalloy. Materials science and engineering a-structural materials properties microstructure and processing. Mater. Sci. Eng. A 2009, 517, 125–131. [Google Scholar] [CrossRef]
  16. Tomaszewska, A.; Kierat, M.; Moskal, G.; Zieliński, A. Primary Structure and Physical Properties of New Superalloys Co-20Ni-10Al-5Mo-2Nb on Cobalt Matrix. Acta Phys. Pol. A 2020, 138, 129–132. [Google Scholar] [CrossRef]
  17. Dudziak, T.; Deodeshmukh, V.; Backert, L.; Sobczak, N.; Witkowska, M.; Ratuszek, W.; Chruściel, K.; Zieliński, A.; Sobczak, J.; Bruzda, G. Phase investigations under steam oxidation process at 800° C for 1000 h of advanced steels and Ni-based alloys. Oxid. Metals 2017, 87, 139–158. [Google Scholar] [CrossRef] [Green Version]
  18. Kim, C.S. Dynamic Coercivity of Tempered Ferritic Steel Subjected to Creep-Fatigue for Nondestructive Evaluation by Reversible Permeability. Appl. Sci. 2020, 10, 1809. [Google Scholar] [CrossRef] [Green Version]
  19. Osigwe, E.; Gad-Briggs, A.; Nikolaidis, T.; Jafari, S.; Sethi, B.; Pilidis, P. Thermodynamic Performance and Creep Life Assessment Comparing Hydrogen- and Jet-Fueled Turbofan Aero Engine. Appl. Sci. 2021, 11, 3873. [Google Scholar] [CrossRef]
  20. Tian, Z.; Zhang, C.; Wang, D.; Liu, W.; Fang, X.; Wellmann, D.; Zhao, Y.; Tian, Y. A Review on Laser Powder Bed Fusion of Inconel 625 Nickel-Based Alloy. Appl. Sci. 2019, 10, 81. [Google Scholar] [CrossRef] [Green Version]
  21. Ding, Q.; Bei, H.; Yao, X.; Zhao, X.; Wei, X.; Wang, J.; Zhang, Z. Temperature effects on deformation substructures and mechanisms of a Ni-based single crystal superalloy. Appl. Mater. Today 2021, 23, 101061. [Google Scholar] [CrossRef]
  22. Ma, L.; Hu, S.; Shen, J.; Han, J. Effects of annealing temperature on microstructure, mechanical properties and corrosion resistance of 30% Cr super ferritic stainless steel. Mater. Lett. 2016, 184, 204–207. [Google Scholar] [CrossRef]
  23. Matysiak, H.; Zagorska, M.; Andersson, J.; Balkowiec, A.; Cygan, R.; Rasinski, M.; Pisarek, M.; Andrzejczuk, M.; Kubiak, K.; Kurzydlowski, K.J. Microstructure of Haynes® 282® Superalloy after Vacuum Induction Melting and Investment Casting of Thin-Walled Components. Materials 2013, 6, 5016–5037. [Google Scholar] [CrossRef] [Green Version]
  24. Phan, T.; Zhang, X.; Li, Y.; Oskay, C. Microscale modeling of creep deformation and rupture in Nickel-based superalloy IN 617 at high temperature. Mech. Mater. 2017, 114, 215–227. [Google Scholar] [CrossRef]
  25. Ridhwan, J.; Hamzah, E.; Selamat, M.; Zulfattah, Z.; Hafidzal, M. Effect of Aging Treatment on the Microstructures and Hardness of Fe-Ni-Cr Superalloy. Int. J. Automot. Mech. Eng. 2013, 8, 1430–1441. [Google Scholar] [CrossRef]
  26. Shi, L.; Yu, J.J.; Cui, C.Y.; Sun, X.F. The creep deformation behavior of a single-crystal Co–Al–W-base superalloy at 900 °C. Mater. Sci. Eng. A 2015, 635, 50–58. [Google Scholar] [CrossRef]
  27. Soula, A.; Renollet, Y.; Boivin, D.; Pouchou, J.-L.; Locq, D.; Caron, P.; Bréchet, Y. Analysis of high-temperature creep deformation in a polycrystalline nickel-base superalloy. Mater. Sci. Eng. A 2009, 510, 301–306. [Google Scholar] [CrossRef]
  28. Sun, F.; Gu, Y.F.; Yan, J.B.; Zhong, Z.H.; Yuyama, M. Dislocation motion in a Ni-Fe-based superalloy during creep–rupture beyond 700 °C. Mater. Lett. 2015, 159, 241–244. [Google Scholar] [CrossRef]
  29. He, Y.H.; Chen, L.J.; Liaw, P.K.; McDaniels, R.L.; Brooks, C.R.; Seeley, R.R.; Klarstrom, D.L. Low-cycle fatigue behavior of HAYNES® HR-120® alloy. Int. J. Fatigue 2002, 24, 931–942. [Google Scholar] [CrossRef]
  30. Sherby, O.D.; Taleff, E.M. Influence of grain size, solute atoms and second-phase particles on creep behavior of polycrystalline solids. Mater. Sci. Eng. A 2002, 322, 89–99. [Google Scholar] [CrossRef]
  31. Koyanagi, Y.; Takabayashi, H.; Ueta, S.; Cho, K.; Yasuda, H. Creep behavior of Ni–38Cr-3.8Al alloy with lamellar structure formed by discontinuous precipitation. Mater. Sci. Eng. A 2019, 766, 138333. [Google Scholar] [CrossRef]
  32. Wu, J.; Li, C.; Wu, Y.; Huang, Y.; Xia, X.; Liu, Y. Creep behaviors of multiphase Ni3Al-based intermetallic alloy after 1000 °C-1000 h long-term aging at intermediate temperatures. Mater. Sci. Eng. A 2020, 790, 139701. [Google Scholar] [CrossRef]
  33. Kaplanskii, Y.; Loginov, P.; Korotitskiy, A.; Bychkova, M.; Levashov, E. Influence of heat treatment on the structure evolution and creep deformation behavior of a precipitation hardened B2-(Ni, Fe)Al alloy. Mater. Sci. Eng. A 2020, 786, 139451. [Google Scholar] [CrossRef]
  34. Facco, A.; Couvrat, M.; Magne, D.; Roussel, M.; Guillet, A.; Pareige, C. Microstructure influence on creep properties of heat-resistant austenitic alloys with high aluminum content. Mater. Sci. Eng. A 2020, 783, 139276. [Google Scholar] [CrossRef]
  35. Voicu, R.; Lacaze, J.; Andrieu, E.; Poquillon, D.; Furtado, J. Creep and tensile behaviour of austenitic Fe–Cr–Ni stainless steels. Mater. Sci. Eng. A 2009, 510, 185–189. [Google Scholar] [CrossRef] [Green Version]
  36. Blum, W.; Eisenlohr, P. Dislocation mechanics of creep. Mater. Sci. Eng. A 2009, 510, 7–13. [Google Scholar] [CrossRef]
  37. Liang, Z.; Guo, T.; Deng, S.; Zhao, Q. High-temperature corrosion of an Fe–Ni-based alloy HR6W under various conditions at 750 °C and 810 °C: Effect of the temperature, water vapor, simulated ash and SO2. Mater. Chem. Phys. 2020, 256, 123670. [Google Scholar] [CrossRef]
  38. Akhiani, H.; Nezakat, M.; Sanayei, M.; Szpunar, J. The effect of thermo-mechanical processing on grain boundary character distribution in Incoloy 800H/HT. Mater. Sci. Eng. A 2015, 626, 51–60. [Google Scholar] [CrossRef]
  39. Dehmolaei, R.; Shamanian, M.; Kermanpur, A. Microstructural changes and mechanical properties of Incoloy 800 after 15 years service. Mater. Charact. 2009, 60, 246–250. [Google Scholar] [CrossRef]
  40. Zurek, J.; Young, D.J.; Essuman, E.; Hänsel, M.; Penkalla, H.J.; Niewolak, L.; Quadakkers, W.J. Growth and adherence of chromia based surface scales on Ni-base alloys in high- and low-pO2 gases. Mater. Sci. Eng. A 2008, 477, 259–270. [Google Scholar] [CrossRef]
  41. Kassner, E.M.; Smith, K. Low temperature creep plasticity. J. Mater. Res. Technol. 2014, 3, 280–288. [Google Scholar] [CrossRef] [Green Version]
  42. Chen, J.; Huo, Q.; Chen, J.; Wu, Y.; Li, Q.; Xiao, C.; Hui, X. Tailoring the creep properties of second-generation Ni-based single crystal superalloys by composition optimization of Mo, W and Ti. Mater. Sci. Eng. A 2020, 799, 140163. [Google Scholar] [CrossRef]
  43. Dutta, R.S. Corrosion aspects of Ni–Cr–Fe based and Ni–Cu based steam generator tube materials. J. Nucl. Mater. 2009, 393, 343–349. [Google Scholar] [CrossRef]
  44. Tan, L.; Rakotojaona, L.; Allen, T.R.; Nanstad, R.K.; Busby, J.T. Microstructure optimization of austenitic Alloy 800H (Fe–21Cr–32Ni). Mater. Sci. Eng. A 2011, 528, 2755–2761. [Google Scholar] [CrossRef]
  45. Sayiram, G.; Arivazhagan, N. Microstructural characterization of dissimilar welds between Incoloy 800H and 321 Austenitic Stainless Steel. Mater. Charact. 2015, 102, 180–188. [Google Scholar] [CrossRef]
  46. Cao, Y.; Di, H.; Misra, R. The impact of aging pre-treatment on the hot deformation behavior of alloy 800H at 750 °C. J. Nucl. Mater. 2014, 452, 77–86. [Google Scholar] [CrossRef]
  47. Cao, Y.; Di, H.; Zhang, J.; Zhang, J.; Ma, T. Research on dynamic recrystallization behavior of incoloy 800H. Acta Met. Sin. 2012, 48, 1175. [Google Scholar] [CrossRef]
  48. Cao, Y.; Di, H.; Zhang, J.; Zhang, J.; Ma, T.; Misra, R. An electron backscattered diffraction study on the dynamic recrystallization behavior of a nickel–chromium alloy (800H) during hot deformation. Mater. Sci. Eng. A 2013, 585, 71–85. [Google Scholar] [CrossRef]
  49. Liu, D.; Pons, D.J. Crack propagation mechanisms for creep fatigue: A consolidated explanation of fundamental behaviours from initiation to failure. Metals 2018, 8, 623. [Google Scholar] [CrossRef] [Green Version]
  50. Guo, Y.; Collins, D.; Tarleton, E.; Hofmann, F.; Tischler, J.; Liu, W.; Xu, R.; Wilkinson, A.; Britton, B. Measurements of stress fields near a grain boundary: Exploring blocked arrays of dislocations in 3D. Acta Mater. 2015, 96, 229–236. [Google Scholar] [CrossRef] [Green Version]
  51. Wang, Z.; Beyerlein, I.; Lesar, R. Slip band formation and mobile dislocation density generation in high rate deformation of single fcc crystals. Philos. Mag. 2008, 88, 1321–1343. [Google Scholar] [CrossRef]
  52. Horst, O.; Adler, D.; Git, P.; Wang, H.; Streitberger, J.; Holtkamp, M.; Jöns, N.; Singer, R.; Körner, C.; Eggeler, G. Exploring the fundamentals of Ni-based superalloy single crystal (SX) alloy design: Chemical composition vs. microstructure. Mater. Des. 2020, 195, 108976. [Google Scholar] [CrossRef]
  53. Lee, Y.S.; Kim, D.W.; Lee, D.Y.; Ryu, W.S. Effect of grain size on creep properties of type 316LN stainless steel. Met. Mater. Int. 2001, 7, 107–114. [Google Scholar] [CrossRef]
  54. Song, W.; Wang, X.; Li, J.; Meng, J.; Duan, T.; Yang, Y.; Liu, J.; Pei, W.; Zhou, Y.; Sun, X. The formation and evolution of NiAl phase in a fourth generation nickel-based single crystal superalloy. J. Alloys Compd. 2020, 848, 156584. [Google Scholar] [CrossRef]
  55. Cao, Y.; Di, H.; Zhang, J.; Yang, Y. Dynamic behavior and microstructural evolution during moderate to high strain rate hot deformation of a Fe–Ni–Cr alloy (alloy 800H). J. Nucl. Mater. 2015, 456, 133–141. [Google Scholar] [CrossRef]
  56. Dehmolaei, R.; Shamanian, M.; Kermanpur, A. Microstructural characterization of dissimilar welds between alloy 800 and HP heat-resistant steel. Mater. Charact. 2008, 59, 1447–1454. [Google Scholar] [CrossRef]
  57. Ou, M.; Hao, X.; Ma, Y.; Liu, R.; Zhang, L.; Liu, K. Effect of carbon on the microstructure and stress rupture properties of a new Ni-Cr-W-Fe alloy for advanced ultra-supercritical power plants. J. Alloys Compd. 2018, 732, 107–115. [Google Scholar] [CrossRef]
  58. Naalchian, M.; Kasiri-Asgarani, M.; Shamanian, M.; Bakhtiari, R.; Bakhsheshi-Rad, H.R. Effect of substrate’s heat treatment on microstructure and mechanical properties TLP bonding of dissimilar X-45/FSX-414 cobalt based superalloys. Met. Mater. Int. 2020, 1–12. [Google Scholar] [CrossRef]
  59. Naalchian, M.; Kasiri-Asgarani, M.; Shamanian, M.; Bakhtiari, R.; Bakhsheshi-Rad, H.R. Comprehensive microstructural investigation during dissimilar transient liquid phase bonding cobalt-based superalloys by BNi-9 amorphous interlayer foil. J. Mater. Res. Technol. 2021, 13, 2144–2160. [Google Scholar] [CrossRef]
  60. Naalchian, M.; Kasiri-Asgarani, M.; Shamanian, M.; Bakhtiari, R.; Bakhsheshi-Rad, H.R.; Berto, F.; Das, O. Phase formation during heating of amorphous nickel-based BNi-3 for joining of dissimilar cobalt-based superalloys. Materials 2021, 14, 4600. [Google Scholar] [CrossRef]
Figure 1. Optical images of Fe-40Ni-24Cr (a) As-received and heat-treated samples at different temperatures: (b) 950 °C, (c) 1000 °C, (d) 1050 °C, (e) 1100 °C, (f) 1150 °C, (g) 1200 °C and (h) 1250 °C. Note: Annealing twin (red arrows) and precipitates (yellow arrows).
Applsci 11 07951 g001
Figure 2. (a,b) FESEM images of as-received Fe-40Ni-24Cr alloy and (cf) EDX spectrum of as-received Fe-40Ni-24Cr alloy.
Applsci 11 07951 g002
Figure 3. Creep curve of heat-treated Fe-40Ni-24Cr at temperature 800 °C and initial stress of 100 MPa; (a) total strain versus time (b) instantaneous creep strain and (c) instantaneous strain versus grain size and (d) strain rate versus time (e) minimum creep rate versus grain size. (f) Creep rupture time versus grain size of heat-treated Fe-40Ni-24Cr after creep test at 800 °C and 100 MPa.
Applsci 11 07951 g003
Figure 4. Creep curve of heat-treated Fe-40Ni-24Cr at temperature 900 °C and initial stress of 100 MPa; (a) total strain versus time; (b) instantaneous creep strain; (c) instantaneous strain versus grain size; (d) strain rate versus time; (e) minimum creep rate versus grain size (f); creep rupture time versus grain size of the heat-treated alloy.
Applsci 11 07951 g004
Figure 5. SEM images of rupture surface of Fe-40Ni-24Cr after creep test at 800 °C and 100 MPa; (a) as-received and heat-treated sample at different temperatures: (b) 1050 °C, (c) 1200 °C, (d) 1225 °C and (e) 1250 °C; (f) percentage of elongation versus grain size of heat-treated alloy.
Applsci 11 07951 g005
Figure 6. EBSD analysis on specimen (heat-treated at 1200 °C) after creep test at 800 °C under 100 MPa stresses; (a) pattern quality (PQ) map, (b) pattern quality grains map, (c) inverse pole figure (IPF) map, (d) grain average misorientation (GAM) map and (e) kernel average misorientation (KAM) map.
Applsci 11 07951 g006
Figure 7. (a) TEM image of the selected area diffraction (SAD), (b) SAD area, (c) recrystallized grain boundary, (d) recrystallized grain boundary (higher resolution), (e) precipitation in the matrix, (f) dislocation pile-up around the precipitates and (g) dislocation pile-up at the precipitate (higher resolution) of the heat-treated sample at 1200 °C after creep test at 800 °C under 100 MPa stresses.
Applsci 11 07951 g007
Figure 8. EBSD analysis on the heat-treated sample at 1200 °C underwent a creep test at 800 °C under 100 MPa stresses; (a) pattern quality (PQ) map, (b) pattern quality grains map, (c) inverse pole figure (IPF) map, (d) grain average misorientation (GAM) map and (e) kernel average misorientation (KAM) map.
Applsci 11 07951 g008
Figure 9. (a) TEM image of the selected area diffraction (SAD), (b) SAD area, (c) dislocations and precipitates distribution, (d,e) dislocation at the precipitates, (f) carbide precipitate along grain boundary, (g) dislocation pile up at the carbide precipitate, (h) TEM image of the SAD on grain boundary carbide, (i) SAD area on grain boundary carbide, (j) TEM image of the SAD on matrix precipitate and (k) SAD area on matrix precipitate of the heat-treated sample at 1200 °C after creep test at 800 °C under 100 MPa stresses.
Applsci 11 07951 g009
Figure 10. (a,b) FESEM images and and corresponding EDX spectra of the alloy from (c) spectrum 1, (d) spectrum 2, (e) spectrum 3 and (f) spectrum 4 of Fe-40Ni-24Cr creep test at 800 °C under 100 MPa stresses.
Applsci 11 07951 g010
Figure 11. (a) TEM images and corresponding EDX spectra of the alloy from (b) spectrum 1 and (c) spectrum 2 of the heat-treated alloy at 1200 °C after creep test at 800 °C under 100 MPa stresses.
Applsci 11 07951 g011
Figure 12. FESEM micrographs with EDX elemental mapping analysis of heat-treated sample at 1200 °C after creep test at 800 °C under 100 MPa stresses, (a) inner grains, (b) necking region and (c) grain boundary precipitates.
Applsci 11 07951 g012
Figure 13. (ad) FESEM images and corresponding EDX analysis for spectrums 1, 2 and 3 of Fe-40Ni-24Cr after creep test at 900 °C under 100 MPa stresses.
Applsci 11 07951 g013
Publisher’s Note: MDPI stays neutral with regard to jurisdictional claims in published maps and institutional affiliations.

