Article

Experimental Investigation of the Reynolds Shear Stress Exceedance Rate for the Injury and Disorientation Biocriteria Boundary in the Pool-Orifice and Vertical Slot Type Fishways

Faculty of Civil Engineering, University of Zagreb, Fra Andrije Kacica Miosica 26, 10000 Zagreb, Croatia
*
Author to whom correspondence should be addressed.
Appl. Sci. 2021, 11(16), 7708; https://doi.org/10.3390/app11167708
Submission received: 23 July 2021 / Revised: 17 August 2021 / Accepted: 18 August 2021 / Published: 21 August 2021

Abstract

:
Fragmentation of rivers has a negative impact on river’s ecological status which can be improved by the construction of fishways next to obstacles in rivers that prevent a free migration. Flow field characteristics are key factors in the design process of hydraulically efficient fishways—flow and turbulence patterns in a functional fishway allow fish to enter, progress through and exit with minimum time/energy expenditure. The aim of this paper is an experimental study of the flow field characteristics measured in the physical fishway model with the goal of providing information on the Reynold’s shear stress distribution that would facilitate their design in accordance with the environmental requirements. The focus of the research was on the nominally hydraulically efficient con-figuration pool-type fishways—pool-orifice and vertical slot. Fishway geometry was varied for bottom slope (7.5%, 10% and 12.5%), pool length (45 cm, 60 cm and 90 cm) and orifice size (8 × 8 cm, 10 × 10 cm and 12 × 12 cm) in a model scaled 1:3 to the prototype. Since Reynold’s shear stress has been identified as the main turbulent parameter affecting fish swimming performance and behavior, it is used as the basis for the analyses. The velocity data were collected with Vectrino ADV and processed in all three planes—streamwise, horizontal and vertical. Reynold’s shear stress data were analyzed according to the injury (>50 N/m2) and disorientation (>30 N/m2) biocriteria boundaries defined in the literature. The percentage of the flow field exceeding the boundaries were analyzed depending on the fishway geometry. The results obtained in this research suggest that the critical design parameter is the orifice size for the pool-orifice fishways and the pool length for the VS fishway. The Reynold’s shear stress is generally the highest in the bottom layer for pool-orifice fishways and the surface layer for vertical slot fishways.

1. Introduction

Physical alterations of rivers, e.g., river training works, water regime alterations or water abstractions, are the main source of hydromorphological pressures in rivers [1], among which large European rivers fall into those that are strongly affected [2]. Hydromorphological pressures result in the fragmentation of rivers, i.e., reducing sediment transport and disabling migratory species to travel along the river course, which in turn has a negative impact on the river’s ecological status [3], as sometimes the needs of fish populations cannot be met within a single habitat [4]. Free-flowing rivers that support the ecosystem processes and biodiversity are rare: the flow regime of 77% of large rivers around the globe is disrupted by barriers [5,6,7]. According to the WISE-WFD database, more than 60% of European rivers have altered habitats and a less than good ecological status [8]. In the Mediterranean basin, 63% of threatened freshwater fish species have been negatively impacted by existing hydropower infrastructure, with the largest number of threatened species identified in Turkey (86), followed by Greece (48) and Croatia (38) [9].
The river ecosystem status can be improved and in-stream connectivity partially restored by the construction of fishways next to obstacles in rivers that prevent a free migration [10]. A fishway is a low-head hydraulic structure that is hydraulically designed according to the needs of prevailing species in the ecosystem in such a way that flow conditions allow both upstream and downstream migration for a design range of flow conditions. The most distinctive classification of a fishway is technical and nature-like, with the former being an artificial channel with the most effective spatial footprint which allows hydraulic conditions for fish migration, and the latter simulating natural flow conditions utilizing a lower slope, a wider corridor and eco-friendly materials [11]. Common features of the technical fishway is a layout that consists of a series of pools formed by cross-walls on equidistant spacing positioned on a sloped bottom (Figure 1). This way the total difference between head- and tail-water level of the obstacle is reduced into a series of pools with smaller drops, providing favorable hydraulic conditions for fish migration [12]. Cross-walls used for dividing the pools can be designed with slots, weirs, orifices, notches, or a combination for connecting the successive pools in order to achieve the desired velocity, turbulence intensity, or energy dissipation. Technical fishways can be further classified into pool-type (pool-weir, pool-orifice, pool-notch, and vertical slot), Denil, and culvert fishways [13], with modifications for each of them being proposed to compensate for fish species that use a different mode of migration (e.g., [14,15]).
Flow field characteristics are key factors in the design process of hydraulically efficient fishways—flow and turbulence patterns in functional fishways allows fish to enter, progress through, and exit with minimum time/energy expenditure. Turbulent flow kinematics has been shown to have a direct impact on fish behavior, which can be beneficial or detrimental, depending on the specific features of the flow environment. Turbulence can constrict fish locomotion when the size of the vortex and the fish body are similar [16,17], reduce fish static hydrodynamic stability [18,19], or confuse the fish during migration and increase the fish fatigue [20]. On the other hand, several studies have shown that fish can benefit from turbulence, e.g., capture energy from vortices to propel themselves upstream [21,22], or use it as a stimulus for selection of the trajectory through the fishway [23,24]. Design of the fishway will provide optimum migrating conditions for target fish species, which will be limiting or even unsuitable for some others species.

1.1. State-of-the-Art Review

Experimental research has shown that the hydraulic conditions are the limiting factor for fishes passing through a fishway, as more energy input from fish is needed for swimming through turbulent flows around the obstacle in comparison to uniform flow. As a general guideline, the required turbulence level in fishways can be quantified through the volumetric energy dissipation rate. It presents a turbulence level averaged out over the entire pool, and thus cannot reveal the detail flow conditions that are distinct for the main flow jet and recirculating zone (e.g., [25,26]). The energy is mostly dissipated in the recirculating zones formed along the sidewalls and behind the cross-walls, which provide a resting area for fish before transiting in the next pool [27,28], while jet zones are a limiting factor for the overall passage of the fish, often represented through critical swimming speed [29]. Marriner et al. [30] found that the volumetric energy dissipation rate in a turning pool was reduced to half of the one in the adjacent regular pool, while the maximum turbulent kinetic energy remained the same in both instances. Turbulence, therefore, needs to be inspected at a finer level, for which localized variables are used (in most cases turbulent kinetic energy, turbulence intensity and Reynold’s shear stress) that are considered to be the most influential on fish swimming behavior. Silva et al. [17] investigated the swimming behavior of 140 adult Iberian barbel of two sizes in an experimental pool-type fishway with three submerged orifice arrangements. They established a negative correlation of fish transit time and fish energy expenditure to Reynold’s shear stress, identifying it as the most influential hydraulic variable on fish behavior. Reynold’s shear stress and eddy size are most dependent on the fishway pool geometric design. Branco et al. [31] studied the behavior of two fish species in a full-scale experimental pool-type fishway under two different plunging and streaming flow regimes. The results showed the differences in Reynold’s shear stress pattern between the two regimes, indicating that fish have limited their exposure to high Reynold’s shear stress to a minimum; thus, both species were more effective in migrating through the fishway during the streaming flow.
Li et al. [32] conducted research into the flow field in a baffled fishway using a 3D numerical model. Based on the calculated turbulent kinetic energy, they have concluded that flow conditions in a fishway with the type H baffles are more favorable than in a fishway with type L baffles in terms of turbulent kinetic energy, energy dissipation rate and vorticity. The flow velocity, turbulent kinetic energy and volumetric energy dissipation rate were all found to be correlated with the bed slope. An et al. [33] conducted research in a numerical 3D model and an equivalent physical model to evaluate the hydraulic field in three different baffle designs of a vertical slot fishway. They concluded that the low (2.6%) slope fishway with the long ‘L’-shaped baffle has the most fish-friendly flow environment from the velocity and turbulent kinetic energy perspective. Quarranta et al. [34] investigated turbulent flow field in a vertical slot fishway on two typical designs with the constant bottom slope of 5%. Using the numerical model results, they evaluated TKE and RSS in comparison with the data available in the literature. They concluded that both designs meet the hydraulic requirements, with significant differences in the TKE.
Bombač et al. [35] used the data acquired from field measurements to validate the 2D numerical model of the vertical slot fishway. They showed that turbulent kinetic energy was significantly larger in the top half of the flow profile. The research of Guo et al. [36] on the experimental weir-type fishway showed that longitudinal turbulence intensity in the surface layer (in the main flow area) was larger than that in the lower, as well as the variation in Reynold’s shear stress. Turbulence increased slightly with a 50% increase of the flow rate through the fishway. Yagci [37] has investigated the flow velocity field in pool-weir fishways with an orifice and notch using a physical model. He observed the highest turbulence between two main flow layers—over the notch and through the orifice. Normalized turbulent kinetic energy values were highest in the orifice jet zone and lowest in the recirculation zone (<25%).
Fuentes-Pérez et al. [12] analyzed the performance of RANS k-ε and LES-Smagorinsky turbulence models in a 3D numerical model of a vertical slot fishway using OpenFOAM. They compared the results with data acquired from a scaled laboratory model for two flow scenarios and found that the model accurately simulated the velocity spatial distribution, while it overestimated or underestimated the turbulent kinetic energy and Reynold’s stress. Duguay et al. [38] came to a similar conclusion, comparing numerical results for flow in the pool-weir fishway obtained from OpenFOAM and FLOW-3D, and validated with in situ ADV measurements. Both models accurately predicted velocity magnitudes, while they significantly underpredicted turbulent kinetic energy levels. They found that models also could not reproduce the finer features of the flow, indicating that turbulence in the fishways might need to be validated using physical model data rather than focusing exclusively on numerical models [39].
Technical fishways are often considered for space-constricted locations or in regulated streams that are already channelized, e.g., in urban areas of Europe. Pool-weir fishways are the most hydraulically effective technical fishway [40], having advantages over other types of technical fishways in their operability over a wider range of flow conditions and a passage of broad fish species [26]. Consequently, they are the most utilized type of fishway, followed by pool-orifice, vertical slot, and Denil-type fishways [41]. They are most useful for small streams because they require the smallest flow rate of all the fishways (a smaller flow rate can be compensated with a lower headloss between the pools, thus resulting in more pools and a longer fishway). The main advantage of the pool-orifice fishway is the absence of energy carryover from one pool to another, where energy dissipation takes place in the pool’s recirculation zone that serves as a fish resting area [42] with velocities, turbulence kinetic energy, and volumetric dissipated power lower than in a vertical slot fishway [43]. In the vertical slot fishway, pools are created using baffles that divide cross-walls, allowing fish passage at any depth and thus giving the possibility of migration for more diverse species. The advantage of vertical slot-type fishways is the capability of allowing the fish passage across the entire flow depth, thus being less sensitive to flow oscillations, while their disadvantage is their need for a high flow rate for the migration of larger fish [44]. The main difference between the pool-orifice and vertical slot fishways is the energy dissipation rate: in the pool-orifice fishway, the energy dissipation rate is linearly correlated to the increase in the flow rate, while in the vertical slot fishway, the energy dissipation rate increases with the fishway bottom slope under constant flow rate [45].

1.2. Aim of the Paper

Motivation for the research presented in this paper is the low effectiveness of the existing fishways, primarily in Europe [46]. In order to improve the design of new fishways and optimize the existing ones, hydraulic environment needs to be described by relevant variables and its dependency on the fishway geometry needs to be quantified. Fishways are often found to be ineffective for species with different morphological and ecological characteristics [31], and data acquired from hydraulic environment can be used in studies focusing on flow-fish interactions to evaluate fish behavior in response to hydraulic conditions and define turbulence at a scale relative to fish size [47]. River fragmentation analyses are mostly focused on the larger structures, such as hydropower dams [48], often overlooking smaller structures that make up the majority of barriers in the European rivers—68% out of more than 1.2 million barriers are structures less than 2 m high [49].
Research focused on the fishway hydraulics, specifically in terms of turbulence, is needed to provide a base for numerical simulations and functional design to build upon. In this paper is presented the results of the experimental study conducted on two types of pool-type fishways that are considered to be nominally hydraulically efficient: pool-orifice and vertical slot. The aim of this paper is to investigate the hydraulic environment of the three-dimensional flow and turbulence measured in the physical fishway model with the goal of providing information on the Reynold’s shear stress distribution that would facilitate their design in accordance with biocriteria boundaries defined in the literature.
The paper is organized as follows. Section 1 (Introduction) provides insights into the research problem, presents the current state of the art from the literature review and formulates the aim of the research; Section 1 (Methodology) is devoted to the methodology framework—description of the experimental setup, data acquiring, data processing and data analyses; Section 3 (Results) presents the results of the Reynold’s shear stresses for each fishway configuration; Section 4 (Discussion) synthesizes the common Reynold’s shear stresses features of the fishway configurations that can be correlated with fishway geometry; and Section 5 (Conclusions) summarizes the main outcomes of the research.

2. Methodology

The methodological approach selected for this research was derived from standardized hydrodynamic metrics found in the state-of-the-art review on fishway hydraulics with an emphasis on the results from biological studies. In the state-of-the-art research, various turbulence descriptors were considered (e.g., turbulent kinetic energy, turbulent intensity, Reynold’s shear stress), out of which Reynold’s shear stress has been identified as the main turbulent parameter affecting fish swimming performance and behavior [17,50]. The Reynold’s shear stress can be used as an indicator of the turbulence strength related to fish because velocity fluctuations exchange momentum between adjacent layers of fluid around fish body, acting as a force restricting fish movement. Therefore, Reynold’s shear stress has been selected as the descriptive variable of turbulent flow field in this research. Flow in the fishway is three-dimensional due to the influence of the cross-walls and slots on the formation of the main flow jet and recirculation zones. Reynold’s shear stresses can be calculated for all three planes—streamwise (τuw), horizontal (τuv), and vertical (τvw), according to the following expressions:
τ u w = ρ u w ¯ ,
τ u v = ρ u v ¯ ,
τ v w = ρ v w ¯ ,
where: ρ = water density (1000 kg/m3), u′ = fluctuation of the streamwise velocity component u [m/s], v′ = fluctuation of the spanwise velocity component v [m/s], w′ = fluctuation of the vertical velocity component w [m/s].
Shear stress and turbulence levels in natural rivers where fish reside for the majority of time are small in comparison to those in hydraulic structures. Odeh et al. [51] summarized estimates of shear stresses in natural streams available from the literature and concluded that most shear stress data were below 30 N/m2, while during flash floods shear stress levels increase to 50 N/m2. Their study has established two generalized biocriteria boundaries defined for 10-min exposure to an average turbulence under following Reynold’s shear stresses:
  • Injury boundary—medium turbulence condition (>50 N/m2) that can induce minor injury to some species, but does not incur significant mortality over 48 h post-exposure period;
  • Disorientation boundary—low turbulence condition (>30 N/m2) that may cause a startle response that would likely put the fish at risk of predation or other hazards.
The impact of the Reynold’s shear stress on the fish migration is dependent on the fish body orientation; Silva et al. [52] and Santos et al. [53] found that the horizontal component of Reynold’s shear stress has the greatest effect on the fish, regardless of their size. In both studies it was found that fish for most of the time dwelled in the areas with Reynold’s shear stress <60 N/m2. Quaranta et al. [34] concluded that the fishway configurations they investigated were very favorable for fish, because in more than 90% of the pool area, the Reynold’s shear stress values were lower than 60 N/m2. In this research, Odeh et al. biocriteria were adopted because they provide distinctive values between fish injury and the disorientation boundary.

2.1. Experimental Setup

Data obtained for this research are collected from the series of flow simulations on the physical fishway model built in the Department of Hydroscience and Engineering laboratory under the University of Zagreb. Experimental setup included an adaptive fishway geometry adjusted for two technical fishway types (pool-orifice and vertical slot fishway) in order to simulate flow conditions under varying flow boundary conditions, bottom slope, pool length and dimension of the orifices (for the pool-orifice type) or slots (for vertical slot type). Fishway geometry was designed according to the physical design standards [54,55] and state-of-the-art literature [20,56,57,58]. Both fishway types considered in this research have been built with a matching geometry: bottom slope, pool width, and pool length. The simulations were made with three different bottom slopes (7.5%, 10%, and 12.5%), three different pool lengths (45 cm, 60 cm, and 90 cm) and a constant pool width (45 cm). For a pool-orifice-type fishway, three different orifice dimensions (8 cm × 8 cm, 10 cm × 10 cm, 12 cm × 12 cm) were tested in an offset configuration, alternating positions in the cross-walls from side to side in the pools. Orifice size was selected using Lariniers [44] guidelines for migratory salmonids and cyprinids, considering their widespread population in Croatian rivers [59]. Taking into account all geometry variations, 27 different physical model setups combining the bottom slope, pool length, and orifice size were investigated. For a vertical slot fishway, 9 different physical model setups were investigated, combining the bottom slope and pool length. Vertical slots were aligned along the right-hand side of the fishway, formed by an L-shaped baffle protruding from the cross-wall into the upstream pool.
The fishway physical model was built in the flume according to the schematic below (Figure 2) in an 18 m long, 0.9 m wide, and 0.9 m deep recirculating hydraulic flume with a rectangular cross-section. The working section of the flume is 13 m long, 0.9 m wide, and 0.7 m deep (Figure 3). Flow rate in the flume is controlled by a frequency-regulated pump which has a maximum capacity of ~30 l/s, while a hinged flap gate controls the water level at the flume outlet. A flow rectification system was built on the flume inlet to streamflow the jet from the pump into the working section of the flume. The fishway physical model was built in a 1:3 scale to the prototype, according to the Froud similarity principle [60]. The fishway model was built with at least three pools for the tests, depending on the pool length: a head pool that is receiving the water from an upstream reservoir, at least one typical pool for the measurements and a tail pool. Velocity measurements were collected in the typical pool of each configuration, positioned in the middle section of the fishway where the hydraulic balance was attained, unaffected by the upstream and downstream boundary conditions. For the fishway configurations with pool lengths of 45 cm and 60 cm, the third pool from the upstream was selected as the representative, while the second pool from the upstream was selected for the configuration with a pool length of 90 cm.

2.2. Flow Velocity Measurement Technique

Three-dimensional velocity and depth measurement data were collected on a structured raster of the measurement points, defined with constant spacing of 7 cm between the points across the width, and 9 cm along the pool, replicated from the comparable studies (e.g., [32,35]). Depending on the fishway configuration (i.e., pool length), the structured raster consisted of 35, 49 and 70 measurement points for the pool length of 45 cm, 60 cm, and 90 cm, respectively [61]. Measurement points overlap for different pool lengths to preserve the similarity and ensure a comparability of flow field characteristics for different model configurations (Figure 4). A raster of measurement points was mirrored on three depth planes parallel to the fishway bottom: surface plane (A), middle plane (B), and bottom plane (C).
Raw three-dimensional flow velocity data were collected using Nortek’s Vectrino acoustic Doppler velocimeter (ADV) mounted on a mobile cart, supported on the flume walls in such a way that it can be positioned on pre-set measurement locations [60]. Flow velocity measurements were collected with a 25 Hz sampling frequency, recorded over 3 min duration. The recording time was selected to obtain the statistical significance for the measured velocity fluctuation, consistent with the state of the art (e.g., [12,53,62]). Raw velocities collected by the ADV contain spikes resulting from the Doppler noise and signal transport from and to the device during data acquisition. In order to filter out the unwanted spikes from the record, raw data needs to be processed using a correlation coefficient and a signal-to-noise ratio as quality control variables. Correlation coefficient and signal-to-noise ratio of the measured raw data were within the limits reported in the literature [63,64]. Flow velocity data were filtered by the Velocity Signal Analyser [65] using the Phase-Space Thresholding method [66,67]. From the raw time series, less than 30% of the data were filtered out, which is under the limitations for Reynold’s stress calculation [64]. Reynold’s stress calculation was done in the MATLAB environment, for which a separate algorithm was developed.

3. Results

The influence of turbulence in the fishway is analyzed through 3D scatterplots of mutual dependence between calculated values of Reynold’s shear stress (RSS) for all three planes, streamwise (τuw), horizontal (τuv), and vertical (τvw). The results are given separately for each fishway configuration, combining the bottom slope (labelled i075, i100, and i125) and pool length (labelled l45, l60 and l90), while the orifice sizes pertaining to them are grouped together. The line of agreement between Reynold’s shear stresses on all planes (1:1:1) is shown as a reference on the scatterplots. The legend key for symbols used in all graphical representations is coded as follows: results associated with measurement planes A, B, and C are represented by squares, circles, and triangles, respectively; results associated with orifice sizes 8 × 8 cm, 10 × 10 cm, 12 × 12 cm (labelled o8, o10, and o12) and vertical slot are represented by a blue, green, red, and grey color, respectively. The aim of the analyses was to determine the percentage of the flow field exceeding the injury boundary and disorientation boundary within the typical fishway pool for all tested configurations.
The general flow pattern in the pools is influenced by the pool geometry and orifice/slot arrangement. In the pool-orifice (PO) type fishway, the plunging flow through the inlet orifice forms a jet parallel to the pool sidewall which, once it reaches the downstream cross-wall, is deflected towards the outlet orifice. In the rest of the pool between the main flow jet and the opposite sidewall, a considerable vortex is formed by the recirculating flow throughout the pool depth. In the vertical slot (VS) fishway, the streaming flow through the inlet slot forms a jet parallel to the pool sidewall until it exits through the outlet slot. Baffle geometry protruding from the sidewall opposite to the cross-wall forces the main flow jet to deflect from the sidewall into the pool, creating a recirculation region of low velocity on both sides of the jet. The recirculating zone within the pool is far greater than the one next to the sidewall.
A fishway with the steepest bottom slope and shortest pool length (i125l45, Figure 5) is the most economical fishway, since it requires the least space for construction. For all fishway configurations, there is a visible pattern of a prevailing streamwise RSS component, in comparison to horizontal and vertical. Measured values of τuw are on average +76% and +60% higher than concurrent τuv and τvw, respectively, at the same measurement point for all orifice sizes in the PO fishway. Differences between RSS components in corresponding VS fishways are more notable, with τuw being +86% and +82% higher than concurrent τuv and τvw, respectively. There is no visible pattern of values for which τuv and τvw are higher than τuw across the measured range, other than, in the PO fishway, values in the C plane are prevailing amongst those deviating from the established correlation. The same pattern is visible for the VS fishway, where τuv and τvw are higher than τuw in a range τuw < 20 N/m2. Concurrent values of τuv and τvw are approximately of the same stress range, with differences between them ranging from −6% to −13% in the PO fishway and −2% in the VS fishway, with the τvw component being higher in all cases (τuv < τvw). The lowest RSS values are concentrated in the A plane for all PO fishways, not exceeding 24 N/m2 on average, while the largest RSS values are concentrated in the C plane for all PO fishways, above 20 N/m2 on average for all orifices, with a maximum value of 42 N/m2 for τuw under the largest orifice. For the VS fishway, RSS values are uniform across the entire flow depth, with values of 32 N/m2, 17 N/m2 and 18 N/m2 for τuw, τuv and τvw, respectively. All fishway configurations are characterized with the highest RSS values for o12 orifices, and the lowest for the o8 orifice, with VS fishway values comparable to the ones from the PO fishway with an o12 orifice.
A fishway with the increased pool length and the same bottom slope (i125l60, Figure 6) is characterized by a larger variation in the RSS data across all RSS planes. The same pattern of prevailing streamwise RSS components, in comparison to horizontal and vertical, is determined: τuw is higher by +69% and +90% on average, respectively. Differences between the RSS components in corresponding VS fishways are more notable, with τuw twice to concurrent τuv and τvw, +102% and +105% on average. In both PO and VS fishways, values of RSS for the C plane prevail amongst those deviating from the established correlation. Concurrent values of τuv and τvw are approximately of the same stress range, with differences between them ranging from +1% to +44% in the PO fishway (τuv > τvw) and −1% in the VS fishway (τuv < τvw). There is no visible pattern of values for which τuv and τvw are higher than τuw across the measured range, other than, in the pool-orifice fishway, values in the C plane prevail amongst those deviating from the established correlation, as observed for the previous configuration. The lowest RSS values are concentrated in the A plane for all PO fishways, not exceeding 23 N/m2 on average, while the largest RSS values are concentrated in the C plane for all PO fishways, above 16 N/m2 on average for all orifices, with a maximum value of 53 N/m2 for the τuw under the largest orifice. For the VS fishway, RSS values are uniform across the entire flow depth, with values of 49 N/m2, 24 N/m2 and 24 N/m2 for τuw, τuv and τvw, respectively. All fishway configurations are characterized with the highest RSS values for o12 orifices, and the lowest for the o8 orifice, with VS fishway values comparable to the ones from the PO fishway with an o10 orifice.
A fishway that combines the steepest bottom slope and the longest pool length (i125l90, Figure 7) has an advantage over the previous configurations in the large pool area which has the potential to accommodate the resting area for passing fish. In contrast, a steep bottom slope over a longer pool length results in a relatively large height difference between the upstream and downstream pool bottom elevation that must be compensated for with a higher flow depth at the downstream boundary condition in order to sustain the design flow depth at the upper side of the pool. A longer pool has resulted in a larger recirculation area of lower velocities, which contributes to a decrease in the Reynold’s shear stress across all configurations. On average, the RSS for an orifice size of o10 is lower than i125l45 and i125l60 by −7% and −19%, respectively, and for o12 orifices, −1% and −9%, respectively. For the smallest orifices there is no distinct reduction in RSS with pool length increase. The same pattern of prevailing streamwise RSS components, in comparison to the horizontal and vertical components, is determined in the same way as for the shorter pool length, with τuw higher by +73% and +59% on average, respectively. Differences between RSS components in corresponding VS fishways are almost identical, at +79% and +62% on average. Concurrent values of τuv and τvw are approximately of the same stress range, with differences between them ranging from −2% to −20% in PO fishways and −9% in VS fishways (τuv < τvw). The lowest RSS values are concentrated in the A plane for PO fishways with o10 and o12 orifices, but with smaller differences to other planes in comparison to previous configurations. For the o8 orifice, the lowest RSS values are in the B and C plane, not exceeding 14 N/m2 on average. The largest RSS values are concentrated in the A plane for PO fishways with an o8 orifice above 19 N/m2 on average, while the maximum value of 37 N/m2 is observed for the τuw in the C plane under the largest orifice. For VS fishways, RSS values are highest for the A plane (35 N/m2), and are reduced towards the C plane (21 N/m2). All fishway configurations are characterized with the highest RSS values for o12 orifices, and the lowest for o8 orifices, with VS fishway values higher than all PO fishways. For this configuration, in the vertical slot, fishway values of RSS for the C plane are significantly lower in comparison with the other 2 planes.
A reduction in the bottom slope in the shortest fishway (i100l45, Figure 8) and the smallest orifice results in a reduction in the average RSS values in both A and B planes of −36% and −25%, respectively, while for the plane C there is no significant difference compared to i125l45. A similar trend is visible for the middle orifice size—a reduction in the average RSS values in planes A and B for −11% and −23% and no significant change on plane C. The largest orifice has a somewhat different trend: an increase in the average RSS values in planes A and B of +12% and +6% and no significant change in plane C. For VS, fishway increase of the RSS values is uniform at +15% across all planes. The RSS τuw component is higher in comparison to concurrent τuv and τvw by +63% and +54% on average for all orifice sizes. Differences between RSS components in corresponding VS fishways are almost identical to the i125l45, at +88% and +86% on average. Concurrent values of τuv and τvw are approximately of the same stress range, with differences between them ranging from −9% to −13% in a PO fishway and −1% in the VS fishway (τuv < τvw). The lowest RSS values are concentrated in the A plane for all fishways, increasing towards the C plane. Lowest RSS values are in the A plane, not exceeding 10 N/m2 for o8 and o10 orifices, and not exceeding 20 N/m2 for o12 orifices on average. The largest RSS values are concentrated in the C plane, exceeding 20 N/m2 for all fishways, with values in the PO fishway being o12 and the VS fishway approaching the injury boundary (>47 N/m2).
The middle VS fishway, regarding both the bottom slope and the pool length (i100l60, Figure 9), presents the second most unfavorable RSS environment of all the analyzed configurations (after i075l60), with an average value of RSS 59 N/m2, 34 N/m2 and 31 N/m2 for τuw, τuv and τvw components, respectively. RSS distribution for the VS fishway is uniform across the entire flow depth. Pool length has a significant influence on the RSS in the VS fishway: compared to i100l45, all three RSS components are increased on average by +59%. On the other hand, the influence of the larger pool in the PO fishway in comparison to i100l45 is negligible, with a difference in the RSS values <10% for all orifice sizes. The most notable influence of pool length is observed for o8, with average RSS values reduced by −30%. The same pattern of the prevailing RSS τuw component, in comparison to τuv and τvw, is observed, with τuw higher by +64% and +52% on average, respectively. Differences between RSS components in corresponding VS fishways are +76% and +90% on average. A reduction in the slope, while retaining the same pool length in the VS fishway, also results in an increase in the RSS across the flow depth, in comparison to i125l60 τuw, τuv, and τvw components are increased by +20%, +38%, and +29%. The same slope reduction in the PO fishway has an opposite effect—a reduction in RSS for all planes and orifice sizes: smallest for o8 (−6%), and equal for o10 and o12 (−14%). RSS values are the lowest on plane A, and increase towards plane C for all PO fishways, while in the VS fishway, RSS values are similar for all planes (<7% difference). RSS values in the PO fishways are exceeding 30 N/m2 on average only for o12 orifices and plane C (32 N/m2), and on all planes in the VS fishway (<45 N/m2).
Fishway with the longest pool among the middle bottom slope (i100l90, Figure 10) does not differ significantly in the RSS distribution when compared to the shorter pool of the same bottom slope (i100l60) or the same pool length with a steeper slope (i125l90). Average difference in RSS values compared to i100l60 is +18%, −5%, and +13% for PO fishways with o8, o10, and o12 orifices, respectively, and +8% in the VS fishway. Average difference in RSS values compared to i125l90 is −14%, +1%, and +8% for PO fishways with o8, o10, and o12 orifices, respectively, and +15% in the VS fishway. The same pattern of the prevailing τuw RSS component, in comparison to τuv and τvw is observed, with τuw higher by +64% and +63% on average, respectively. Differences between RSS components in corresponding VS fishways are +104% and +75% on average. RSS values are lowest on plane A, and increase towards plane C for all PO fishways, while in the VS fishway, RSS values are similar for all planes (<10% difference). RSS τuw values in the PO fishways are exceeding 30 N/m2 on average only for o10 (plane C) and o12 orifices (planes B and C), and exceed 40 N/m2 on all planes in the VS fishway (<51 N/m2).
Fishways with the mildest bottom slope and the shortest pool length (i075l45, Figure 11) differs significantly in RSS distribution when compared to the other PO fishways with same pool length and different slope. An average difference in RSS values compared to i125l45 is −33%, +46%, and +8% for PO fishways with o8, o10, and o12 orifices, respectively, and +33% in the VS fishway. The average difference in RSS values compared to i100l45 is −24%, +64%, and +2% for PO fishways with o8, o10, and o12 orifices, respectively, and +16% in the VS fishway. The same pattern of prevailing RSS τuw components, in comparison to τuv and τvw, is observed, with τuw higher by +64% and +50% on average, respectively. Differences between RSS components in corresponding VS fishways are +107% and +94% on average. RSS values are lowest on plane A, and increase towards plane C for all PO fishways, while in the VS fishway, RSS values differ <18%. RSS τuw values in the PO fishways are exceeding 30 N/m2 on average only for o10 (all planes) and o12 orifices (plane C), and exceeding 38 N/m2 on all planes in the VS fishway (<51 N/m2).
Fishways with the mildest bottom slope and middle pool length (i075l60, Figure 12) differ significantly in RSS distribution when compared to the other PO fishways with the same pool length and a different slope. The average difference in RSS values compared to i125l60 is +37%, −23%, and −5% for PO fishways with o8, o10, and, o12 orifices, respectively and +29% in VS fishways. The average differences in RSS values compared to i100l45 are +45%, −11%, and +11% for PO fishways with o8, o10, and o12 orifices, respectively, and +1% in the VS fishway. The same pattern of prevailing RSS τuw components, in comparison to τuv and τvw, is observed, with τuw being higher by +56% and +53% on average, respectively. Differences between RSS components in corresponding VS fishways are +107% and +106% on average. RSS values are similar on planes A and B for all PO fishways, with the highest values observed in plane C. In comparison to i075d45, RSS values are increasing for o8 and decreasing for o10 and o12. In the o8 and o10 PO fishways, none of the RSS components exceed 30 N/m2, while for o12, all RSS components exceed a disorientation boundary on plane C, and τuw on plane B as well. The i075l60 VS fishway is the most unfavorable of all considered configurations, as τuw exceeds the disorientation boundary on average on all planes, while it exceeds the injury boundary on planes A and B (73 N/m2, 88 N/m2 and 32 N/m2 for planes A, B, and C, respectively). The other two components exceed the disorientation boundary on planes A and B.
Fishways combining the longest pool length and the mildest slope (i075l90, Figure 13) differ significantly in RSS distribution when compared to the PO fishways with the same pool length and the steepest slope. The average differences in RSS values compared to i125l90 are −18%, +33%, and +8% for PO fishways with o8, o10, and o12 orifices, respectively and +6% in the VS fishway. Average differences in RSS values compared to i100l90 are −4%, +33%, and −1% for PO fishways with o8, o10, and o12 orifices, respectively, and −7% in the VS fishway. The same pattern of prevailing RSS τuw component, in comparison to τuv and τvw, is observed, with τuw being higher by +74% and +74% on average, respectively. Differences between RSS components in corresponding VS fishways are +77% and +72% on average. RSS values are similar on planes B and C for all PO fishways, with the lowest values observed on plane A. RSS values are lowest for PO fishways with o8 orifices, <30 N/m2, increasing with orifice size with only τuw exceeding the disorientation boundary (for all 3 planes). In the VS fishway, τuw is exceeding the disorientation boundary for all 3 planes, while the other two components are greater than 20 N/m2 on all planes. RSS distribution in the VS fishway does not differ significantly with change in the bottom slope under the largest pool length.
Analysis of the concurrent RSS in the measurement points indicates that the largest RSS occurs in the streamwise plane: τuw is on average 64% and 89% higher than the concurrent τuv or τvw. RSS components are in the PO and VS fishway, respectively. Since some of the previous studies [53] indicated that the horizontal component of Reynold’s shear stress has the greatest effect on the fish, the obtained results of the RSS were analyzed in comparison to disorientation/injury boundary regardless of the RSS plane to account for the full flow environment influencing the passage of fish. In order to make a distinction between the migration path and resting zones for fish, analysis is separately conducted for the main flow jet zone and recirculation zone.
The fraction of RSS values below the disorientation/injury boundary in the main flow jet varies significantly depending on the fishway configuration: from 45/70% to 91/98% for the PO fishways and from 17/42% to 78/94% for the VS fishways. A fraction of the RSS values below the disorientation/injury boundary measured in the VS fishway configurations are lower than in any comparable configuration of the PO fishway, except for the longest pool (l90), where a fraction of the RSS values below the disorientation/injury boundary in vertical slot fishway exceed the ones in the PO fishway with largest orifices under all bottom slopes. The bottom slope has no influence on the portion of RSS under both the boundaries in the PO fishway with the longest pool length, regardless of the orifice size. The same is also true for both shorter pool lengths and the largest orifice size, while for the two smallest orifice sizes there is no visible pattern dependent on the fishway configuration. In all PO fishway configurations, a significant drop in the fraction of RSS values below the boundaries is present for the same bottom slope/pool length configuration with an increase in the orifice size. Only the PO fishway configuration of the shortest pool and the mildest slope (i75d45) deviates from this trend: the largest fraction of RSS values below the boundaries is still for the smallest orifice, while the lowest RSS fraction is for the o10 orifice. In the VS fishway, the streaming flow deflected by the baffle is characterized by large RSS values resulting from the highly turbulent flow under flow rates exceeding the ones in the comparable PO fishway from 172% to 48% for the smallest and largest orifices, respectively. In the VS fishway, the smallest fraction of the RSS values below the biocriteria boundaries occurs in the two shortest fishways: l45 and l60, as a consequence of the abrupt deflection of the jet inwards towards the pool. The absolute minimum of RSS values below the biocriteria boundaries are found for the middle bottom slope, followed closely by the mildest slope. When the pool length of the fishway is the longest, a fraction of the RSS values below the biocriteria boundaries increases abruptly, and is comparable to all PO fishway configurations, having very close values to the PO fishway with an o10 orifice and exceeding the one with the smallest orifice on all counts. The following table (Table 1) contains the RSS values below the biocriteria boundaries in the main flow jet zone, given as percentage of data below the respective boundary.
Similar to the main flow jet zone, the fraction of RSS values below disorientation/injury boundary in the recirculation zone (Table 2) varies significantly over the analyzed configurations, but with notably smaller differences between them: from 76/91% to 97/100% for the PO fishways and from 66/85% to 93/98% for the VS fishways. Considering that the largest fraction of RSS values is below the disorientation/injury boundary, no significant pattern can be observed related to change in the bottom slope/pool length. Similar to the main flow jet characteristics, in all PO fishway configurations, a significant drop in the fraction of RSS values below the boundaries is present for the same bottom slope/pool length configuration, with an increase in the orifice size. Only the PO fishway configuration of the shortest pool and the mildest slope (i75d45) deviates from this trend: the largest fraction of RSS values below the boundaries is still for the smallest orifice, while the lowest RSS fraction is for the o10 orifice. In the VS fishway, a significant increase in the RSS values below the disorientation/injury boundary is observed compared to the main flow jet zone. The highest fraction of RSS values below the disorientation/injury boundary is observed for the shortest pool length across all bottom slopes (above 86% and 96% for disorientation and injury boundary, respectively). The two largest pool lengths have similar fractions below the disorientation/injury boundary, above 66% and 85%, respectively. There is no visible trend in the increase/decrease of the RSS fractions below the disorientation/injury boundary correlating with change in the pool length while retaining the same bottom slope.

4. Discussion

The majority of all the analyzed fishway configurations were proven to have favorable conditions for fish passage, according to Odeh et al.’s disorientation and injury boundary biocriteria. In the PO fishways, RSS is correlated with orifice size: all RSS components are observed to increase with the increase of the orifice size, while retaining the same bottom slope and pool length. In the PO fishways with the smallest orifices, almost all RSS values averaged across the pool plane are lower than the disorientation boundary, with two exceptions: τuw on the C plane for i125l45 and i100l45 configurations. Values of all RSS components are increasing from plane A towards the plane C. An increase in the orifice size to o10 results in the increase of all RSS components across all planes. For this orifice size on the C plane, all RSS components are greater than 20 N/m2, while τuw is greater than 30 N/m2 in all configurations. The largest RSS values in the PO-type fishways are recorded for the largest orifice size. For this orifice size on the C plane, all RSS components are greater than 25 N/m2, while τuw is greater than 30 N/m2 in all configurations on the C plane and greater than 20 N/m2 on planes A and B. Overall, the most unfavorable PO fishway configuration is i075l45o10, with an average RSS 28 N/m2, followed closely by the three configurations with a large orifice: i125l60o12, i075l60o12, and i075l90o12. Change in slope and pool length has no significant influence on the change in RSS values. RSS values measured for the VS fishways are larger than the ones measured for their PO counterpart: all RSS components are greater than 20 N/m2, except for i125l45 and i125l90. For all configurations, τuw exceeds the disorientation boundary on all planes, with values generally reducing from the top (plane A) towards the bottom (plane C). Overall, the most unfavorable VS fishway configurations are i100l60 and i075l60, with an average RSS of 41 N/m2, where τuw exceeds the injury boundary and τuv and τvw exceed the disorientation boundary on planes A and B. In the VS fishways, RSS is inversely correlated with the bottom slope: all RSS components are observed to increase with the decrease of the bottom slope. The greatest change is observed for the transition from i125 to i100, while transition from i100 to i075 is almost negligible.
Observed fractions of the RSS values suggest that a large portion of both the main flow jet and recirculation area in the PO fishways satisfy the condition of non-exceedance for disorientation and injury boundary, on average. For all PO fishway types, a fraction of RSS values below the biocriteria boundaries is inversely correlated with the orifice size, both for the main flow jet zone and recirculation zone. In the main flow jet zone, the largest fraction of the RSS values below the biocriteria boundaries is concentrated in the shortest pool length for i075 and in the pool l60 for i100 and i125. The smallest fraction of the RSS values below the biocriteria boundaries is concentrated in the two longest pool lengths (l60 and l90) for all slopes. Therefore, it can be considered that the pool length longer than 60 cm does not contribute to the flow environment, except for the largest orifices. It is observed that a fraction of the RSS values below the biocriteria boundaries is reducing with the increase in the pool length and an increase in the orifice size. A fraction of RSS values below the biocriteria boundaries in the VS fishway is significantly lower than in the counterpart PO fishway: more than 50% of RSS values below the disorientation boundary is observed only for the longest pool, as well as more than 65% of RSS values below the injury boundary. The lowest fraction of RSS values below the biocriteria boundaries in the VS fishway are observed in the middle pool length (l60). In the recirculation area, both fishway types have large fractions of RSS values below the biocriteria boundaries: >75% and >65% below the disorientation boundary and >91% and >84% below the injury boundary for PO and VS fishways, respectively. It is observed that a fraction of the RSS values below the biocriteria boundaries is reducing with the increase in the orifice size for PO fishways and with the increase of pool length in the VS fishways.
Trends in the turbulence detected in this research are similar to the ones reported in the literature: Quarranta et al. [34] reported RSS values lower than 60 N/m2 in more than 90% of the pool area and a maximum variation of the RSS in the main flow zone was reported in several publications [36], while Bermúdez et al. [20] suggested that the length of the pool is the main geometric dimension that affects the flow in the fishway. The results obtained in this study suggest that for PO fishways, the critical design parameter is the orifice size, indicating that the smaller the orifice, the more favorable the flow conditions for the fish passage. With this in mind, special care must be taken when selecting the orifice size based on the target fish species in order not to constrain their migration due to a small orifice. In the design process, the pool length should be minimal, adjusted to the target species biological requirements, because the flow pattern of the recirculation area in the longer pools is characterized by larger velocity fluctuations. The bottom slope can be designed to be as steep as the velocity through the orifice allows, since RSS does not differ significantly for the analyzed slope span.
For the VS fishway, the critical design parameter is shown to be the pool length, indicating that longer pools present more favorable flow conditions for the fish passage through the main flow jet, at the same time reducing the recirculation area due to the deflection of the jet into the resting area of the pool. A reduction in the favorable area in the recirculation zone is not significant and therefore larger pools can be exploited in order to relax the RSS in the main flow jet zone. The same can be applied to the bottom slope, where steeper slope streamlines the main flow jet, resulting in a decrease in the RSS. On the other hand, a steeper slope results in an increase of the flow velocity and requires a larger flow rate in order to sustain the required flow depth. Increased flow velocity must not exceed the threshold for the target species, and therefore a combination of the flow velocity and RSS needs to be evaluated against passage time of the target species in order to achieve optimal design of the VS fishway.

5. Conclusions

Motivation for the research presented in this paper was to quantify the hydraulic environment in the fishway types most commonly used on small barriers and analyze its dependency on the fishway geometry. Aim of this paper is to investigate the hydraulic environment of the three-dimensional flow and turbulence measured in the physical fishway model with the goal of providing information on the Reynold’s shear stress distribution that would facilitate their design in accordance with biocriteria boundaries defined by Odeh et al., disorientation and injury boundary. The main findings of the analyses are:
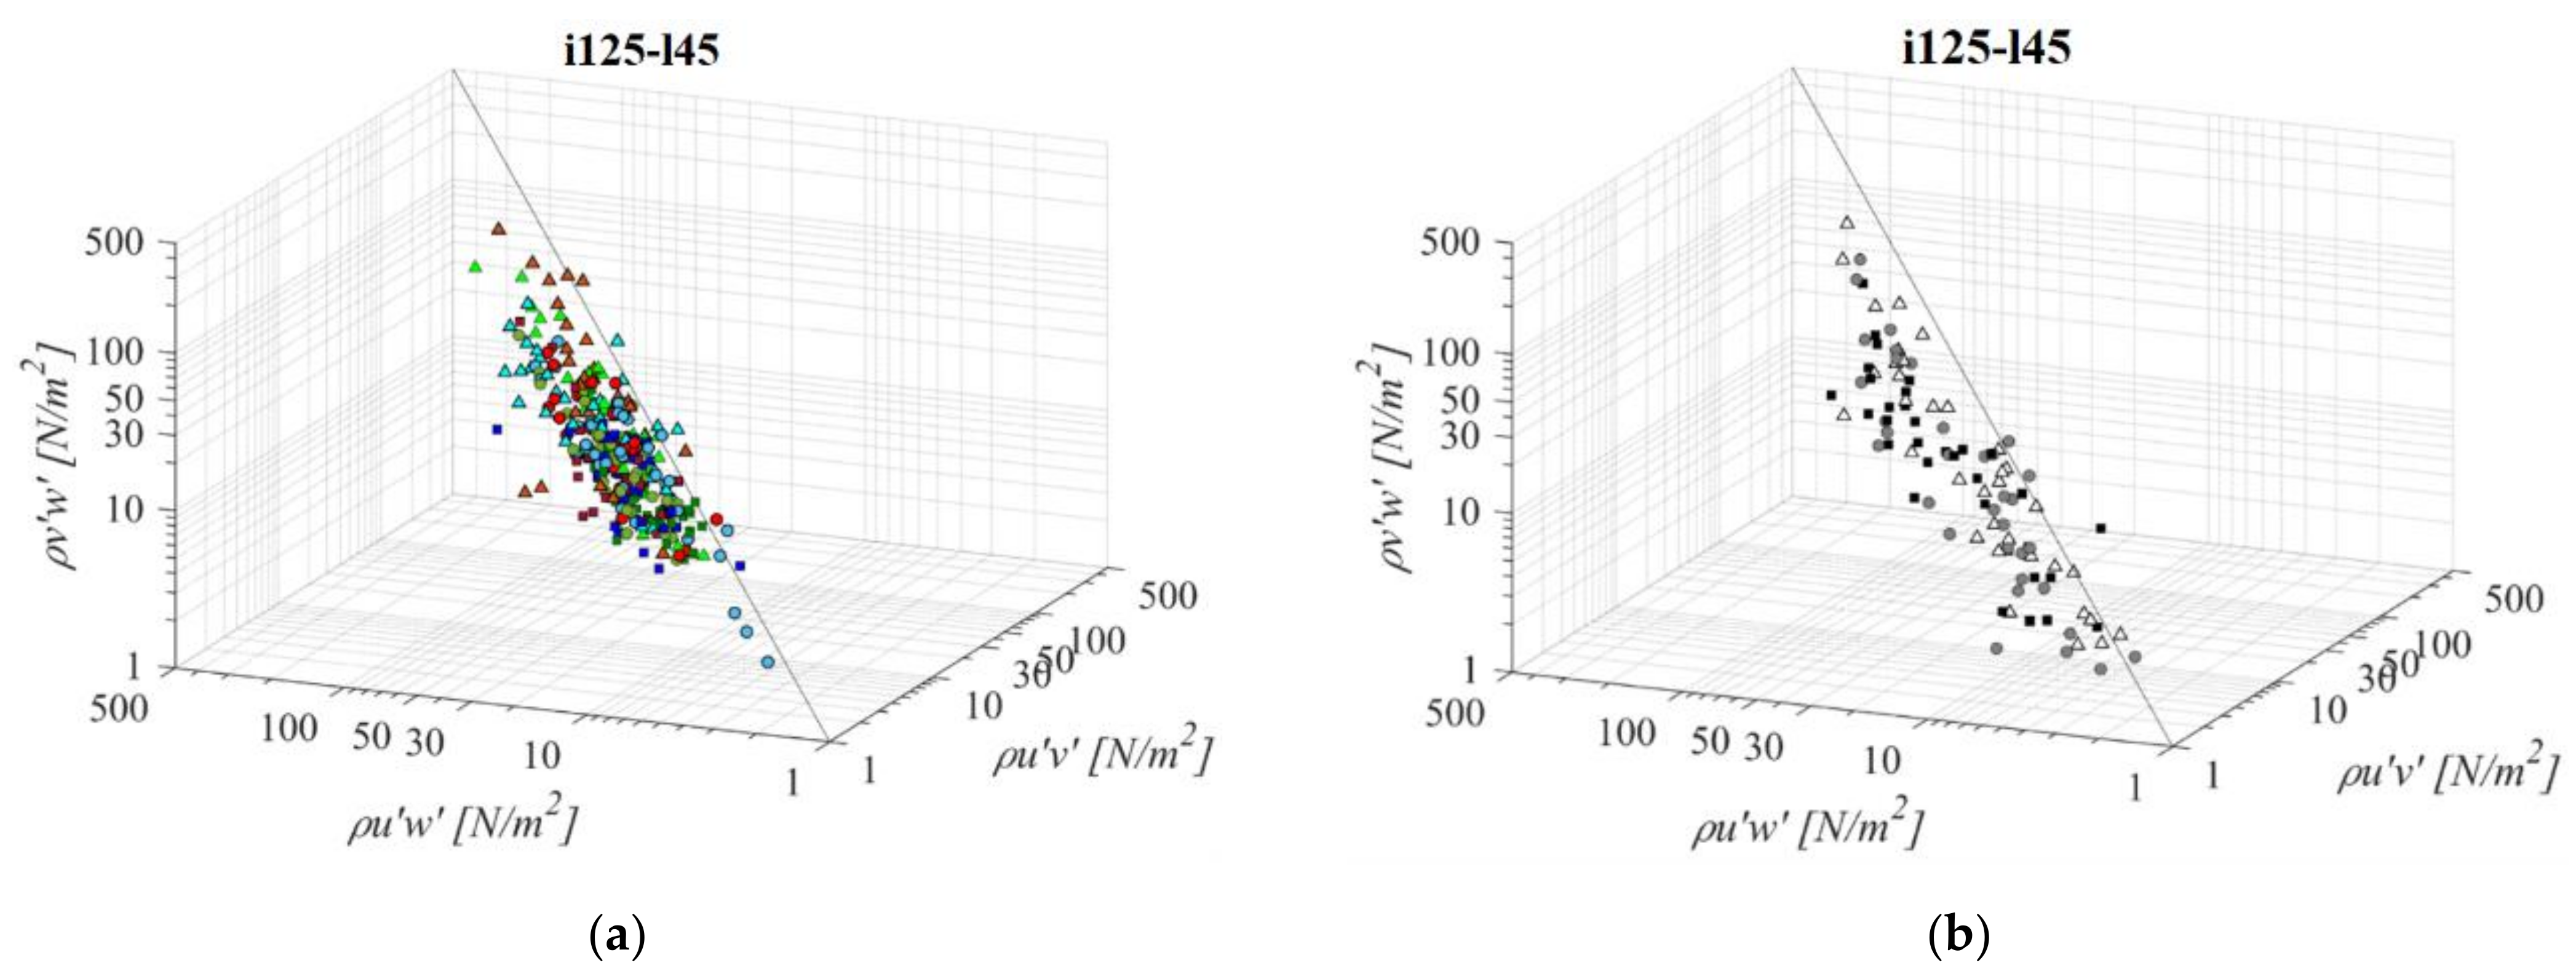
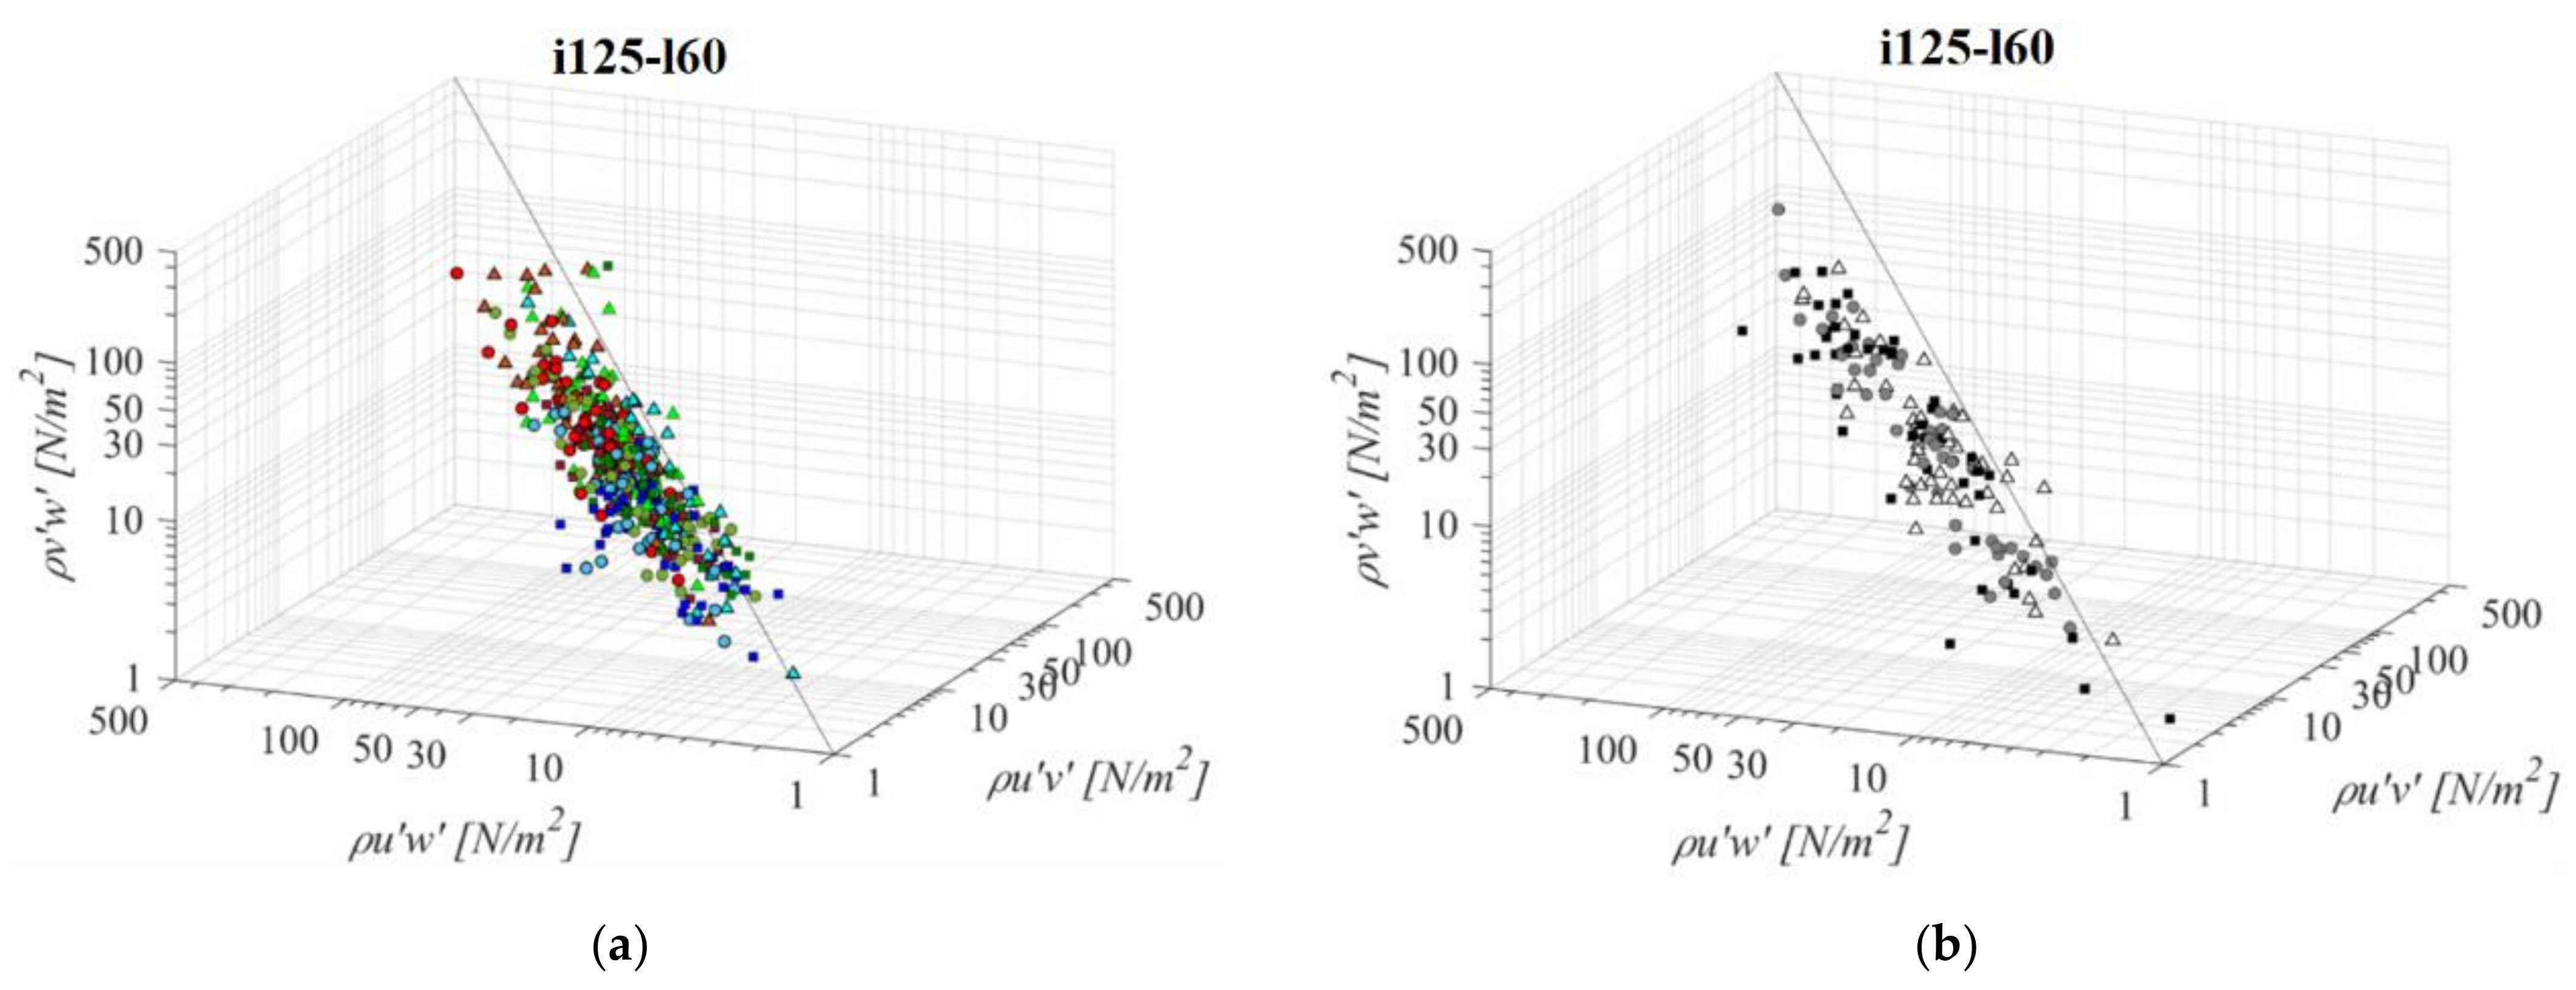
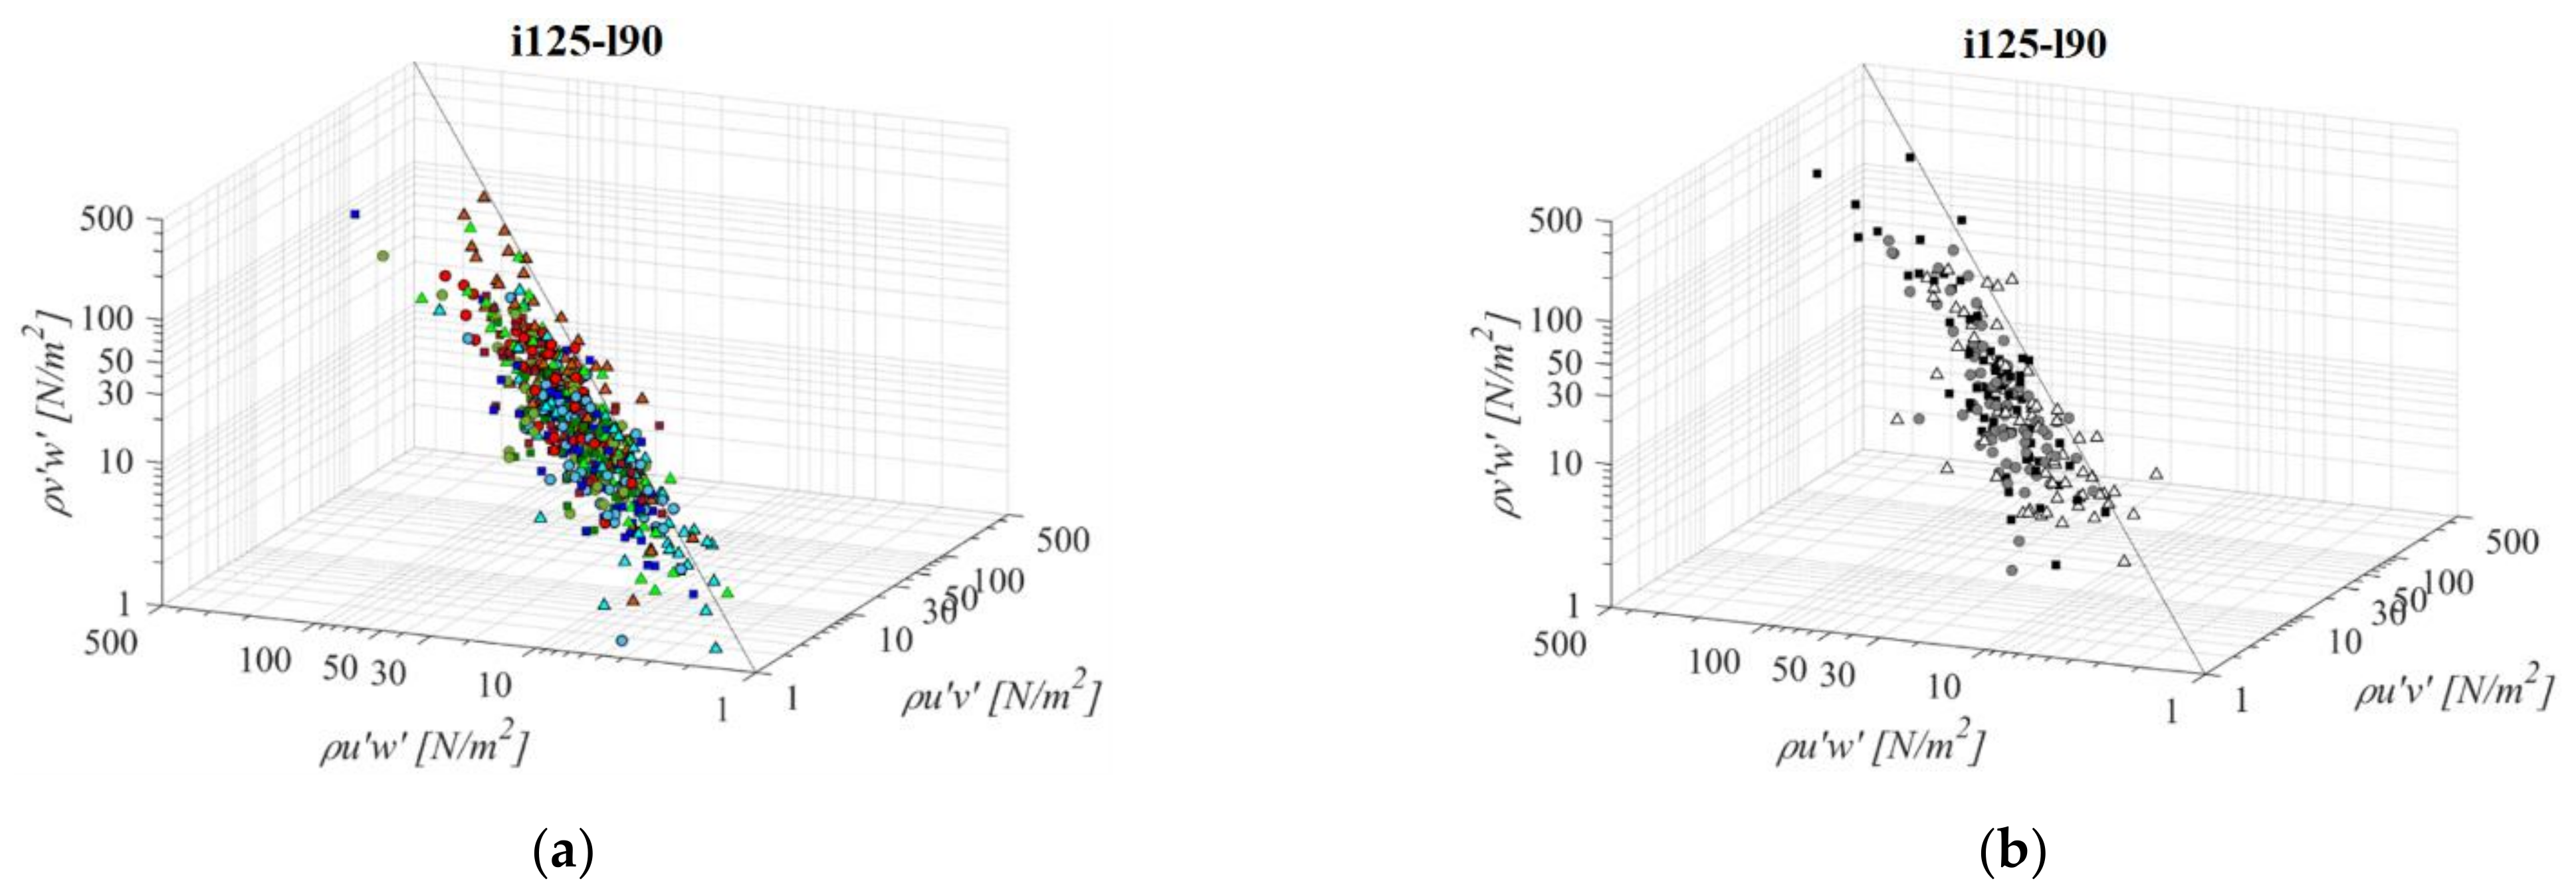
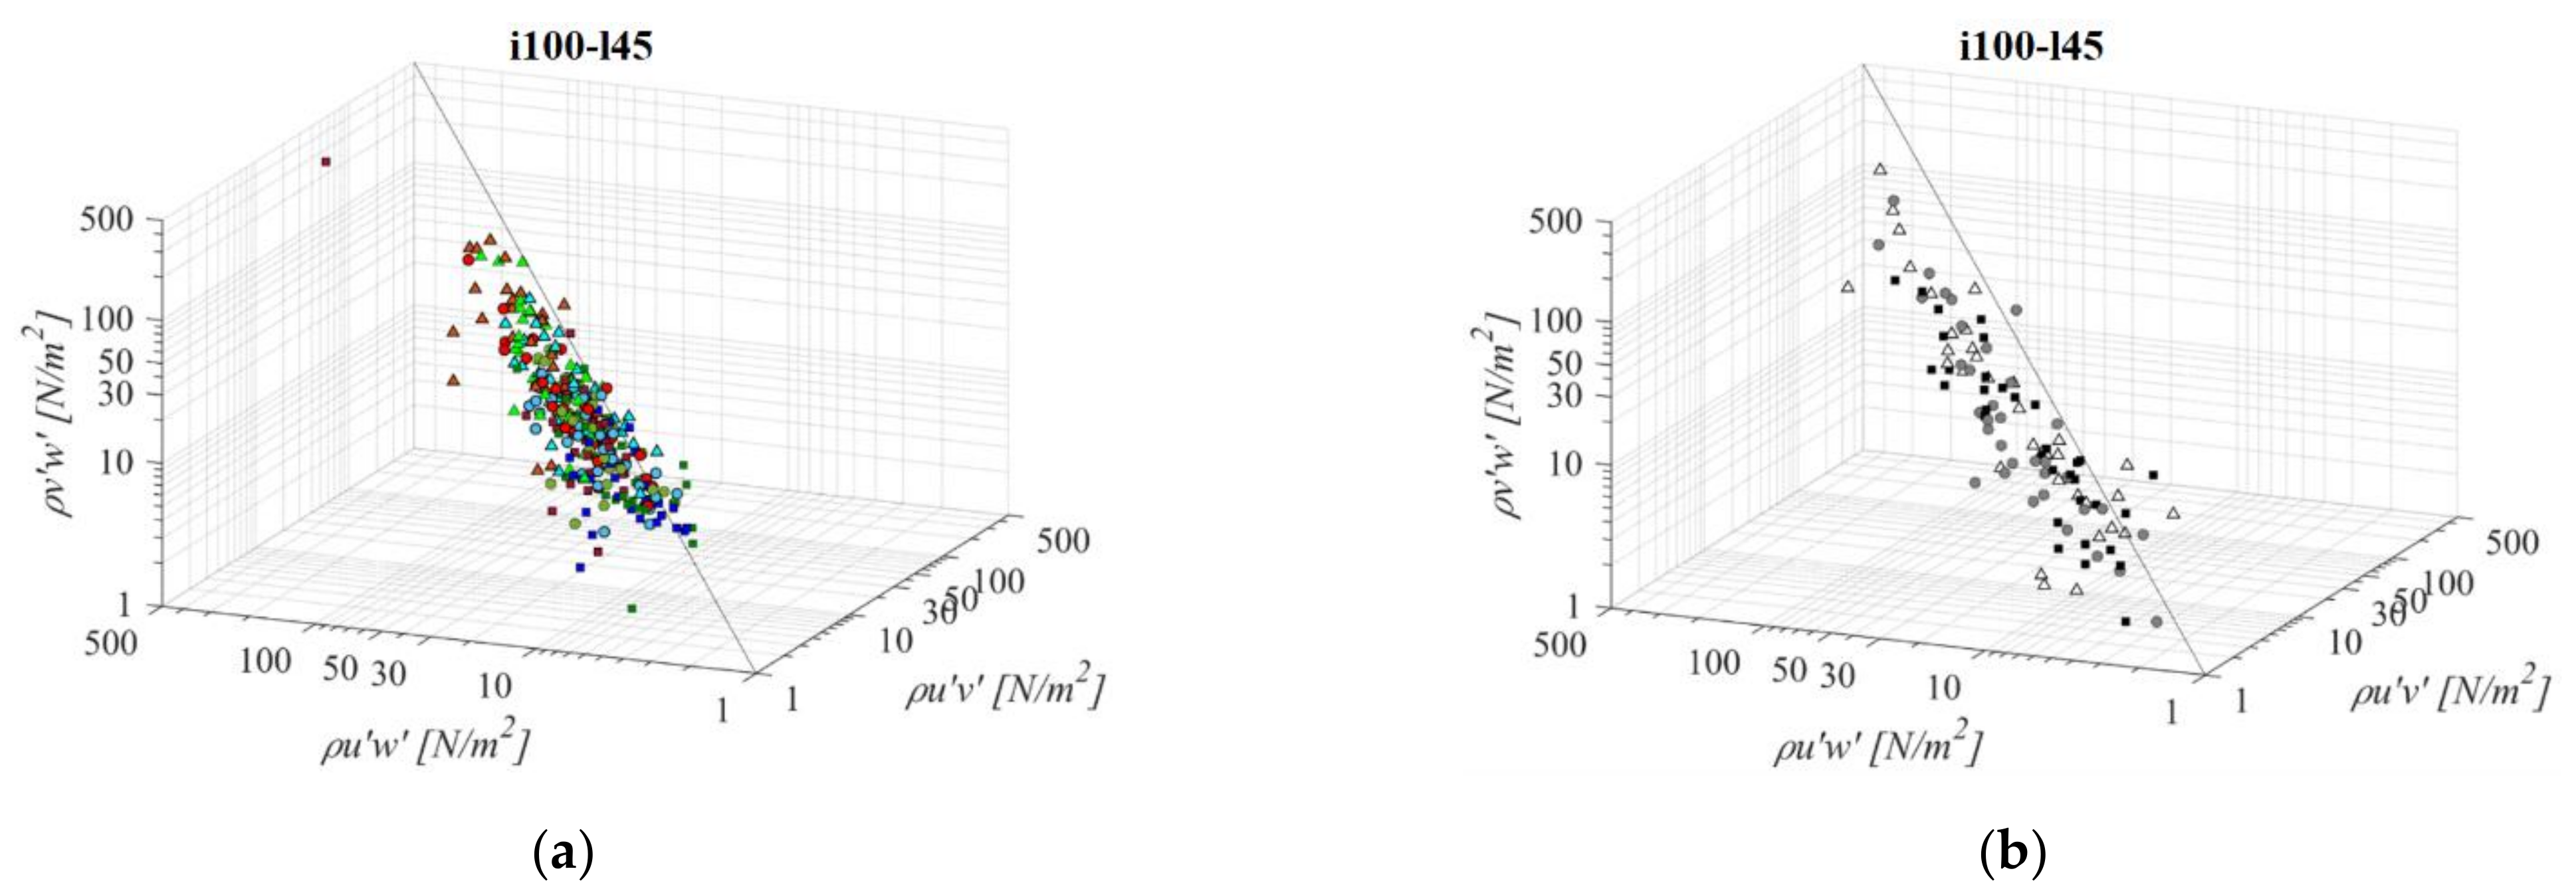
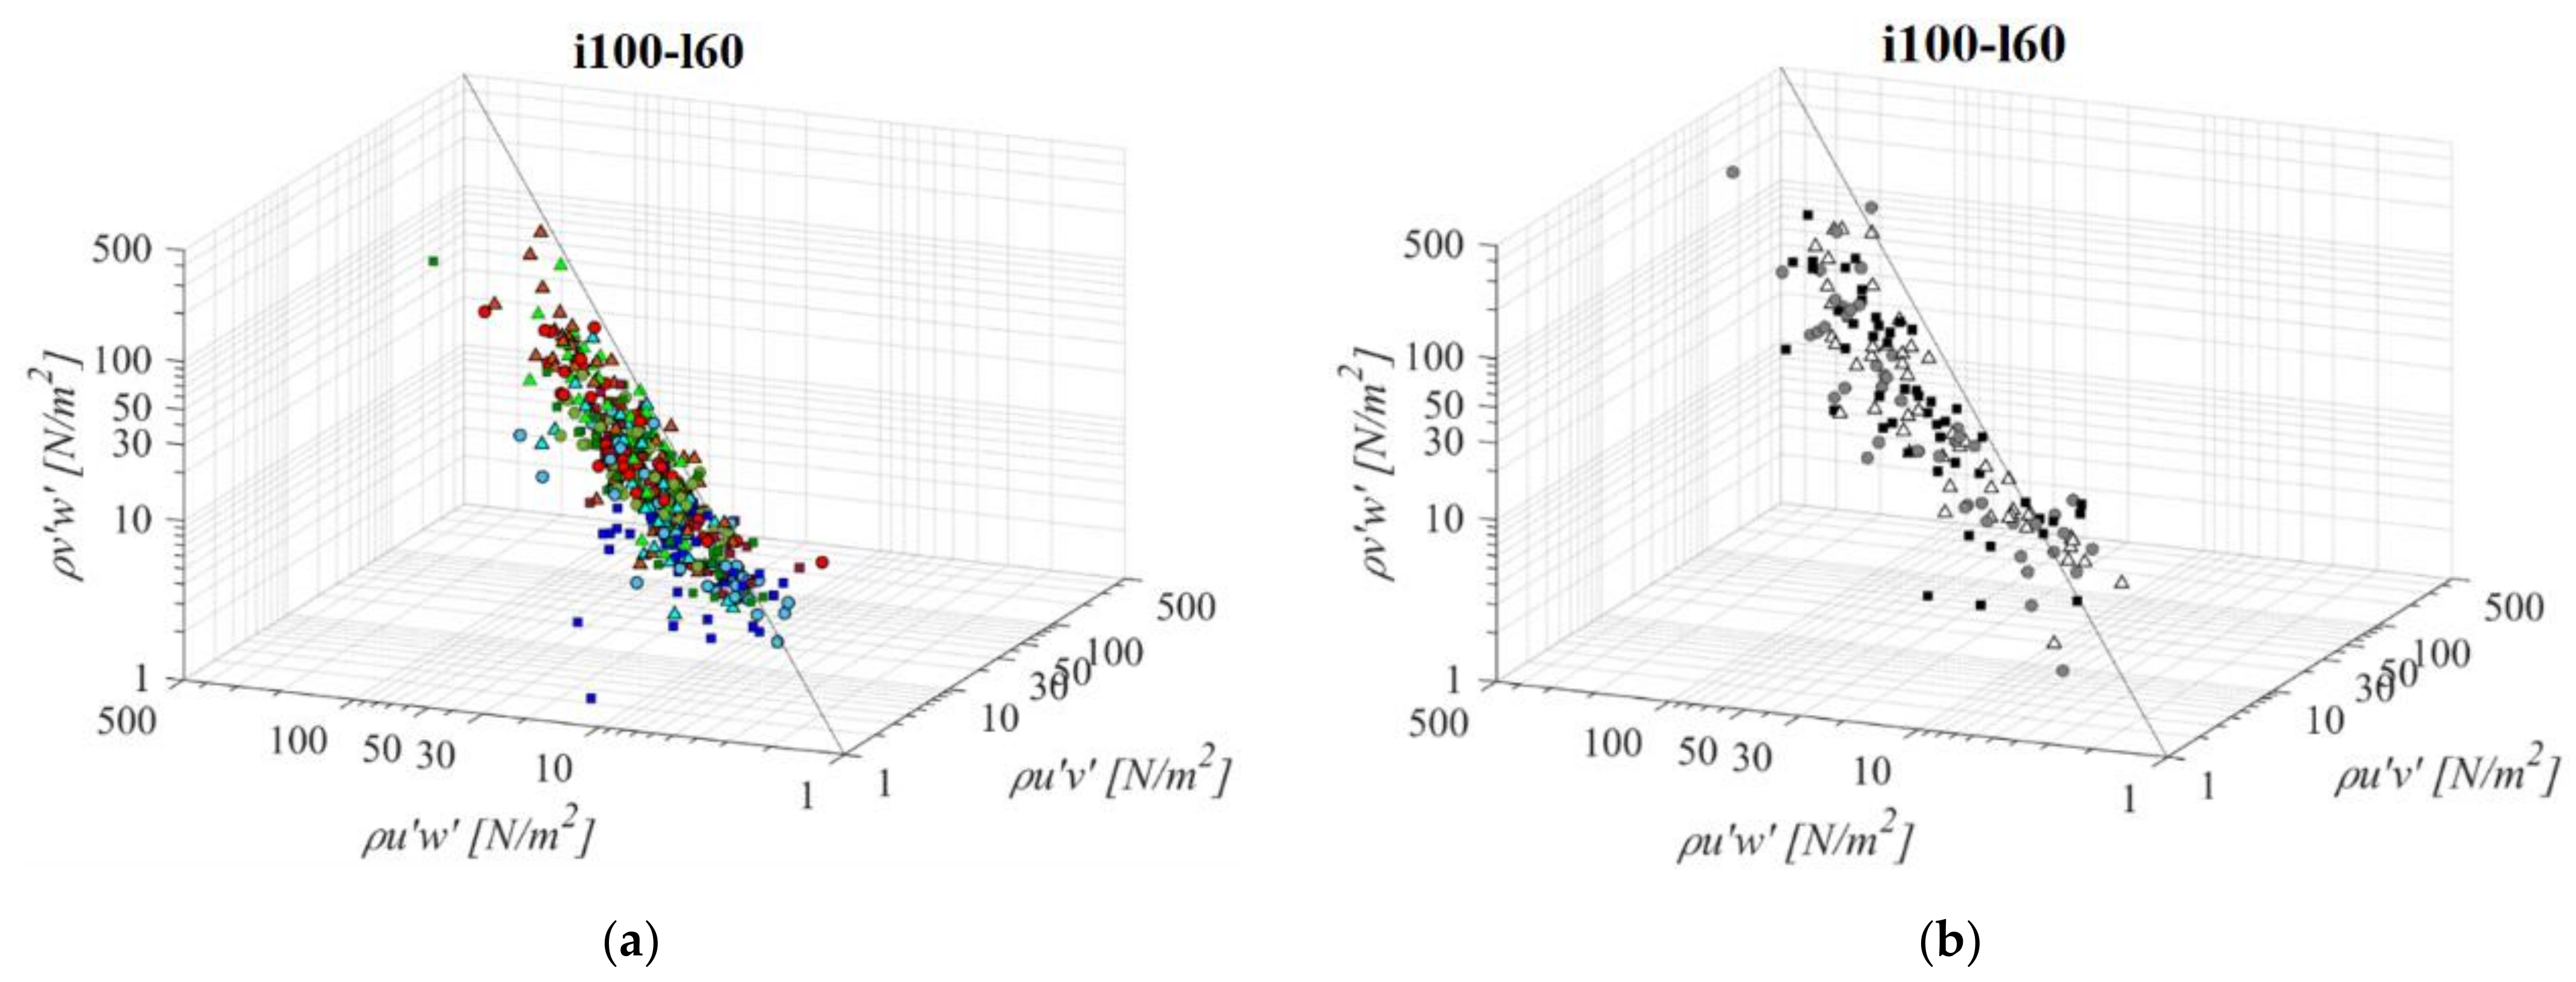
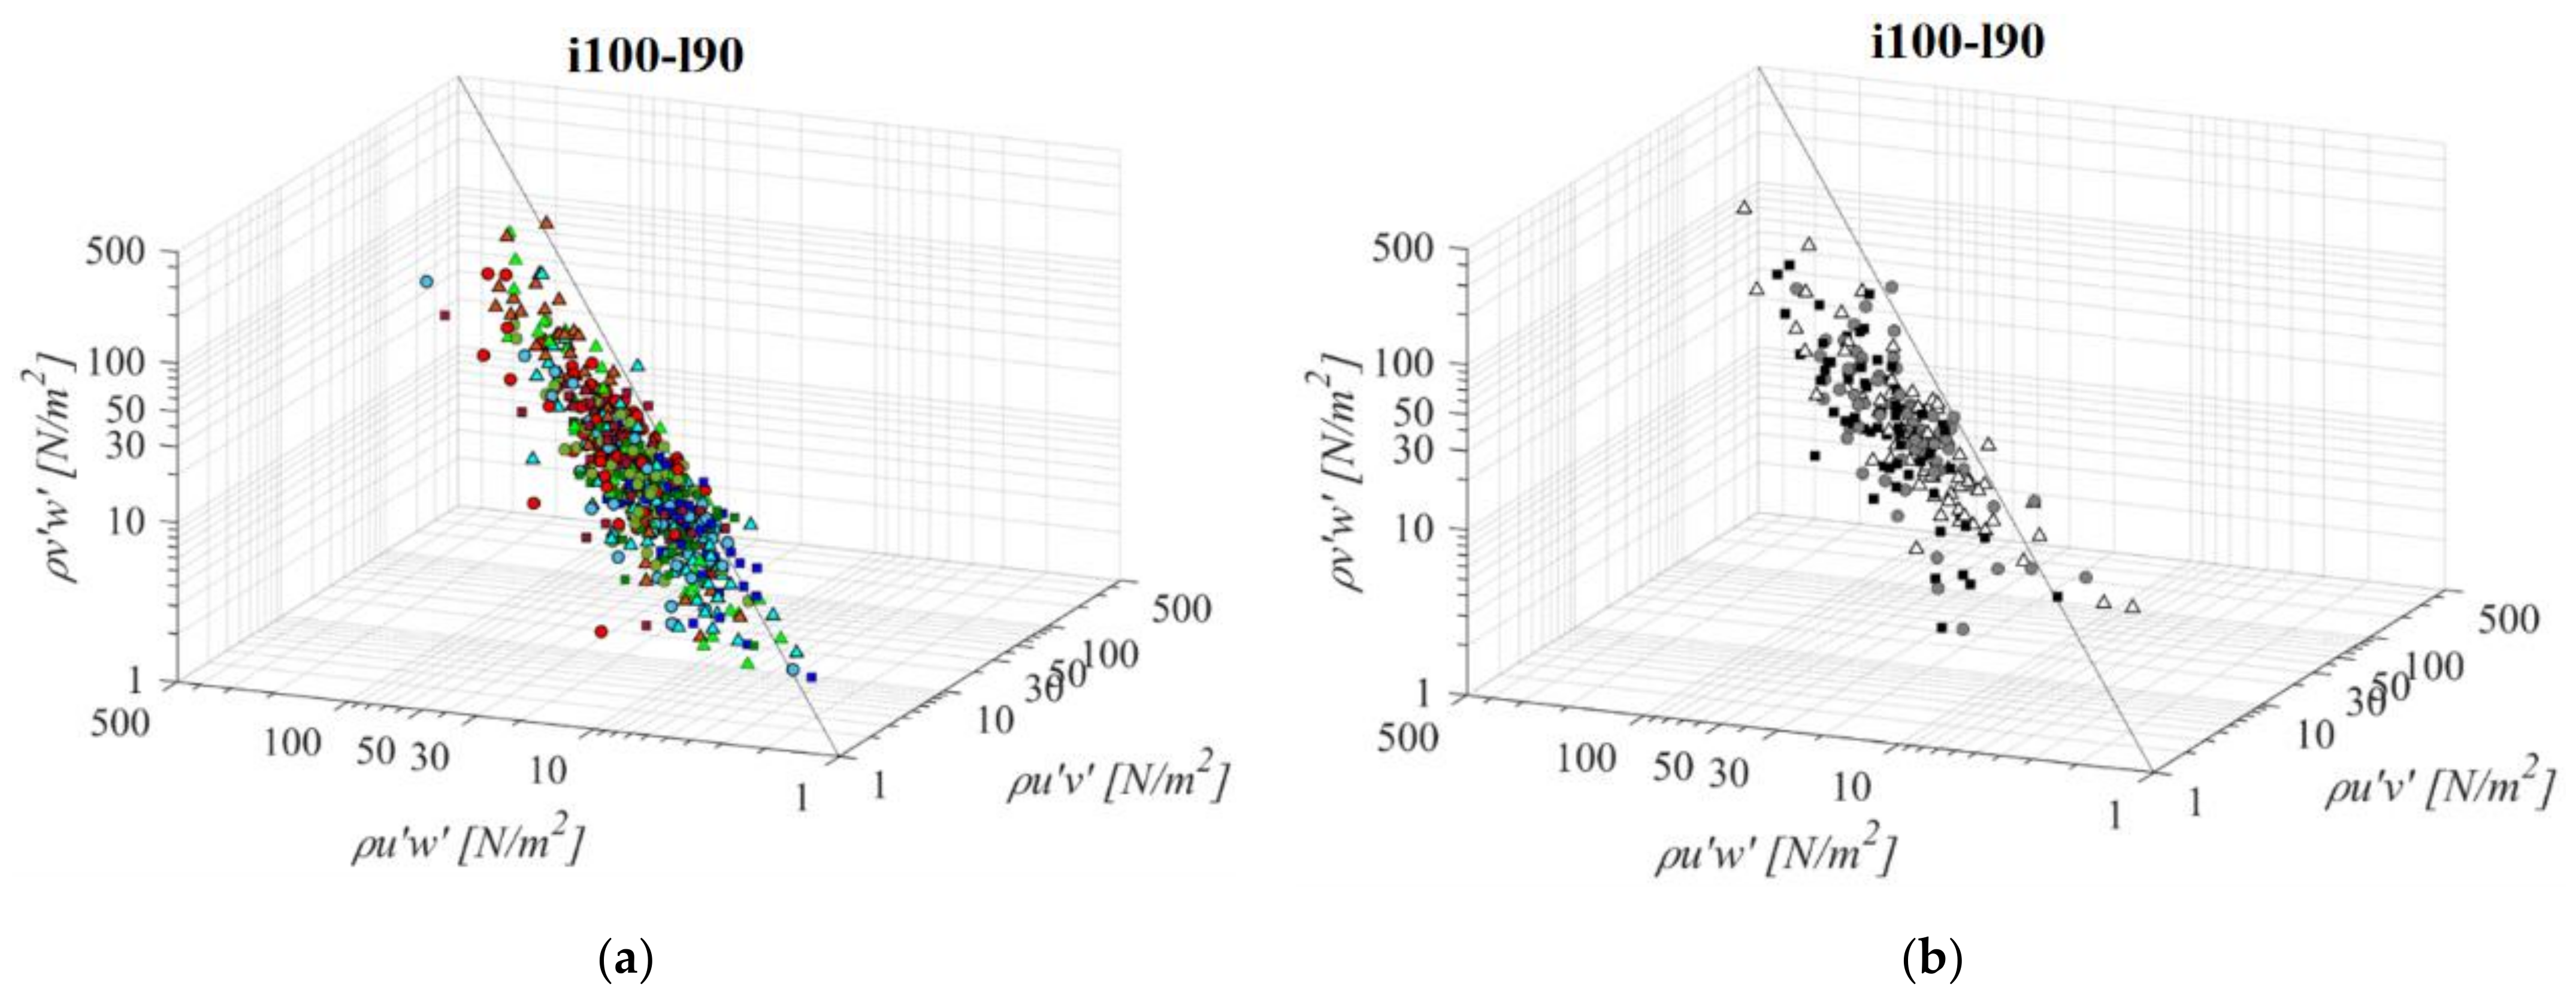
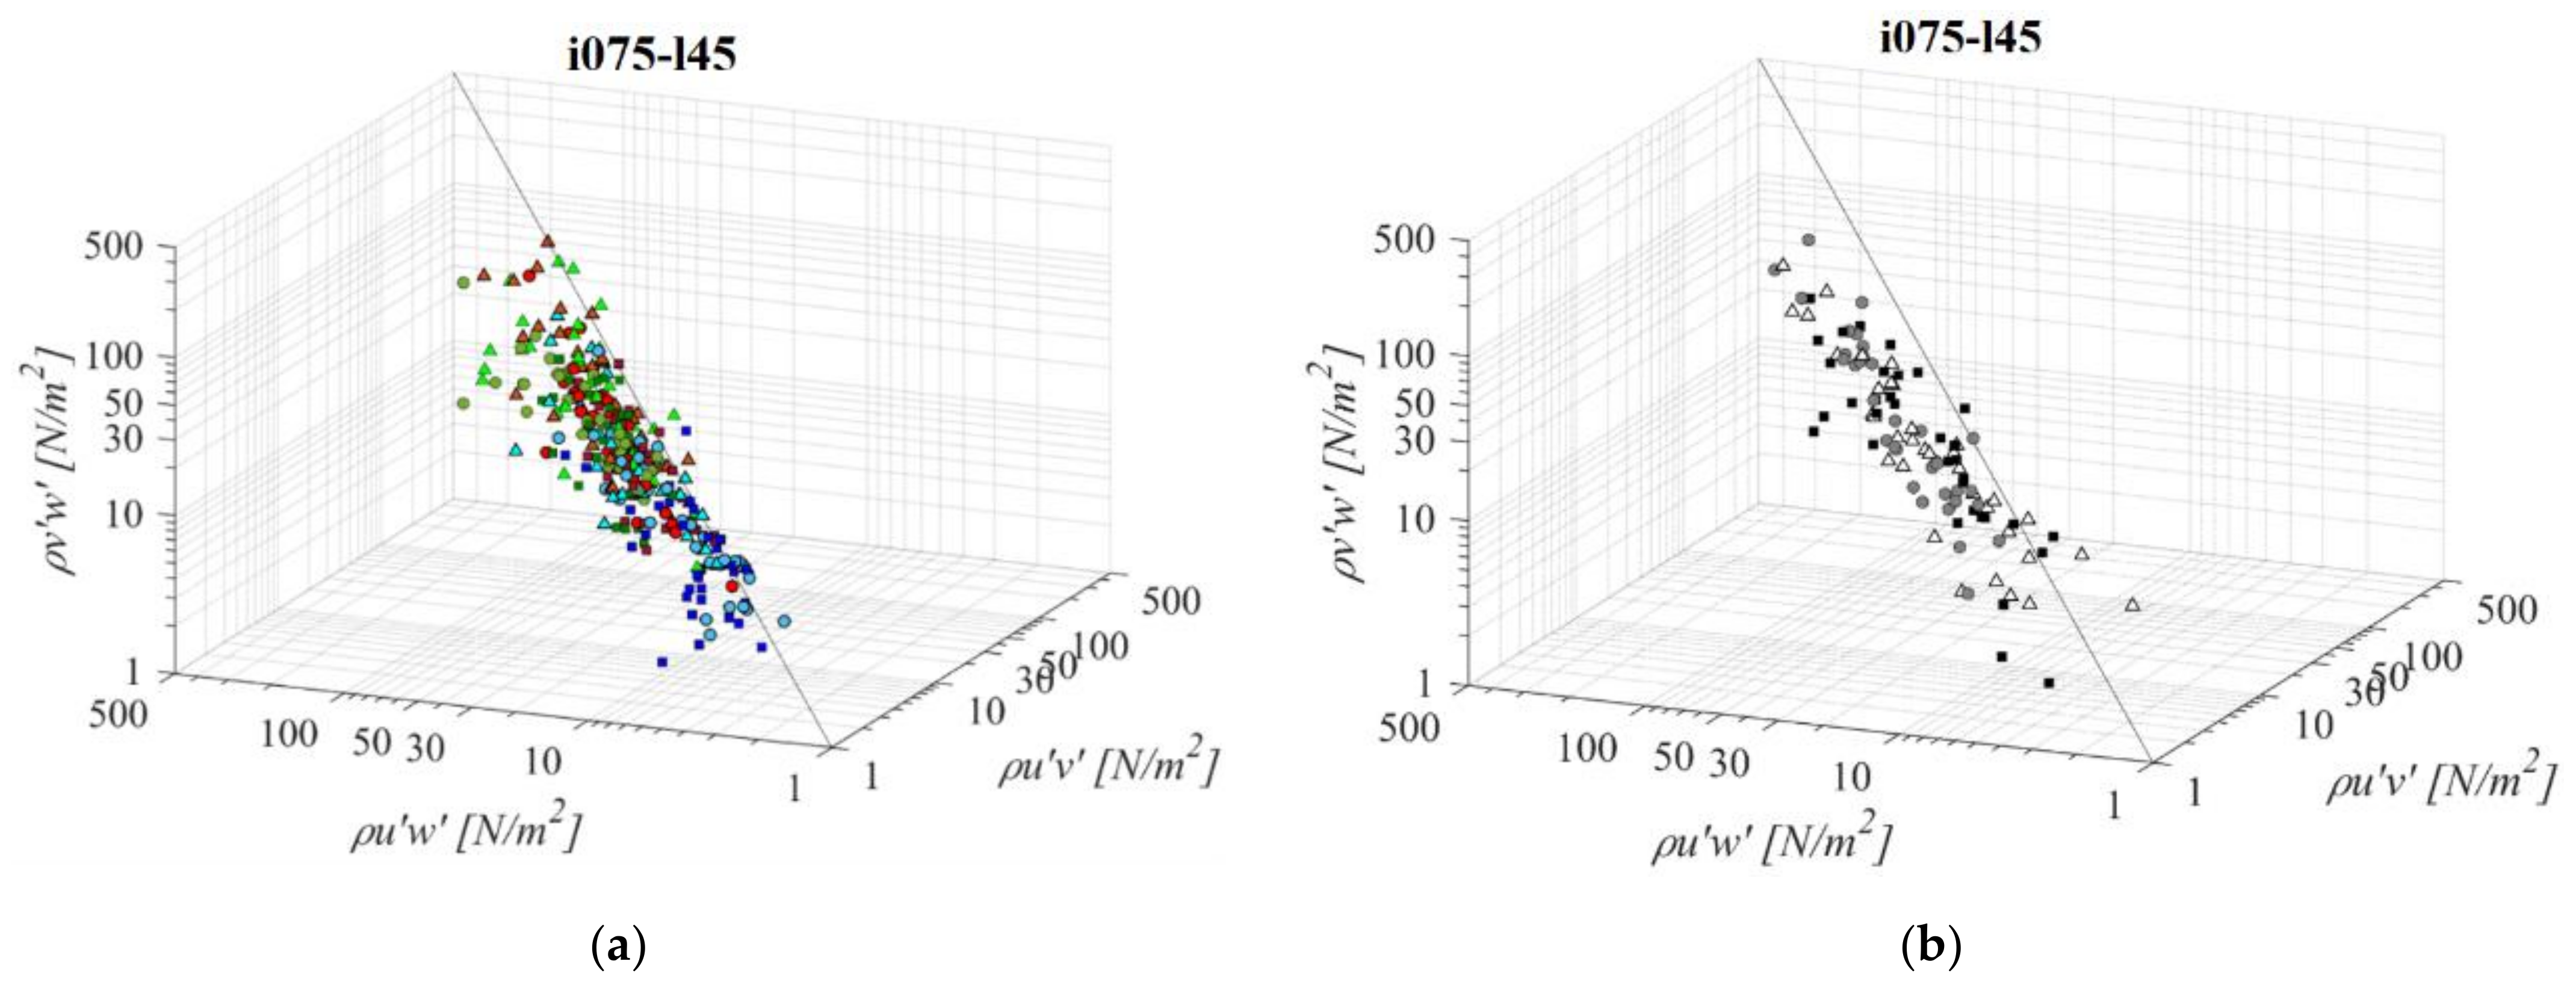
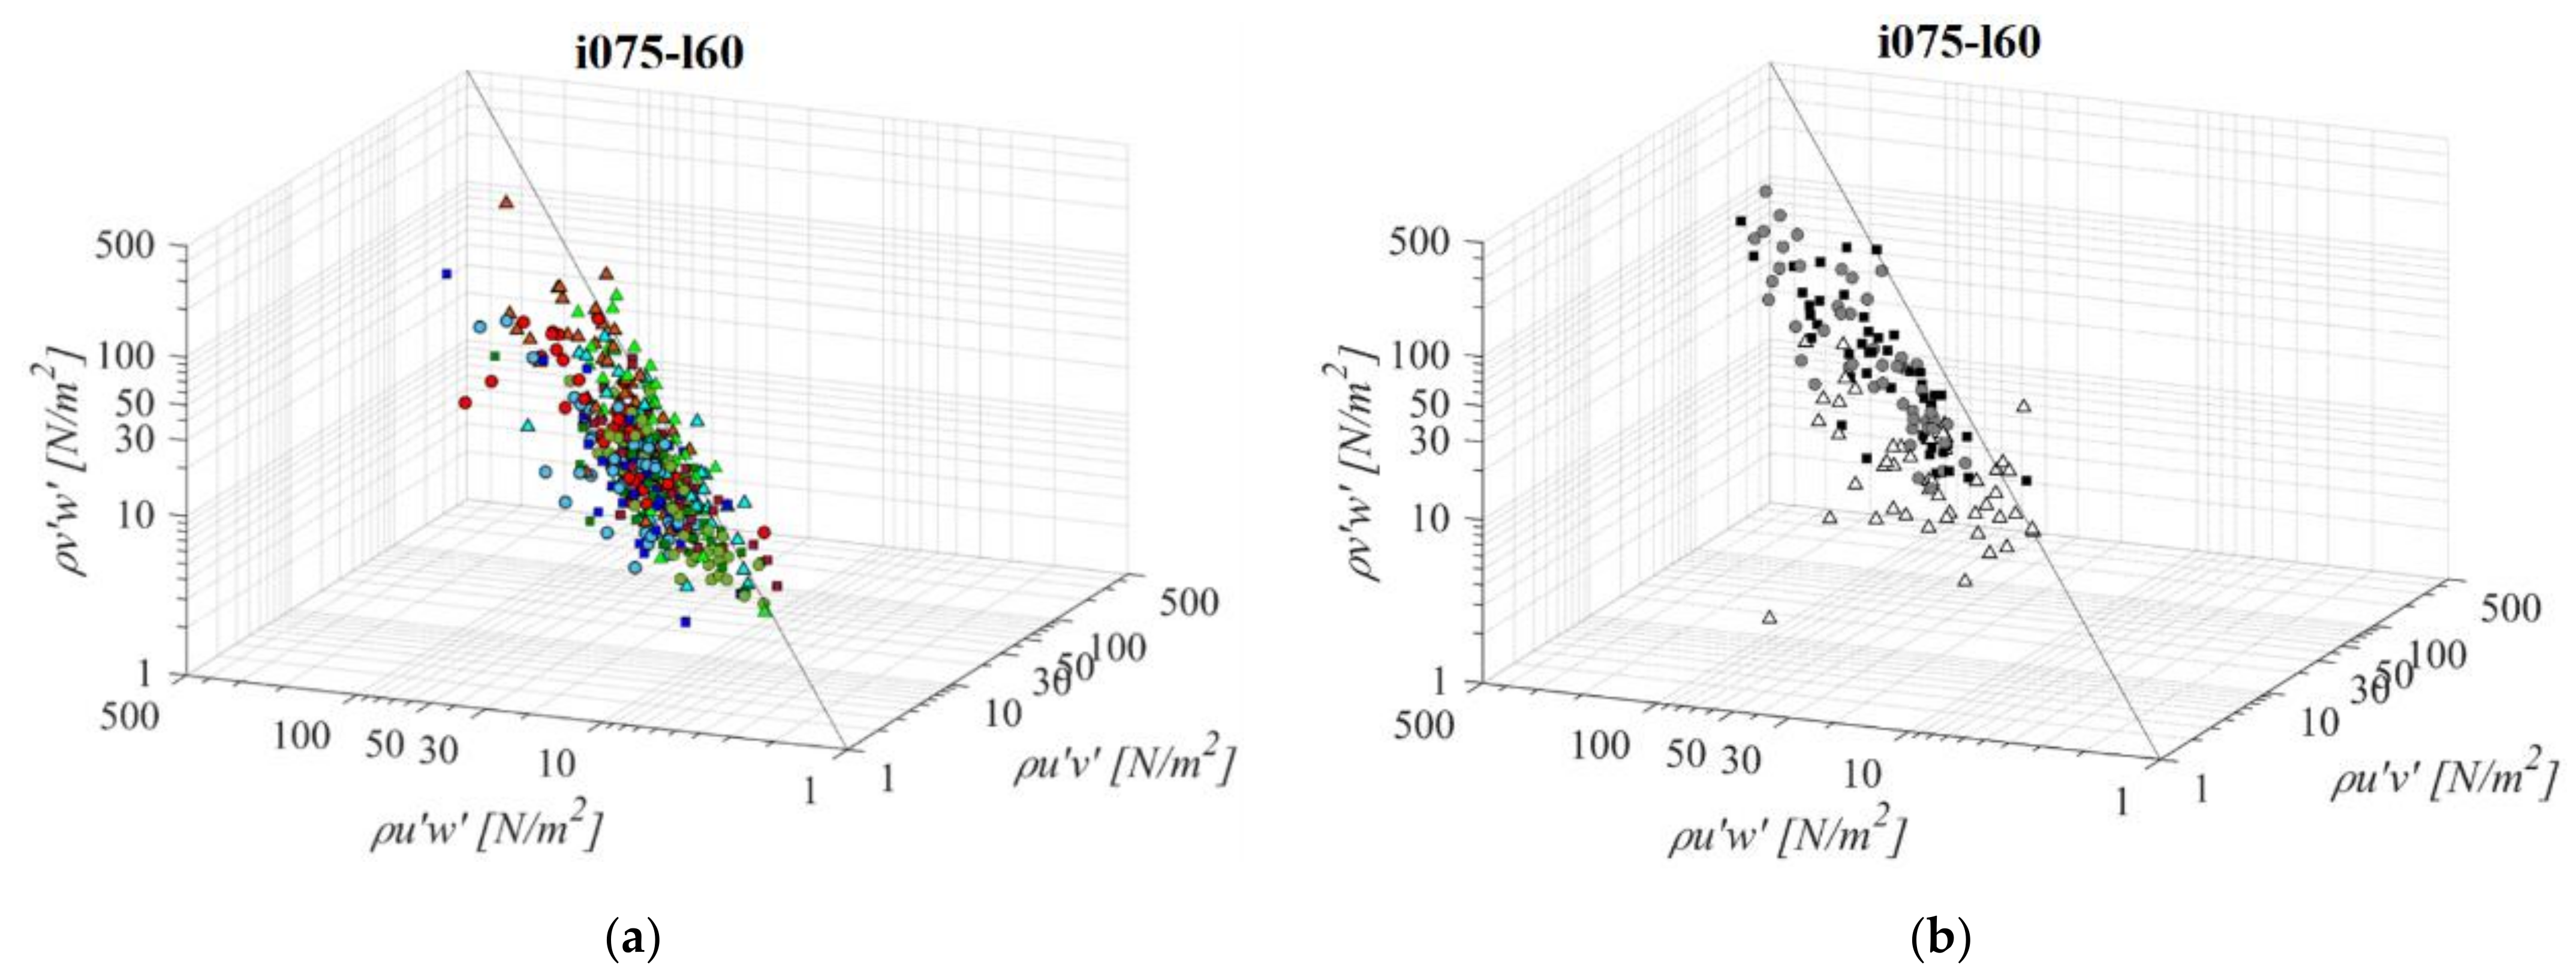
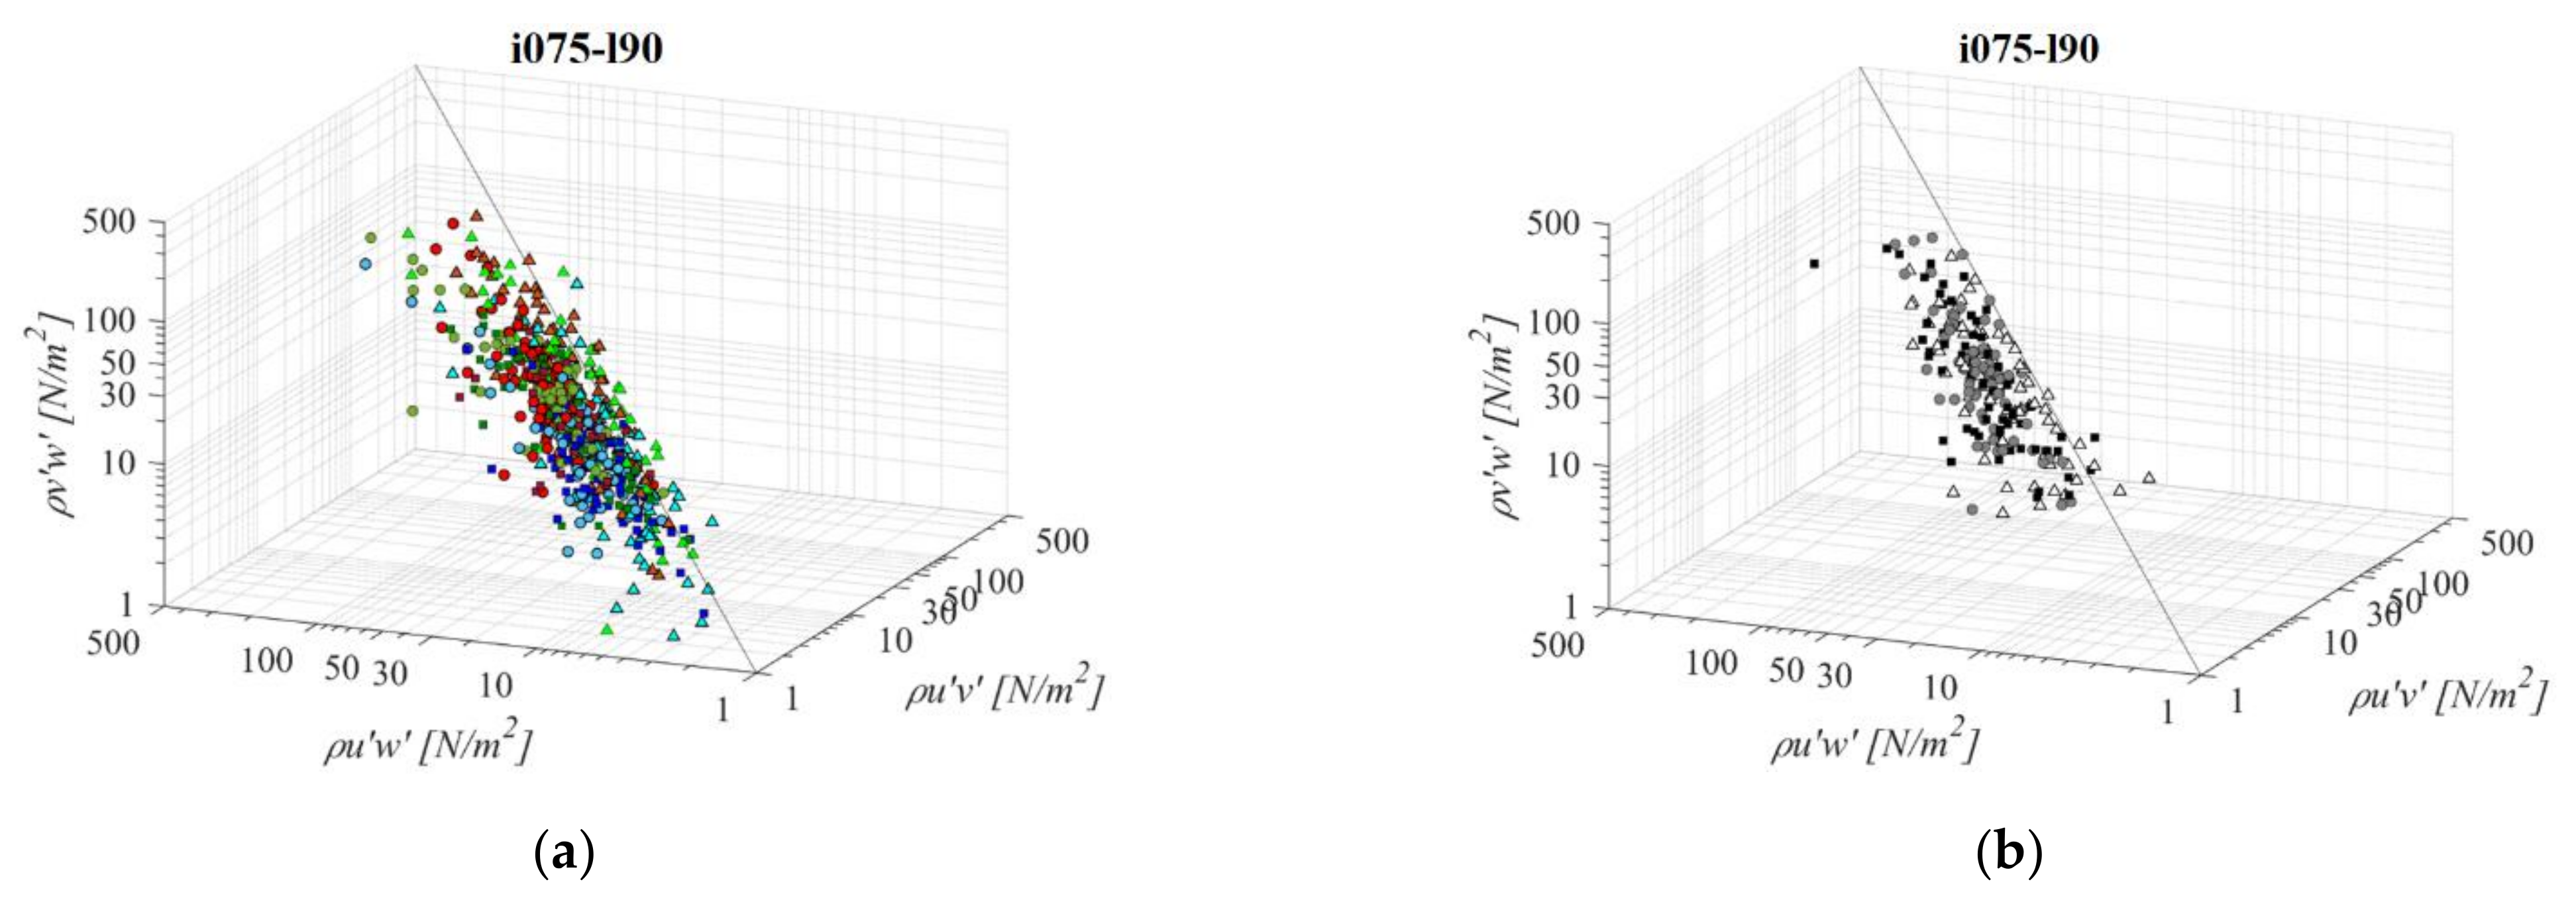
  • RSS distribution across the 3 planes suggest that a streamwise RSS component is significantly larger than the horizontal and vertical component. In the PO fishway, τuw is higher than concurrent τuv and τvw by 67% and 61% on average, respectively. In the VS fishway, τuw is higher than concurrent τuv and τvw by 92% and 86% on average, respectively. Horizontal and vertical RSS components are similar, with average differences between them at 3% for all fishways and not exceeding 44% in the PO fishway and 14% in the VS fishway;
  • A majority of all analyzed fishway configurations have been observed to have favorable conditions for fish passage, according to Odeh et al.’s biocriteria boundaries. All PO fishways have RSS values below the injury boundary across the entire pool, while the disorientation boundary is exceeded only for orifices o10 and o12. For all VS fishways, the disorientation boundary is exceeded by a streamwise RSS component, while the injury boundary is exceeded for l60 and all slopes. τuv and τvw do not exceed the disorientation boundary, but are close to it (>20 N/m2) for all VS fishway configurations;
  • In the PO fishways RSS is inversely correlated with the orifice size and is correlated with its proximity to the main flow jet: all RSS components are observed to increase with the increase of the orifice size (while retaining the same bottom slope and pool length) and all RSS components are increasing from plane A towards plane C. A change in slope and pool length has no significant influence on the change in RSS values for PO fishways;
  • In the VS fishways, RSS is inversely correlated with the bottom slope: all RSS components are observed to increase with the decrease in the bottom slope. All RSS components are decreasing from plane A towards plane C. A change in the pool length has no significant influence on the change in RSS values for VS fishways;
  • A fraction of the RSS values below the biocriteria boundaries is reducing with the increase in the orifice size for PO fishways and with the increase of pool length in the VS fishways. A fraction of RSS values below the biocriteria boundaries in the VS fishway is significantly lower than in the counterpart PO fishway.
Results obtained in this research suggest that for PO fishways, the critical design parameter is the orifice size, indicating that the smaller the orifice, the more favorable the flow conditions for the fish passage. With this in mind, special care needs to be taken when selecting the target fish species in order not to constrain their migration due to a small orifice size. For the VS fishway, the critical design parameter is shown to be the pool length, indicating that longer pools present more favorable flow conditions for the fish passage through the main flow jet, at the same time reducing the recirculation area due to the deflection of the jet into the resting area of the pool. Since the RSS values in the main flow jet are the lowest, the main flow jet should be in the focus of the optimal design of VS fishways.

Author Contributions

Conceptualization, G.G.; methodology, G.G. and E.O.; software, G.G. and R.F.; formal analysis, G.G and R.F.; investigation, G.G. and E.O.; writing—original draft preparation, G.G.; writing—review and editing, G.G., E.O. and R.F.; visualization, R.F.; funding acquisition, E.O. All authors have read and agreed to the published version of the manuscript.

Funding

This research was funded by the Croatian waters, under the project “Planning and design of fish passes” (grant number 10-063/17).

Data Availability Statement

The data presented in this study are available on request from the corresponding author. The data are not publicly available due to privacy restrictions by the grant contract.

Conflicts of Interest

The authors declare no conflict of interest.

List of Symbols and Abbreviations

i075fishway configuration with bottom slope of 7.5%
i100fishway configuration with bottom slope of 10%
i125fishway configuration with bottom slope of 12.5%
l45fishway configuration with pool length of 45 cm
l60fishway configuration with pool length of 60 cm
l90fishway configuration with pool length of 90 cm
o8pool-orifice fishway configuration with orifice size of 8 cm × 8 cm
o10pool-orifice fishway configuration with orifice size of 10 cm × 10 cm
o12pool-orifice fishway configuration with orifice size of 12 cm × 12 cm
Plane Aplane parallel to the fishway bottom near the surface of the flow
Plane Bplane parallel to the fishway bottom in the middle of the flow
Plane Cplane parallel to the fishway bottom near the bottom of the pool
POpool-orifice fishway
RSSReynold’s shear stress
VSvertical slot fishway
ustreamwise velocity component [m/s]
ufluctuation of the streamwise velocity component u [m/s]
vspanwise velocity component v [m/s]
vfluctuation of the spanwise velocity component v [m/s]
wvertical velocity component w [m/s]
wfluctuation of the vertical velocity component w [m/s]
ρwater density [kg/m3]
τuwReynold’s shear stress in the streamwise plane [N/m2]
τuvReynold’s shear stress in the horizontal plane [N/m2]
τvwReynold’s shear stress in the vertical plane [N/m2]

References

  1. Fehér, J.; Gáspár, J.; Veres, K.S.; Kiss, A.; Kristensen, P.; Peterlin, M.; Globevnik, L.; Kirn, T.; Semerádová, S.; Künitzer, A.; et al. Hydromorphological Alterations and Pressures in European Rivers, Lakes, Transitional and Coastal Waters; European Topic Centre on Inland, Coastal and Marine Waters CENIA: Prague, Czech Republic, 2012; p. 76. [Google Scholar]
  2. Nilsson, C.; Reidy, C.A.; Dynesius, M.; Revenga, C. Fragmentation and flow regulation of the world’s large river systems. Science 2005, 5720, 405–408. [Google Scholar] [CrossRef] [Green Version]
  3. Tickner, D.; Opperman, J.J.; Abell, R.; Acreman, M.; Arthington, A.H.; Bunn, S.E.; Cooke, S.J.; Dalton, J.; Darwall, W.; Edwards, G.; et al. Bending the Curve of Global Freshwater Biodiversity Loss: An Emergency Recovery Plan. BioScience 2020, 70, 330–342. [Google Scholar] [CrossRef] [PubMed]
  4. Binder, T.R.; Cooke, S.J.; Hinch, S.G. The Biology of Fish Migration. In Encyclopedia of Fish Physiology: From Genome to Environment; Farrell, A.P., Ed.; Academic Press: San Diego, CA, USA, 2011; pp. 1921–1927. [Google Scholar]
  5. Grill, G.; Lehner, B.; Thieme, M.; Geenen, B.; Tickner, D.; Antonelli, F.; Babu, S.; Borrelli, P.; Cheng, L.; Crochetiere, H.; et al. Mapping the world’s free-flowing rivers. Nature 2019, 569, 215–221. [Google Scholar] [CrossRef] [PubMed]
  6. Dynesius, M.; Nilsson, C. Fragmentation and Flow Regulation of River Systems in the Northern Third of the World. Science 1994, 266, 753–762. [Google Scholar] [CrossRef] [PubMed]
  7. IPBES. Global Assessment Report on Biodiversity and Ecosystem Services; Intergovernmental Science-Policy Platform on Biodiversity and Ecosystem Services: Bonn, Germany, 2019; p. 56.
  8. EEA. WISE-WFD Database: European Waters—Assessment of Status and Pressures; European Environment Agency: Luxembourg, 2021. [Google Scholar]
  9. Freyhof, J.; Bergner, L.; Ford, M. Threatened Freshwater Fishes of the Mediterranean Basin Biodiversity Hotspot: Distribution, Extinction Risk and the Impact of Hydropower; EuroNatur and RiverWatch: Radolfzell, Germany; Vienna, Austria, 2020; p. 350. [Google Scholar]
  10. Kriechbaumer, T. Field-Based Measurement of Hydrodynamics Associated with Engineered in-Channel Structures: The Example of Fish Pass Assessment; Cranfield University: Bedford, UK, 2016. [Google Scholar]
  11. Franklin, A. Evaluation of Nature-Like and Technical Fish Passes for the Passage of Alewife (Alosa pseudoharengus) at Two Coastal Streams in New England; University of Massachusetts Amherst: Massachusetts, MA, USA, 2009. [Google Scholar]
  12. Fuentes-Pérez, J.F.; Silva, A.T.; Tuhtan, J.A.; García-Vega, A.; Carbonell-Baeza, R.; Musall, M.; Kruusmaa, M. 3D modelling of non-uniform and turbulent flow in vertical slot fishways. Environ. Model. Softw. 2018, 99, 156–169. [Google Scholar] [CrossRef]
  13. Katopodis, C. Introduction to Fishway Design; Freshwater Institute, Central and Arctic Region, Department of Fisheries and Oceans: Winnipeg, MB, Canada, 1992. [Google Scholar]
  14. Romão, F.; Quaresma, A.L.; Santos, J.M.; Amaral, S.D.; Branco, P.; Pinheiro, A.N. Multislot Fishway Improves Entrance Performance and Fish Transit Time over Vertical Slots. Water 2021, 13, 275. [Google Scholar] [CrossRef]
  15. Pena, L.; Puertas, J.; Bermúdez, M.; Cea, L.; Pena, E. Conversion of Vertical Slot Fishways to Deep Slot Fishways to Maintain Operation during Low Flows: Implications for Hydrodynamics. Sustainability 2018, 10, 2406. [Google Scholar] [CrossRef] [Green Version]
  16. Lupandin, A.I. Effect of Flow Turbulence on Swimming Speed of Fish. Biol. Bull. 2005, 32, 461–466. [Google Scholar] [CrossRef]
  17. Silva, A.T.; Katopodis, C.; Santos, J.M.; Ferreira, M.T.; Pinheiro, A.N. Cyprinid swimming behaviour in response to turbulent flow. Ecol. Eng. 2012, 44, 314–328. [Google Scholar] [CrossRef] [Green Version]
  18. Webb, P.W.; Weihs, D. Stability versus Maneuvering: Challenges for Stability during Swimming by Fishes. Integr. Comp. Biol. 2015, 55, 753–764. [Google Scholar] [CrossRef] [Green Version]
  19. Tritico, H.M.; Cotel, A.J. The effects of turbulent eddies on the stability and critical swimming speed of creek chub (Semotilus atromaculatus). J. Exp. Biol. 2010, 213, 2284–2293. [Google Scholar] [CrossRef] [Green Version]
  20. Bermúdez, M.; Puertas, J.; Cea, L.; Pena, L.; Balairón, L. Influence of pool geometry on the biological efficiency of vertical slot fishways. Ecol. Eng. 2010, 36, 1355–1364. [Google Scholar] [CrossRef]
  21. Hinch, S.G.; Rand, P.S. Optimal swimming speeds and forward-assisted propulsion: Energy-conserving behaviours of upriver-migrating adult salmon. Can. J. Fish. Aquat. Sci. 2000, 57, 2470–2478. [Google Scholar] [CrossRef]
  22. Liao, J.C.; Beal, D.N.; Lauder, G.V.; Triantafyllou, M.S. Fish Exploiting Vortices Decrease Muscle Activity. Science 2003, 302, 1566–1569. [Google Scholar] [CrossRef]
  23. Gao, Z.; Andersson, H.I.; Dai, H.; Jiang, F.; Zhao, L. A new Eulerian–Lagrangian agent method to model fish paths in a vertical slot fishway. Ecol. Eng. 2016, 88, 217–225. [Google Scholar] [CrossRef] [Green Version]
  24. Cotel, A.J.; Webb, P.W. Living in a Turbulent World—A New Conceptual Framework for the Interactions of Fish and Eddies. Integr. Comp. Biol. 2015, 55, 662–672. [Google Scholar] [CrossRef] [Green Version]
  25. Fuentes-Pérez, J.F.; Sanz-Ronda, F.J.; de Azagra, A.M.; García-Vega, A. Non-uniform hydraulic behavior of pool-weir fishways: A tool to optimize its design and performance. Ecol. Eng. 2016, 86, 5–12. [Google Scholar] [CrossRef]
  26. O’Connor, J.; Stuart, I.; Jones, M. Guidelines for the Design, Approval and Construction of Fishways; Arthur Rylah Institute for Environmental Research and Department of Environment, Land, Water and Planning: Melbourne, Australia, 2017; p. 60. [Google Scholar]
  27. Khodier, M.A.; Tullis, B.P. Fish Passage Behavior for Severe Hydraulic Conditions in Baffled Culverts. J. Hydraul. Eng. 2014, 140, 322–327. [Google Scholar] [CrossRef]
  28. Calluaud, D.; Pineau, G.; Texier, A.; David, L. Modification of vertical slot fishway flow with a supplementary cylinder. J. Hydraul. Res. 2014, 52, 614–629. [Google Scholar] [CrossRef]
  29. Plaut, I. Critical swimming speed: Its ecological relevance. Comp. Biochem. Physiol. Part A Mol. Integr. Physiol. 2001, 131, 41–50. [Google Scholar] [CrossRef]
  30. Marriner, B.A.; Baki, A.B.M.; Zhu, D.Z.; Thiem, J.D.; Cooke, S.J.; Katopodis, C. Field and numerical assessment of turning pool hydraulics in a vertical slot fishway. Ecol. Eng. 2014, 63, 88–101. [Google Scholar] [CrossRef]
  31. Branco, P.; Santos, J.M.; Katopodis, C.; Pinheiro, A.; Ferreira, M.T. Pool-type fishways: Two different morpho-ecological cyprinid species facing plunging and streaming flows. PLoS ONE 2013, 8, e65089. [Google Scholar] [CrossRef] [PubMed]
  32. Li, Y.; Wang, X.; Xuan, G.; Liang, D. Effect of parameters of pool geometry on flow characteristics in low slope vertical slot fishways. J. Hydraul. Res. 2020, 58, 395–407. [Google Scholar] [CrossRef]
  33. An, R.; Li, J.; Liang, R.; Tuo, Y. Three-dimensional simulation and experimental study for optimising a vertical slot fishway. J. Hydro-Environ. Res. 2016, 12, 119–129. [Google Scholar] [CrossRef]
  34. Quaranta, E.; Katopodis, C.; Revelli, R.; Comoglio, C. Turbulent flow field comparison and related suitability for fish passage of a standard and a simplified low-gradient vertical slot fishway. River Res. Appl. 2017, 33, 1295–1305. [Google Scholar] [CrossRef]
  35. Bombač, M.; Novak, G.; Mlačnik, J.; Četina, M. Extensive field measurements of flow in vertical slot fishway as data for validation of numerical simulations. Ecol. Eng. 2015, 84, 476–484. [Google Scholar] [CrossRef]
  36. Guo, Z.; Sun, X.; Dong, Z. An Experimental Study of Turbulent Structures in a Flat-Crested Weir-Type Fishway. Appl. Sci. 2019, 9, 40. [Google Scholar] [CrossRef] [Green Version]
  37. Yagci, O. Hydraulic aspects of pool-weir fishways as ecologically friendly water structure. Ecol. Eng. 2010, 36, 36–46. [Google Scholar] [CrossRef]
  38. Duguay, J.M.; Lacey, R.W.J.; Gaucher, J. A case study of a pool and weir fishway modeled with OpenFOAM and FLOW-3D. Ecol. Eng. 2017, 103, 31–42. [Google Scholar] [CrossRef]
  39. Cotel, A.J.; Webb, P.W. The Challenge of Understanding and Quantifying Fish Responses to Turbulence-Dominated Physical Environments. In Proceedings of the Natural Locomotion in Fluids and on Surfaces, Minneapolis, MN, USA, 1–5 June 2010; Childress, S., Hosoi, A., Schultz, W.W., Wang, J., Eds.; Springer: New York, NY, USA, 2012; pp. 15–33. [Google Scholar]
  40. Noonan, M.J.; Grant, J.W.A.; Jackson, C.D. A quantitative assessment of fish passage efficiency. Fish Fish. 2012, 13, 450–464. [Google Scholar] [CrossRef]
  41. Hatry, C.; Binder, T.R.; Thiem, J.D.; Hasler, C.T.; Smokorowski, K.E.; Clarke, K.D.; Katopodis, C.; Cooke, S.J. The status of fishways in Canada: Trends identified using the national CanFishPass database. Rev. Fish Biol. Fish. 2013, 23, 271–281. [Google Scholar] [CrossRef]
  42. Maerten, E.; Eens, M.; Knaepkens, G. Performance of a pool-and-weir fish pass for small bottom-dwelling freshwater fish species in a regulated lowland river. Anim. Biol. 2007, 57, 423–432. [Google Scholar] [CrossRef]
  43. Rossi, J.B.; Sanagiotto, D.G. Pool-type Fishway with Orifices: 3D Numerical Simulation of the Flow. J. Multidiscip. Eng. Sci. Technol. 2020, 7, 12293–12300. [Google Scholar]
  44. Larinier, M. Pool fishways, pre-barrages and natural bypass channels. Bull. Français De La Pêche Et De La Piscic. 2002, 364, 54–82. [Google Scholar] [CrossRef] [Green Version]
  45. Wu, S.; Rajaratnam, N.; Katopodis, C. Structure of Flow in Vertical Slot Fishway. J. Hydraul. Eng. 1999, 125, 351–360. [Google Scholar] [CrossRef]
  46. Ordeix, M.; Pou-Rovira, Q.; Sellares, N.; Bardina, M.; Casamitjana, A.; Sola, C.; Munne, A. Fish pass assessment in the rivers of Catalonia (NE Iberian Peninsula). A case study of weirs associated with hydropower plants and gauging stations. Limnetica 2011, 30, 405–426. [Google Scholar] [CrossRef]
  47. Stephens, T.A.; Bledsoe, B.P.; Fox, B.D.; Kolden, E.; Kondratieff, M.C. Effects of whitewater parks on fish passage: A spatially explicit hydraulic analysis. Ecol. Eng. 2015, 83, 305–318. [Google Scholar] [CrossRef] [Green Version]
  48. Schilt, C.R. Developing fish passage and protection at hydropower dams. Appl. Anim. Behav. Sci. 2007, 104, 295–325. [Google Scholar] [CrossRef]
  49. Belletti, B.; Garcia de Leaniz, C.; Jones, J.; Bizzi, S.; Börger, L.; Segura, G.; Castelletti, A.; van de Bund, W.; Aarestrup, K.; Barry, J.; et al. More than one million barriers fragment Europe’s rivers. Nature 2020, 588, 436–441. [Google Scholar] [CrossRef]
  50. Szabo-Meszaros, M.; Navaratnam, C.U.; Aberle, J.; Silva, A.T.; Forseth, T.; Calles, O.; Fjeldstad, H.-P.; Alfredsen, K. Experimental hydraulics on fish-friendly trash-racks: An ecological approach. Ecol. Eng. 2018, 113, 11–20. [Google Scholar] [CrossRef]
  51. Odeh, M.; Noreika, J.F.; Haro, A.; Maynard, A.; Castro-Santos, T.; Cada, G.F. Evaluation of the Effects of Turbulence on the Behavior of Migratory Fish; U.S. Department of Energy: Portland, OR, USA, 2002; p. 46.
  52. Silva, A.T.; Santos, J.M.; Ferreira, M.T.; Pinheiro, A.N.; Katopodis, C. Effects of water velocity and turbulence on the behaviour of Iberian barbel (Luciobarbus bocagei, Steindachner 1864) in an experimental pool-type fishway. River Res. Appl. 2011, 27, 360–373. [Google Scholar] [CrossRef]
  53. Santos, J.M.; Silva, A.; Katopodis, C.; Pinheiro, P.; Pinheiro, A.; Bochechas, J.; Ferreira, M.T. Ecohydraulics of pool-type fishways: Getting past the barriers. Ecol. Eng. 2012, 48, 38–50. [Google Scholar] [CrossRef]
  54. FAO. Fish Passes–Design, Dimensions and Monitoring; Food and Agriculture Organization of the United Nations: Rome, Italy, 2002; p. 119. [Google Scholar]
  55. Armstrong, G.S.; Aprahamian, M.W.; Fewings, G.A.; Gough, P.J.; Reader, N.A.; Varallo, P.V. Environment Agency Fish Pass Manual: Guidance Notes on the Legislation, Selection and Approval of Fish Passes in England And Wales; GEHO 0910 BTBP-E-E; Almondsbury: Bristol, UK, 2010; p. 369. [Google Scholar]
  56. Mallen-Cooper, M. Taking the mystery out of migration. In Proceedings of the Workshop on Fish Movement and Migration, Bendigo, Australia, 28–29 September 1999; Hancock, D.A., Smith, D.C., Koehn, J.D., Eds.; Australian Society for Fish Biology: Bendigo, Australia, 2000; pp. 101–111. [Google Scholar]
  57. Tarrade, L.; Texier, A.; David, L.; Larinier, M. Topologies and measurements of turbulent flow in vertical slot fishways. Hydrobiologia 2008, 609, 177. [Google Scholar] [CrossRef] [Green Version]
  58. Kucukali, S. Flow and Turbulence Measurements in a Diagonal Brush Fish Pass: A Field Study. In Proceedings of the 7th IAHR International Symposium on Hydraulic Structures, Aachen, Germany, 15–18 May 2018. [Google Scholar]
  59. Hogan, Z. Review of Migratory Freshwater Fish. In Proceedings of the Convention on Migratory Species, Bergen, Norway, 20–25 November 2011; p. 37. [Google Scholar]
  60. Gilja, G.; Ocvirk, E.; Cikojević, A. Experimental investigation of flow field in a physical fishway model. In Proceedings of the 16th International Symposium Water Management & Hydraulic Engineering WMHE 2019, Skopje, North Macedonia, 5–7 September 2019; pp. 1–12. [Google Scholar]
  61. Ocvirk, E.; Gilja, G.; Bujak, D.; Cikojević, A.; Jelić, D. Nomogrami za proračun funkcionalnosti tehničkih ribljih staza na malim pragovima. Hrvat. Vode 2020, 28, 9–20. [Google Scholar]
  62. Baki Abul Basar, M.; Zhu David, Z.; Rajaratnam, N. Turbulence Characteristics in a Rock-Ramp-Type Fish Pass. J. Hydraul. Eng. 2015, 141, 04014075. [Google Scholar] [CrossRef]
  63. Wahl, T.L. Analyzing ADV Data Using WinADV. In Proceedings of the Joint Conference on Water Resources Engineering and Water Resources Planning & Management, Minneapolis, MN, USA, 30 July–2 August 2000; pp. 1–10. [Google Scholar]
  64. Martin, V.; Fisher, T.S.R.; Millar, R.G.; Quick, M.C. ADV Data Analysis for Turbulent Flows: Low Correlation Problem. In Proceedings of the Hydraulic Measurements and Experimental Methods Specialty Conference, Estes Park, CO, USA, 28 July–1 August 2002; pp. 1–10. [Google Scholar]
  65. Jesson, M.A.; Bridgeman, J.; Sterling, M. Novel software developments for the automated post-processing of high volumes of velocity time-series. Adv. Eng. Softw. 2015, 89, 36–42. [Google Scholar] [CrossRef] [Green Version]
  66. Goring, D.G.; Nikora, V.I. Despiking Acoustic Doppler Velocimeter Data. J. Hydraul. Eng. 2002, 128, 117–126. [Google Scholar] [CrossRef] [Green Version]
  67. Wahl, T.L. Discussion of ‘‘Despiking Acoustic Doppler Velocimeter Data’’ by Derek G. Goring and Vladimir I. Nikora. J. Hydraul. Eng. 2003, 129, 484–487. [Google Scholar] [CrossRef] [Green Version]
Figure 1. Examples of built technical fishways in Europe: (a) at HPP Rosegg and (b) at HPP Weissach (photo by E. Ocvirk).
Applsci 11 07708 g001
Figure 2. Scheme of the physical model setup in the hydraulic flume.
Applsci 11 07708 g002
Figure 3. Model setup in the flume: (a) flume with the installed fishway bottom—looking downstream, (b) pool-orifice fishway model—looking upstream, (c) vertical slot fishway model—looking downstream (photos by G. Gilja).
Applsci 11 07708 g003
Figure 4. Structured raster of the measurement points in (a) pool-orifice fishway, (b) vertical slot fishway.
Applsci 11 07708 g004
Figure 5. 3D scatterplot of concurrent RSS components for the i125l45 fishway configuration: (a) pool-orifice type fishway and (b) vertical slot fishway.
Applsci 11 07708 g005
Figure 6. 3D scatterplot of concurrent RSS components for the i125l60 fishway configuration: (a) pool-orifice type fishway and (b) vertical slot fishway.
Applsci 11 07708 g006
Figure 7. 3D scatterplot of concurrent RSS components for the i125l90 fishway configuration: (a) pool-orifice type fishway and (b) vertical slot fishway.
Applsci 11 07708 g007
Figure 8. 3D scatterplot of concurrent RSS components for the i100l45 fishway configuration: (a) pool-orifice type fishway and (b) vertical slot fishway.
Applsci 11 07708 g008
Figure 9. 3D scatterplot of concurrent RSS components for the i100l60 fishway configuration: (a) pool-orifice type fishway and (b) vertical slot fishway.
Applsci 11 07708 g009
Figure 10. 3D scatterplot of concurrent RSS components for the i100l90 fishway configuration: (a) pool-orifice type fishway and (b) vertical slot fishway.
Applsci 11 07708 g010
Figure 11. 3D scatterplot of concurrent RSS components for the i075l45 fishway configuration: (a) pool-orifice type fishway and (b) vertical slot fishway.
Applsci 11 07708 g011
Figure 12. 3D scatterplot of concurrent RSS components for the i075l60 fishway configuration: (a) pool-orifice type fishway and (b) vertical slot fishway.
Applsci 11 07708 g012
Figure 13. 3D scatterplot of concurrent RSS components for the i075l90 fishway configuration: (a) pool-orifice type fishway and (b) vertical slot fishway.
Applsci 11 07708 g013
Table 1. Fraction (%) of the Reynold’s shear stress values below disorientation/injury boundary in the main flow jet zone.
FishwayOrificeBottom Slope
i075i100i125
Pool Length
l45l60l90l45l60l90l45l60l90
POo887/9875/9281/9687/9691/9882/9374/9289/9381/94
o1056/8074/9358/8376/9071/9267/8377/9064/7963/87
o1263/8453/7945/7065/8255/7958/7664/8452/7551/76
VS 18/5927/4657/8223/5617/4262/7940/6232/6278/94
Table 2. Fraction (%) of the Reynold’s shear stress values below disorientation/injury boundary in the recirculation zone.
FishwayOrificeBottom Slope
i075i100i125
Pool Length
l45l60l90l45l60l90l45l60l90
POo897/10095/9994/9897/10096/9997/9992/9896/10098/99
o1082/9393/9882/9396/9991/9896/10092/9890/9794/99
o1287/9882/9576/9188/9783/9580/9489/9779/9286/96
VS 86/9666/8569/8993/9871/8569/8990/9777/9072/84
Publisher’s Note: MDPI stays neutral with regard to jurisdictional claims in published maps and institutional affiliations.

