Article

Spatial Concentration of Carbon Components in Indoor PM2.5 of School Classrooms in a Large City of Korea

Department of Environmental Applied Science, Kyung Hee University, Yongin 17104, Korea
*
Author to whom correspondence should be addressed.
Appl. Sci. 2021, 11(16), 7328; https://doi.org/10.3390/app11167328
Submission received: 16 June 2021 / Revised: 4 August 2021 / Accepted: 5 August 2021 / Published: 9 August 2021
(This article belongs to the Special Issue Advances in Monitoring and Modeling of Urban Air Quality)

Abstract

:
On increasing the importance of indoor air quality in urban schools of Korea, a comprehensive investigation of PM2.5 was carried out focusing on carbon contents. According to the analysis results, PM2.5 of the classrooms distributed 14.5 μg/m3 to 40.2 μg/m3, which was lower than National Guidelines (35 μg/m3 for 24 h average), and it contained 45.4 ± 10.9% of carbonaceous matters including organic carbon (OC) and elemental carbon (EC). Carbons were proportionally correlated with externally occurring ion species, but OC was found more inside (9.5 μg/m3) than outside (5.9 μg/m3). This indicates that school children are exposed to a variety of polymeric chemicals in the classroom. The current data obtained in this study can be used to inform the establishment of a national school air quality management policy.

1. Introduction

According to international inventories, most of atmospheric particulate carbons in large cities such as Seoul, Korea, come from combustion processes such as coal and fuel combustion, diesel exhausts, open burning at construction sites and residential areas [1,2]. These airborne particulates contain various components, some of which adversely affect human health. A field test on the urban roads revealed a proportional relationship between carbons and traffic amount [3]. In particular, morning rush hour traffic contributed 8–9% of the total elemental carbon (EC) in the local air.
There were several reports that PM10 levels ranged from 6.73 to 20.8 μg/m3 in schools far from the road, and from 9.20 to 32.8 μg/m3 in schools near the road [4,5]. Thus, the school children located in a crowded inner city face harsh environmental conditions. One reference emphasizes building conditions for maintaining safe indoor air quality especially in city schools [6]. The carbon content in macrophages of the respiratory tract is inversely associated with lung function particularly in children. Thus, the capacity and growth of school children respiratory systems near main roads are worse than those in remote areas [7]. Carbonaceous components occupy 10 to 40% of the aerosols suspended in urban atmosphere [8]. Mass fractions of organic carbon (OC) and EC in PM2.5 of downtown Seoul were 0.13 ± 0.06 and 0.05 ± 0.03 respectively [9]. In particular, EC which is mainly emitted from cars in large cities exists in the form of aggregates (0.1–1 μm) composed of tiny spherules ranging in size between 0.001 and 0.005 μm particles which belong to PM2.5 [10]. Since fine particulate carbons can contain various harmful substances, a particular attention should be paid to carbonaceous species.
It was found that the ratio of indoor to outdoor (I/O ratio) carbons varied from lower than 1 to 1.9 depending on indoor activities and source contributions [11]. Residents are at high risk of exposure from contaminants present in indoor spaces. In accordance, higher I/O ratio would be undesirable given the likely negative health effects for indoor occupants. Depending on the region and building conditions, approximately 40% of the mass of indoor PM2.5 consists of carbonaceous matters, and the OC mass fraction is two to five times higher than that of EC [8,12]. Among the government controlled indoor environments in public places, air quality of school classrooms where young students stay for a long time is particularly important.
There is a study carried out in China, emphasizing the importance of school air quality by tracking the OC sources around the school [13]. Most of school indoor EC are originated from air infiltration through unintentional leaks of building envelope and window gap or wall cracks as well as window openings. While some researches have been conducted on indoor air in private homes, little has been done on carbon levels in school classrooms [14].
Thus, to investigate carbonaceous aerosols in school environment, particulate matters such as PM2.5 and PM10 were sampled and quantitatively analyzed from classrooms and playgrounds. This study also focused on the daily class hours of students. The obtained data will be fruitfully used to inform the establishment of a national school environment management policy. Elementary schools are rarely open to the general public, even including academic researchers, but this time, a comprehensive investigation on air quality was allowed with the aid of the Ministry of Environment.

2. Experimental Design and Method

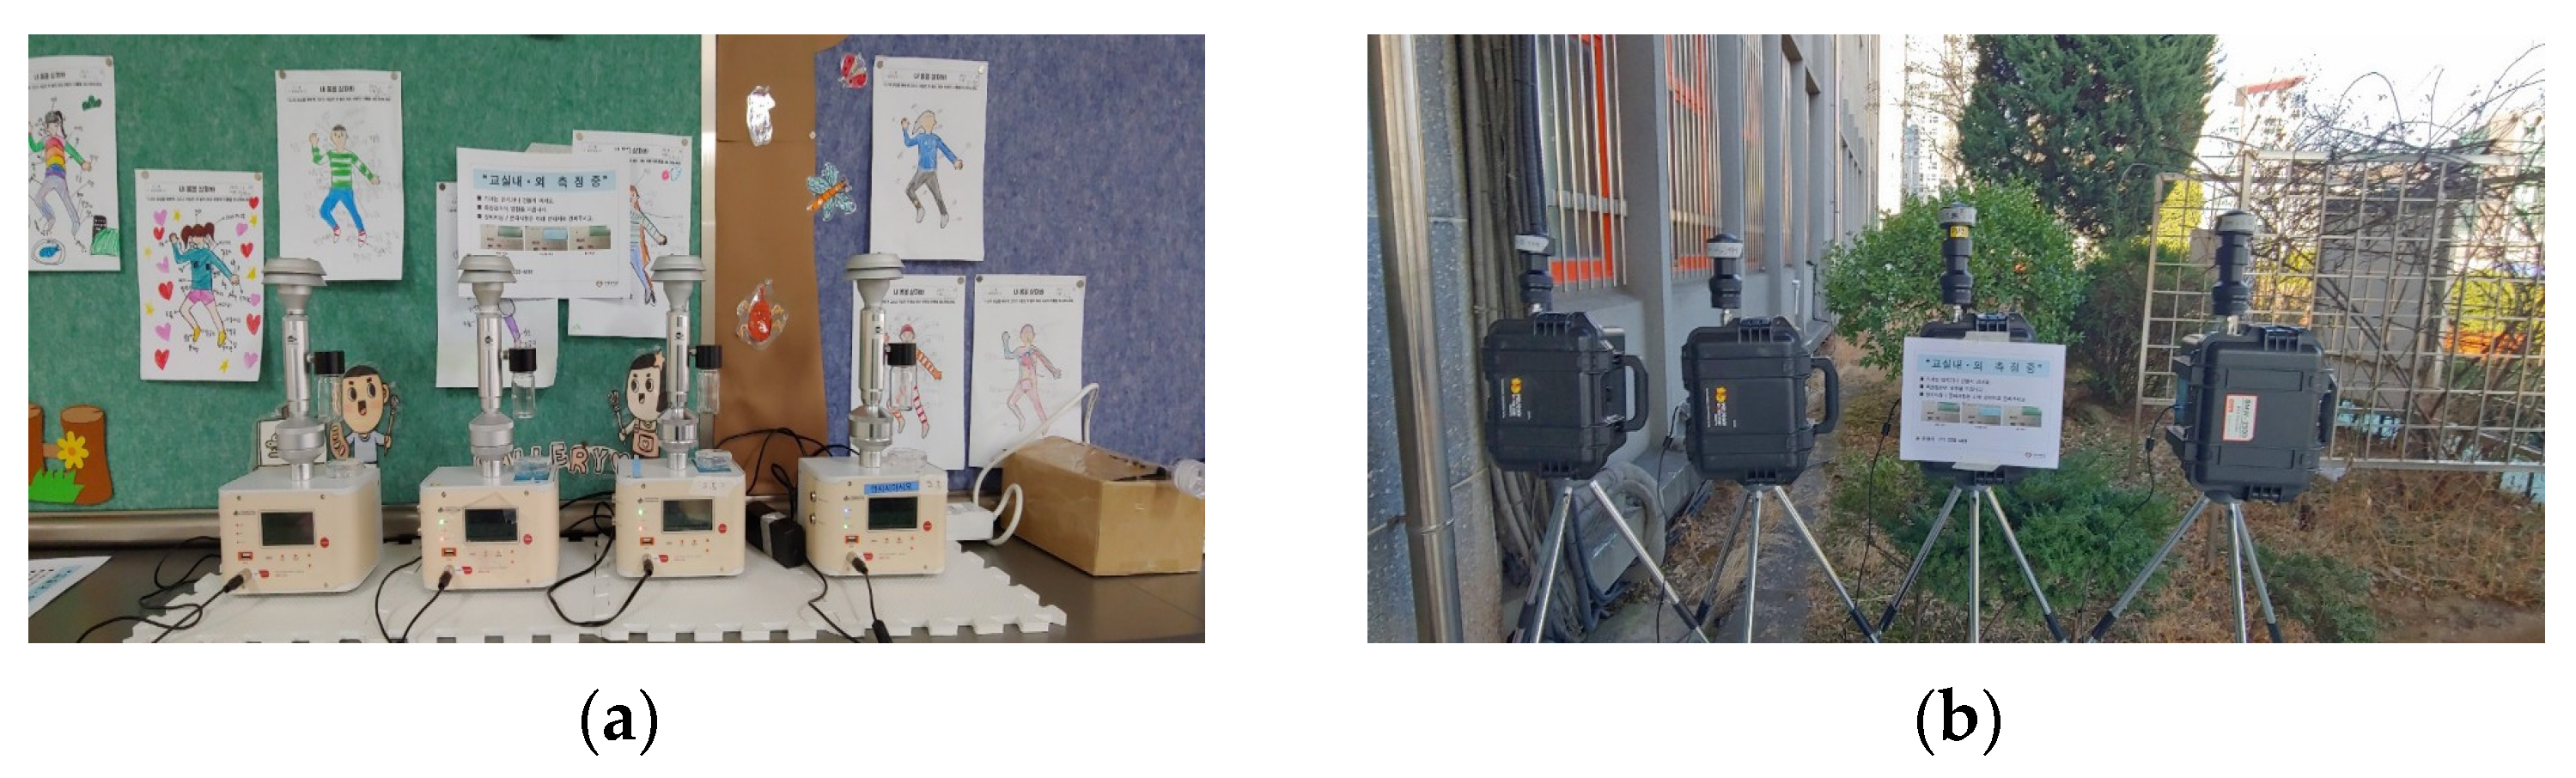
2.1. Site Description and Experimental Design

Five public elementary schools took part in the study, and 3–4 classrooms of each school were investigated. They are located between 137 m to 669 m from the main road. As summarized in Table 1, classroom capacity is 19–30 students in each school. The test period was from October 2019 to December 2019, which was the second semester of the fall season.
Airborne fine particulate matters (PM2.5 and PM10) were collected over an 8 h class period 4 days a week using Mini-volume samplers (7 L/min) (BMW-2500, Total Eng., Korea) inserted with 47 mm quartz filters for the analysis of ions and carbons, and Teflon filters for inorganic elements and mass concentration of particulate matters. Sampling was carried out inside the four classrooms of each school and outside in the immediate vicinity of the classroom windows at the same time, as shown in Figure 1b. Indoor samplers were placed at the back of the classroom, and the inlet was located 1.2 m from above the floor (Figure 1a). After gravimetric determination of PM2.5 and PM10, the filtered particulate matters were analyzed for chemical composition.

2.2. Measurement and Analysis

Before weighing, the filters were conditioned in a desiccator at least for 24 h in a temperature- and humidity-controlled chamber. After gravimetric determination of particle mass on an electronic microbalance (ME 5-F, Sartorius, Gottingen, Germany), inorganic elements including heavy metals were quantitatively analyzed by Energy Dispersive X-ray Fluorescence spectrometry (ED-XRF, ARL QUANT’X High Performance ED-XRF, ThermoFisher Scientific, Seoul, Korea) [15].
Ions were extracted from the particulate matters collected on a quartz filter in an ultrasonic bath. Five cations (Na+, NH4+, K+, Ca2+, Mg2+) and three anions (Cl, NO3, SO42−) were analyzed using an ion chromatography (Metrohm 930 & 883, Herisau, Switzerland). Bulk carbon contents such as organic carbon (OC) and elemental carbon (EC) were quantified with a TOT analyzer (Thermal/Optical Transmittance, Sunset Lab., Tigard, OR, USA). The concentration of OC was measured in a helium atmosphere at 31 °C to 840 °C, and the EC was measured in an oxygen atmosphere at 550 °C to 870 °C [16]. One punch of 1.5 cm2 was directly analyzed following the procedure reported in the protocol of the National Institute for Occupational Safety & Health (NIOSH 5040). Automatic split time was always used for the distinction between EC and pyrolyzed OC.
The obtained data were statistically correlated by the software package SPSS v15.0 for Windows. Possible relationships between elements and carbons were analyzed through a multivariate exploration of the data.

3. Results and Discussion

This study investigated how high the concentration of carbon components was present in elementary school classrooms in one of the most densely populated areas of Seoul. Roads in this area are always congested, and vehicle exhausts may deteriorate the school air quality. In accordance, carbons have been mainly studied in terms of some harmful elements such as ions and heavy metals absorbed in PM2.5.

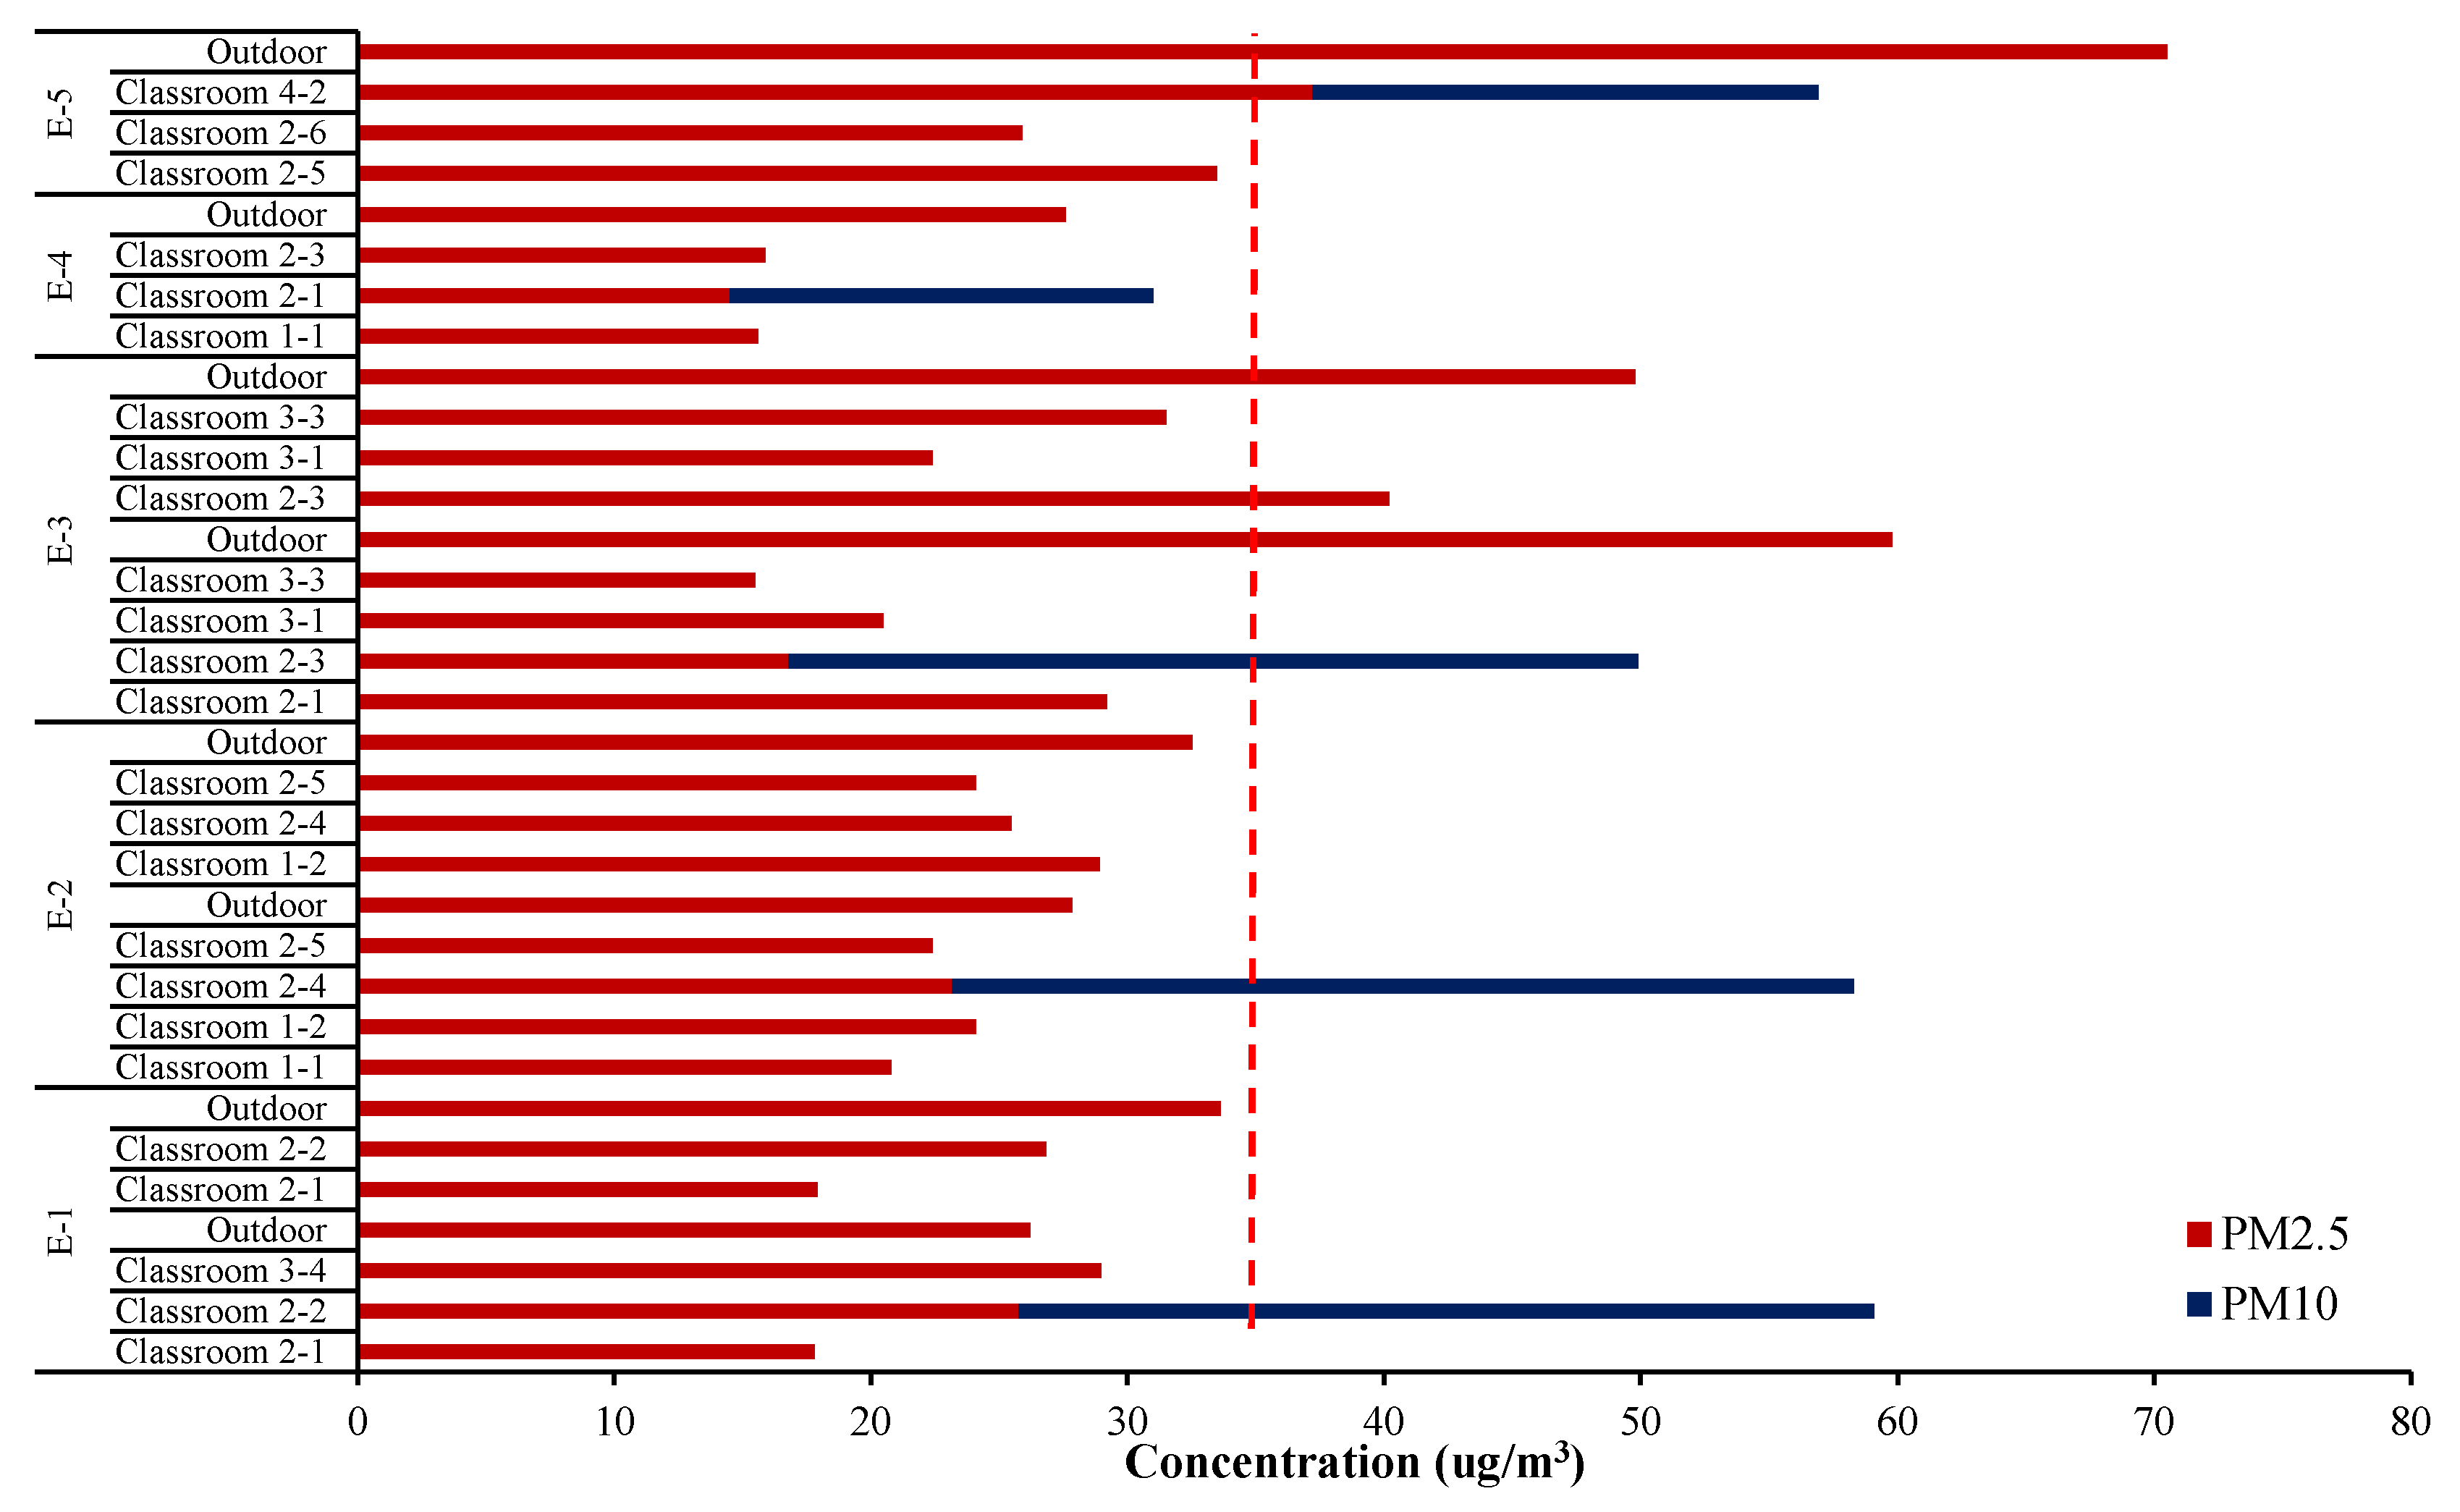
3.1. Characteristics of Indoor PM10 and PM2.5 in Schools

Samplings for indoor suspended particulate matters (PM10 and PM2.5) and outdoor (PM2.5) have been conducted from 30 min earlier than the first class to 1 h after the last class, usually continued for 8 h per day. The mass basis concentration of collected particulate matters was evaluated under the normal class program.
As can be seen from the summarized analysis in Figure 2, the indoor concentrations of the classroom averaged 24.2 ± 6.7 and 51.4 ± 10.2 μg/m3 for PM2.5 and PM10, respectively, while outdoor concentrations of PM2.5 averaged 41.0 ± 15.8 μg/m3 measured at a playground just outside the classrooms. Except for classroom 2-3 of school E-3, the PM2.5 concentration in most classrooms was lower than outdoors even though sampling was carried out during their stay. It was apparently lower than National Guidelines (24 h average, 35 μg/m3 and 100 μg/m3 for PM2.5 and PM10, respectively).
Although indoor fine particulate matters are generally introduced from outside, it was found in this study that indoor concentrations of PM2.5 did not show a proportional dependence on the outdoor. Air penetration through windows, doors and crack or gap of the wall relates closely with the condition of the school building. The indoor PM level is also determined by air purifier operation or ventilation as well as student activities. The difference between indoor and outdoor PM2.5 concentrations in school E-1 was not as high as in other schools, perhaps because the children were more active as well as frequent window opening. On the other hand, the E-5 was found to significantly lower indoor PM2.5, where teachers closed windows and operated air purifiers due to poor outdoor air quality outside.
In Korea, the atmospheric PM level in autumn is generally lower than in other seasons, in which barometric flow is fast and local atmospheric circulation is smooth, is usually lower than other seasons [11]. In practice, during the study period, the national monitoring network in the vicinity of the test schools presented very low average levels for outdoor PM2.5 and PM10, 14–66 μg/m3 and 29–90 μg/m3, respectively. No significant differences were observed in our measurement for outdoor PM2.5.

3.2. Chemical Composition of Indoor Particulate Matters
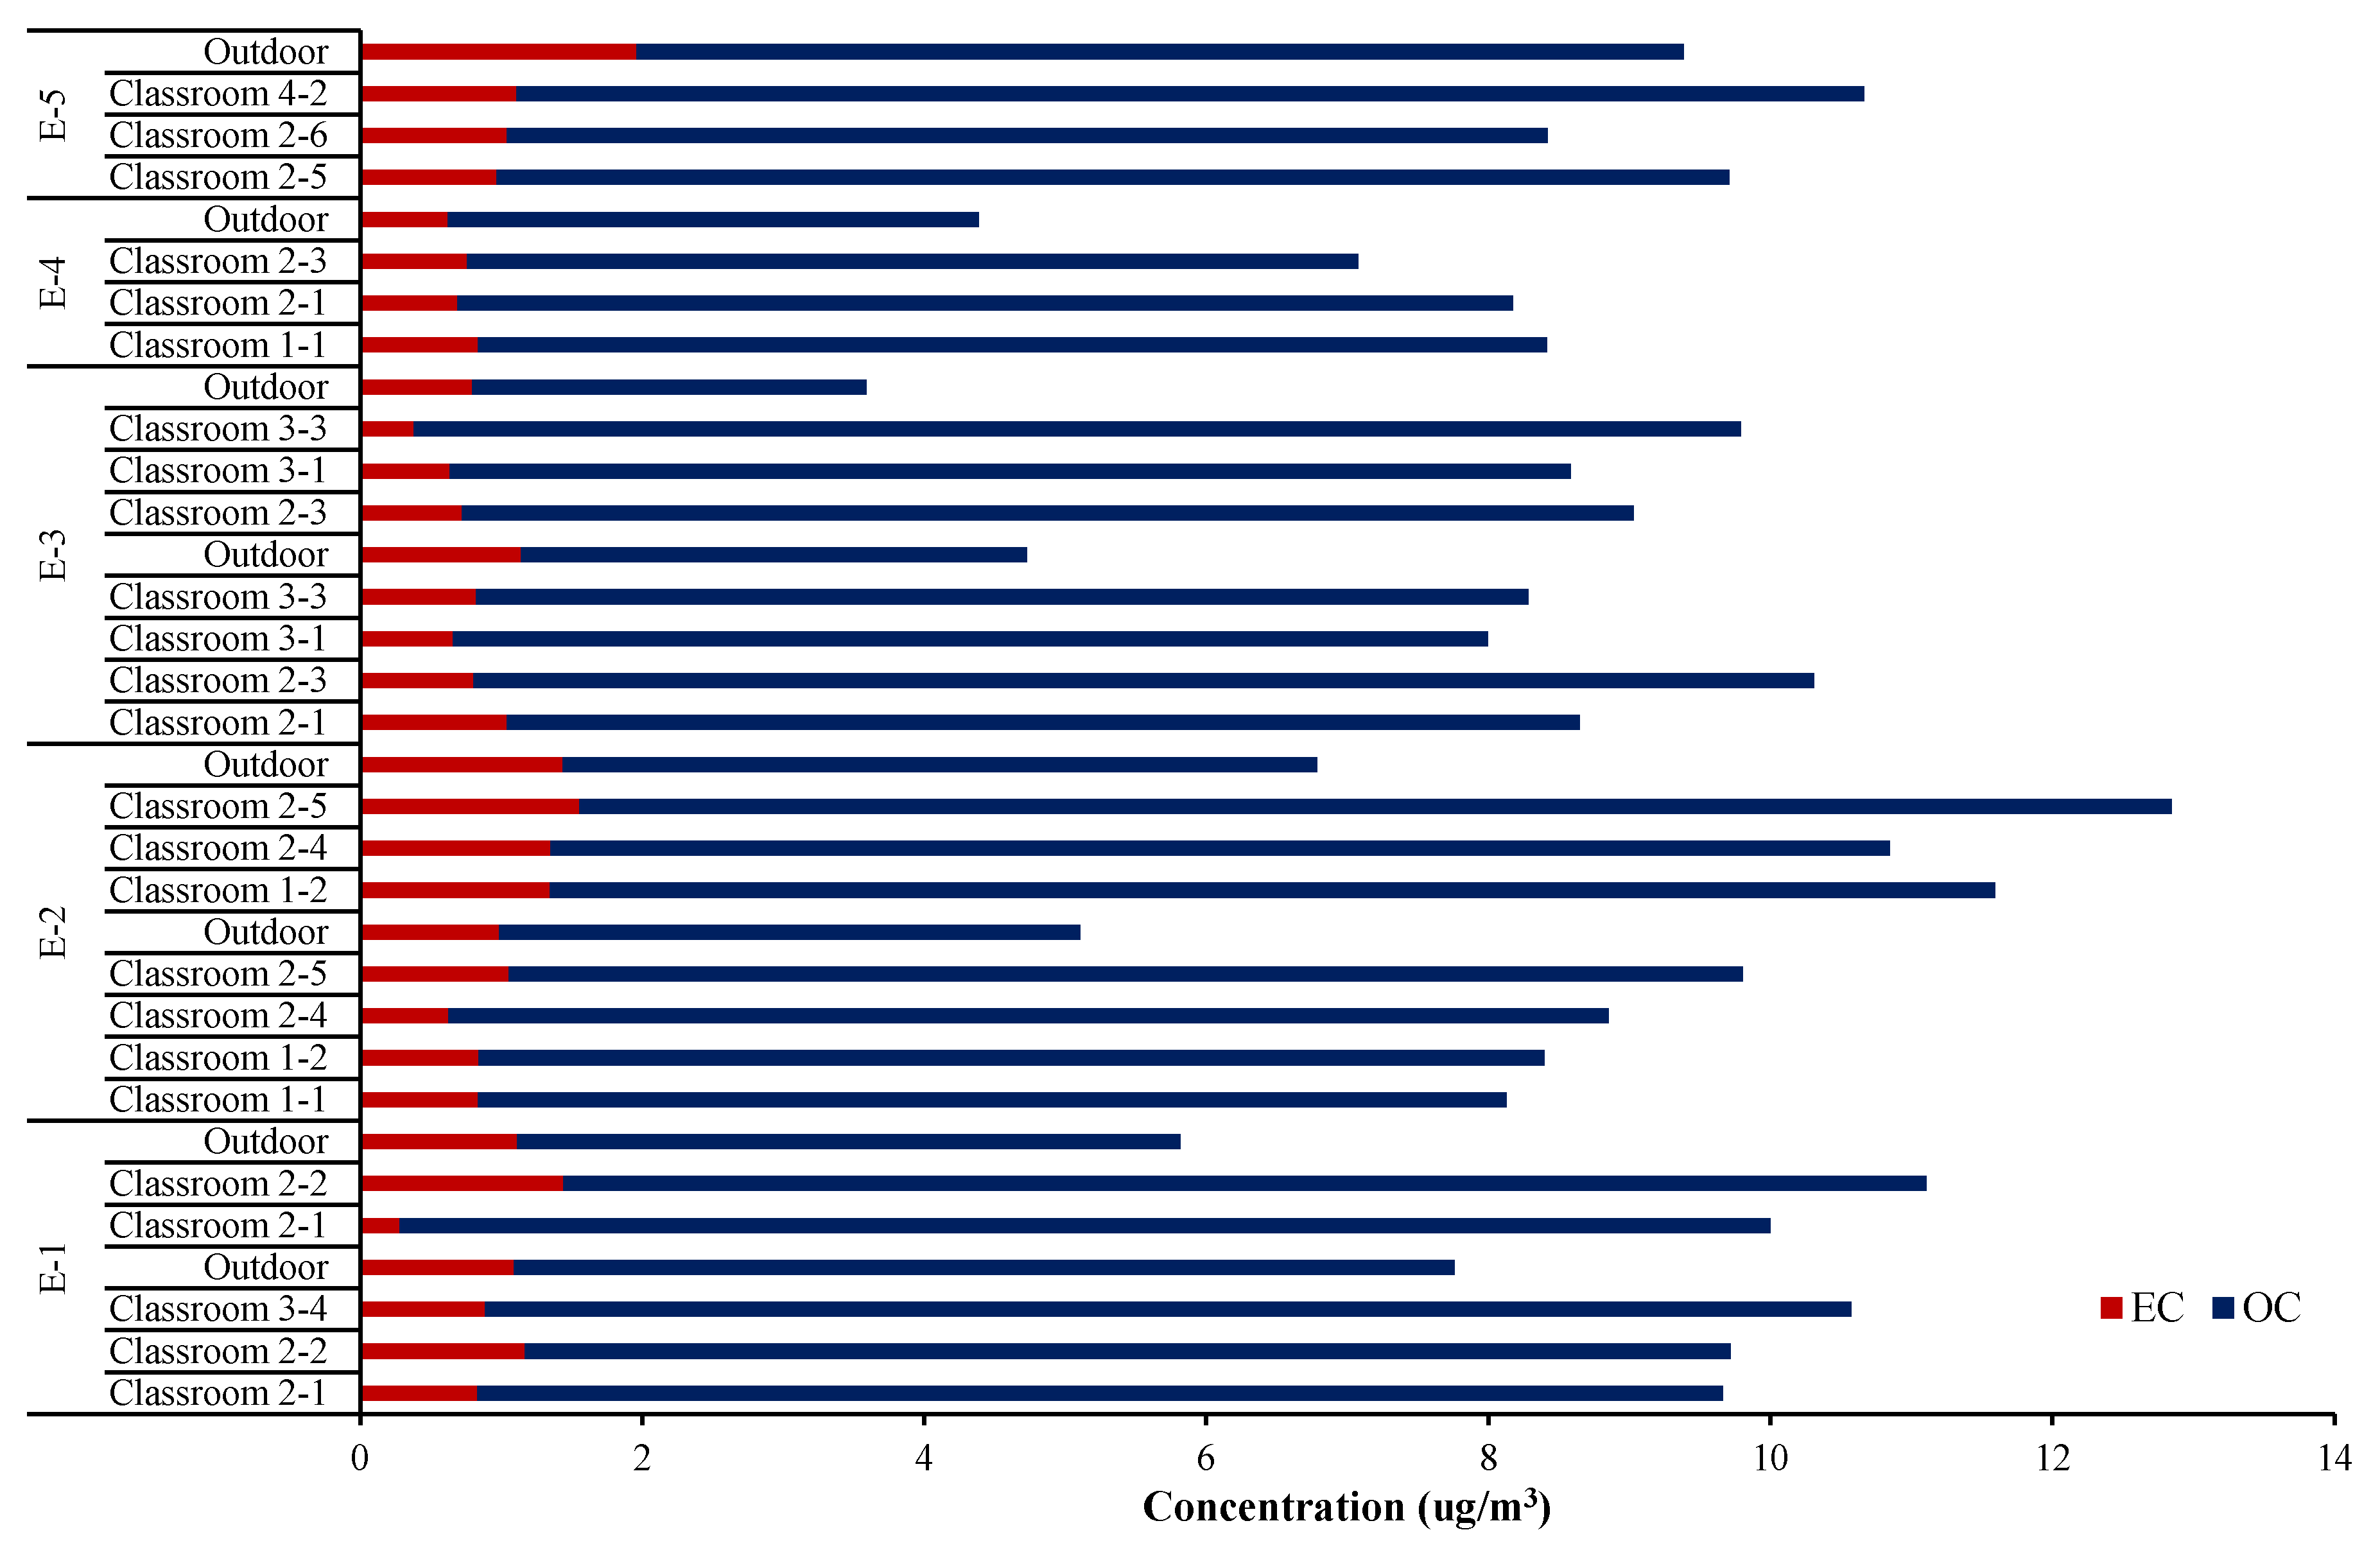
This study focused on chemicals derived from geological and anthropogenic origins in which significant amounts were detected. In particular, the materials known to be related to automobiles such as vehicle exhaust, motor oil combustion, brake and tire wear, and abrasion of mechanical parts of vehicles, were carefully observed. While indoor PM2.5 contained 59.4% of substances originating mainly from the earth crust (Al, Ca, Na, K, Fe, Si), anthropogenic substances (As, Ba, Cr, Cu, Pb, Ti, Zn) were analyzed with 2.7%, as summarized in Table 2. Substances such as sulfur (S) and chlorine (Cl) probably occurring from human activities as well as natural sources accounted for 33.7%. Sulfur, which is the most abundant element, was found maximum 1.417 μg/m3 and 3.805 μg/m3 in PM2.5 of indoor and outdoor, respectively. Sulfur in urban atmosphere occurs primarily during combustion, but often also comes from heavy vehicles, long-distance pollutants and open burning. Therefore, the amount of sulfur is estimated to be closely related to the concentration of EC.
Calcium (Ca) and chlorine (Cl) were found to be higher indoors than outdoors, indicating that, in addition to the infiltration from the outside, some emission sources are probably present in the classroom such as cleaning agents, paint and plastic debris [12]. Atmospheric Cl results usually from sea salt and decomposition of waste plastics.
Metals of iron (Fe), lead (Pb), manganese (Mn) and zinc (Zn) were on average lower in the indoor PM2.5, but the maximum concentration in some classrooms was as high as outdoor particulate matters. In particular, iron components arisen from various emission sources was highly found, up to 0.545 μg/m3 in indoor PM2.5.
Table 3 shows the list of ion components discovered in PM2.5. Ions such as NO3, SO42−, Cl, NH4+ and K+, formed mainly from anthropogenic sources and chemical reactions [17], were 5.03 μg/m3 in indoor PM2.5 and 13.25 μg/m3 in outdoor. Whereas, ions from natural sources and physical processes such as Na+, Mg2+ and Ca2+ were 0.98 μg/m3 in indoor PM2.5 and 0.99 μg/m3 in outdoor. Despite similar amount of indoor natural ions to outdoor ions, the absolute amount of artificial ions was found more in outdoor PM2.5. In particular, ions of nitrate and sulfate proved the automobiles as a major pollutant source. A typical urban cation, ammonium ion, also was abundant in outside. Significant amounts of ammonia are released from car exhausts due to excessive feed for the selective catalytic reduction (SCR) stage. The relative ratio of chlorine contained in indoor PM2.5 (3.8%) to outdoor (1.7%) was more than two as discussed above, implying presence of indoor emission sources such as polymer debris, stationeries and cleaning agents.

3.3. Carbon Content

Figure 3 shows carbon concentrations in indoor PM2.5 for each school. The total carbon fraction (OC and EC) accounted for average 45.4 ± 10.9% of the PM2.5 mass indoors, which was much higher than outdoor (19.3 ± 7.6%). The carbon component found predominantly both in indoor and outdoor PM2.5 was OC. Average OC concentration inside the classrooms for all the test schools was 9.47 μg/m3, contributing 41.5% of PM2.5. In particular, OC adsorbed on fine particles contains very harmful components including polyaromatic carbons (PAHs) [18]. Thus, more precise studies on OC through living lab tests are further required to verify the profound chemical composition.
While EC is generally thought to not undergo chemical transformation once emitted, organic carbon aerosols can be produced indoors through chemical transformation in addition to a variety of primary sources. While EC exists mostly in PM2.5; 0.91 ug/m3 for PM2.5 and 0.93 μg/m3 for PM10, OC is distributed from fine to large particles; 9.47 ug/m3 for PM2.5 and 12.76 μg/m3 for PM10. Thus, student activity in the classroom is one of the key factors influencing indoor OC levels. At the same time, various mechanisms of formation and decay cause large differences between classrooms even in the same school. For example, school E-2 showed 8.13 μg/m3 at classroom 1-1 and 12.84 μg/m3 at classroom 2-5, indicating 39.1 w/w% and 53.3 w/w%, respectively.
The PM2.5 sampled at school E-4 contained relatively high amounts of carbon (49.3–61.1%, averaging 56.6%). Sampling at school, E-4, was conducted in the first week of December, early winter, and seasonal variation might also influence the chemical composition. Above all, the school, E-4, is near the intersection of two main roads and one of the busiest stations in Seoul crossing the two lines. These seasonal and locational factors greatly dominate the carbon concentration in the classroom fine particulate matters.
On the other hand, the absolute amount of OC was approximately 3.5 to 10 times higher than EC in both indoor and outdoor PM2.5 as seen in other references [19,20,21]. The average OC/EC ratio for 25 classrooms in this study was 11.9, as already estimated from Figure 2. This ratio was obviously higher than in the outdoor (5.3). This relative value was high in E-1 showing 15.1, and least in E-2 (9.7). Unlike the study showing that both OC and EC are highly influenced by indoor sources [7], the current test school classrooms did not include any combustion activities. Thus, it is believed that most of the EC found in the classrooms came from outside.

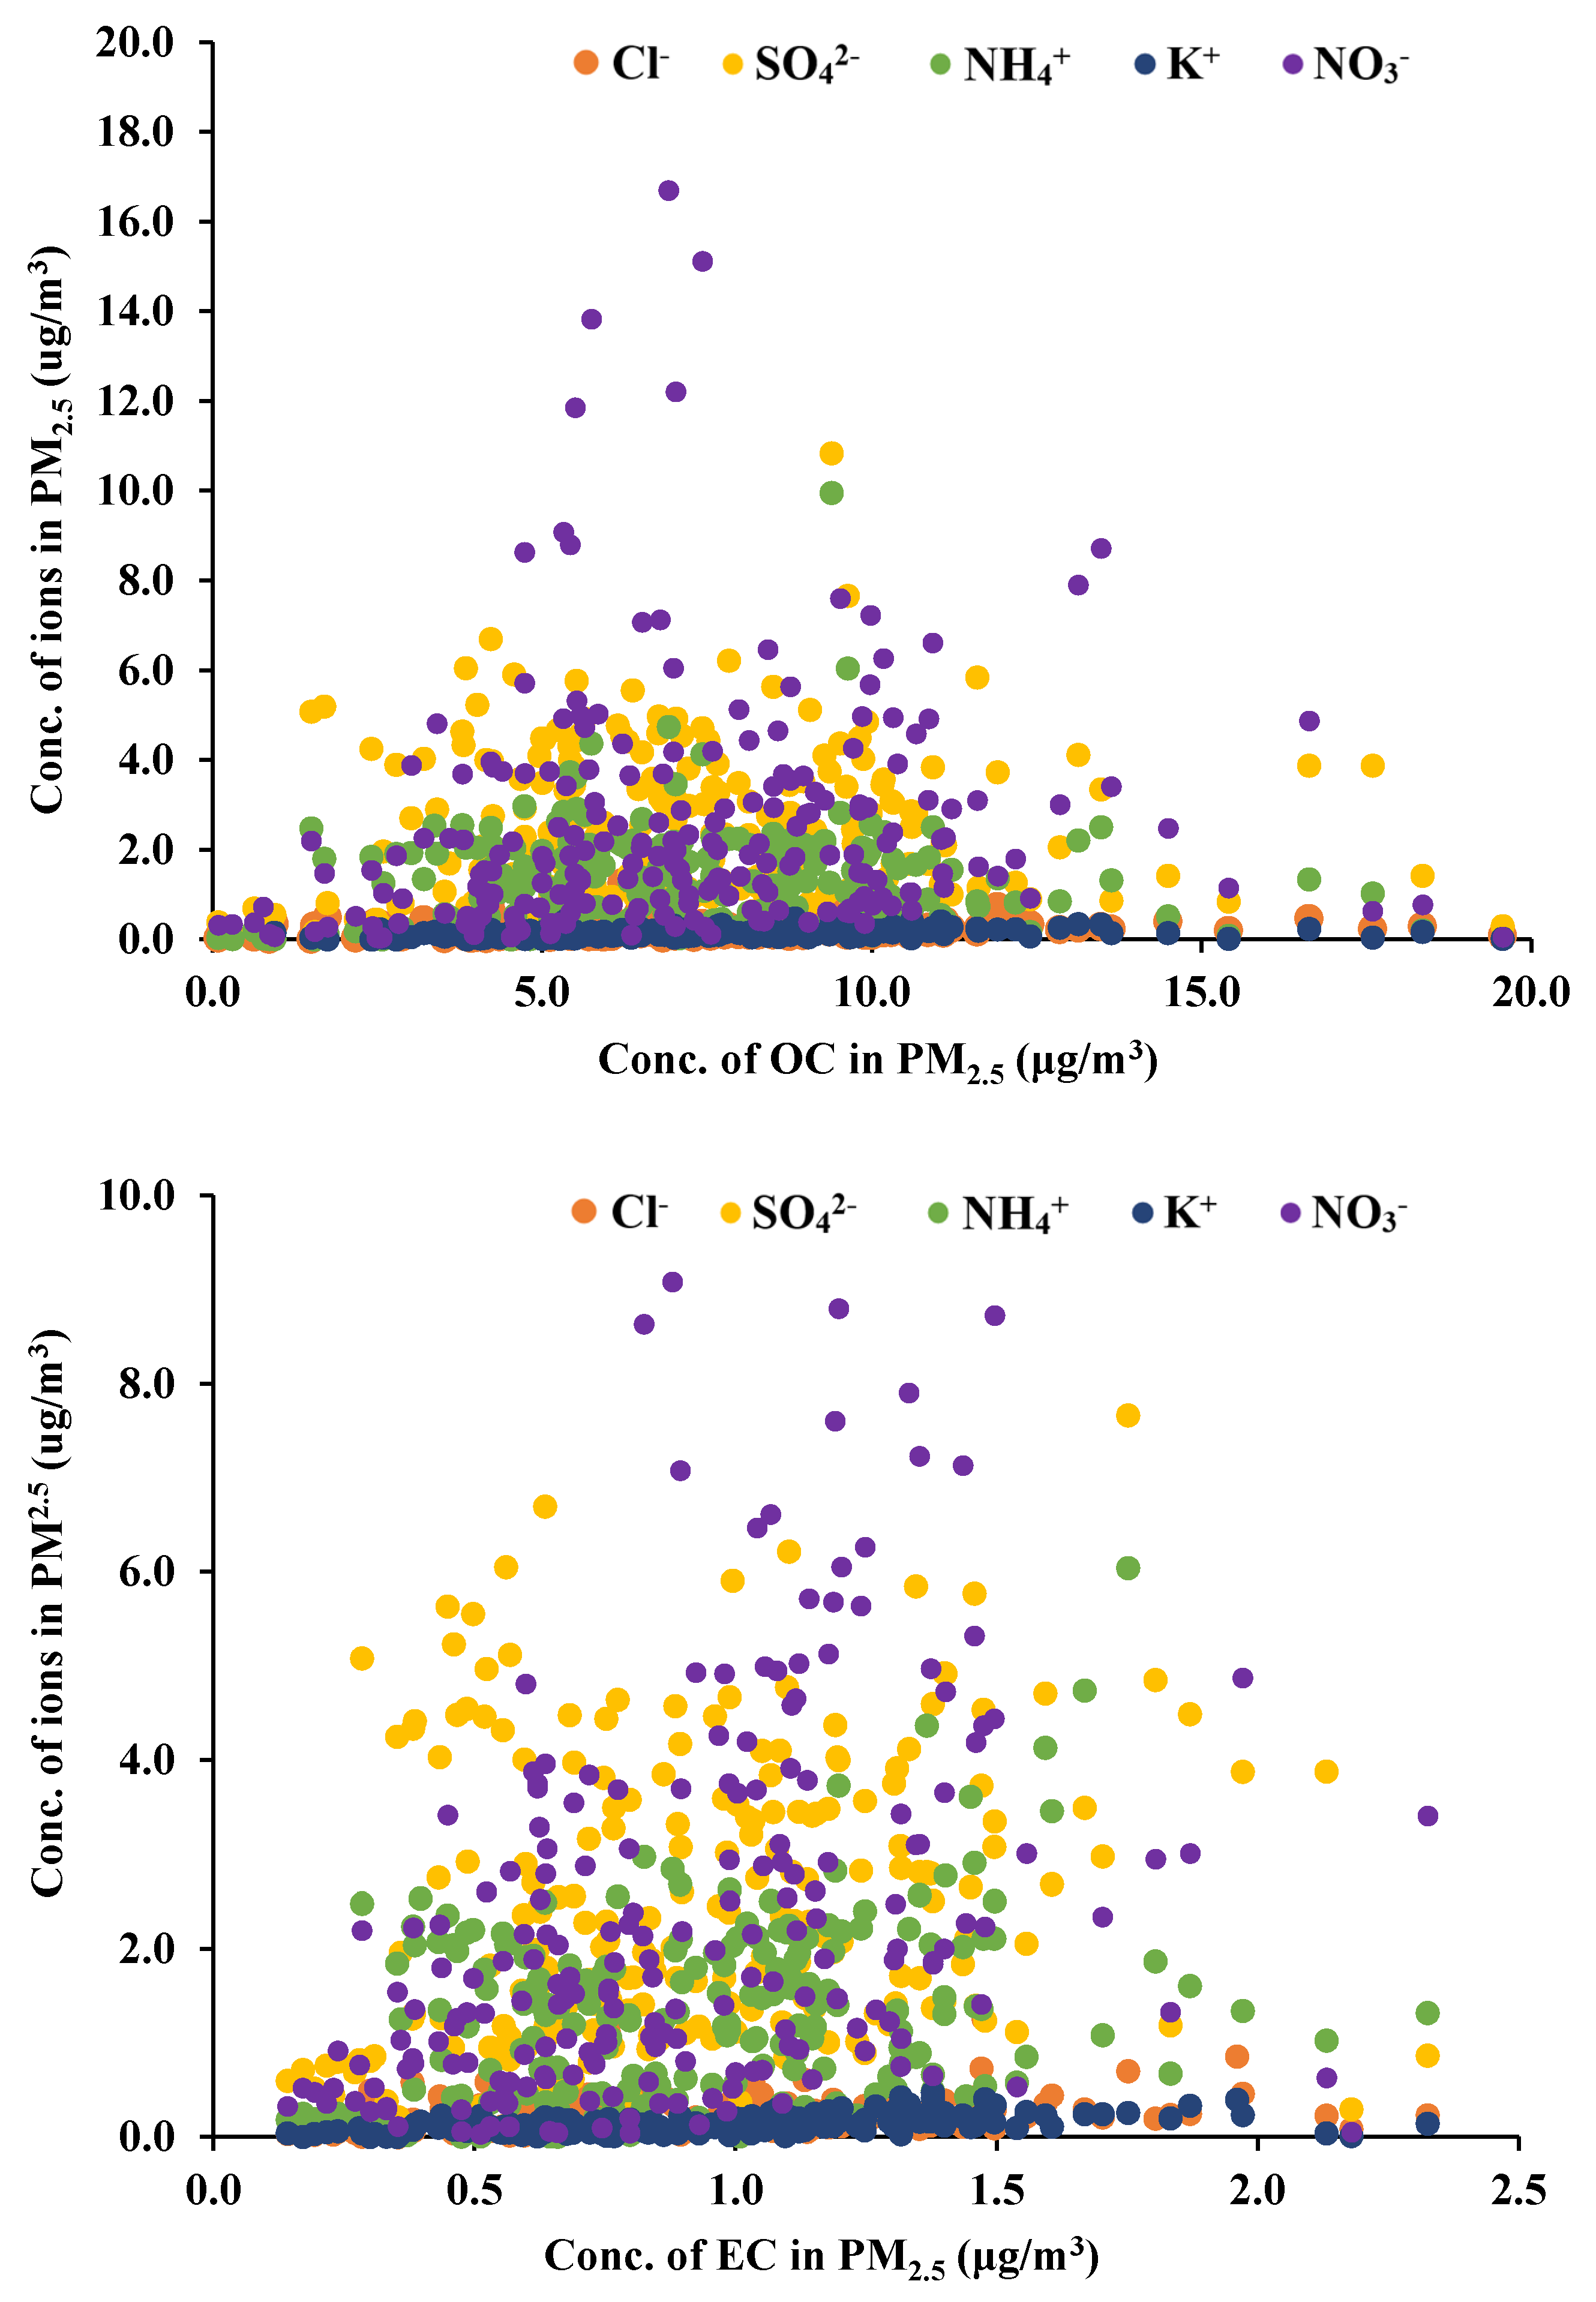
3.4. Correlation of Carbons with Chemical Species in PM2.5

Based on the assumption that airborne carbons are formed by anthropogenic activities, the correlation of ions generated from anthropogenic sources was compared with OC and EC illustrated in Figure 4. Data in Figure 4 enclose whole data from all the classrooms which may indicate general tendency. OC and EC clearly showed different relationship between ion species. While EC has a certain relation with ion amount approximately from the slope of 0.1 to 1.0, OC does not indicate any consistent dependency on ion mass ratios, showing less than 0.03. Besides overall correlation, the linearity of individual school classrooms was not so high despite an obvious proportional relationship.
The ion concentrations of sulfate and nitrate behave in a similar manner more to inorganic carbon (EC) aerosols in indoor PM2.5 than the organic carbon (OC). In particular, nitrate ion shows a relatively consistent relationship with both carbons (0.16 for OC and 1.0 for EC), probably because it inflows mainly from outside. Potassium and chlorine ions showed a low gradient (approximately 0.11 for both), but increased obviously with increasing EC.
Based on a simple statistical analysis with the probability value, less than 0.01, indoor PM2.5 showed the correlation coefficients with OC and EC, 0.37 and 0.26, respectively. As summarized in Table 4, OC correlated with EC at 0.6, which was lower than the outdoor correlation, 0.87. The correlation with ion species was higher in EC than OC except chlorine ion. Chlorine ion showed lower correlations with PM2.5, OC and EC than other ions, but relatively higher with OC (0.29) than EC and PM2.5. Other ions are generated in outdoors, and flow into the classrooms with PM2.5. In particular, ammonium ion is one of the key species capable of forming PM2.5 in urban atmosphere. Although potassium ion is known to overlap OC with its emission sources, such as biomass burning and incineration, the present study showed that they are more closely related to EC in classroom PM2.5. In conclusion, this result strongly suggests the presence of other internal OC sources independent of combustion, such as polymer compounds composed of carbon and chlorine.

3.5. I/O Values

This study pursued to discover the chemical phases contained in indoor PM2.5 relative to outdoor PM2.5. Since a large proportion of PM2.5 and EC found in classrooms come mainly from outside, it was expected that the chemical composition including EC would not exhibit very differently between indoors and outdoors. A similar tendency of chemical composition appeared in indoor and outdoor PM2.5 was shown except for a few species with indoor generation sources, as previously summarized in Table 2, and Figure 4 also indicated a similar pattern for EC.
Although consistently higher amounts were found outdoors than indoors in all schools, the EC concentration accounted for 2.4% of the outdoor PM2.5, and 3.7% of the indoor. However, I/O ratio of EC based on the absolute amount was 0.84. In other words, although a greater amount of elemental carbon was present in the outdoor particulate matters, the relative amount of EC occupying PM2.5 was higher indoors. It implies that the infiltrated elemental carbon tends to remain in the particulate matters inside more than other ions, metal or any inorganic species.
On the other hand, the average I/O values of OC and EC in PM2.5 for the five test schools were 1.64 and 0.85, respectively, as summarized in Table 5. A fair amount of outdoor PM2.5 is filtered through windows or walls when there is infiltration, and removed by air purifiers or ventilators inside the class. However, a relative fraction of carbon species was high in indoor PM2.5 at all the schools, indicating that there are more significant emission sources of OC comparing to EC. The school (E-4), which is the oldest school built in 1972 and located at the junction of heavy traffic roads, showed higher EC in the indoor than the outdoor despite low I/O value of PM2.5 (0.56). It implies that there were inflows of carbons from kitchen next to the classrooms in addition to outside roads. Although it is very various depending on classroom situation, it could be concluded that the I/O ratio of carbons was high comparing to the I/O ratio of PM2.5.
The proportional increase of indoor carbon to the outdoor as seen in Figure 5 was more obvious in OC than EC. In other words, it can be explained that most of EC which is found in classrooms come from the outside, while a significant amount of OC occurs indoors.

4. Conclusions

Under normal class conditions without any particular controls, PM10 and PM2.5 were sampled from five urban elementary schools near main roads in Seoul and surrounded by an unpaved playground and apartments. The indoor and outdoor PM samples were analyzed focusing on carbon species and chemical components. Indoor PM2.5 ranged from 14.5 μg/m3 to 40.2 μg/m3 on average during the regular class (8:30 a.m. to 2:30 p.m.) throughout the test schools. The currently obtained level is lower than the national standard except one classroom.
Amongst the chemical species in PM2.5, the sulfur content was highest indoors and outdoors with 27.9% and 31.8%, respectively. The components obviously higher in indoor than outdoor were F, Cl, and Ca2+. Geologically-originated elements such as Al, Ca, Fe, K and Na accounted for 43.1% of the total elemental concentration. Although the particle concentration observed in the test schools was mostly consistent with results reported from other references indicating that indoor particulate matters would be associated with the outdoor, carbon content appeared higher in the classrooms than outdoors in the test schools. In particular, the concentrations of OC and EC were 9.47 μg/m3 and 0.91 μg/m3 for indoor and 5.94 μg/m3 and 1.14 μg/m3 for outdoor, respectively. Indoor ratio of OC to EC was 10.5, which was two times larger than the outdoor, 5.2. Proportional correlations with low coefficients among OC, EC and ions such as NO3, SO42− and NH4+ were found in indoor PM2.5, implying the indoor dominant sources. Of the various chemicals, only carbon was found in higher concentrations in indoor PM2.5 than that of outdoors. Thus, school locations and building niches should be carefully managed to minimize carbon exposure to young students.

Author Contributions

Conceptualization and writing, Y.J.; data processing, S.H. and S.L.; field experiment J.K. and D.K.; program operation, T.L. All authors have read and agreed to the published version of the manuscript.

Funding

This work was supported by the National Research Foundation of Korea (NRF) grant funded by the Korea government (MSIT, MOE) and (No. 2019M3E7A1113077).

Institutional Review Board Statement

Not applicable.

Informed Consent Statement

Not applicable.

Data Availability Statement

Not applicable.

Acknowledgments

The authors wish to acknowledge the field support of Blue Squad and the cooperation of test schools.

Conflicts of Interest

The authors declare no conflict of interest.

References

  1. Isiugo, K.; Jandarov, R.; Coxa, J.; Chillrud, S.; Grinshpuna, S.A.; Hyttinen, M.; Yermakov, M.; Wang, J.; Ross, J.; Reponen, T. Predicting indoor concentrations of black carbon in residential environments. Atmos. Environ. 2019, 201, 223–230. [Google Scholar] [CrossRef]
  2. Sadiktsis, I.; Nilsson, G.; Johansson, U.; Rannug, U.; Westerholm, R. Removal of polycyclic aromatic hydrocarbons and genotoxic compounds in urban air using air filter materials for mechanical ventilation in buildings. Sci. Technol. Built Environ. 2016, 22, 346–355. [Google Scholar] [CrossRef] [Green Version]
  3. Li, B.; Lei, X.-N.; Xiu, G.-L.; Gao, G.-Y.; Gao, S.; Qian, N.-S. Personal exposure to black carbon during commuting in peak and off-peak hours in Shanghai. Sci. Total Environ. 2015, 524–525, 237–245. [Google Scholar] [CrossRef]
  4. Cao, J.J.; Lee, S.C.; Chow, J.C.; Cheng, Y.; Ho, K.F.; Fung, K.; Liu, S.X.; Watson, J.G. Indoor/outdoor relationships for PM2.5 and associated carbonaceous pollutants at residential homes in Hong Kong—case study. Indoor Air 2005, 15, 197–204. [Google Scholar] [CrossRef]
  5. Park, J.S.; Song, I.H.; Park, S.M.; Shin, H.; Hong, Y. The characteristics and Seasonal Variations of OC and EC for PM2.5 in Seoul Metropolitan Area in 2014. J. Environ. Impact Assess. 2015, 24, 578–592. [Google Scholar] [CrossRef] [Green Version]
  6. Majd, E.; McCormack, M.; Davis, M.; Curriero, F.; Berman, J.; Connolly, F.; Leaf, P.; Rule, A.; Green, T.; Clemons-Erby, D.; et al. Indoor air quality in inner-city schools and its associations with building characteristics and environmental factors. Environ. Res. 2019, 170, 83–91. [Google Scholar] [CrossRef] [PubMed]
  7. Alves, C.; Nunes, T.; Silva, J.; Duarte, M. Comfort Parameters and Particulate Matter (PM10 and PM2.5) in School Classrooms and Outdoor Air. Aerosol Air Qual. Res. 2013, 13, 1521–1535. [Google Scholar] [CrossRef] [Green Version]
  8. Richmond-Bryant, J.; Saganich, C.; Bukiewicz, L.; Kalin, R. Associations of PM2.5 and black carbon concentrations with traffic, idling, background pollution, and meteorology during school dismissals. Sci. Total Environ. 2009, 407, 3357–3364. [Google Scholar] [CrossRef] [PubMed]
  9. Fromme, H.; Twardella, D.; Dietrich, S.; Heitmann, D.; Schierl, R.; Liebl, B.; Rüden, H. Particulate matter in the indoor air of classrooms—exploratory results from Munich and surrounding area. Atmos. Environ. 2007, 41, 854–866. [Google Scholar] [CrossRef]
  10. Park, J.; Song, I.; Kim, H.; Lim, H.; Park, S.; Shin, S.; Shin, H.; Lee, S.; Kim, J. The Characteristics of Black Carbon of Seoul. J. Environ. Impact Assess. 2019, 28, 113–128. [Google Scholar] [CrossRef]
  11. Lazaridis, M.; Aleksandropoulou, V.; Hanssen, J.E.; Dye, C.; Eleftheriadis, K.; Katsivela, E. Inorganic and Carbonaceous Components in Indoor/Outdoor Particulate Matter in Two Residential Houses in Oslo, Norway. J. Air Waste Manag. Assoc. 2008, 58, 346–356. [Google Scholar] [CrossRef] [PubMed] [Green Version]
  12. Viana, M.; Rivas, I.; Querol, X.; Alastuey, A.; Sunyer, J.; Álvarez-Pedrerol, M.; Bouso, L.; Sioutas, C. Indoor/outdoor relationships and mass closure of quasi-ultrafine, accumulation and coarse particles in Barcelona schools. Atmos. Chem. Phys. 2014, 14, 4459–4472. [Google Scholar] [CrossRef] [Green Version]
  13. Xu, H.; Guinot, B.; Shen, Z.; Ho, K.F. Characteristics of organic and elemental carbon in PM2.5 and PM0.25 in indoor and outdoor environments of a middle schoo: Secondary formation of organic carbon and sources identification. Atmosphere 2015, 6, 361–379. [Google Scholar] [CrossRef] [Green Version]
  14. LaRosa, L.E.; Buckley, T.J.; Wallace, L.A. Real-Time Indoor and Outdoor Measurements of Black Carbon in an Occupied House: An Examination of Sources. J. Air. Waste. Manag. Assoc. 2002, 52, 41–49. [Google Scholar] [CrossRef]
  15. Heo, S.; Kim, D.Y.; Kwoun, Y.; Lee, T.J.; Jo, Y.M. Characterization and source idenfification of fine dust in Seoul elementary school classrooms. J. Hazard. Mater. 2021, 414, 125531. [Google Scholar] [CrossRef]
  16. Lee, Y.; Kim, E.; Ryu, C.; Oh, S.-H.; Joo, H.; Bae, M.-S. Relationship between Cholesterol and Oxidative Potential from Meat Cooking. J. Korean Soc. Atmos. 2018, 34, 639–650. [Google Scholar] [CrossRef]
  17. Wang, G.; Wang, H.; Yu, Y.; Gao, S.; Feng, J.; Gao, S.; Wang, L. Chemical characterization of water-soluble components of PM10 and PM2.5 atmospheric aerosols in five locations of Nanjing, China. Atmos. Environ. 2003, 37, 2893–2902. [Google Scholar] [CrossRef]
  18. Hassanvand, M.S.; Naddafi, K.; Faridi, S.; Nabizadeh, R.; Sowlat, M.H.; Momeniha, F.; Gholampour, A.; Arhami, M.; Kashani, H.; Zare, A.; et al. Characterization of PAHs and metals in indoor/outdoor PM10/PM2.5/PM1 in a retirement home and a school dormitory. Sci. Total Environ. 2015, 527–528, 100–110. [Google Scholar] [CrossRef] [PubMed]
  19. Lang, J.; Zhang, Y.; Zhou, Y.; Cheng, S.; Chen, D.; Cuo, X.; Chen, S.; Li, X.; Xing, X.; Wang, H. Trends of PM2.5 and Chemical Composition in Beijing, 2000–2015. Aerosol Air Qual. Res. 2017, 17, 412–425. [Google Scholar] [CrossRef]
  20. Zhang, R.; Jing, J.; Tao, J.; Hsu, S.-C.; Wang, G.; Cao, J.; Lee, C.S.L.; Zhu, L.; Chen, Z.; Zhao, Y.; et al. Chemical characterization and source apportionment of PM2.5 in Beijing: Seasonal perspective. Atmos. Chem. Phys. 2013, 13, 7053–7074. [Google Scholar] [CrossRef] [Green Version]
  21. Kim, Y.; Yi, S.-M.; Heo, J. Fifteen-year trends in carbon species and PM2.5 in Seoul, South Korea (2003–2017). Chemosphere 2020, 261, 127750. [Google Scholar] [CrossRef] [PubMed]
Figure 1. PM sampling in (a) classrooms and (b) outdoors.
Applsci 11 07328 g001
Figure 2. Mass concentration of particulate matter in test classrooms and outdoors.
Applsci 11 07328 g002
Figure 3. Carbon concentration of indoor PM2.5 for each school.
Applsci 11 07328 g003
Figure 4. Distribution of ions with OC and EC in indoor PM2.5.
Applsci 11 07328 g004
Figure 5. Indoor to outdoor ratio of carbon content in PM2.5.
Applsci 11 07328 g005
Table 1. Summary of test schools.
School
(* Site)
Sampling Date Classroom NoClassroom FloorNo. of OccupantsFlooring
E-1
(514 m)
7–16 October 20192-12nd23Laminate floor
2-22nd23Laminate floor
3-43rd25Laminate floor
Outdoor--Sand
E-2
(263 m)
28 October –6 November 20191-12nd23Laminate floor
1-22nd25Laminate floor
2-43rd25Laminate floor
2-53rd19Laminate floor
Outdoor--Sand
E-3
(209 m)
11–20 November 20192-12nd25Wood
2-32nd25Wood
3-13rd20Wood
3-33rd20Wood
Outdoor--Sand
E-4
(137 m)
2–5 December 20191-12nd25PVC
2-12nd24Laminate floor
2-32nd21Laminate floor
Outdoor--Sand
E-5
(669 m)
9–12 December 20192-63rd30Deco tile
2-55th29Laminate floor
4-25th22Laminate floor
Outdoor--Sand
* distance from the main road.
Table 2. Average amount of inorganic elements found in PM2.5.
SpeciesIndoor (No. of Sample = 25)Outdoor (No. of Sample = 8)
(μg/m3)Mean (%)SDMinMaxMean (%)SDMinMax
Al0.007 (0.2)0.0360.0000.1860.085 (1.9)0.1500.0000.405
Ca0.498 (15.0)0.3240.1971.5740.389 (8.7)0.1490.2120.641
Fe0.246 (7.4)0.1000.0950.5450.411 (9.2)0.1520.2570.705
K0.335 (10.1)0.1130.1140.5430.482 (10.8)0.1670.2490.692
Mg0.124 (3.7)0.0790.0540.4290.124 (2.8)0.0610.0700.269
Na0.347 (10.4)0.2380.1101.2870.331 (7.4)0.0780.2300.450
Si0.541 (16.3)0.2900.2051.4650.957 (21.4)0.7200.3462.390
As0.002 (0.1)0.0020.0000.0070.004 (0.1)0.0020.0000.007
Ba0.009 (0.3)0.0030.0040.0150.012 (0.3)0.0030.0080.017
Cr0.002 (0.1)0.0010.0000.0040.002 (0.0)0.0010.0010.003
Cu0.003 (0.1)0.0010.0010.0050.003 (0.1)0.0010.0020.004
Mn0.011 (0.3)0.0050.0050.0260.019 (0.4)0.0040.0130.024
Pb0.013 (0.4)0.0060.0030.0230.021 (0.5)0.0070.0130.037
Ti0.022 (0.7)0.0080.0080.0380.032 (0.7)0.0160.0160.060
Zn0.038 (1.1)0.0130.0160.0680.052 (1.2)0.0140.0360.076
Br0.004 (0.1)0.0020.0000.0090.005 (0.1)0.0030.0020.011
Cl0.193 (5.8)0.2420.0621.2650.126 (2.8)0.0840.0480.333
Sum0.926 (27.9)0.3280.2961.4171.423 (31.8)0.9160.7263.805
3.310 (100) 4.478 (100)
In brackets, percentages of the total concentrations.
Table 3. Summary of ion components in PM2.5.
SpeciesIndoor (No. of Sample = 25)Outdoor (No. of Sample = 8)
(μg/m3)MeanSDMinMaxMeanSDMinMax
F0.130.070.040.100.040.010.030.06
Cl0.240.210.091.120.250.250.070.86
NO32.201.440.396.477.318.772.2630.17
PO43−0.090.080.010.270.080.090.000.25
SO42−1.841.020.625.843.212.891.6910.84
Ca2+0.530.250.241.200.520.180.300.90
K+0.140.060.050.270.180.090.100.40
Mg2+0.060.050.010.240.060.020.040.12
Na+0.390.380.082.080.410.340.171.29
NH4+0.610.530.032.122.302.930.509.95
Table 4. Pearson’s correlation coefficients for typical species in indoor PM2.5.
PM2.5OCEC
PM2.51.0
OC0.371.0
EC0.260.601.0
Cl0.120.290.09
SO42−0.340.410.55
NH4+0.490.260.48
K+0.130.490.65
NO30.330.210.54
Table 5. Average I/O values of PM2.5, OC and EC.
LocationAvg. Conc. of PM2.5 (μg/m3)Avg. I/O Ratio of PM2.5Avg. Conc. of OC (μg/m3)Avg. I/O Ratio of OCAvg. Conc. of EC (μg/m3)Avg. I/O Ratio of EC
E-1-I23.5 ± 4.70.82 ± 0.219.7–11.11.50 ± 0.270.3–1.40.84 ± 0.35
E-1-O29.9 ± 3.7 5.8–7.8 1.1–1.1
E-2-I24.1 ± 2.40.81 ± 0.058.1–12.81.73 ± 0.120.6–1.60.91 ± 0.14
E-2-O30.2 ± 2.3 5.1–6.8 1.0–1.4
E-3-I25.2 ±8.20.47 ± 0.188.0–10.32.16 ± 0.380.4–1.00.73 ± 0.15
E-3-O54.8 ± 5.0 3.6–4.7 0.8–1.1
E-4-I15.3 ± 0.60.56 ± 0.027.1–8.41.80 ± 0.130.7–0.81.23 ± 0.10
E-4-O27.6 ± 0.0 4.4 0.6
E-5-I32.2 ± 4.70.46 ± 0.078.4–10.71.02 ± 0.101.0–1.10.53 ± 0.03
E-5-O70.5 ± 0.0 9.4 2.0
Publisher’s Note: MDPI stays neutral with regard to jurisdictional claims in published maps and institutional affiliations.

