
Flow Control Techniques for Enhancing the Bio-Recognition Performance of Microfluidic-Integrated Biosensors


Abstract
:Featured Application
Abstract
1. Introduction
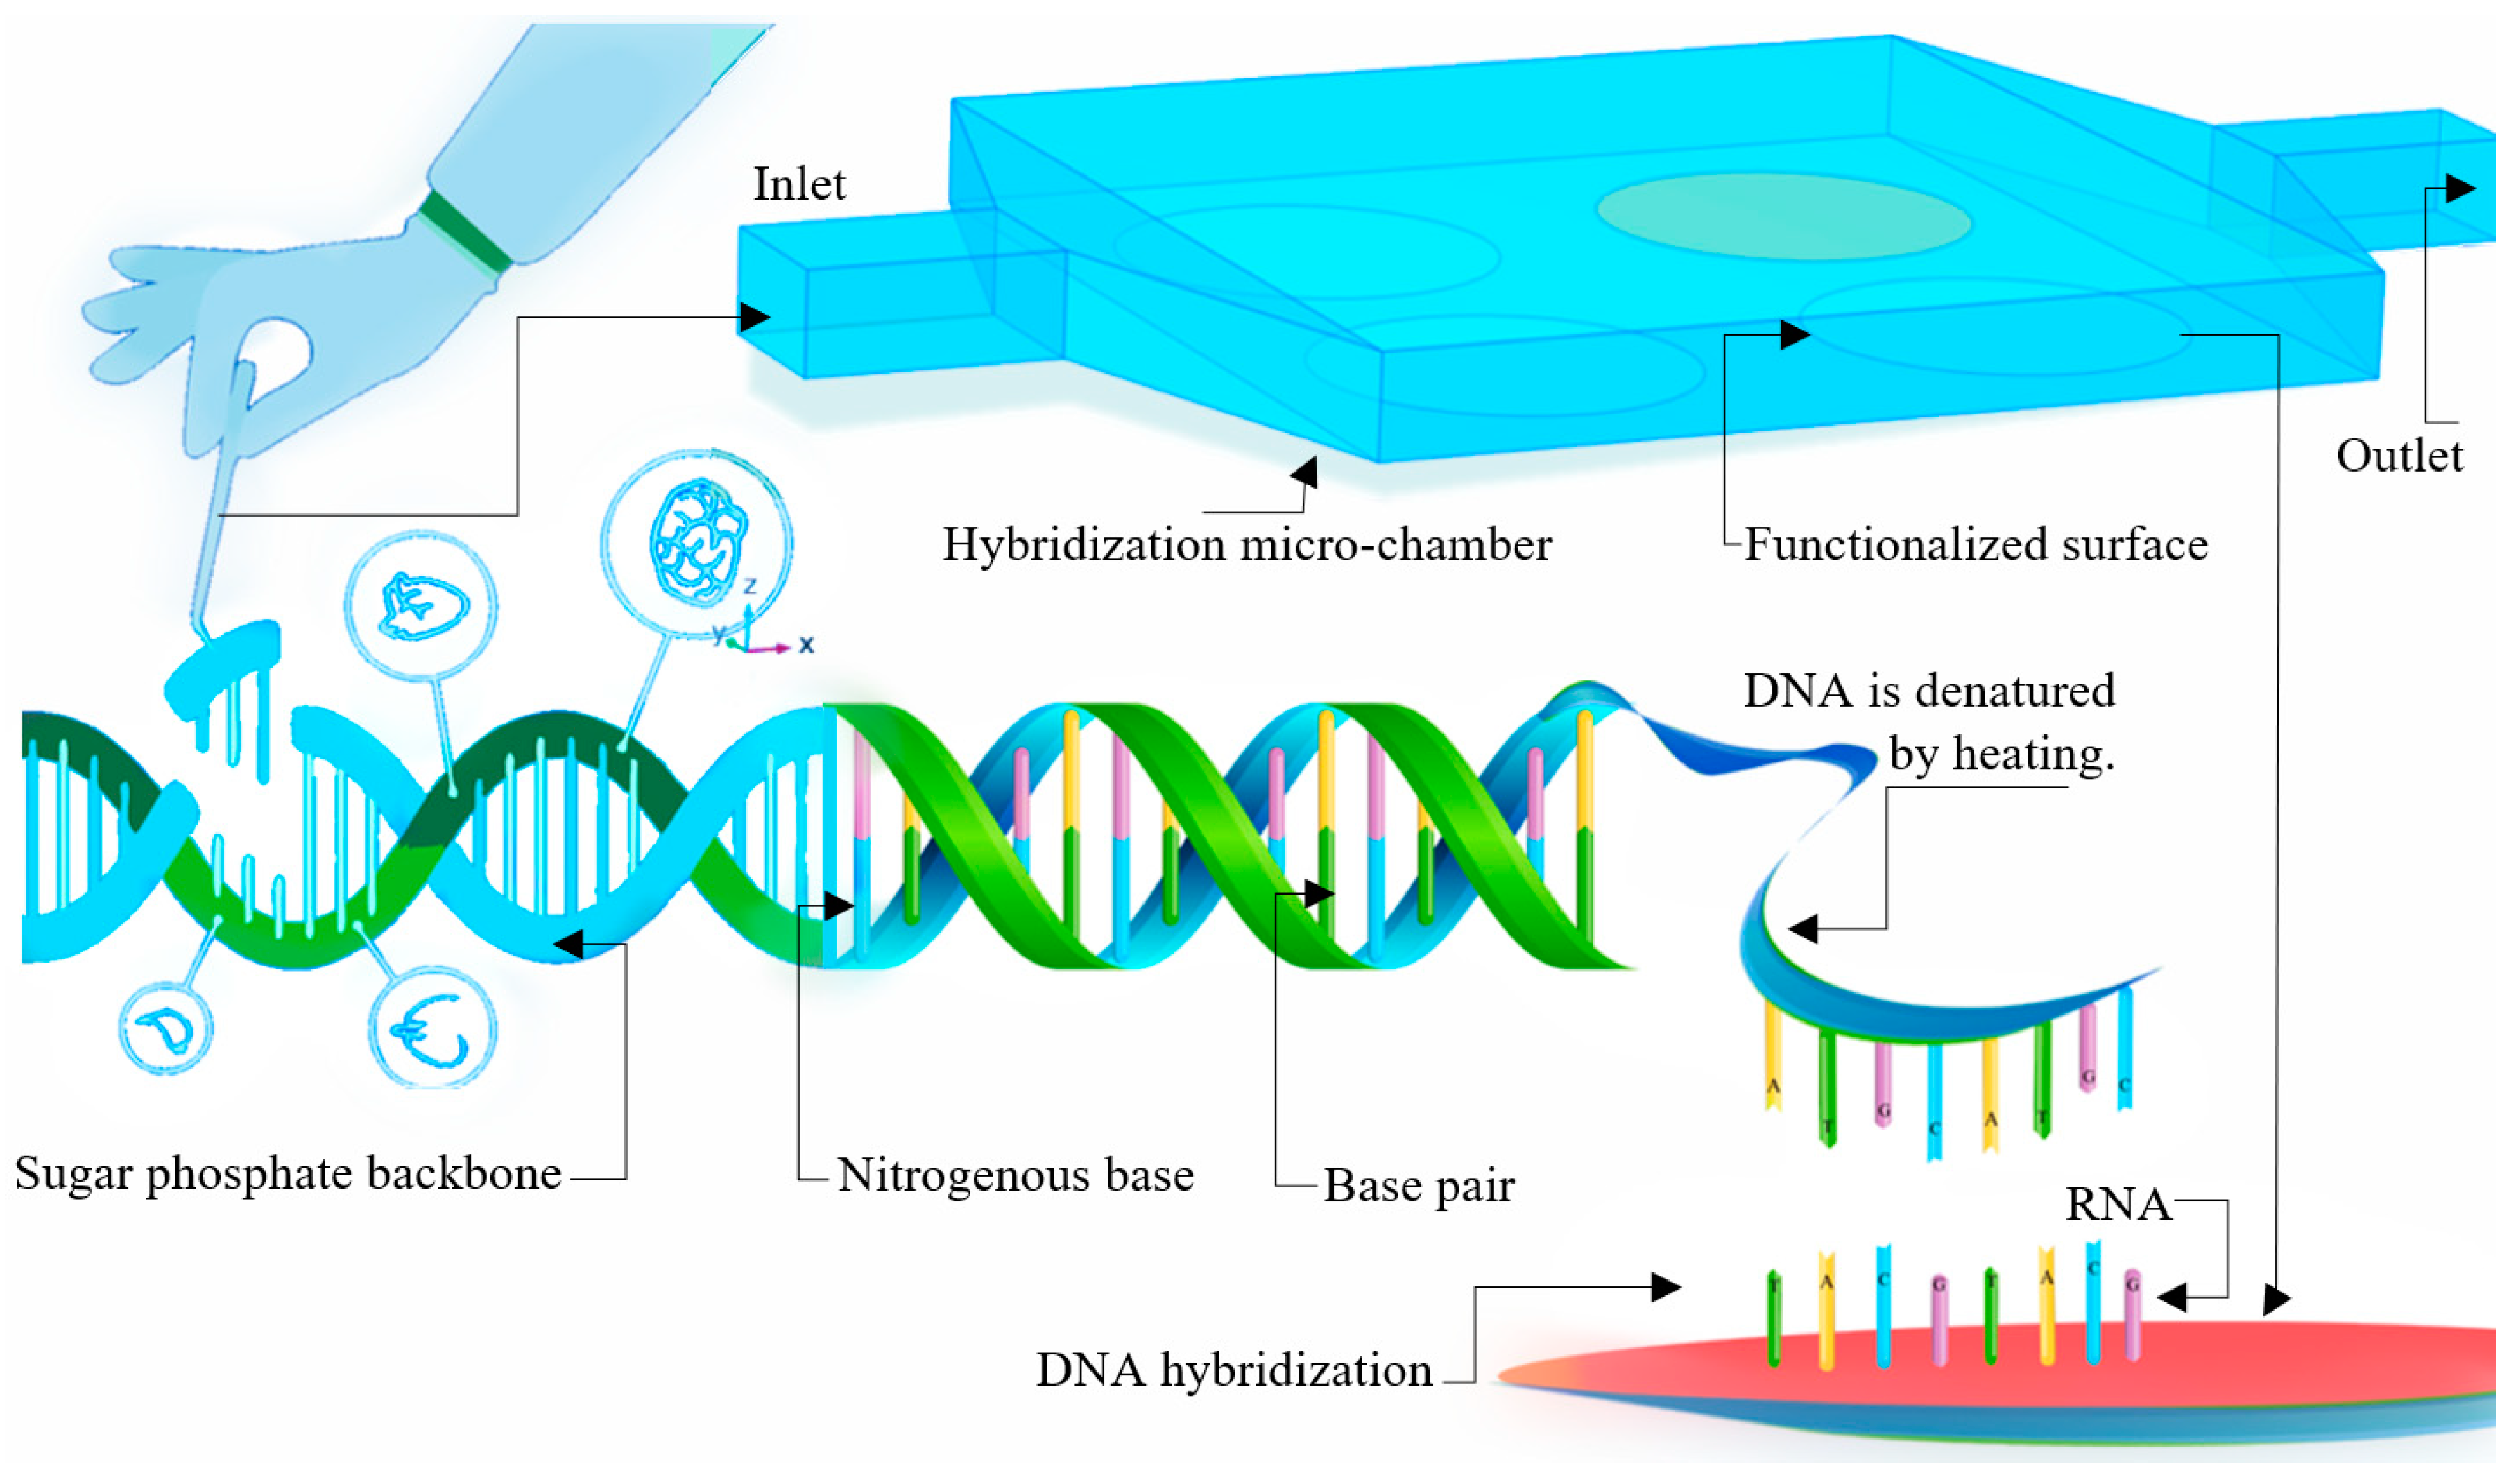
2. Model Setup
3. Methods
4. Boundary Conditions
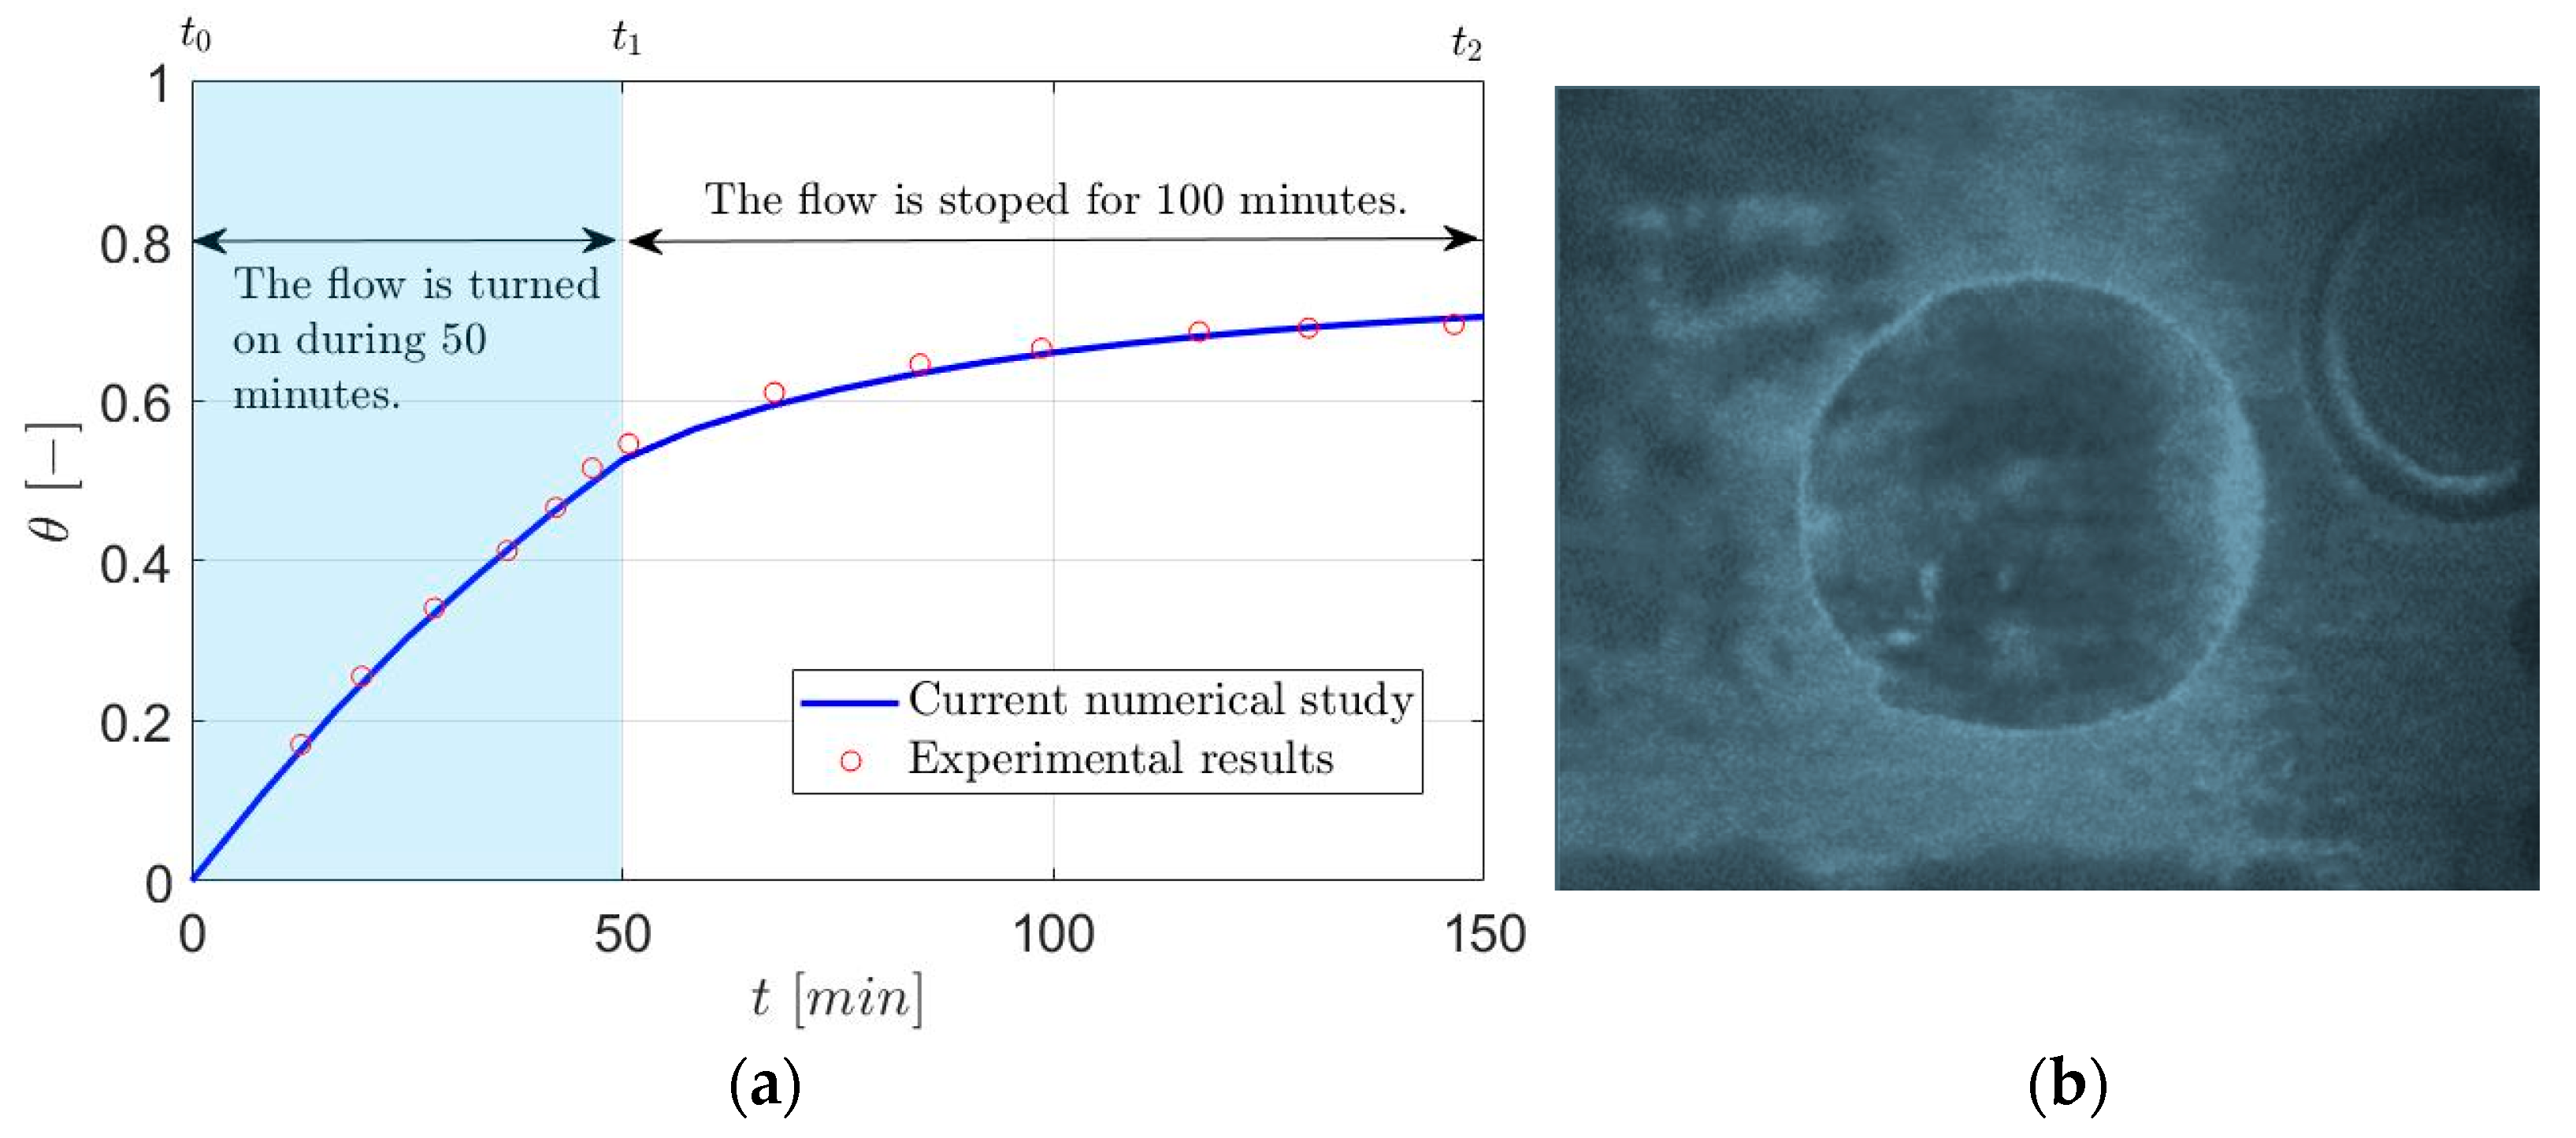
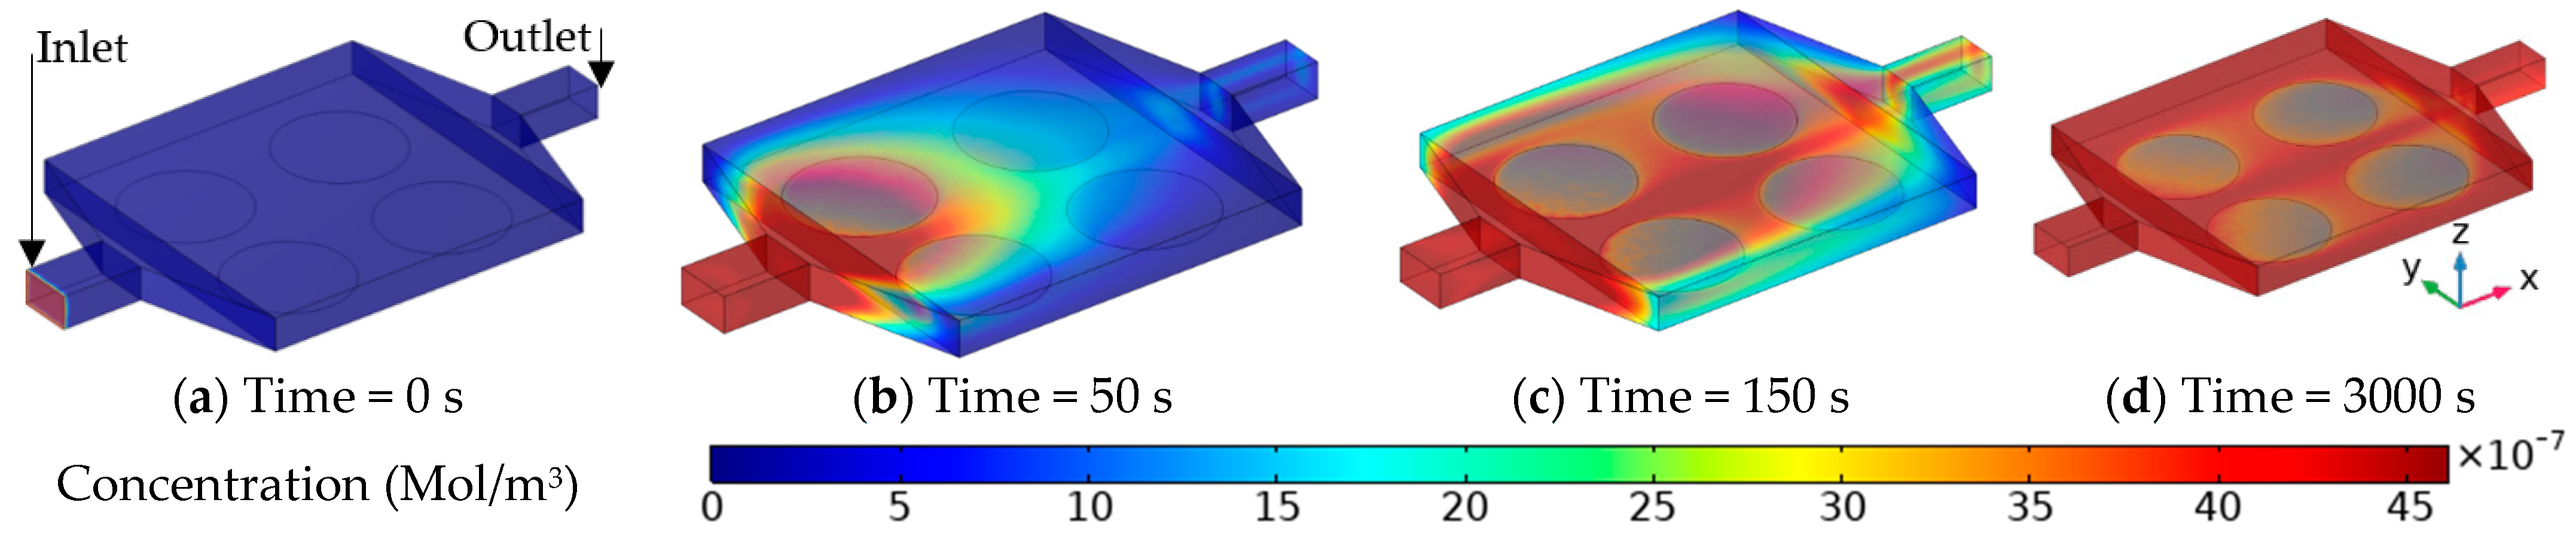
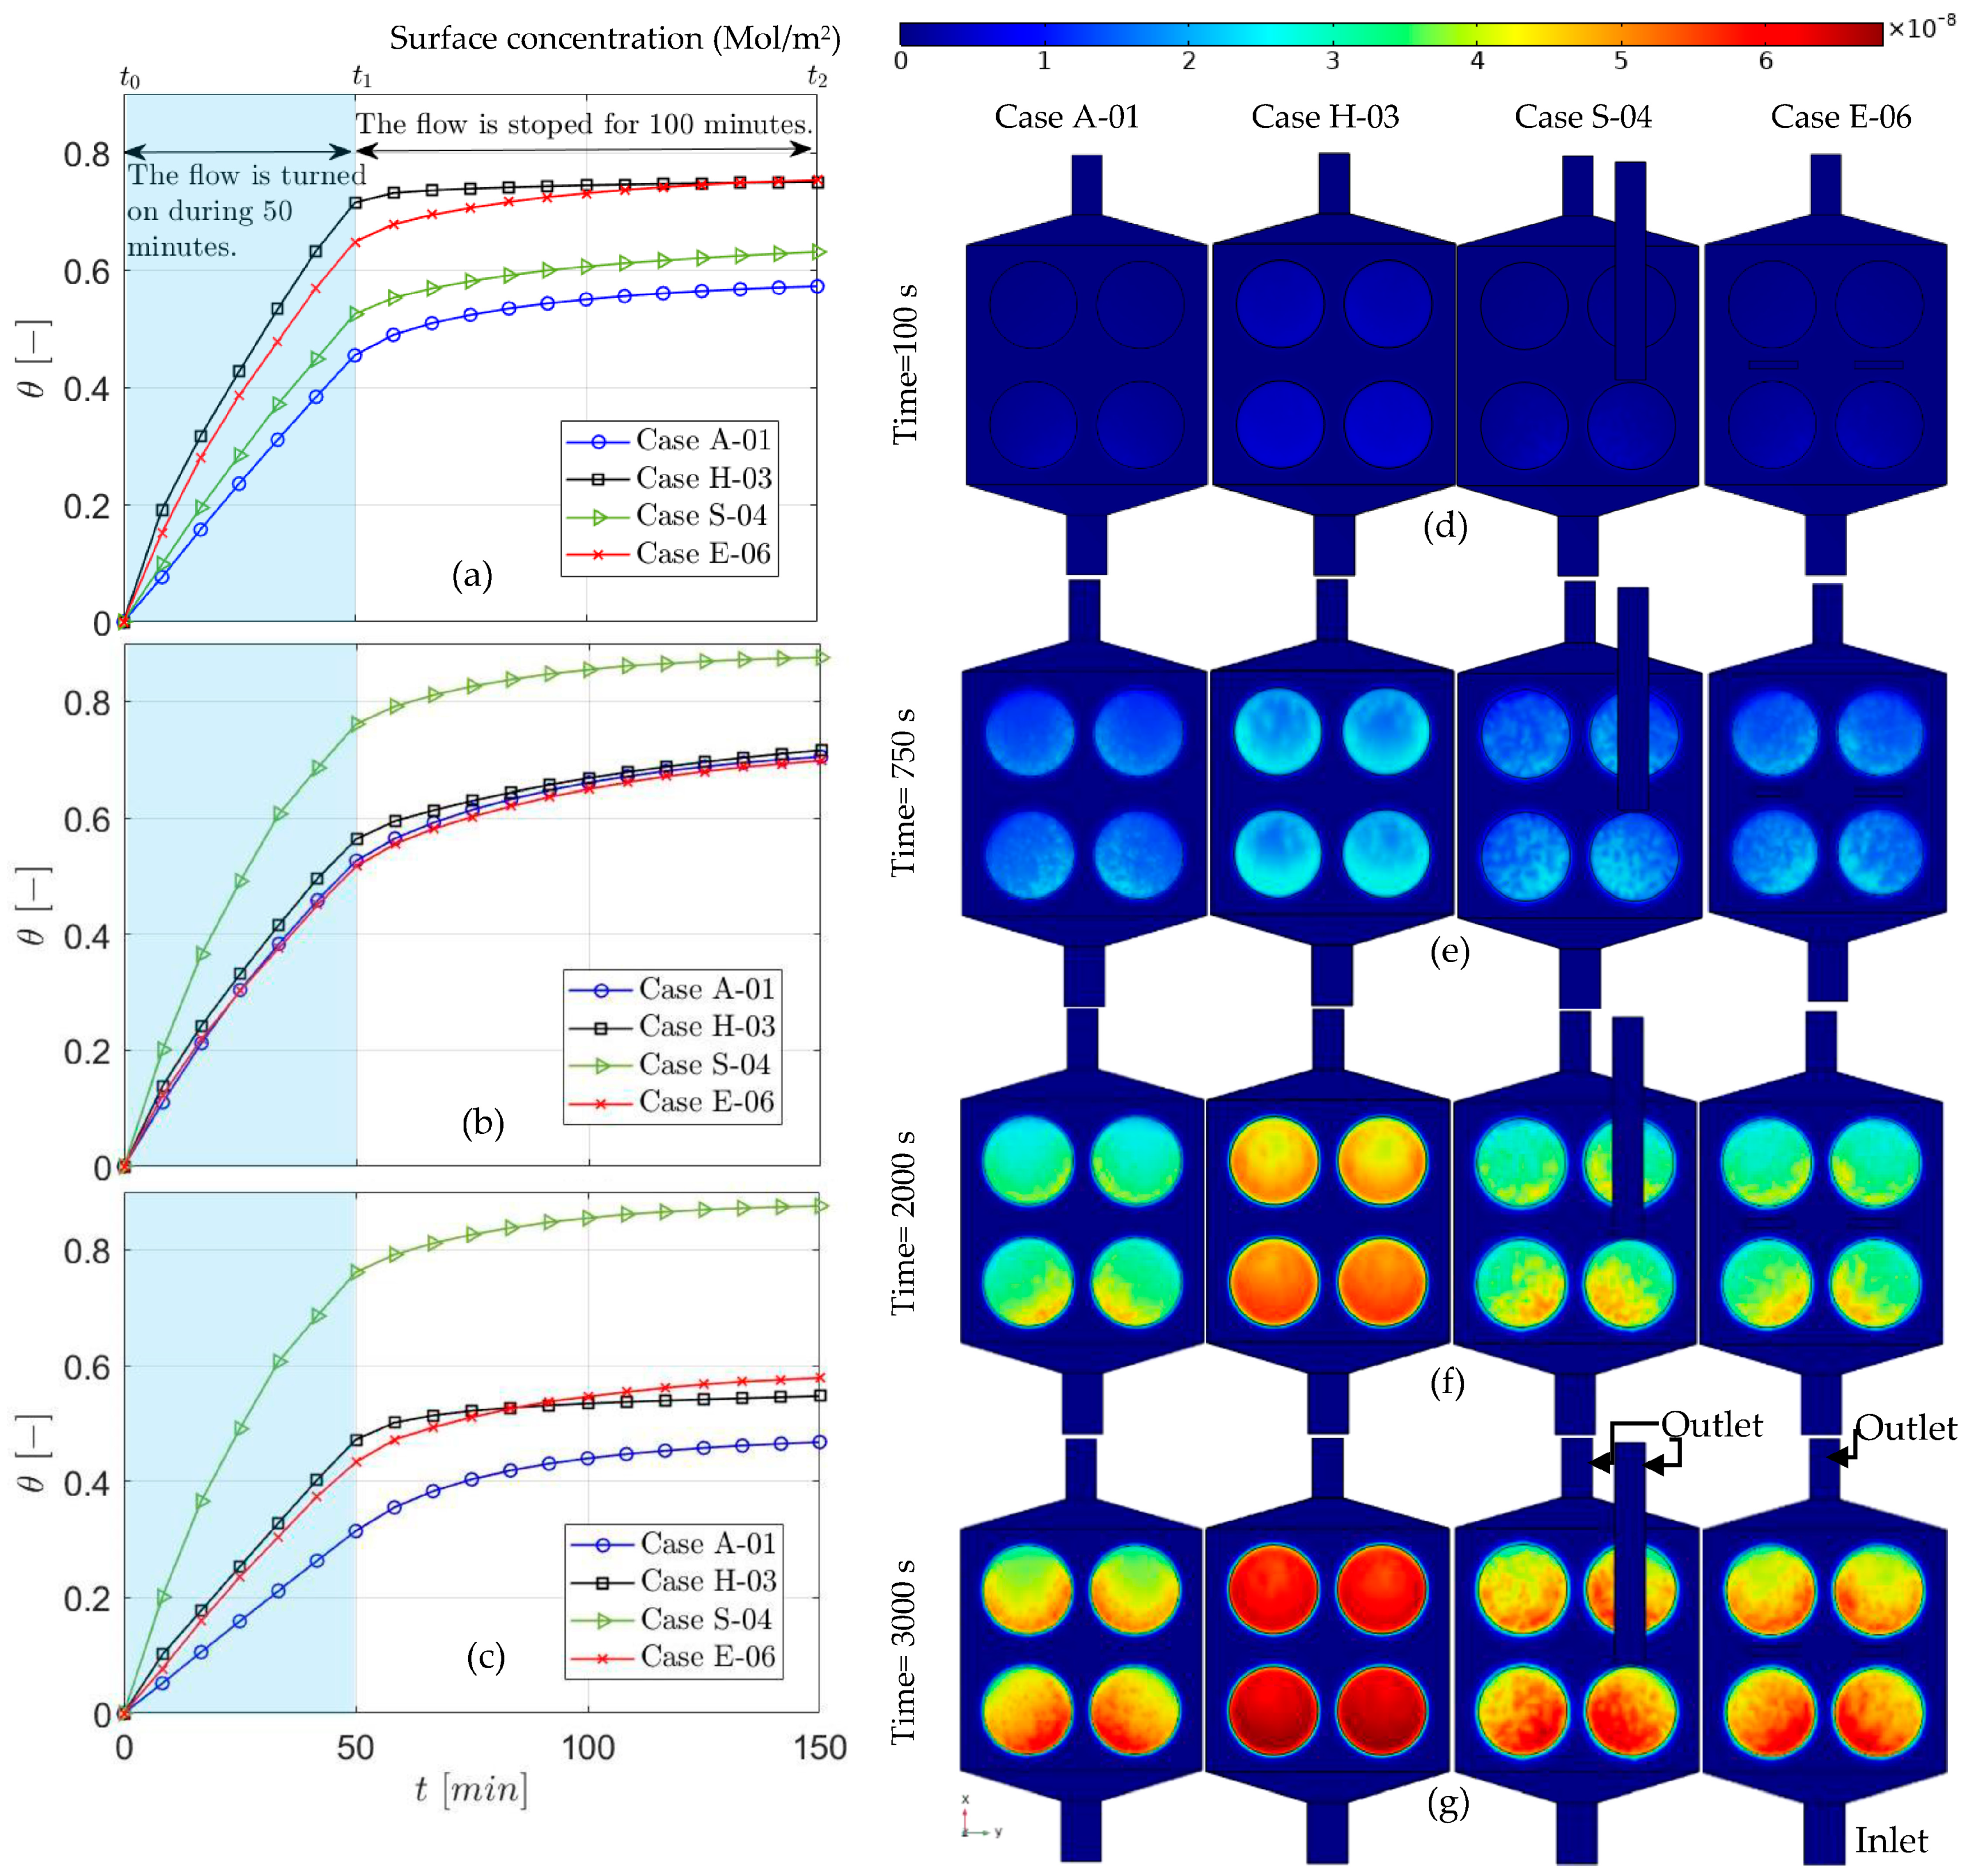
5. Results and Discussion
6. Conclusions
Author Contributions
Funding
Institutional Review Board Statement
Informed Consent Statement
Acknowledgments
Conflicts of Interest
References
- Zhang, J.; Chua, S.L.; Khoo, B.L. Worm-based microfluidic biosensor for real-time assessment of the metastatic status. Cancers 2021, 13, 873. [Google Scholar] [CrossRef]
- Shahbazi, F.; Jabbari, M.; Esfahani, M.N.; Keshmiri, A. A computational simulation platform for designing real-time monitoring systems with application to COVID-19. Biosens. Bioelectron. 2021, 171, 112716. [Google Scholar] [CrossRef]
- Sebastian, B.; Dittrich, P.S. Microfluidics to mimic blood flow in health and disease. Annu. Rev. Fluid Mech. 2018, 50, 483–504. [Google Scholar] [CrossRef]
- Wang, J.; Ren, Y.; Zhang, B. Application of microfluidics in biosensors. In Advances in Microfluidic Technologies for Energy and Environmental Applications; IntechOpen: London, UK, 2020; p. 59. [Google Scholar]
- Che, C.; Li, N.; Long, K.D.; Aguirre, M.Á.; Canady, T.D.; Huang, Q.; Demirci, U.; Cunningham, B.T. Activate capture and digital counting (AC + DC) assay for protein biomarker detection integrated with a self-powered microfluidic cartridge. Lab. Chip 2019, 19, 3943–3953. [Google Scholar] [CrossRef]
- Tu, J.; Torrente-Rodríguez, R.M.; Wang, M.; Gao, W. The era of digital health: A review of portable and wearable affinity biosensors. Adv. Funct. Mater. 2020, 30, 1906713. [Google Scholar] [CrossRef]
- Ivanov, Y.D.; Kozlov, A.F.; Galiullin, R.A.; Tatur, V.Y.; Ivanova, N.D.; Ziborov, V.S. Applied sciences influence of chip materials on charge generation in flowing solution in nanobiosensors. Appl. Sci. 2019, 9, 671. [Google Scholar] [CrossRef] [Green Version]
- Stine, K.J. Applied sciences biosensor applications of electrodeposited nanostructures. Appl. Sci. 2019, 9, 797. [Google Scholar] [CrossRef] [Green Version]
- Wang, H.; Zhao, Y.; Bie, S.; Suo, T.; Jia, G. Applied sciences development of an electrochemical biosensor for rapid and effective detection of pathogenic escherichia coli in licorice extract. Appl. Sci. 2019, 9, 295. [Google Scholar] [CrossRef] [Green Version]
- Luan, Y.; Lu, A.; Chen, J.; Fu, H.; Xu, L. Applied sciences a label-free aptamer-based fluorescent assay for cadmium detection. Appl. Sci. 2016, 6, 432. [Google Scholar] [CrossRef] [Green Version]
- Vashist, S.K.; Luppa, P.B.; Yeo, L.Y.; Ozcan, A.; Luong, J.H.T. Emerging technologies for next-generation point-of-care testing. Trends Biotechnol. 2015, 33, 692–705. [Google Scholar] [CrossRef]
- Wuethrich, A.; Howard, C.B.; Trau, M. Accepted manuscript geometric optimisation of electrohydrodynamic fluid flows for enhanced biosensing. Microchem. J. 2017, 137, 231–237. [Google Scholar] [CrossRef] [Green Version]
- Arreola, J.; Oberländer, J.; Mätzkow, M.; Keusgen, M.; Schöning, M.J. Surface functionalization for spore-based biosensors with organosilanes. Electrochim. Acta 2017, 241, 237–243. [Google Scholar] [CrossRef]
- Shen, Y.; Anwar, T.B.; Mulchandani, A. Current status, advances, challenges and perspectives on biosensors for COVID-19 diagnosis in resource-limited settings. Sens. Actuators Rep. 2021, 3, 100025. [Google Scholar] [CrossRef]
- Kaya, H.O.; Cetin, A.E.; Azimzadeh, M.; Topkaya, S.N. Pathogen detection with electrochemical biosensors: Advantages, challenges and future perspectives. J. Electroanal. Chem. 2021, 882, 114989. [Google Scholar] [CrossRef] [PubMed]
- Che Lah, N.F.; Ahmad, A.L.; Low, S.C. Molecular imprinted membrane biosensor for pesticide detection: Perspectives and challenges. Polym. Adv. Technol. 2021, 32, 17–30. [Google Scholar] [CrossRef]
- Nair, S.S.; Mishra, S.K.; Kumar, D. Recent progress in conductive polymeric materials for biomedical applications. Polym. Adv. Technol. 2019, 30, 2932–2953. [Google Scholar] [CrossRef]
- Guo, B.; Ma, P.X. Conducting polymers for tissue engineering. Biomacromolecules 2018, 19, 1764–1782. [Google Scholar] [CrossRef] [PubMed]
- Abdulkarim, Y.I.; Muhammadsharif, F.F.; Bakır, M.; Awl, H.N. Applied sciences hypersensitized metamaterials based on a corona-shaped resonator for efficient detection of glucose. Appl. Sci. 2021, 11, 103. [Google Scholar] [CrossRef]
- Salim, A.; Lim, S. Review of recent metamaterial microfluidic sensors. Sensors 2018, 18, 232. [Google Scholar] [CrossRef] [Green Version]
- Lundblad, M.; Price, D.A.; Burmeister, J.J.; Quintero, J.E.; Huettl, P.; Pomerleau, F.; Zahniser, N.R.; Gerhardt, G.A. Tonic and phasic amperometric monitoring of dopamine using microelectrode arrays in rat striatum. Appl. Sci. 2020, 10, 6449. [Google Scholar] [CrossRef]
- Yang, C.; Hu, K.; Wang, D.; Zubi, Y.; Lee, S.T.; Puthongkham, P.; Mirkin, M.V.; Venton, B.J. Cavity carbon-nanopipette electrodes for dopamine detection. Anal. Chem. 2019, 91, 4618–4624. [Google Scholar] [CrossRef]
- Bruijns, B.; Tiggelaar, R.; Gardeniers, H. A microfluidic approach for biosensing DNA within forensics. Appl. Sci. 2020, 10, 7067. [Google Scholar] [CrossRef]
- Jia, M.; Lu, Y.; Wang, R.; Ren, N.; Zhang, J.; Changhua, X.; Wu, J. Extended GR-5 DNAzyme-based autonomous isothermal cascade machine: An efficient and sensitive one-tube colorimetric platform for Pb2+ detection. Sens. Actuators B Chem. 2020, 304. [Google Scholar] [CrossRef]
- Fakhri, N.; Abarghoei, S.; Dadmehr, M.; Hosseini, M.; Sabahi, H.; Ganjali, M.R. Paper based colorimetric detection of miRNA-21 using Ag/Pt nanoclusters. Spectrochim. Acta-Part A Mol. Biomol. Spectrosc. 2020, 227, 117529. [Google Scholar] [CrossRef]
- Hybridization, S.; Fish, D.N.A. The use of three-dimensional dna fluorescent in situ hybridization (3D DNA FISH) for the detection of anaplastic lymphoma kinase (ALK) in non-small cell lung cancer (NSCLC) circulating tumor cells. Cells 2020, 9, 1465. [Google Scholar]
- Pal, S.; Prajapati, Y.K.; Saini, J.P. Influence of graphene’s chemical potential on SPR biosensor using ZnO for DNA hybridization. Opt. Rev. 2020, 27, 57–64. [Google Scholar] [CrossRef]
- Berthier, J.; Silberzan, P. Microfluidics for Biotechnology, 2nd ed.; Artech House: London, UK, 2001; ISBN 9781596934436. [Google Scholar]
- Shahbazi, F.; Jabbari, M.; Esfahani, M.N.; Keshmiri, A. Numerical framework for simulating bio-species transport in microfluidic channels with application to antibody biosensors. MethodsX 2020, 7, 101132. [Google Scholar] [CrossRef] [PubMed]
- Bruus, H. Theoretical Microfluidics; Oxford University Press: Oxford, UK, 2008; Volume 18. [Google Scholar]
- Electroosmotic flow in nanochannels. In Interdisciplinary Applied Mathematics; Springer: Berlin/Heidelberg, Germany, 2005; Volume 29, pp. 447–470.
- Kabinejadian, F.; McElroy, M.; Ruiz-Soler, A.; Leo, H.L.; Slevin, M.A.; Badimon, L.; Keshmiri, A. Numerical assessment of novel helical/spiral grafts with improved hemodynamics for distal graft anastomoses. PLoS ONE 2016, 11. [Google Scholar] [CrossRef] [Green Version]
- Ruiz-Soler, A.; Kabinejadian, F.; Slevin, M.A.; Bartolo, P.J.; Keshmiri, A. Optimisation of a novel spiral-inducing bypass graft using computational fluid dynamics. Sci. Rep. 2017, 7. [Google Scholar] [CrossRef] [Green Version]
- McElroy, M.; Keshmiri, A. Impact of Using Conventional Inlet/Outlet Boundary Conditions on Haemodynamic Metrics in a Subject-Specific Rabbit Aorta. Proc. Inst. Mech. Eng. Part H J. Eng. Med. 2018, 232, 103–113. [Google Scholar] [CrossRef]
- Deyranlou, A.; Naish, J.H.J.H.; Miller, C.A.C.A.; Revell, A.; Keshmiri, A. Numerical Study of Atrial Fibrillation Effects on Flow Distribution in Aortic Circulation. Ann. Biomed. Eng. 2020, 48, 1291–1308. [Google Scholar] [CrossRef] [PubMed] [Green Version]
- Swanson, L.; Owen, B.; Keshmiri, A.; Deyranlou, A.; Keavney, B.; Revell, A. A Patient-Specific CFD Pipeline Using Doppler Echocardiography for Application in Coarctation of the Aorta in Limited Resource Clinical Context. Front. Bioeng. Biotechnol. 2020, 8, 2020. [Google Scholar] [CrossRef] [PubMed]
- Deyranlou, A.; Miller, C.A.; Revell, A.; Keshmiri, A. Effects of Ageing on Aortic Circulation During Atrial Fibrillation; a Numerical Study on Different Aortic Morphologies. Ann. Biomed. Eng. 2021. [Google Scholar] [CrossRef] [PubMed]


| Sign | Name | Value |
|---|---|---|
| Number of essential pairs DNA strands | 15 | |
| Diffusion coefficient () | 7.5 × 10⁻¹⁰ | |
| Inlet Concentration of targets or analytes () | 4.6 × 10⁻⁶ | |
| Adsorption coefficient at the wall () | 125 | |
| Desorption coefficient at the wall or elution () | 10−5 | |
| Initial concentration in available hybridization sites () | 9.064 × 10⁻⁸ | |
| Average flow velocity () | 10−3 | |
| The conductivity of the ionic solution () | 1.1845 × 10⁻¹ | |
| The relative permittivity of the fluid | 80.2 | |
| ζ | Zeta potential () | −0.1 |
| The maximum value of AC potential () | 0.1 | |
| ω | Angular frequency of AC potential () | 50.265 |
| Pressure in the second outlet for case S-05 () | −2 | |
| Height of the microchamber () | 10−3 | |
| Height of the volume above the biosensor for case H-03 () | 2.5 × 10⁻⁴ | |
| Length of the microchamber () | 10−2 | |
| Width of the micro () | 10−2 | |
| Width of the inlet () | 1.25 × 10⁻³ | |
| Width of the outlet () | 10−3 |
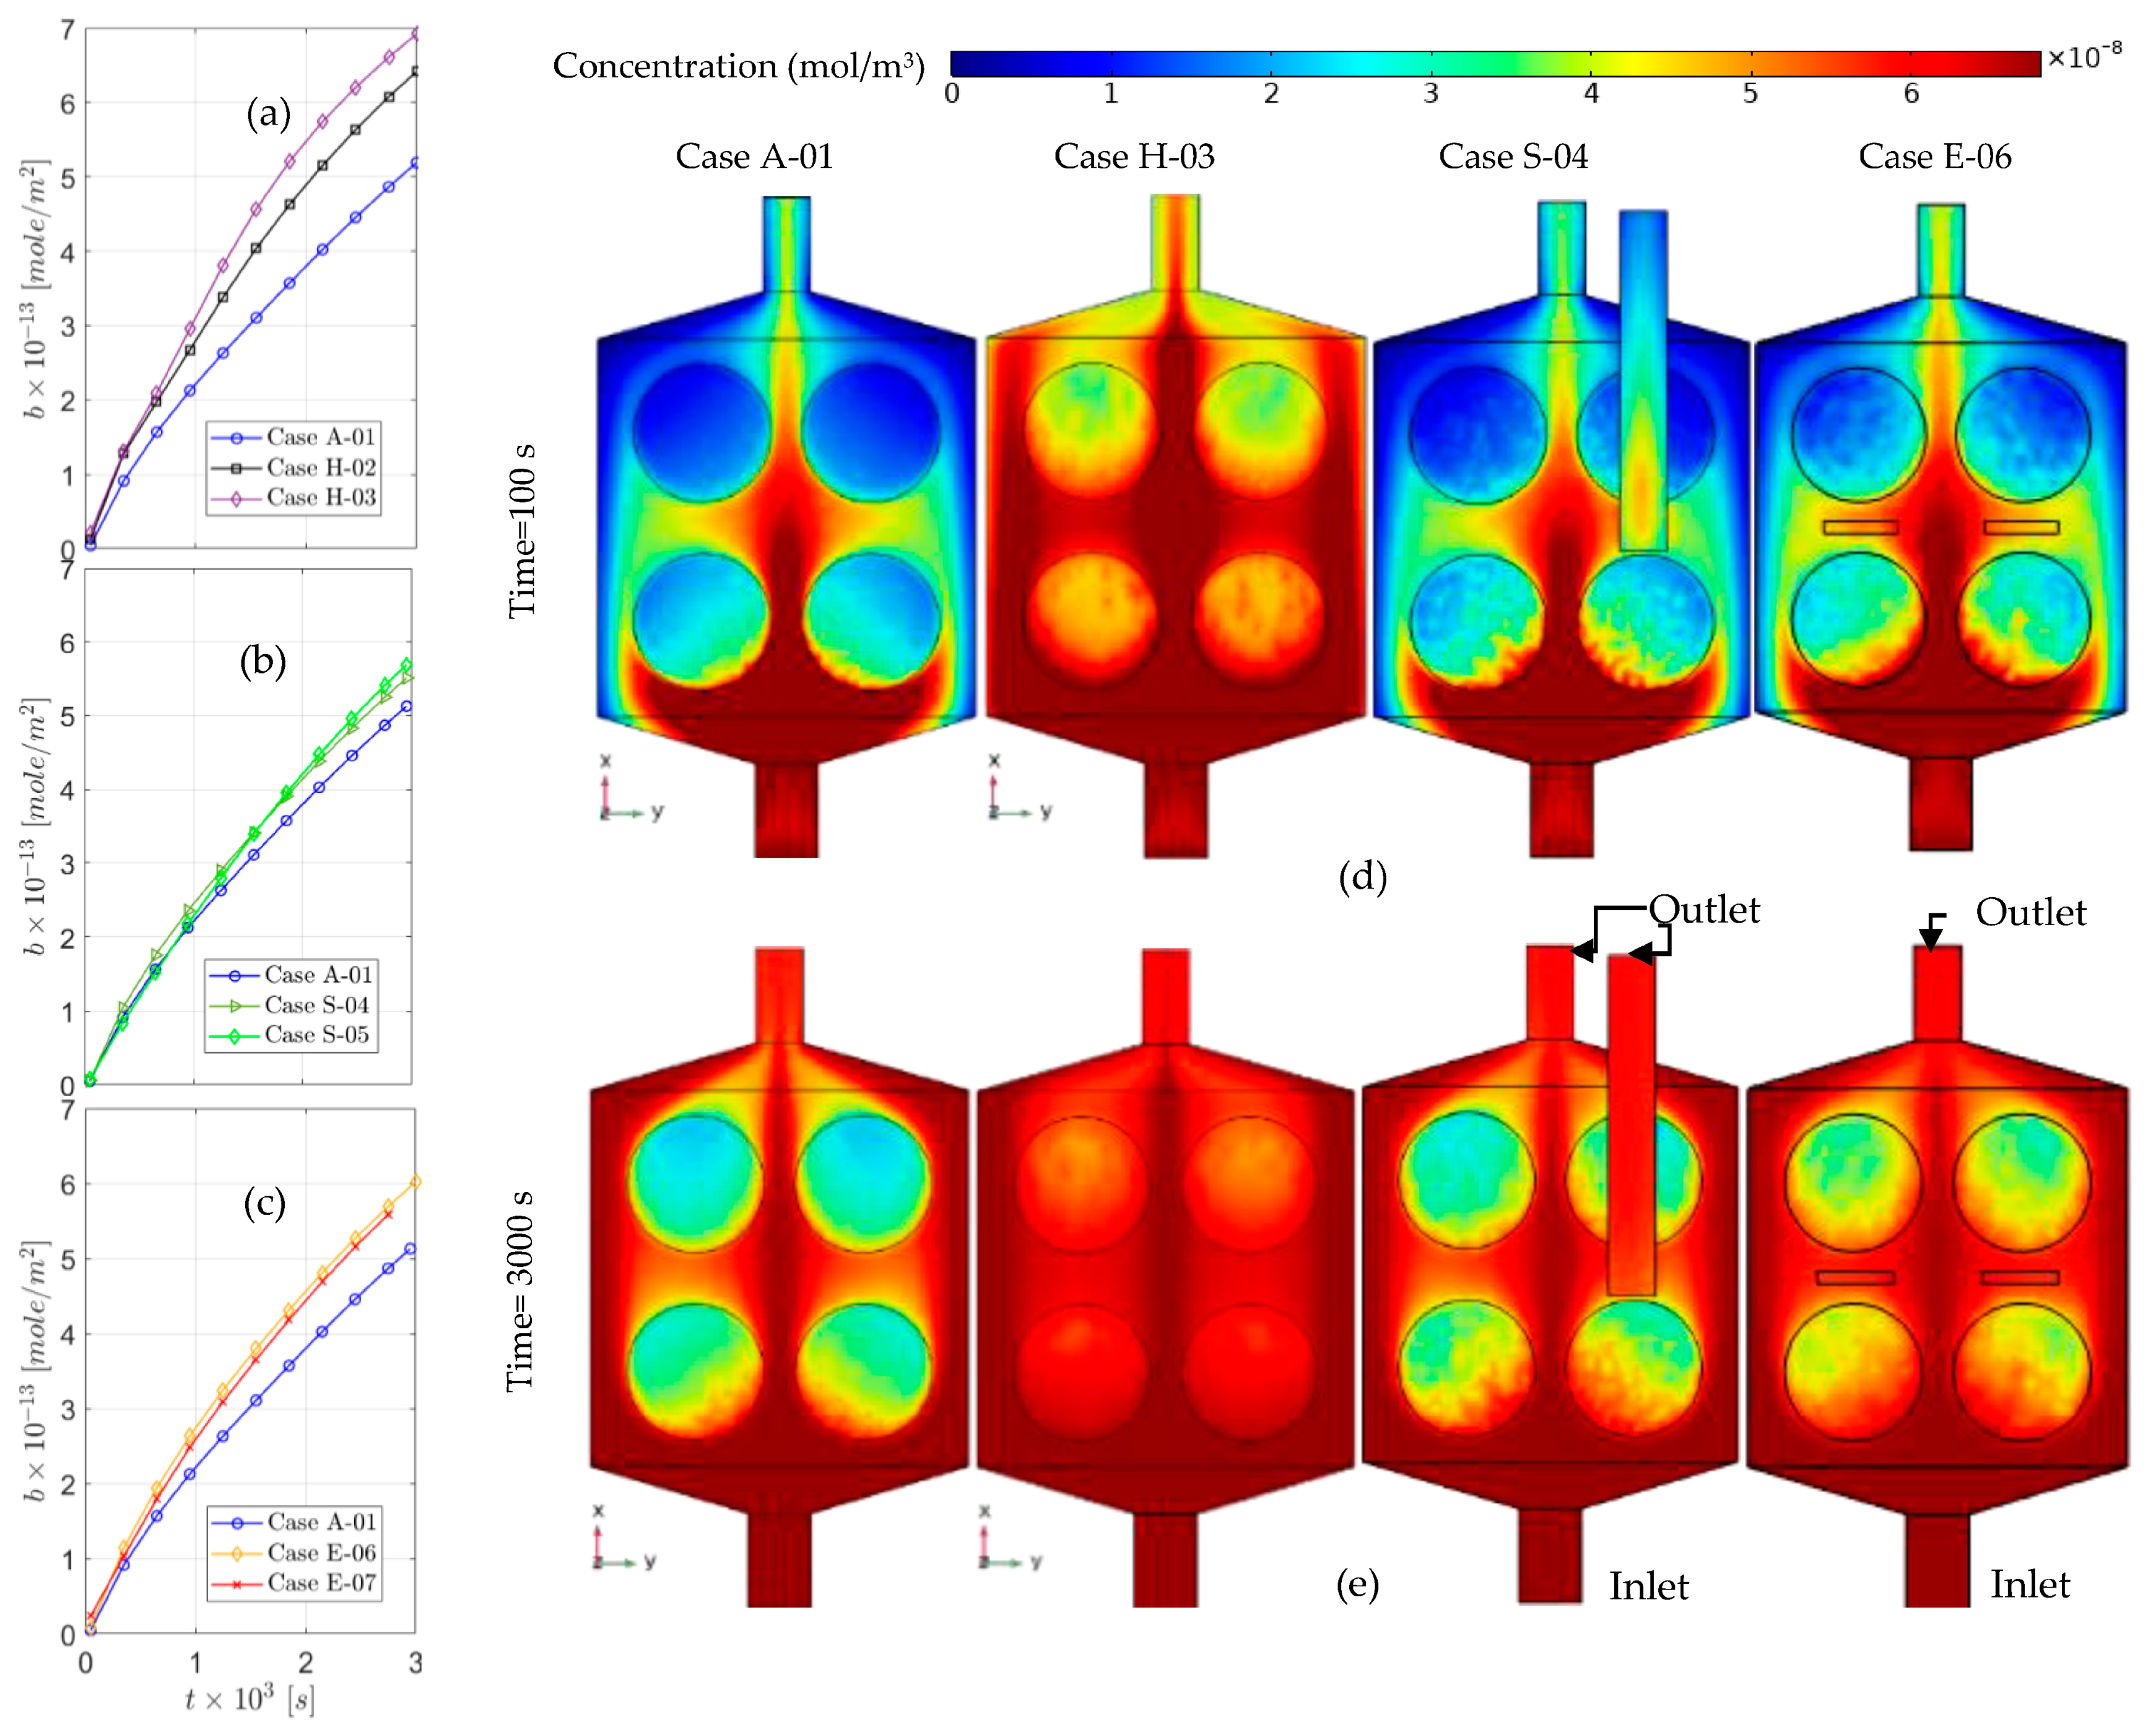
| Case A-01 | 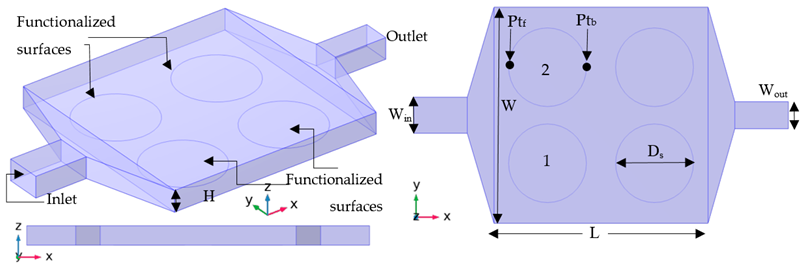 |
| Case Series H | 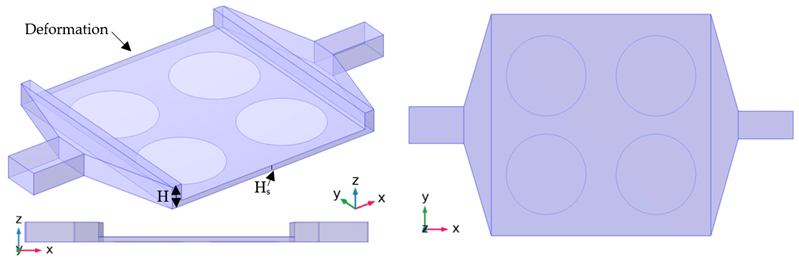 |
| Case Series S | 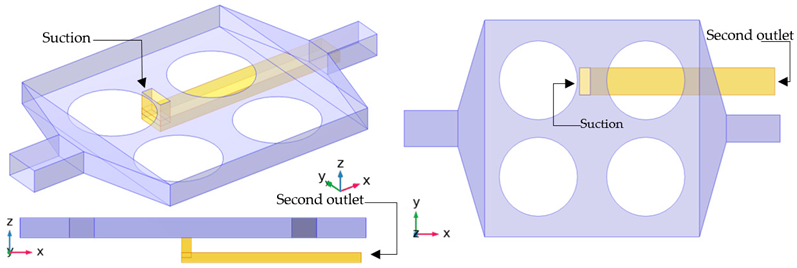 |
| Case Series E | 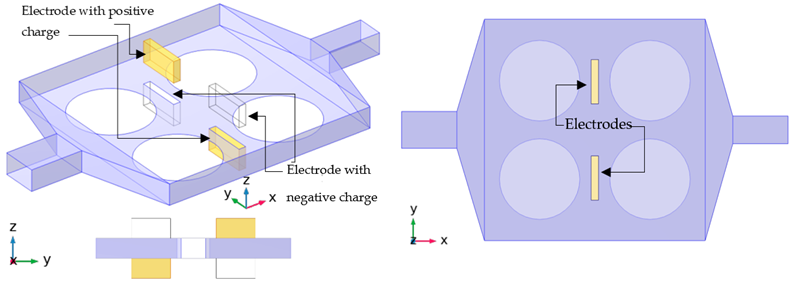 |
| Name | Hs | Po2 | V | Description |
|---|---|---|---|---|
| Case A-01 | The original experimental setup. | |||
| Case H-02 | Deformation is added at the top of the channel of case A-01. | |||
| Case H-03 | The height of the deformation in case H-02 is halved. | |||
| Case S-04 | A second outlet is added close to case A-01. | |||
| Case S-05 | A suction is added to the case S-04. | |||
| Case E-06 | The Electroosmotic effect is applied to case A-01. | |||
| Case E-07 | The potential in Case E-06 is doubled for this case. |
| Boundary | Concentration, Velocity, and Electric Potential |
|---|---|
| Inlet | , |
| Outlet | |
| Walls | , no-slip |
| Functionalized surfaces | , no-slip |
| Insulated (E setup) | , |
| Electrodes (E setup) |
Publisher’s Note: MDPI stays neutral with regard to jurisdictional claims in published maps and institutional affiliations. |
© 2021 by the authors. Licensee MDPI, Basel, Switzerland. This article is an open access article distributed under the terms and conditions of the Creative Commons Attribution (CC BY) license (https://creativecommons.org/licenses/by/4.0/).
Share and Cite
Shahbazi, F.; Souri, M.; Jabbari, M.; Keshmiri, A. Flow Control Techniques for Enhancing the Bio-Recognition Performance of Microfluidic-Integrated Biosensors. Appl. Sci. 2021, 11, 7168. https://doi.org/10.3390/app11157168
Shahbazi F, Souri M, Jabbari M, Keshmiri A. Flow Control Techniques for Enhancing the Bio-Recognition Performance of Microfluidic-Integrated Biosensors. Applied Sciences. 2021; 11(15):7168. https://doi.org/10.3390/app11157168
Chicago/Turabian StyleShahbazi, Fatemeh, Mohammad Souri, Masoud Jabbari, and Amir Keshmiri. 2021. "Flow Control Techniques for Enhancing the Bio-Recognition Performance of Microfluidic-Integrated Biosensors" Applied Sciences 11, no. 15: 7168. https://doi.org/10.3390/app11157168
APA StyleShahbazi, F., Souri, M., Jabbari, M., & Keshmiri, A. (2021). Flow Control Techniques for Enhancing the Bio-Recognition Performance of Microfluidic-Integrated Biosensors. Applied Sciences, 11(15), 7168. https://doi.org/10.3390/app11157168