Featured Application
Laser-induced breakdown spectroscopy is used for the detection of honey adulteration by using the spectral lines of its inorganic elements.
Abstract
In the present work, laser-induced breakdown spectroscopy, aided by some machine learning algorithms (i.e., linear discriminant analysis (LDA) and extremely randomized trees (ERT)), is used for the detection of honey adulteration with glucose syrup. In addition, it is shown that instead of the entire LIBS spectrum, the spectral lines of inorganic ingredients of honey (i.e., calcium, sodium, and potassium) can be also used for the detection of adulteration providing efficient discrimination. The constructed predictive models attained high classification accuracies exceeding 90% correct classification.
1. Introduction
Honey is a sweet viscous substance made by bees by collecting nectar from the sweet secretions of trees and plants. Its major constituents are carbohydrates, with the main types of carbohydrates being sugars. The most common types of sugars found in honey are glucose and fructose, which account for honey’s sweet flavor [1,2,3,4]. Its consumption has been related with various health benefits and it is widely used as a sugar substitute. A major issue in the market is to tackle food fraud. Honey is one of the most commonly adulterated foods, since it is easy to adulterate with other types of syrup, or lower quality honey [5,6,7]. Some common techniques to evaluate and quantitively describe its adulteration is isotope ratio mass spectroscopy [8,9], gas and liquid chromatography [10,11], and near-infrared spectroscopy [12].
In this work, we investigate the use of a spectroscopic method, namely laser-induced breakdown spectroscopy (LIBS), for the detection of adulteration of honey samples with glucose syrup. LIBS is a laser-based method, where a focused laser beam is used to excite and ionize a sample, in one step, to produce a plasma on its surface that contains excited atoms, ions, electrons, and also various fragments of molecular species existing in the sample [13,14]. The plasma, resulting from the interaction of the laser with the sample, emits radiation, which is short-lived, in general, and results from the de-excitation of the excited atoms and ions, the de-accelerating electron (bremsstrahlung), and the different recombination processes that can occur. The most important for the present study are the spectral lines from the de-excitations of atoms and ions, as well as some molecular bands from small molecules, in principle [15]. The main attribute of this method is that the plasma radiation emitted light can be recorded and spectrally analyzed, therefore providing a mean for qualitative and quantitative (under some conditions) analysis of the sample’s elemental composition. So far, LIBS has been proposed and applied in many applications, ranging from the analysis of metals [16,17], to combustion diagnostics [18], art works restoration/authentication [19], and, more recently, even in space exploration [20,21]. Due to its ability to analyze highly inhomogeneous materials, LIBS has been proposed as an attractive method for elemental mapping and imaging [22]. Applications can be found in a wide range of studies, such as the analysis of historical mortar samples [23] and the detection of selenium enrichment in mushrooms [24]. Moreover, because LIBS can rapidly provide the results and can create large spectroscopic datasets, it is commonly combined with machine learning and chemometric algorithms for classification and calibration/regression purposes [25,26,27], providing new tools for the quantitative and qualitative analysis of spectroscopic data.
In the last decade, LIBS has been also proposed for the analysis of foodstuff, e.g., for the detection of different substances in food [28,29] and for classification of edible olive oils [30,31,32], milk [33,34], and honey. Therefore, in a study by Se et al. [35], LIBS was used for the measurement of the concentrations of some Ca, Mg, and Na minerals using partial least square regression (PLSR). Lastra-Mejias et al. [36] performed LIBS measurements supported by chaotic parameters to categorize six European honeys of diverse botanical origins as well as to detect samples mixed with rice syrup. In the same spirit, Nespeca et al. [37] employed LIBS, aided by multivariate analytical approaches, to detect and quantify adulterants in honey samples. Similarly, with [37], acacia honey mixed with high-fructose corn syrup and rape honey were analyzed by LIBS in the work of Peng et al. [38], in order to determine the characteristic spectral features of pure honey and adulterants and identify the feature variables that are related to adulteration, and finally to quantify the adulterant content using univariate and multivariate analysis. Zhao et al. [39] used LIBS and some machine learning methods to distinguish various honeys based on their geographical origins. They looked at two distinct honey types (acacia honey and multifloral honey), each of which had three distinct geographical origins. More recently, Stefas et al. [40] used LIBS for the classification of honeys based on their floral origin, by analyzing the LIBS spectra after having performed optimization of the experimental conditions employing both unsupervised and supervised machine learning approaches, and they determined the importance of the different spectral features.
In this work, the effect of the addition of glucose syrup in honey LIBS spectra is studied. More specifically, the spectral features stemming from different inorganic elements found in honey, e.g., calcium (Ca), sodium (Na), and potassium (K), are identified and studied and are subsequently used for the detection of the addition of syrup. In that view, it is shown that the intensities of the spectral lines of these inorganic elements are exhibiting a decreasing trend of their intensities with increasing of the added syrup content, implying their potential in indicating the adulteration of honey. Moreover, by adopting the methodology previously reported by Stefas et al. [41], linear discriminant analysis (LDA) is used for dimensionality reduction and classification of the LIBS spectra. The use of Random Forests permitted us to keep only a few spectral features, basically those belonging to the inorganic elements of honey, that contribute importantly, and we assessed their use for the detection of adulteration.
2. Materials and Methods
2.1. Samples
A total of 15 honeys of different floral origins (e.g., fir, thyme, multifloral, and pine) were used in this study and were previously characterized by pollen analysis and conventional physicochemical parameters as determined by the European and Greek legislation. They are listed in Table 1. Adulterated honey samples were prepared by mixing a fir, a thyme, and a multifloral origin honey with different amounts of glucose syrup (C6H14O7). The honey samples were mildly heated in a water bath, and then, they were mixed with the preweighed amounts of glucose while a magnetic stirrer was used for homogenization of the mixtures. Thus, adulterated honey samples of 10, 20, 30, 40, 50, 60, 70, 80, and 90% (w/w) were obtained. The unadulterated honey samples corresponded to 0% w/w, and glucose syrup samples corresponded to 100% w/w.

Table 1.
Honey samples.
In total, 45 samples (i.e., the initial 15 honeys, 27 adulterated samples, and 3 glucose syrup samples) were used for classification purposes following two different approaches. Initially, the data were split into two sets: one for training and one for testing the algorithm. The training set consisted of 33 samples: 10 honey samples, 21 adulterated honey samples (7 samples being adulterated fir honey, 7 samples being thyme adulterated honey, and 7 samples being adulterated multifloral honey), and 2 glucose samples. The test set consisted of 12 samples: 5 honey samples, 6 adulterated honey samples (2 from each honey, i.e., fir, thyme, and multifloral, which were chosen randomly), and 1 glucose sample.
Following the second approach, the data were split into two sets: the first set containing 30 samples used for training the algorithms, and the second set containing 15 samples for testing and validation. The training set contained 10 honey samples, 18 adulterated honey samples (9 adulterated fir honey samples and 9 thyme adulterated honey samples), and 2 glucose samples. The test set consisted of 5 honey samples, 9 adulterated honey samples (resulting from the adulteration of the multifloral honey), and 1 glucose sample.
The above methodology was chosen to assess the effectiveness of the detection of honey adulteration by LIBS technique by means of two approaches presenting increasing degree of difficulty. In the first case, the algorithm was trained considering all three adulterated honeys (fir, thyme, and multifloral) and was tested on 6 adulterated samples (2 different adulterations randomly selected from each one), while in the second case, the whole set of the 9 adulterated multifloral honey samples were used for prediction. The increasing difficulty arises from the fact that in the second approach, the algorithm was not trained with any adulterated multifloral honey sample, while it was asked to recognize and predict them correctly.
2.2. LIBS Setup
For the LIBS experiments a, 4 ns Q-switched Nd: YAG laser (Quanta-Ray INDI, Spectra Physics) operating at a repetition rate of 10 Hz, at its fundamental frequency, at 1064 nm, was used for creating the plasma. The laser energy was set at ~70 mJ and the laser beam was focused on the sample surface with a 150 mm focal length lens. The plasma emission was collected by a quartz lens and was introduced to a quartz optical fiber bundle coupled to the entrance slit of a portable spectrograph (AvaSpec-ULS4096CL-EVO (CMOS)) equipped with a CMOS detector (CMOS linear image sensor, 4096 pixels) and a diffraction grating with 300 lines/mm. From the 4096 pixels of the detector, only 2751 pixels were used, corresponding to the 200 to 1000 nm spectral region. The optimum conditions for the detector gating were a gate delay, td, of 1.28 μs, and a gate width, tw, of 1.05 ms. The width of the spectrograph slit was set at 10 μm.
The LIBS measurements of the honey samples were performed according to the following procedure: the LIBS spectra of ten successive laser shots obtained at one location on the sample’s surface were averaged, corresponding to one LIBS measurement. A total of 50 such LIBS measurements were collected at different positions on the sample’s surface and were employed for the subsequent statistical analysis by the machine learning algorithms.
2.3. Data Analysis
The collected LIBS spectroscopic data were analyzed in the Python programming environment using the libraries Pandas, Numpy, and Scikit-Learn [41]. Pandas and Numpy were used to read the obtained spectroscopic data, while Scikit-Learn was used for the classification of the data. Three machine learning methods were used for analyzing the obtained LIBS spectra: one unsupervised (i.e., multidimensional scaling (MDS) [42]) and one supervised (i.e., linear discriminant analysis (LDA) [43] and extremely randomized trees (ERT) [44]).
MDS is an unsupervised algorithm used to visualize LIBS spectroscopic data, taking into consideration their degree of resemblance. More specifically, MDS generates a matrix of distances between the raw data or objects, in pairs, and projects each object into an abstract Cartesian space of lower dimensionality compared to the dimensions of the raw data objects, so achieving the dimensionality reduction of a given dataset, where the spectroscopic data points are plotted, initially in a three-dimensional, and then in a two-dimensional, scatter plot, to visualize the LIBS data).
LDA is a supervised algorithm, which is used as a classifier and/or as a dimensionality reduction technique. LDA implements a linear decision boundary, which is generated by fitting class conditional densities, such as the Gaussian density, to the data. These data are sorted to certain classes and the LDA model assumes that all classes share the same covariance matrix. In the present work, LDA is used both as a classifier (i.e., to generate a predictive model) and as a dimensionality reduction technique as well. In more detail, for the development of the LDA model, the training dataset was used, and the training procedure was performed by k-fold cross-validation. k was chosen to have a value of 10, and the training data were shuffled and split into k groups. The k-1 groups were used to train the classifier, while the remaining group was used for assessing the predictive ability of the classifier, by computing its classification accuracy. All of the k subsamples were used for prediction and the procedure was repeated k-times, with the total accuracy of the classifier being derived from the averaging of the accuracies of each fold, thus evaluating the standard deviation of the classifier’s overall accuracy. Furthermore, the predictive ability of the LDA model was tested via external validation, by predicting the test set described in Section 2.1, concluding that the prediction accuracy of the LDA model is evaluated by the confusion matrix, which is a specific table layout used to verify how much of the data were correctly classified. In this table, the columns represent the actual classes of the samples and the rows represent the classes predicted by the model. Its diagonal elements indicate the number of spectra that were predicted correctly.
Extremely randomized trees (ERT) were used for assessing the feature importances by using the experimental LIBS spectra as inputs. This method natively describes the importance of each feature to the classification result. Feature importance refers to techniques that assign a score to the input features based on how useful they are in predicting a target variable.
Following the first approach for classification, spectra from 33 samples were used for training the algorithms, and spectra from 12 samples for external validation. As a result, the LIBS raw dataset for training consisted of a data matrix of 1650 rows and 2751 columns, while the external validation dataset consisted of a data matrix of 600 rows and 2751 columns. For the second approach, spectra from 30 samples were used for training the algorithms and spectra from 15 samples for external validation. As a result, the LIBS raw dataset for training consisted of a data matrix of 1500 rows and 2751 columns, while the external validation dataset consisted of a data matrix of 750 rows × 2751 columns.
3. Results
3.1. LIBS Spectra of Honey and Adulterated Honey Samples
Figure 1a shows some representative LIBS spectra of honey, glucose syrup, and a honey–glucose syrup mixture. The spectra exhibited the characteristic spectral features which have been reported previously in the LIBS spectra of honey and in other organic materials [13,14]. Among them, the most prominent features are the atomic lines of neutral carbon (C (I)) at 247.9 nm and the Balmer series spectral lines of hydrogen (Ha and Hβ) at 696.3 and 486.1 nm, respectively, as well as the molecular bands of CN extending from 350 and 400 nm. However, as shown in Figure 1a, these features are quite similar, and they cannot be correlated with the degree of adulteration as they are present both in the honey and the adulterants. Figure 1b,c, show the spectral lines of some of the inorganic elements present in honey, e.g., the calcium ion lines (Ca (II)) at 393.3 and 396.8 nm and the sodium D lines (Na (I)) at 589.0 and 589.6 nm, as well as the potassium (K (I)) lines at 766.5 and 769.9 nm. As discussed in the next paragraph, this last group of spectral lines is of particular interest in this work. As can be seen from the comparison of the LIBS spectra of honey and the glucose syrup, the spectral features of the inorganic components are absent from the spectrum of glucose syrup. In addition, from the comparison of the honey LIBS spectrum (black line) with that of an adulterated honey (red line), it is evident that the adulterated sample exhibits notably lower intensity spectral lines of these inorganic species. These qualitative observations indicate that the spectral lines of these inorganic elements can be, in principle, employed for the detection of honey’s adulteration. In Figure 1d, the spectral lines of Ca (II), Na (I), and K (I) obtained from honey samples mixed with glucose syrup at various ratios are presented in more detail. From this figure, it becomes evident that the relative intensities of these spectral lines are reduced as the glucose content (i.e., the honey–glucose ratio) is increasing.
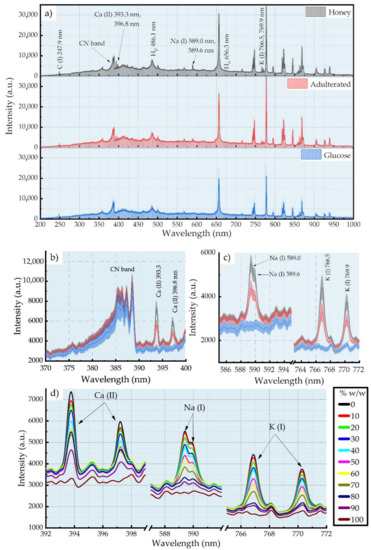
Figure 1.
(a) LIBS spectra of honey, adulterated honey (50% w/w), and glucose syrup samples. (b) CN band and Ca (II) spectral lines, (c) Na (I) and K (I) spectral lines in a honey, an adulterated honey, and a glucose syrup sample. (d) Ca (II), Na (I), and K (I) spectral lines of different % adulterated honey samples.
3.2. Dimensionality Reduction and Classification of LIBS Spectra for Adulteration Detection
For the visualization of the level of similarity of the collected LIBS spectra, multidimensional scaling was used (Figure 2). As can be seen, some honey samples are clearly distinguished from the others, forming a large cluster, while the rest of the samples are grouped in a second cluster that contains honey, adulterated honey, and glucose samples. The mixing of the honey samples with the adulterated ones is due to the fact that they were used to make the adulterated ones, thus exhibiting similar spectral characteristics. Moreover, some adulterated samples were found placed near to the glucose ones, again indicating their similarities, because the high glucose content adulterated honey samples have very similar spectral characteristics with those of glucose samples.
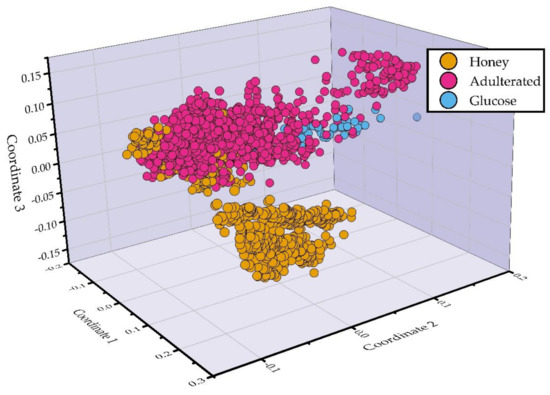
Figure 2.
Multidimensional scaling (MDS) of the LIBS spectra.
Next, the training and test set of the first approach (see Samples section, Section 2.1) were used for the construction of the predictive model by means of the LDA algorithm. It must be noted that except for the construction of a predictive model, LDA is capable of visualization of multidimensional data (see also Data Analysis section, Section 2.3), and the corresponding plot is presented in Figure 3a. As can be seen, all of the classes (i.e., honey, adulterated honey, and glucose syrup samples) are clearly distinguishable between them, indicating the differences between the samples. The obtained classification accuracy determined via 10-fold cross-validation was (95.6 ± 1.2)% and the test accuracy obtained via external validation was 91.8%. For a more detailed insight of the classification results, the corresponding confusion matrix is presented in Figure 3b. As can be seen, from the 200 honey spectra, only five were misclassified as adulterated honeys, and also, from the 400 adulterated honey spectra, 38 were misclassified as honey and two as glucose syrup spectra, while all of the 50 glucose syrup spectra were correctly predicted. It should be noted that, in the case of the adulterated honey spectra that were misclassified as honeys, they belonged to samples with relatively low percentage of adulteration (i.e., 10% and 20% (w/w)), while the two misclassified spectra that were predicted as glucose belonged to the 90% (w/w) adulterated sample.
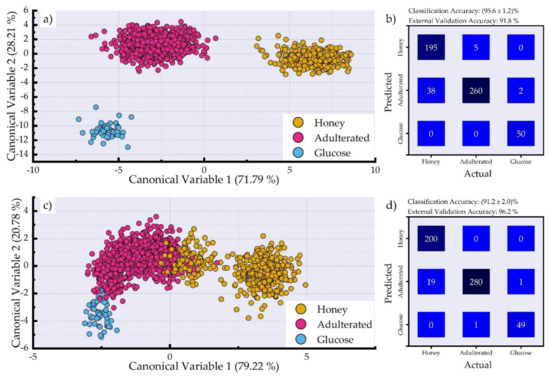
Figure 3.
(a) LDA canonical variable plot employing the LIBS spectra. (b) Confusion matrix showing the prediction of the test samples using the LDA algorithm employing the LIBS spectra. (c) LDA canonical variable plot employing only the spectral lines of Ca (II), Na (I), and K (I) (see Figure 2). (d) Confusion matrix showing the prediction of the test samples using the LDA algorithm employing only the spectral lines of Ca (II), Na (I), and K (I).
Next, the capabilities of the constructed predictive model were assessed using only the spectral lines of Ca, Na, and K (see Figure 1d), and, more specifically, by using the spectral regions 392–399 nm, 587–592 nm, and 765–772 nm. The results obtained using the LDA algorithm are shown in Figure 3c. As can be seen, some of the glucose syrup samples are slightly overlapping with the adulterated honey samples, as well as with some honey samples. The overlapping honey samples belong to the samples that were used to prepare the adulterated honey samples, while the rest of the honey samples are clearly distinguishable. The obtained classification and test accuracies were found to be (91.2 ± 2)% and 96.2%, respectively. Then, for more detailed overview of the constructed model’s performance, the confusion matrix is presented in Figure 3d, as before. In this case, a better algorithmic behavior was observed, since only 20 adulterated samples’ spectra (19 as honey and one as glucose syrup spectra) of the total 300 were misclassified, while just one glucose syrup spectrum was predicted as an adulterated one, and none of the honey spectra were falsely predicted. Despite the fact that the accuracies are slightly lower than using the whole LIBS spectra, these results are quite impressive because they indicate that honey adulteration can be detected equally effectively by using only specific emissions (Ca, Na, and K) with great success.
Afterwards, the data from the second approach (see Samples section, Section 2.1) were used as input for the algorithms. Thus, LDA was used to classify the LIBS spectra into three classes, namely the honey, the adulterated honey, and the glucose syrup classes. LDA is used here both for dimensionality reduction and as a classifier. The LDA output is graphically presented in Figure 4a. As can be seen the glucose samples are clearly separated from all the other samples. The honey samples and the adulterated honey samples are also clearly separated, although they are not very distant, indicating their similarities, as well as the fact that some overlapping could potentially occur between them, for instance when trying to predict new samples that are previously unseen by the algorithm. The classification accuracy is (95.6 ± 0.8)% and resulted from a 10-fold cross-validation performed using the training data. The external validation accuracy was determined to be 90.5%. The corresponding confusion matrix is presented in Figure 4b. As can be seen, 60 spectra arising from the adulterated honey samples were misclassified as honey samples. These spectra correspond to samples that contain 10% and 20% (w/w) of glucose syrup. It is, thus, evident that some misclassifications may occur at low percentages of adulteration. Moreover, only three spectra from the adulterated samples were misclassified as glucose syrup. However, these spectra correspond to adulterated honey samples containing 90% (w/w) of glycose syrup. In fact, in this case, the LIBS spectra tend to be very similar to the spectra of glucose syrup, lacking the spectral lines of the inorganic elements (see Figure 1d) observed in the honey samples. Last, but not least, eight spectra of honeys were misclassified as adulterated honey samples.
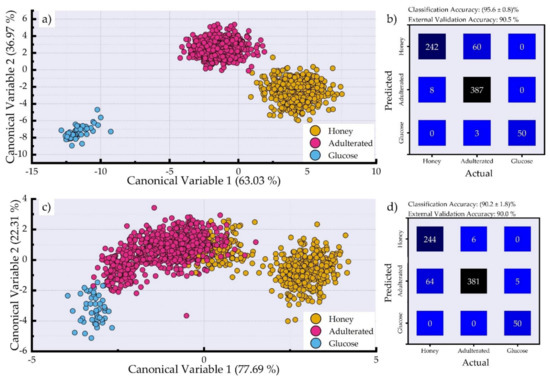
Figure 4.
(a) LDA canonical variable plot employing the LIBS spectra. (b) Confusion matrix showing the prediction of the test samples using the LDA algorithm employing the LIBS spectra. (c) LDA canonical variable plot employing only the spectral lines of Ca (II), Na (I), and K (I) (see Figure 2). (d) Confusion matrix showing the prediction of the test samples using the LDA algorithm employing only the spectral lines of Ca (II), Na (I), and K (I).
Next, the spectral lines of Ca, Na, and K, shown in Figure 1d, were used to assess the distinguishability of the adulterated honey samples from the honey samples. The results obtained using the LDA algorithm are presented in Figure 4c. As can be seen while the glucose syrup samples are separated from the other samples, some honey samples are overlapping with the adulterated honey samples. Again, they were the honey samples that were used for the preparation of the adulterated honey samples. The honey samples that were not used to prepare any adulterated samples are totally distinguished from the rest of the samples.
The obtained classification accuracy was (90.2 ± 1.8)% and resulted from a 10-fold cross-validation of the training data. The external validation accuracy was found to be 90.5%. The corresponding confusion matrix is shown in Figure 4d. A total of 64 spectra of adulterated honey samples were misclassified as honey, and five of them as glucose syrup. Additionally, only six spectra of honey samples were misclassified as adulterated honey samples. Despite the lower accuracies obtained compared to using the entire LIBS spectra, these results are remarkably interesting as they indicate that honey can be discriminated from adulterated mixtures with quite high accuracies by using the spectral lines of only three inorganic elements (i.e., Ca (II), Na (I), and K (I)), thus suggesting that these spectral lines can be used for the efficient detection of honey adulteration via LIBS.
In Figure 5a, the important features (blue color lines) identified using the ERT algorithm are presented. As can be seen, there are several spectral peaks that are recognized as important by the algorithm, although they appear rather weak in the experimental LIBS spectra. Figure 5b,c present the spectral regions where the most important features occur together with the corresponding spectral regions of the LIBS spectrum. Therefore, in Figure 5b, the spectral features of Ca (II) at 393.3 and 396.8 nm are shown, exhibiting the highest importances. It is interesting to note that the algorithm seems to identify spectral features that are not clearly observed in the LIBS spectra, such as those of Mg (II) at 279.6 and 280.3 nm, and that of Ca (I) at 422.7 nm. In Figure 5c, the most important features corresponding to the K (I) and Na (I) spectral lines are shown. These findings confirm the importance of the spectral lines of these inorganic elements for the detection of adulteration in honey. It is interesting that the spectral lines of Mg (II) and Ca (I) have been also suggested by Lastra-Mejias et al. [36] as important for the selection of the most important features for botanical origin classification. Similarly, many of the spectral features presented in the present work were also identified by Nespeca et al. [37] using the backward interval partial least squares method. In the same spirit, Peng et al. [38], trying to select the most efficient variables for the quantification of honey adulteration with high-fructose corn syrup, used different algorithms and also concluded with the same spectral features determined in the present work.
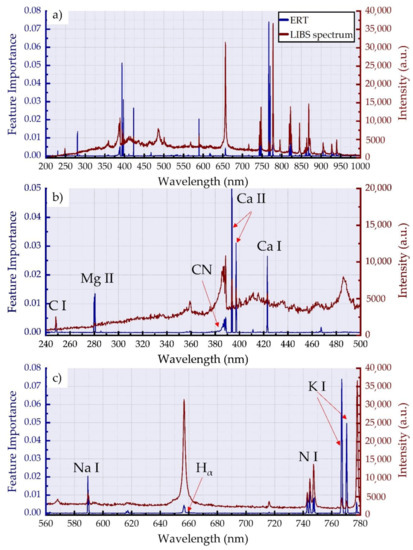
Figure 5.
Feature importance plot obtained using the ERT algorithm together with a honey LIBS spectrum in the (a) 200–1000 nm, (b) 240–500 nm, and (c) the 560–780 nm spectral regions.
4. Conclusions
In the present work, LIBS was used to assess the feasibility of detection of adulteration of honey with some glucose syrup. In that view, LIBS spectra of honey samples, adulterated honey samples, and glucose syrup were acquired and were compared. The amount of added glucose syrup in the honey samples ranged from 10% to 90% (w/w). The assessment of the discrimination procedure was conducted following two different approaches of samples split into train and test sets, each one exhibiting a different level of difficulty concerning the algorithmic procedure. The obtained accuracies were quite high, exceeding 90%, for both approaches. Furthermore, it was found that some of the observed spectral lines, in particular those of some inorganic ingredients of honey (i.e., calcium, sodium, and potassium), were strongly varying in the degree of adulteration, exhibiting a clearly decreasing trend as the degree of adulteration increased. Based on this observation, the spectral lines of these three elements were selected as key parameters for the detection of honey adulteration, using LDA for classification, resulting in quite high accuracies. This result is very useful, since, instead of the whole LIBS spectrum, only three spectral lines are used for the construction of a successful predictive model for honey adulteration. Finally, the application of ERT confirmed the importance of these features for the detection of honey adulteration, and identified spectral features that are not clearly observed in the spectra (e.g., they are very weak, or overlap with nearby stronger features, etc.), such as those of Mg (II) at 279.6 and 280.3 nm and Ca (I) at 422.7 nm. The present findings suggest the great potential of LIBS aided by machine learning for the detection of honey adulteration.
Author Contributions
D.S., N.G., P.K., and E.N.: data curation; S.C.: funding acquisition; D.S., N.G., P.K., E.N., and V.K.: investigation; C.B. and S.C.: methodology; S.C.: project administration; S.C.: resources; D.S., N.G., E.N., and V.K.: software; C.B. and S.C.: supervision; D.S., N.G., P.K., E.N., and V.K.: writing—original draft; S.C. and C.B.: review and editing. All authors have read and agreed to the published version of the manuscript.
Funding
This research received no external funding.
Institutional Review Board Statement
Not applicable.
Informed Consent Statement
Not applicable.
Acknowledgments
Support from Greek national funds through the Public Investments Program (PIP) of General Secretariat for Research and Technology (GSRT), under the Emblematic Action “The bee routes” (project code: 2018ΣΕ01300000) is acknowledged. We also thank the network of the Emblematic Action “The Bee Routes” for making available the honey samples. D.S. acknowledges support from the «Andreas Mentzelopoulos Foundation».
Conflicts of Interest
The authors declare no conflict of interest.
References
- Alvarez-Suarez, J.M. Bee Products-Chemical and Biological Properties; Alvarez-Suarez, J.M., Ed.; Springer International Publishing: New York, NY, USA, 2017; ISBN 9783319596891. [Google Scholar]
- Escuredo, O.; Seijo, M.C. Honey: Chemical composition, stability and authenticity. Foods 2019, 8, 577. [Google Scholar] [CrossRef] [PubMed] [Green Version]
- Doner, L.W. The sugars of honey—A review. J. Sci. Food Agric. 1977, 28, 443–456. [Google Scholar] [CrossRef] [PubMed]
- Baglio, E. Chemistry and Technology of Honey Production; Springer: Cham, Switzerland, 2018. [Google Scholar]
- Anklam, E. A review of the analytical methods to determine the geographical and botanical origin of honey. Food Chem. 1998, 63, 549–562. [Google Scholar] [CrossRef]
- Moore, J.C.; Spink, J.; Lipp, M. Development and application of a database of food ingredient fraud and economically motivated adulteration from 1980 to 2010. J. Food Sci. 2012, 77. [Google Scholar] [CrossRef]
- Fairchild, G.F.; Nichols, J.P.; Capps, O. Observations on Economic Adulteration of High-Value Food Products: The Honey Case. J. Food Distrib. Res. 2003, 34, 38–45. [Google Scholar]
- Padovan, G.J. Detection of adulteration of commercial honey samples by the 13C/12C isotopic ratio. Food Chem. 2003, 82, 633–636. [Google Scholar] [CrossRef]
- Tosun, M. Detection of adulteration in mulberry pekmez samples added various sugar syrups with 13C/12C isotope ratio analysis method. Food Chem. 2014, 165, 555–559. [Google Scholar] [CrossRef]
- Cabañero, A.I.; Recio, A.J.L.; Rez, M.R. Ä Liquid Chromatography Coupled to Isotope Ratio Mass Spectrometry: A New Perspective on Honey Adulteration Detection. J. Agric. Food Chem. 2006, 54, 9719–9727. [Google Scholar] [CrossRef]
- Wang, S.; Guo, Q.; Wang, L.; Linlin, W.; Shi, H.; Cao, H.; Cao, B. Detection of honey adulteration with starch syrup by high performance liquid chromatography. Food Chem. 2015, 172, 669–674. [Google Scholar] [CrossRef]
- Li, S.; Zhang, X.; Shan, Y.; Su, D.; Ma, Q.; Wen, R.; Li, J. Qualitative and quantitative detection of honey adulterated with high-fructose corn syrup and maltose syrup by using near-infrared spectroscopy. Food Chem. 2017, 218, 231–236. [Google Scholar] [CrossRef]
- Cremers, D.A.; Radziemski, L.J. Handbook of Laser-Induced Breakdown Spectroscopy, 2nd ed.; John Wiley: Chichester, UK, 2013; ISBN 9781119971122. [Google Scholar]
- Noll, R. Laser-Induced Breakdown Spectroscopy: Fundamentals and Applications; Cambridge University Press: Cambridge, UK, 2012; ISBN 9783642206689. [Google Scholar]
- Hermann, J.; Lorusso, A.; Perrone, A.; Strafella, F.; Dutouquet, C.; Torralba, B. Simulation of emission spectra from nonuniform reactive laser-induced plasmas. Phys. Rev. E 2015, 92, 053103. [Google Scholar] [CrossRef]
- Stavropoulos, P.; Palagas, C.; Angelopoulos, G.; Papamantellos, D.; Couris, S. Calibration Measurements in laser-induced breakdown spectroscopy using nanosecond and picosecond lasers. Spectrochim. Acta Part B At. Spectrosc. 2004, 59, 1885–1892. [Google Scholar] [CrossRef]
- Sattmann, R.; Sturm, V.; Noll, R. Laser-induced breakdown spectroscopy of steel samples using multiple Q-switch Nd: YAG laser pulses. J. Phys. D Appl. Phys. 1995, 28, 2181–2187. [Google Scholar] [CrossRef]
- Kotzagianni, M.; Couris, S. Femtosecond laser induced breakdown spectroscopy of air–methane mixtures. Chem. Phys. Lett. 2013, 561-562, 36–41. [Google Scholar] [CrossRef]
- De Giacomo, A.; Dell’Aglio, M.; De Pascale, O.; Gaudiuso, R.; Santagata, A.; Teghil, R. Laser Induced Breakdown Spectroscopy methodology for the analysis of copper-based-alloys used in ancient artworks. Spectrochim. Acta Part B At. Spectrosc. 2008, 63, 585–590. [Google Scholar] [CrossRef]
- Senesi, G.S.; Manzari, P.; Consiglio, A.; De Pascale, O. Identification and classification of meteorites using a handheld LIBS instrument coupled with a fuzzy logic-based method. J. Anal. At. Spectrom. 2018, 33, 1664–1675. [Google Scholar] [CrossRef]
- Rapin, W.; Meslin, P.-Y.; Maurice, S.; Wiens, R.; Laporte, D.; Chauviré, B.; Gasnault, O.; Schröder, S.; Beck, P.; Bender, S.; et al. Quantification of water content by laser induced breakdown spectroscopy on Mars. Spectrochim. Acta Part B At. Spectrosc. 2017, 130, 82–100. [Google Scholar] [CrossRef] [Green Version]
- Jolivet, L.; Leprince, M.; Moncayo, S.; Sorbier, L.; Lienemann, C.-P.; Motto-Ros, V. Review of the recent advances and applications of LIBS-based imaging. Spectrochim. Acta Part B At. Spectrosc. 2019, 151, 41–53. [Google Scholar] [CrossRef]
- Živković, S.; Botto, A.; Campanella, B.; Lezzerini, M.; Momčilović, M.; Pagnotta, S.; Palleschi, V.; Poggialini, F.; Legnaioli, S. Laser-Induced Breakdown Spectroscopy elemental mapping of the construction material from the Smederevo Fortress (Republic of Serbia). Spectrochim. Acta Part B At. Spectrosc. 2021, 181, 106219. [Google Scholar] [CrossRef]
- De Oliveira, A.P.; Leme, F.D.O.; Nomura, C.S.; Naozuka, J. Elemental imaging by Laser-Induced Breakdown Spectroscopy to evaluate selenium enrichment effects in edible mushrooms. Sci. Rep. 2019, 9, 1–10. [Google Scholar] [CrossRef]
- Zhang, D.; Zhang, H.; Zhao, Y.; Chen, Y.; Ke, C.; Xu, T.; He, Y. A brief review of new data analysis methods of laser-induced breakdown spectroscopy: Machine learning. Appl. Spectrosc. Rev. 2020, 1–23. [Google Scholar] [CrossRef]
- Pagnotta, S.; Lezzerini, M.; Campanella, B.; Legnaioli, S.; Poggialini, F.; Palleschi, V. A new approach to non-linear multivariate calibration in laser-induced breakdown spectroscopy analysis of silicate rocks. Spectrochim. Acta Part B At. Spectrosc. 2020, 166, 105804. [Google Scholar] [CrossRef]
- Vrábel, J.; Kepes, E.; Duponchel, L.; Motto-Ros, V.; Fabre, C.; Connemann, S.; Schreckenberg, F.; Prasse, P.; Riebe, D.; Junjuri, R.; et al. Classification of challenging Laser-Induced Breakdown Spectroscopy soil sample data-EMSLIBS contest. Spectrochim. Acta Part B At. Spectrosc. 2020, 169, 105872. [Google Scholar] [CrossRef]
- Peng, J.; Liu, F.; Zhou, F.; Song, K.; Zhang, C.; Ye, L.; He, Y. Challenging applications for multi-element analysis by laser-induced breakdown spectroscopy in agriculture: A review. TrAC Trends Anal. Chem. 2016, 85, 260–272. [Google Scholar] [CrossRef]
- Senesi, G.S.; Cabral, J.S.; Menegatti, C.R.; Marangoni, B.; Nicolodelli, G. Recent advances and future trends in LIBS applications to agricultural materials and their food derivatives: An overview of developments in the last decade (2010–2019). Part II. Crop plants and their food derivatives. TrAC Trends Anal. Chem. 2019, 118, 453–469. [Google Scholar] [CrossRef]
- Kongbonga, Y.G.M.; Ghalila, H.; Onana, M.B.; Ben Lakhdar, Z. Classification of vegetable oils based on their concentration of saturated fatty acids using laser induced breakdown spectroscopy (LIBS). Food Chem. 2014, 147, 327–331. [Google Scholar] [CrossRef]
- Gyftokostas, N.; Stefas, D.; Kokkinos, V.; Bouras, C.; Couris, S. Laser-induced breakdown spectroscopy coupled with ma-chine learning as a tool for olive oil authenticity and geographic discrimination. Sci. Rep. 2021, 11, 1–11. [Google Scholar] [CrossRef]
- Gyftokostas, N.; Nanou, E.; Stefas, D.; Kokkinos, V.; Bouras, C.; Couris, S. Classification of Greek Olive Oils from Different Regions by Machine Learning-Aided Laser-Induced Breakdown Spectroscopy and Absorption Spectroscopy. Molecules 2021, 26, 1241. [Google Scholar] [CrossRef]
- Bilge, G.; Sezer, B.; Eseller, K.E.; Berberoglu, H.; Topcu, A.; Boyaci, I.H. Determination of whey adulteration in milk powder by using laser induced breakdown spectroscopy. Food Chem. 2016, 212, 183–188. [Google Scholar] [CrossRef]
- Moncayo, S.; Manzoor, S.; Rosales, J.; Anzano, J.; Caceres, J. Qualitative and quantitative analysis of milk for the detection of adulteration by Laser Induced Breakdown Spectroscopy (LIBS). Food Chem. 2017, 232, 322–328. [Google Scholar] [CrossRef] [Green Version]
- Se, K.W.; Ghoshal, S.K.; Wahab, R.A. Laser-induced breakdown spectroscopy unified partial least squares regression: An easy and speedy strategy for predicting Ca, Mg and Na content in honey. Meas. J. Int. Meas. Confed. 2019, 136, 1–10. [Google Scholar] [CrossRef]
- Lastra-Mejías, M.; Izquierdo, M.; González-Flores, E.; Cancilla, J.C.; Izquierdo, J.G.; Torrecilla, J.S. Honey exposed to laser-induced breakdown spectroscopy for chaos-based botanical classification and fraud assessment. Chemom. Intell. Lab. Syst. 2020, 199, 103939. [Google Scholar] [CrossRef]
- Nespeca, M.G.; Vieira, A.L.; Júnior, D.S.; Neto, J.A.; Ferreira, E.C. Detection and quantification of adulterants in honey by LIBS. Food Chem. 2020, 311, 125886. [Google Scholar] [CrossRef] [PubMed]
- Peng, J.; Xie, W.; Jiang, J.; Zhao, Z.; Zhou, F.; Liu, F. Fast Quantification of Honey Adulteration with Laser-Induced Breakdown Spectroscopy and Chemometric Methods. Foods 2020, 9, 341. [Google Scholar] [CrossRef] [Green Version]
- Zhao, Z.; Chen, L.; Liu, F.; Zhou, F.; Peng, J.; Sun, M. Fast Classification of Geographical Origins of Honey Based on Laser-Induced Breakdown Spectroscopy and Multivariate Analysis. Sensors 2020, 20, 1878. [Google Scholar] [CrossRef] [Green Version]
- Stefas, D.; Gyftokostas, N.; Couris, S. Laser induced breakdown spectroscopy for elemental analysis and discrimination of honey samples. Spectrochim. Acta Part. B At. Spectrosc. 2020, 172, 105969. [Google Scholar] [CrossRef]
- Pedregosa, F.; Varoquaux, G.; Gramfort, A.; Michel, V.; Thirion, B.; Grisel, O.; Blondel, M.; Prettenhofer, P.; Weiss, R.; Du-bourg, V.; et al. Scikit-learn: Machine Learning in Python. J. Mach. Learn. Res. 2011, 12, 2825–2830. [Google Scholar]
- Borg, I.; Groenen, P.J.F.; Mair, P. Applied Multidimensional Scaling; Springer: Berlin/Heidelberg, Germany, 2013; ISBN 9783642318481. [Google Scholar]
- Tharwat, A.; Gaber, T.; Ibrahim, A.; Hassanien, A.E. Linear discriminant analysis: A detailed tutorial. AI Commun. 2017, 30, 169–190. [Google Scholar] [CrossRef] [Green Version]
- Geurts, P.; Ernst, D.; Wehenkel, L. Extremely randomized trees. Mach. Learn. 2006, 63, 3–42. [Google Scholar] [CrossRef] [Green Version]
Publisher’s Note: MDPI stays neutral with regard to jurisdictional claims in published maps and institutional affiliations. |
© 2021 by the authors. Licensee MDPI, Basel, Switzerland. This article is an open access article distributed under the terms and conditions of the Creative Commons Attribution (CC BY) license (https://creativecommons.org/licenses/by/4.0/).