Article

Enhanced Methane Production from Anaerobic Co-Digestion of Wheat Straw Rice Straw and Sugarcane Bagasse: A Kinetic Analysis

1
U.S. Pakistan Center for Advance Studies in Energy (USPCAS-E), National University of Sciences & Technology (NUST), H-12, Islamabad 44000, Pakistan
2
School of Chemical & Materials Engineering, National University of Sciences & Technology, H-12, Islamabad 44000, Pakistan
3
Institute of Environmental Sciences and Engineering (IESE), School of Civil and Environmental Engineering (SCEE), National University of Sciences and Technology (NUST), Islamabad 44000, Pakistan
4
Department of Electronics, Faculty of Electrical Engineering and Computer Science Technical University of Ostrava 17 Listopadu 15/2172, 70800 Ostrava-Poruba, Czech Republic
5
Department of Mechanical Engineering, Energy Division, Erciyes University, 38039 Kayseri, Turkey
*
Author to whom correspondence should be addressed.
Appl. Sci. 2021, 11(13), 6069; https://doi.org/10.3390/app11136069
Submission received: 19 April 2021 / Revised: 14 May 2021 / Accepted: 17 May 2021 / Published: 30 June 2021
(This article belongs to the Special Issue Thermal Utilization of Fuels)

Abstract

:
Future energy and environmental issues are the major driving force towards increased global utilization of biomass, especially in developing countries like Pakistan. Lignocellulosic residues are abundant in Pakistan. The present study investigated the best-mixed proportion of mechanically pretreated lignocellulosic residues i.e., wheat straw and rice straw (WSRS), bagasse and wheat straw (BAWS), bagasse, and rice straw (BARS), bagasse, wheat straw, and rice straw (BAWSRS) through anaerobic co-digestion. Anaerobic batch mode bioreactors comprising of lignocellulosic proportions and control bioreactors were run in parallel at mesophilic temperature (35 °C) for the substrate to inoculum (S/I) ratio of 1.5 and 2.5. Maximum and stable biomethane production was observed at the substrate to inoculum (S/I) ratio of 1.5, and the highest biomethane yield 339.0089123 NmLCH4/gVS was achieved by co-digestion of wheat straw and rice straw (WSRS) and lowest 15.74 NmLCH4/gVS from bagasse and rice straw (BARS) at 2.5 substrates to inoculum ratio. Furthermore, anaerobic reactor performance was determined by using bio-kinetic parameters i.e., production rate (Rm), lag phase (λ), and coefficient of determination (R2). The bio-kinetic parameters were evaluated by using kinetic models; first-order kinetics, Logistic function model, Modified Gompertz Model, and Transference function model. Among all kinetic models, the Logistic function model provided the best fit with experimental data followed by Modified Gompertz Model. The study suggests that a decrease in methane production was due to lower hydrolysis rate and higher lignin content of the co-digested substrates, and mechanical pretreatment leads to the breakage of complex lignocellulosic structure. The organic matter degradation evidence will be utilized by the biogas digesters developed in rural areas of Pakistan, where these agricultural residues are ample waste and need a technological solution to manage and produce renewable energy.

Graphical Abstract

Highlights

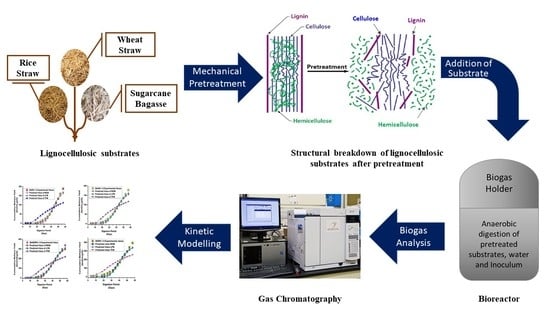
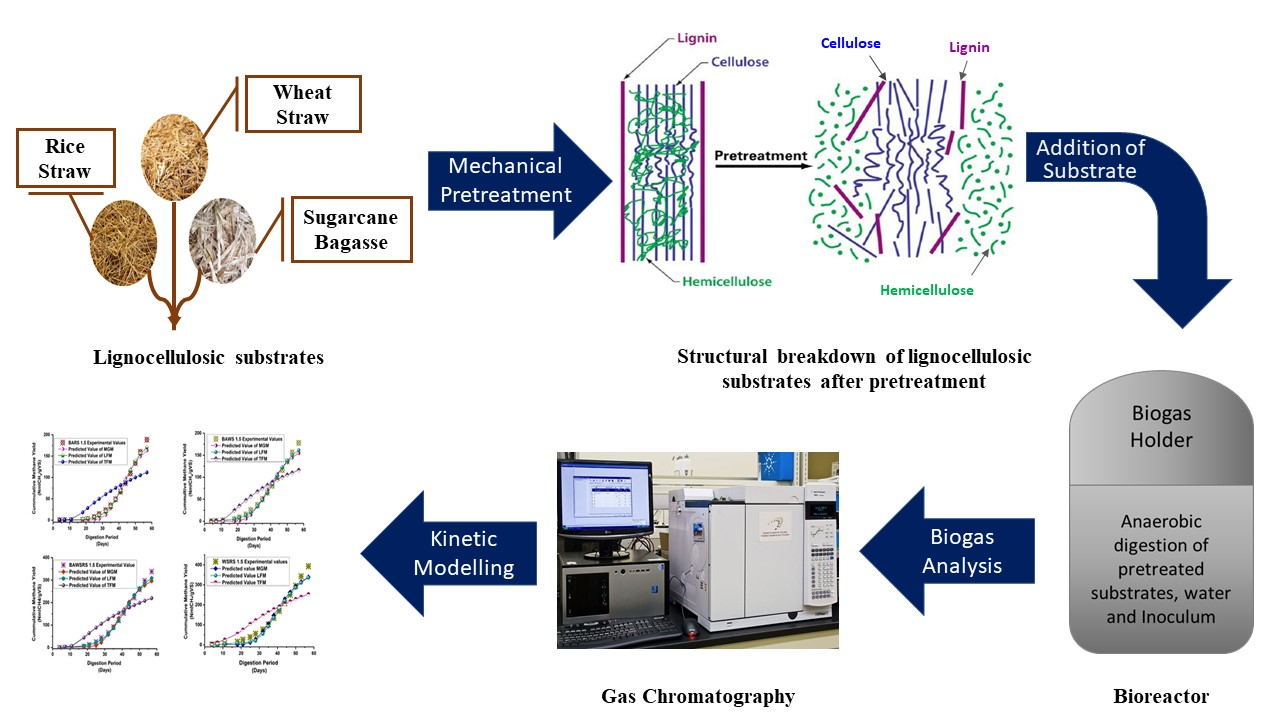
Mechanically pretreated wheat straw (WS), rice straw (RS), and sugarcane bagasse (BA)
Anaerobic co-digestion of amalgamations
Optimal substrate to inoculum ratio of 1.5 yield maximum biomethane
Logistic function model best fit evaluated by using biokinetic parameters

1. Introduction

Energy is a fundamental resource for all human activities, development in modern society, and sustainability. The global increase in the world’s population and economic activities ultimately leads to an increase in energy demands in the coming decades, which have adverse effects and implications on the environment and ecosystem of the earth. Excessive utilization of conventional energy resources resulted in environmental pollution and degradation. To overcome these challenges, the scientific community focused on renewable energy resources that are environmentally friendly, reliable, and are vastly available. Developments and utilization of renewable energy have become common several countries in the world are investing in securing huge budgets for research and development, product development, and exploitation of energy [1].
Many developing countries like Pakistan are facing a severe energy crisis and are focusing on the utilization of available indigenous energy resources to meet the growing energy demands of the country. Pakistan’s energy sector depends on the conventional methods for energy generation and imports crude oil of 14.5 US billion dollars which makes it 20% of foreign exchange for the import of fossil fuel [2]. Pakistan is enriched with solar, biomass, and wind energy resources. Biomass and bio-based energy can play a central role in the elimination of energy crisis and is an important energy resource due to its agriculture-based economy. Developed countries are utilizing waste in energy systems for energy production, although developing countries like Pakistan lack the appropriate methodology and execution of biomass as an alternative energy resource. The majority of the world’s population lives in rural areas of developing countries they have limited access to fossil fuels and therefore use biomass directly for space heating and cooking purposes [3]. Bioenergy generation resources include crop residues, forest residues, municipal solid waste, sewage sludge, food processing waste, and animal waste. Pakistan’s total land constitutes 60% of agricultural land, and the main agricultural crops include wheat, sugarcane, cotton, maize, and rice; these crops generate residues that are utilized for bioenergy production.
Bioenergy production from crop residues is either through thermal conversion technologies (combustion, pyrolysis, and gasification) or through biochemical conversion technologies (anaerobic digestion or co-digestion, fermentation, and transesterification). The anaerobic digestion process degrades the organic substrate into two products, biogas and digestate, Anaerobic co-digestion from organic waste and other feedstock through digestion of two or more substrates [4]. Anaerobic Co-digestion has several advantages like improved nutrient balance, methane production, and increases organic diversion and system economics [4,5]. Biogas production through anaerobic digestion is challenging due to the complex structure of lignocellulosic residues. Lignocellulosic crop residues have a complex structure composed of cellulose (23–32%), hemicellulose (38–50%), and lignin (10–25%). Lignin is a major component of such crops, and it endows the structural support impermeability and resists the microbial attack, and is recalcitrant to digest by microbes for renewable biochemical conversion [6].
During anaerobic digestion of lignocellulosic agricultural residues lignin inhibits the methanogenic bacteria to produce methane, whereas cellulose plays a vital role in the production of methane so, to enhance enzyme accessibility to cellulose pretreatment is required, which could reduce the cellulose crystallinity, degrade lignin, and hemicellulose and increase surface area or porosity so more bacteria could adhere to produce maximum biomethane.
To overcome this challenge, lignocellulosic residues are pretreated and is co-digested with other feedstock. Various methods for pretreatment are developed in mechanical, thermal, biological, and chemical pretreatments, for this study the mechanical pretreatment was given to the substrates [7]. The objective of mechanical pretreatment is the reduction of size and crystallinity of lignocellulosic material. Physical pretreatment is given by grinding, hammer mill, knife mill, ball milling. For the reduction of particle size, the grinders are used to reduce the crystallinity of the substrate and increase the porosity of the substrate so that it could be easily degraded by the anaerobic bacteria. The decrease in particle size leads to an increase of available specific surface and a decrease in the degree of polymerization (DP) [8]. The milling causes also shearing of the biomass, pore-volume, or porosity of lignocellulosic material and enhances the initial enzymatic hydrolysis rate [9]. An increase in digestibility takes place when the pore size of the substrate is large to easily accommodate both large and small enzymes [10].
For a long time, there has been a growing attention for the effect of pretreatment on lignocellulosic residues for enhanced methane production. Accordingly, in the present study, we had investigated the potential of mechanically pretreated lignocellulosic residues i.e., wheat straw, rice straw and sugarcane bagasse present in Pakistan and to analyze their potential for biogas production through the anaerobic co-digestion process. Thus far, previous studies had focused on anaerobic co-digestion of wheat straw, rice straw with cow or cattle manure [11,12,13]. The chemical pretreatment and analyzed the optimal proportion of treated wheat straw and cow manure for efficient methane production, co-digested rice straw and dairy manure and assessed a wide range of feeding regimes on biogas productivity and yields in rice straw anaerobic co-digestion. Accordingly in the present study we used mechanical pretreatment described that mechanically pretreated lignocellulosic waste can work at high solids loading which is ideal if the recommended combination is used as a substrate in a small scale anaerobic digester [14,15]. Furthermore, physical properties like porosity and durability of wheat straw, sugarcane bagasse, and rice straw have already been studied. Wheat straw is reported more porous and denser; the cellular size of wheat straw is greater than those of rice straw and sugarcane bagasse, so more bacteria could adhere to its surface and increase the production of biogas [16,17]. Wheat straw is a potential residue to produce methane due to its permeable nature [18]. In the present study, wheat straw was co-digested with the other lignocellulosic residues to determine the best ratio and residue with which it could give the highest methane production.
Lignocellulosic biomass waste has been a problem to manage as well as its anaerobic digestion is slow because of the high lignin content to increase the degradation rate cost-effective pretreatment strategy is required to enhance the process efficiency [19]. Bagasse produced by 70 sugar industries in the country has been found to be sufficient for the generation of 5700 GWh of electricity. Major crop residues include cotton stalks, wheat straw, rice straw, sugarcane trash, and corn stalk having production of 49.4, 34.581, 16.75, 7.83, and 5.325 million tons, respectively [20].
Lignocellulosic biomass has been used to produce Butanediol having potential use in cosmetic products, pharmaceuticals, antifreeze agents, synthetic rubber, fuel additives, and flavoring agents in food products [21]. However, bioplastics from lignocellulosic have an attraction to address environmental pollution [22]. Besides the other agricultural residues usage in developing countries like Pakistan, where 70% of the population do not have access to clean fuel for cooking, their priority is biogas production from these agricultural residues to access clean energy.
These lignocellulosic residues are not comprehensively examined in an anaerobically co-digestion process with optimum process conditions. Moreover, more attention is given to the kinetic characteristics of the digestion process, which includes the lag phase, hydrolysis rate, methane production rate, and methane yield. The study determines to focus on the best combination of reactor operating parameters for anaerobically co-digested lignocellulosic residues i.e., wheat straw and rice straw (WSRS), bagasse and wheat straw (BAWS), bagasse and rice straw (BARS), bagasse, wheat straw, and rice straw (BAWSRS) for biomethane production. The organic matter degradation information will be utilized as a substrate commercially by industries or small-scale biogas digesters developed in rural areas of Pakistan, where these residues are easily available and accessible.

2. Material and Methods
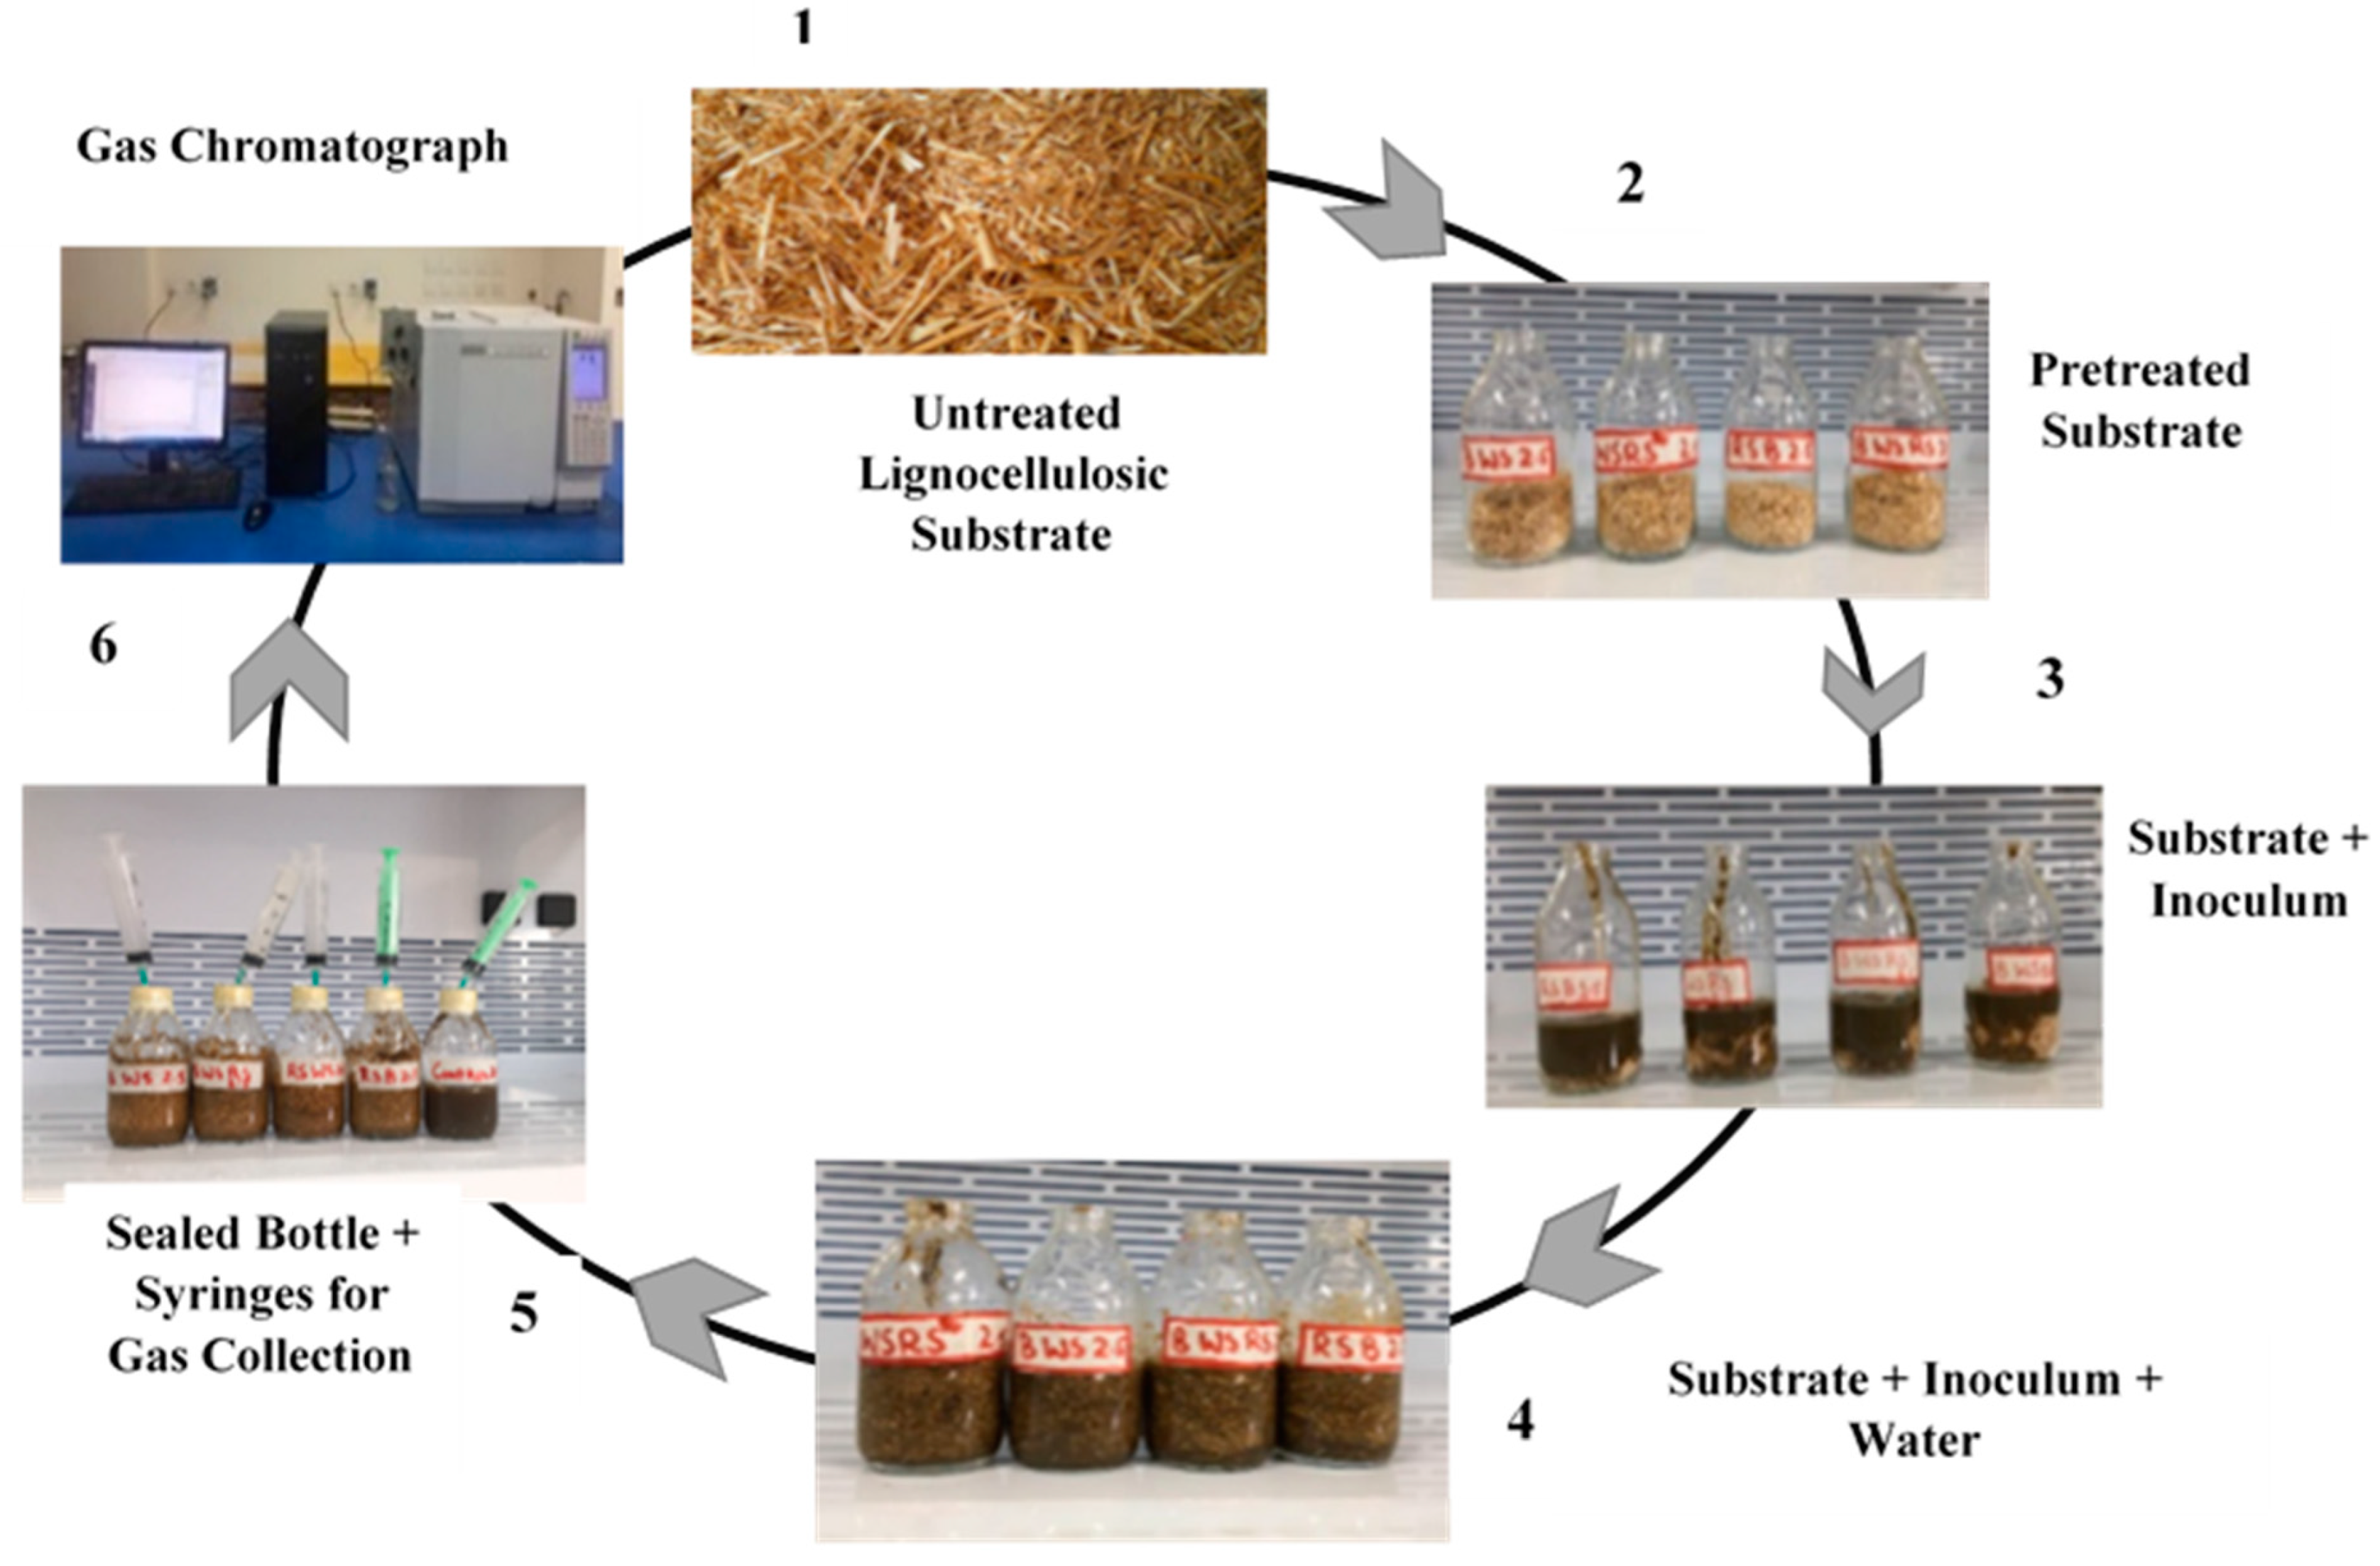
2.1. Raw Material

In this study, three lignocellulosic materials were used wheat straw, rice straw, and sugarcane bagasse. These raw materials were collected from a village near Dina Punjab, Pakistan. These materials were selected as substrates due to their abundance, sound potential for biogas production, and microporous structure after mechanical pretreatment, which is suitable for the retention of microorganisms. Prior to use, substrates were air-dried and then mechanically pretreated firstly, lignocellulosic waste was hewed and then ground by using a laboratory grinder and were reduced to the size of 0.1 mm, and then installed in anaerobic bioreactors.

2.2. Inoculum

The inoculum was transported to Biofuel lab of US Pakistan center for advanced studies in Energy at National university of sciences and Technology (USPCAS-E NUST), Islamabad, and was effluent of the operational biodigester producing biogas by treating cow manure. The inoculum was stored in an airtight 5 L plastic bottle with anaerobic headspace for degradation of easily degradable organic matter present in the inoculum. Characterization of substrate and inoculum was performed by using Moisture Content (MC), pH, Total Organic Carbon (TOC), Total Solids (TS), and Volatile Solids (VS).

2.3. Experimental Setup

The Biochemical methane potential (BMP) assays were used, triplicate batch fermentation tests were carried out, depicted in Figure 1 [23]. Two batch experiments were performed in parallel for a substrate to inoculum (S/I) ratio of 1.5 and 2.5.
The glass bottles used for batch assays had a total volume of 300 mL and, a working volume of 210 mL was sealed with silicon stoppers, metallic capping, and scotch tape. The working volume constitute of 210 mL (110 mL + 100 mL), where 100 mL was water and 110 mL was packing volume (volume occupied by two lignocellulosic materials for reactors other than bagasse, wheat straw, and rice straw (BAWSRS), reactor which is a combination of three lignocellulosic materials) and volume of inoculum, the composition of 110 mL was different for both S/I ratios of 1.5 and 2.5. The packing volume for S/I ratio 1.5 was 66 mL, which was determined by marking line on the bottle previously filled with water of 66 mL, and for S/I ratio 2.5, the volume was 33 mL. Bottles were filled according to the S/I ratio, and then water was added to sustain working volume. Further, the pH of reactors was checked and maintained to 7–7.5 by adding some drops of HCl 10 M solution. After this, nitrogen gas was purged for five min to maintain the anaerobic condition in the bottle, and then the bottles were sealed. Lastly, a syringe of 25 mL was inserted for biogas collection. The incubation of reactors was carried out at the mesophilic condition (35 °C ± 1 °C) for the growth of methanogenic bacteria. For comparative analysis, control reactors were run in parallel, for both ratios. The duration for both experiments was 60 days when the biogas curve stretched plateau phase. Moreover, Biogas volume was measured twice a week for both Experiment 1 and Experiment 2 using the plunger displacement method [23,24,25].

2.4. Analytical Measurements

Volatile solids and total solids were enumerated in triplicate by following the standard American Public health association (APHA) method [26,27], pH was computed by pH meter of Hannah (Hanna HI 9829) at the digester temperature of 35 °C ± 1, TOC was calculated by using the relation of VS/1.8 [28], TS and VS removal were calculated by using the Equation (1) [28]. Moreover, Biogas volume was measured twice a week for both Experiment 1 and Experiment 2 using the plunger displacement method. Proximate analysis of substrates wheat straw, rice straw, and sugarcane bagasse is mentioned in Table 1. Biogas was analyzed by Gas Chromatograph (Shimadzu GC-2010 plus), with thermal conductivity detector (TCD) and molecular sieve 5A as a column the operational temperature of column oven was 200 °C. Biogas sample of 4 mL volume was injected in duplicate into GC autosampler for composition analysis. The initial column temperature was set as 35 °C for 2 min and then ramped to 10 °C/min followed by a ramp of 150 °C, which was maintained for 5 min to reach the temperature of 200 °C. Helium was used as carrier gas. Curves were drawn by analyzing the experimental data on Origin software version 8.0.
TS   or   VS   Removal = { 1 [ V S d i g e s t a t e * ( 100 V S f e e d ) V S f e e d * ( 100 V S d i e s t a t e ) ] * 100 }

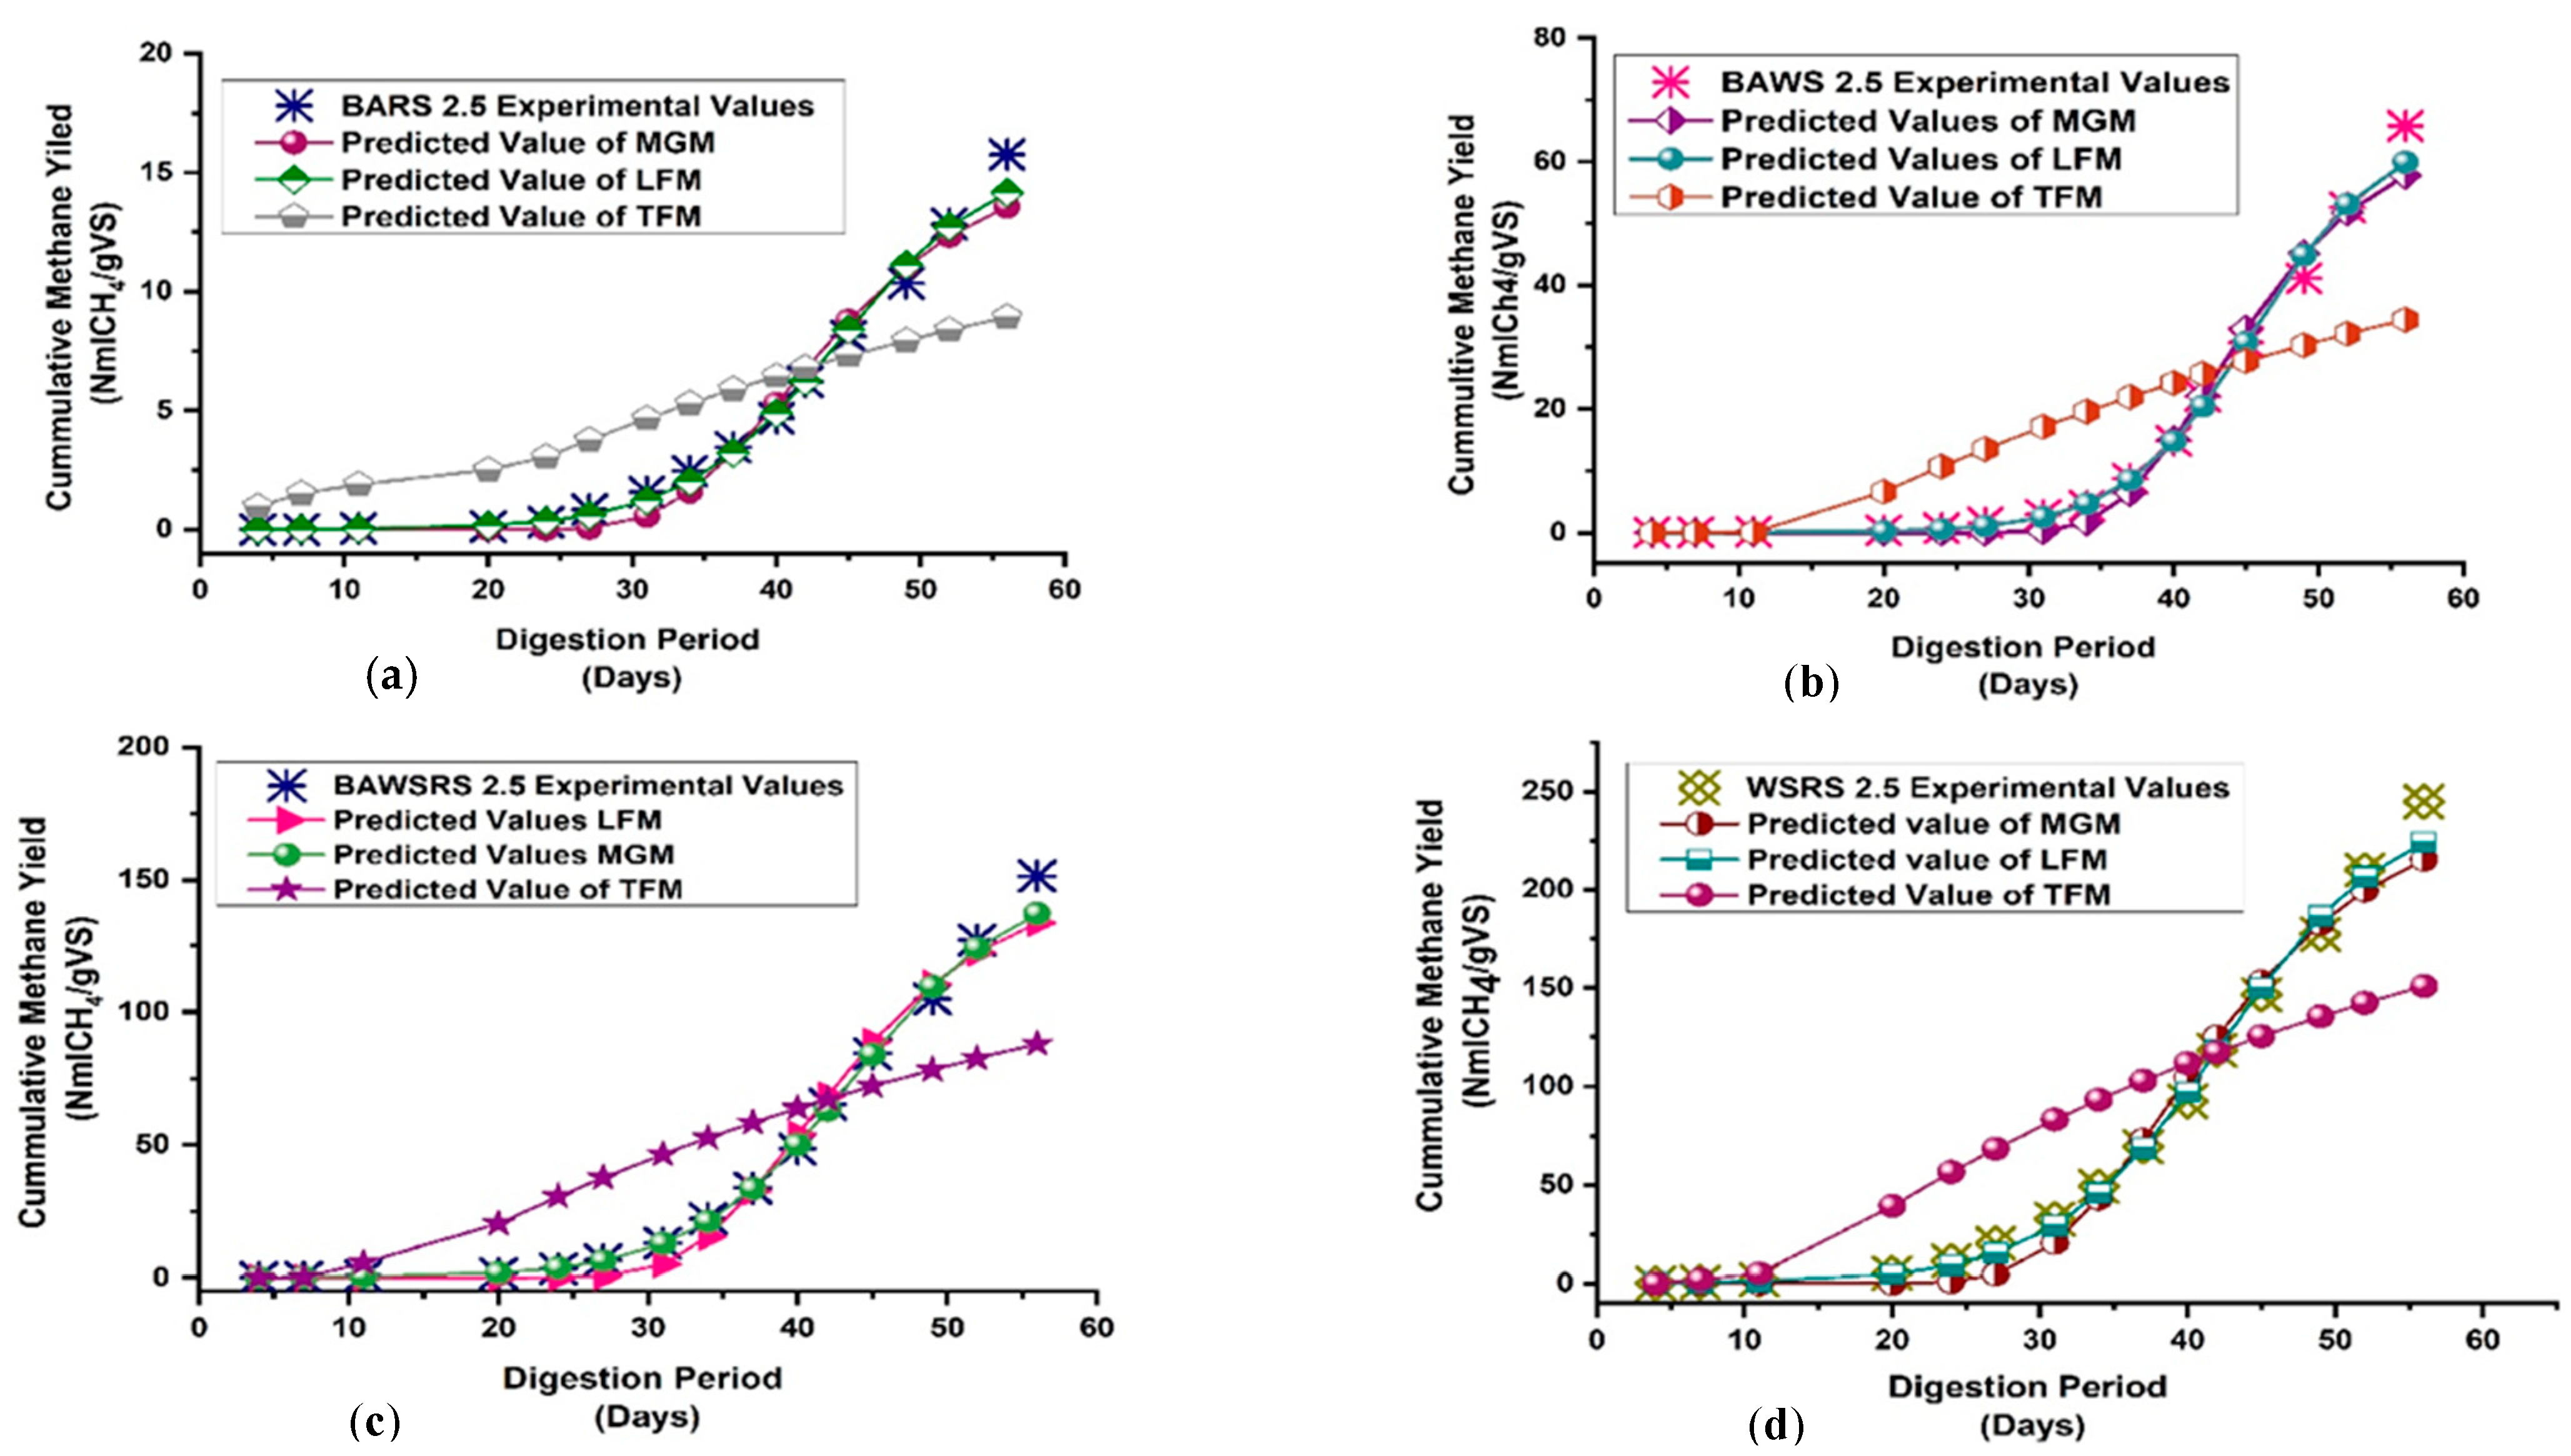
2.5. Kinetic Modeling

Biogas production kinetics was modeled by using three models, (a) modified Gompertz model, (b) logistic function model, (c) transference function model to estimate performance parameters, and (d) first-order kinetics model was used for determination of bio-kinetic parameter. Simulation of experimental data for the determination of the best fit model was performed by using SPSS (IBM SPSS statistics 20), and graphical representation was made by using Origin 8.0 software.
(a)
Logistic Function Model
M = M o 1 + e x p ( 4 R m ( λ t ) M o + 2 )
(b)
Modified Gompertz Model
M = M o . exp [ exp ( R m . e M o ( λ t ) + 1 ]
(c)
Transference Function Model
M = M o [ 1 exp ( R m ( t λ ) M o ) ]
(d)
First Order Kinetics
M = Mo (1 − exp (−kh *t))
RMSE = [ 1 m j = 1 m ( d j Y j ) ² ] 1 2
where M (mL/gVS) is cumulative methane production, Mo (mL/gVS) refers to methane yield potential, t is to be time (days) is the λ lag phase (day) i.e., minimum time required for methane production, and Rm (mL/g VS. d) is the maximum methane production rate. The Modified Gompertz Model and Logistic Function Model are sigmoidal function with (S-shape) curves and are usually compared to illustrate exponential bacterial growth. With these non-linear regression models’ methane production rate, lag phase and methane production potential were determined by using experimental values of batch assays. Though both models appear to be similar, the major difference among the two models is that the curve of the modified Gompertz model is symmetrical, and that of the logistic growth model is asymmetric [29]. The logistic growth model fits for methane production and assumes that is the rate of methane production is directly proportional to the amount of gas produced and to the maximum capacity of methane production, moreover, estimation of growth rate for the population of cells is mostly done by using logistic growth model (LF) [30,31]. In this study, the modified version of the logistic model is used, as shown in Equation (2) [32]. The first-order kinetics model (Equation (5)) determines the cumulative methane production and hydrolysis rate constant (kh), it is the crucial kinetic parameter, and in the anaerobic digestion process, the hydrolysis is considered as the rate-limiting reaction which governs the process. Simulation of the experimental data for the best fit model was performed, and selection of the best-fitted model was based on the kinetic parameters, which are R2 coefficient of determination, RMSE Root mean square error, Rm, λ and % difference (ϓ) between the predicted and experimental values RMSE was calculated using the Equation (6).

3. Results and Discussion

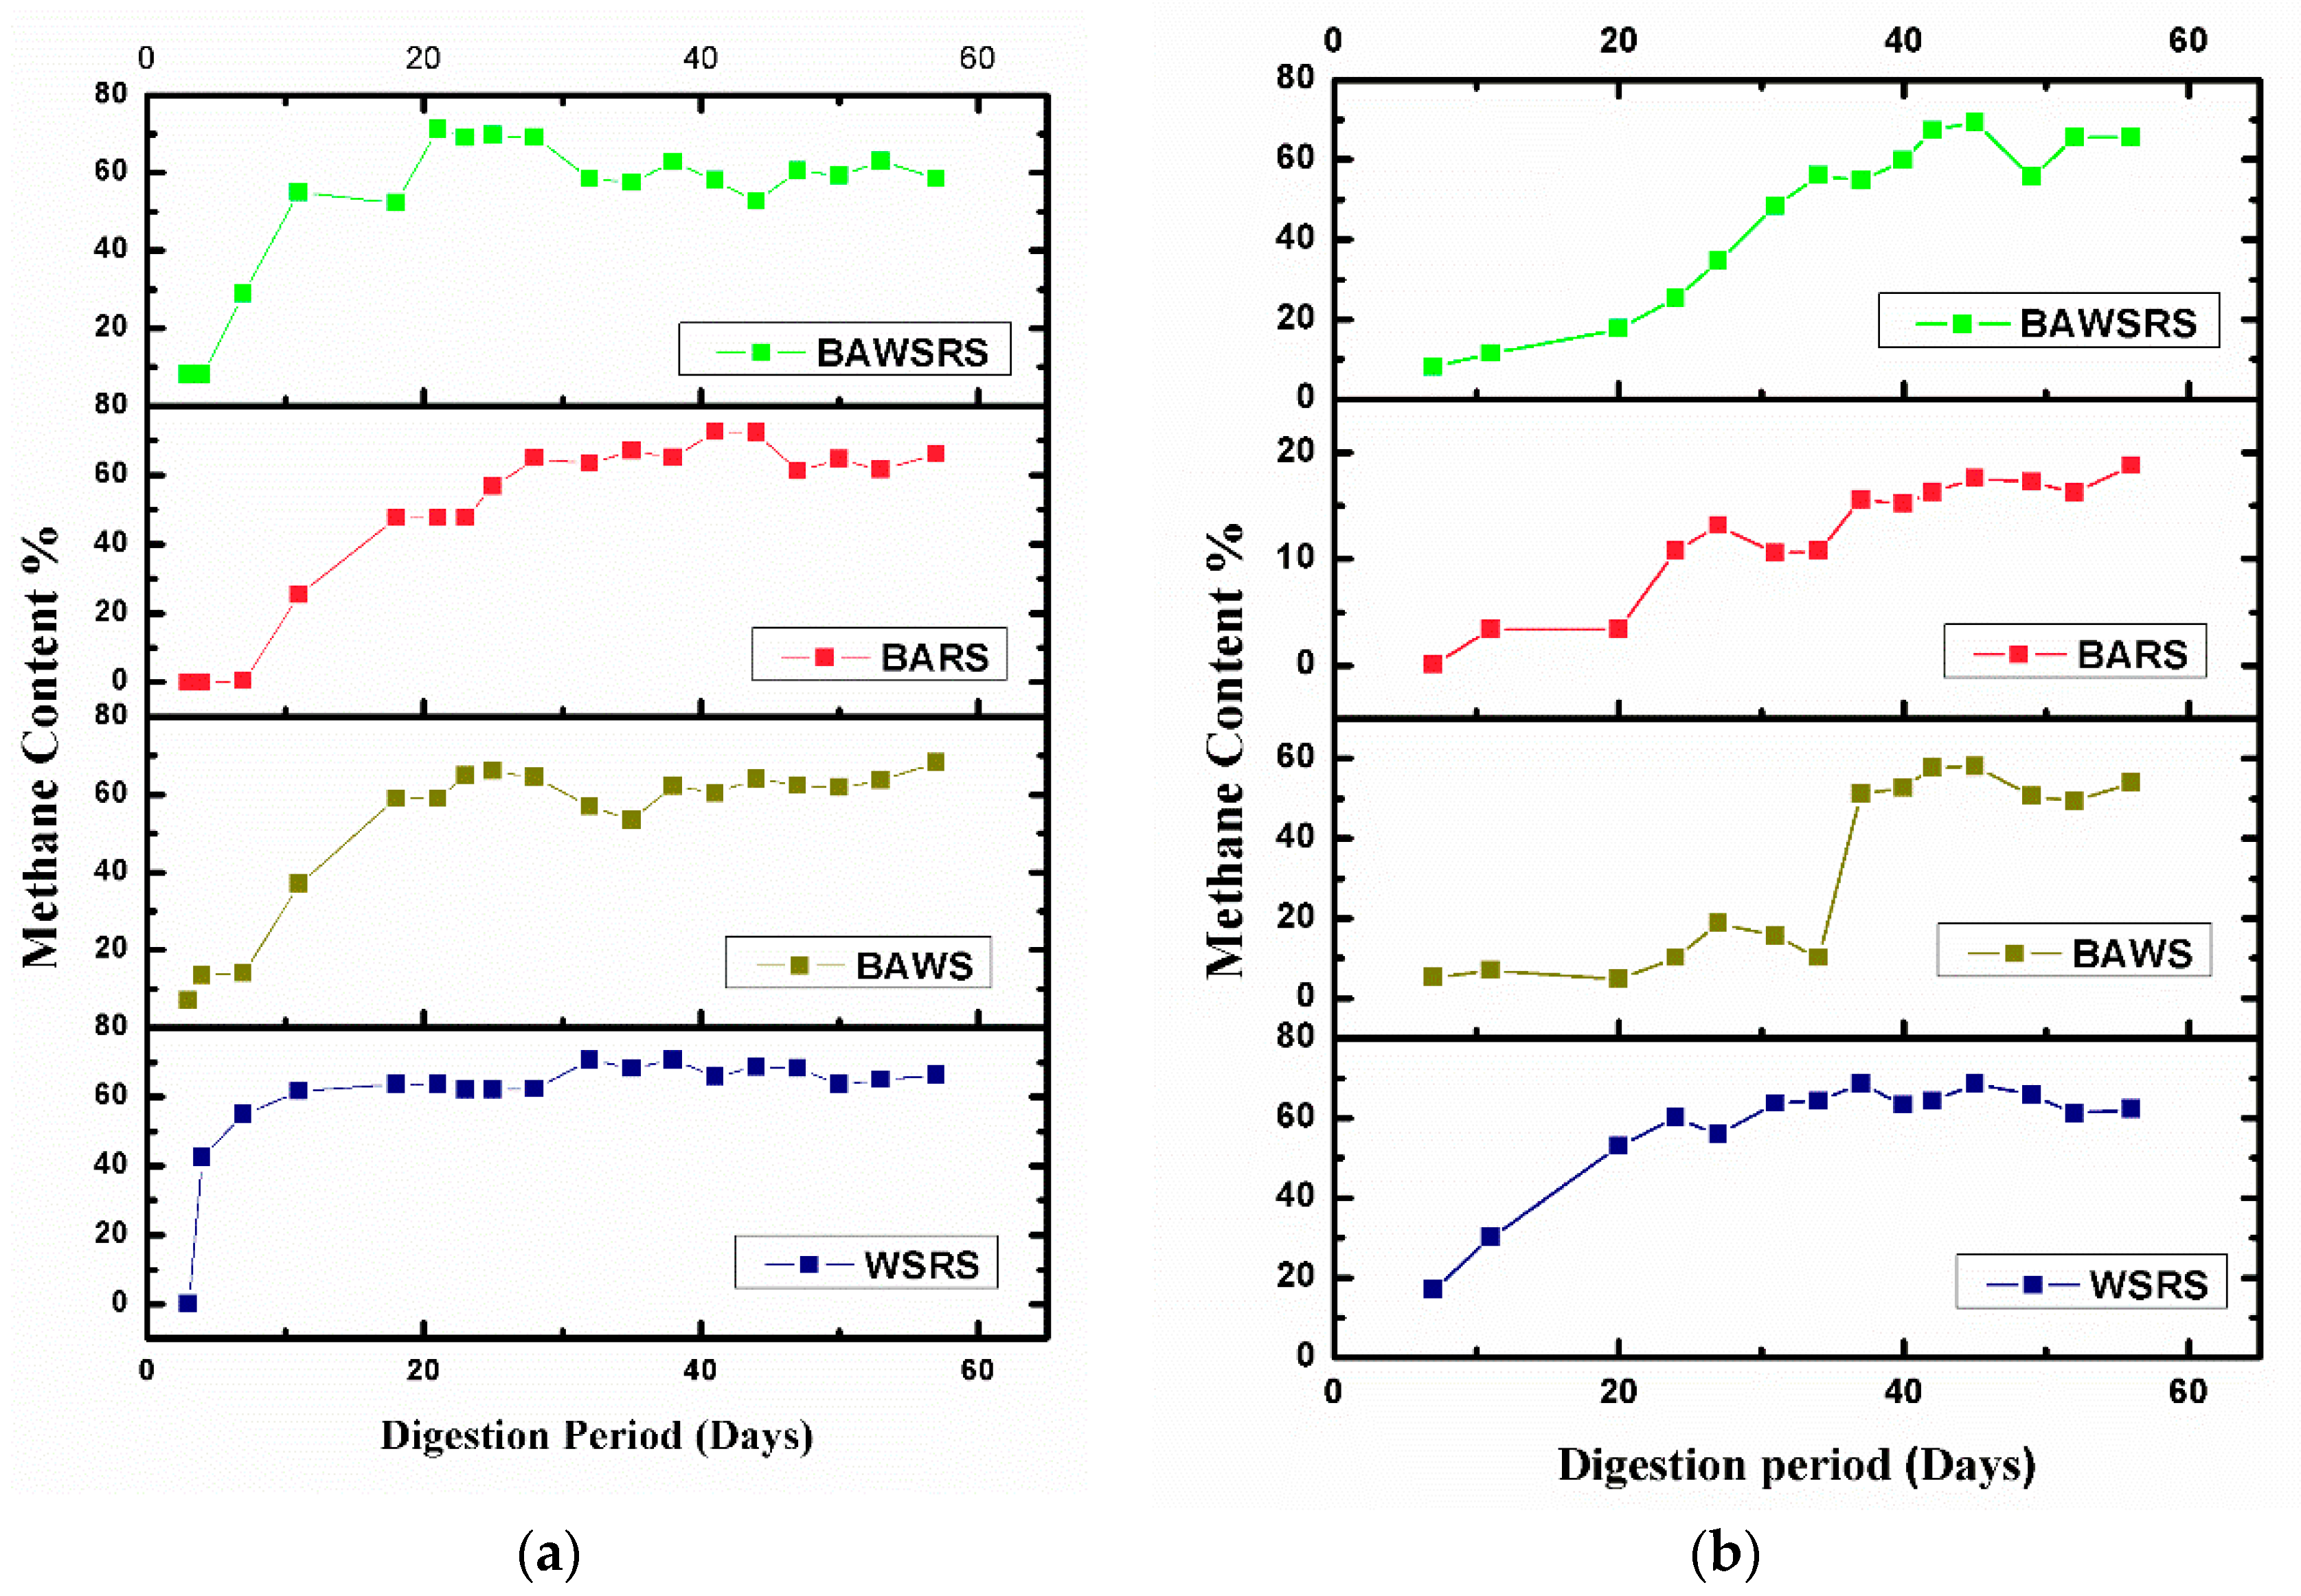
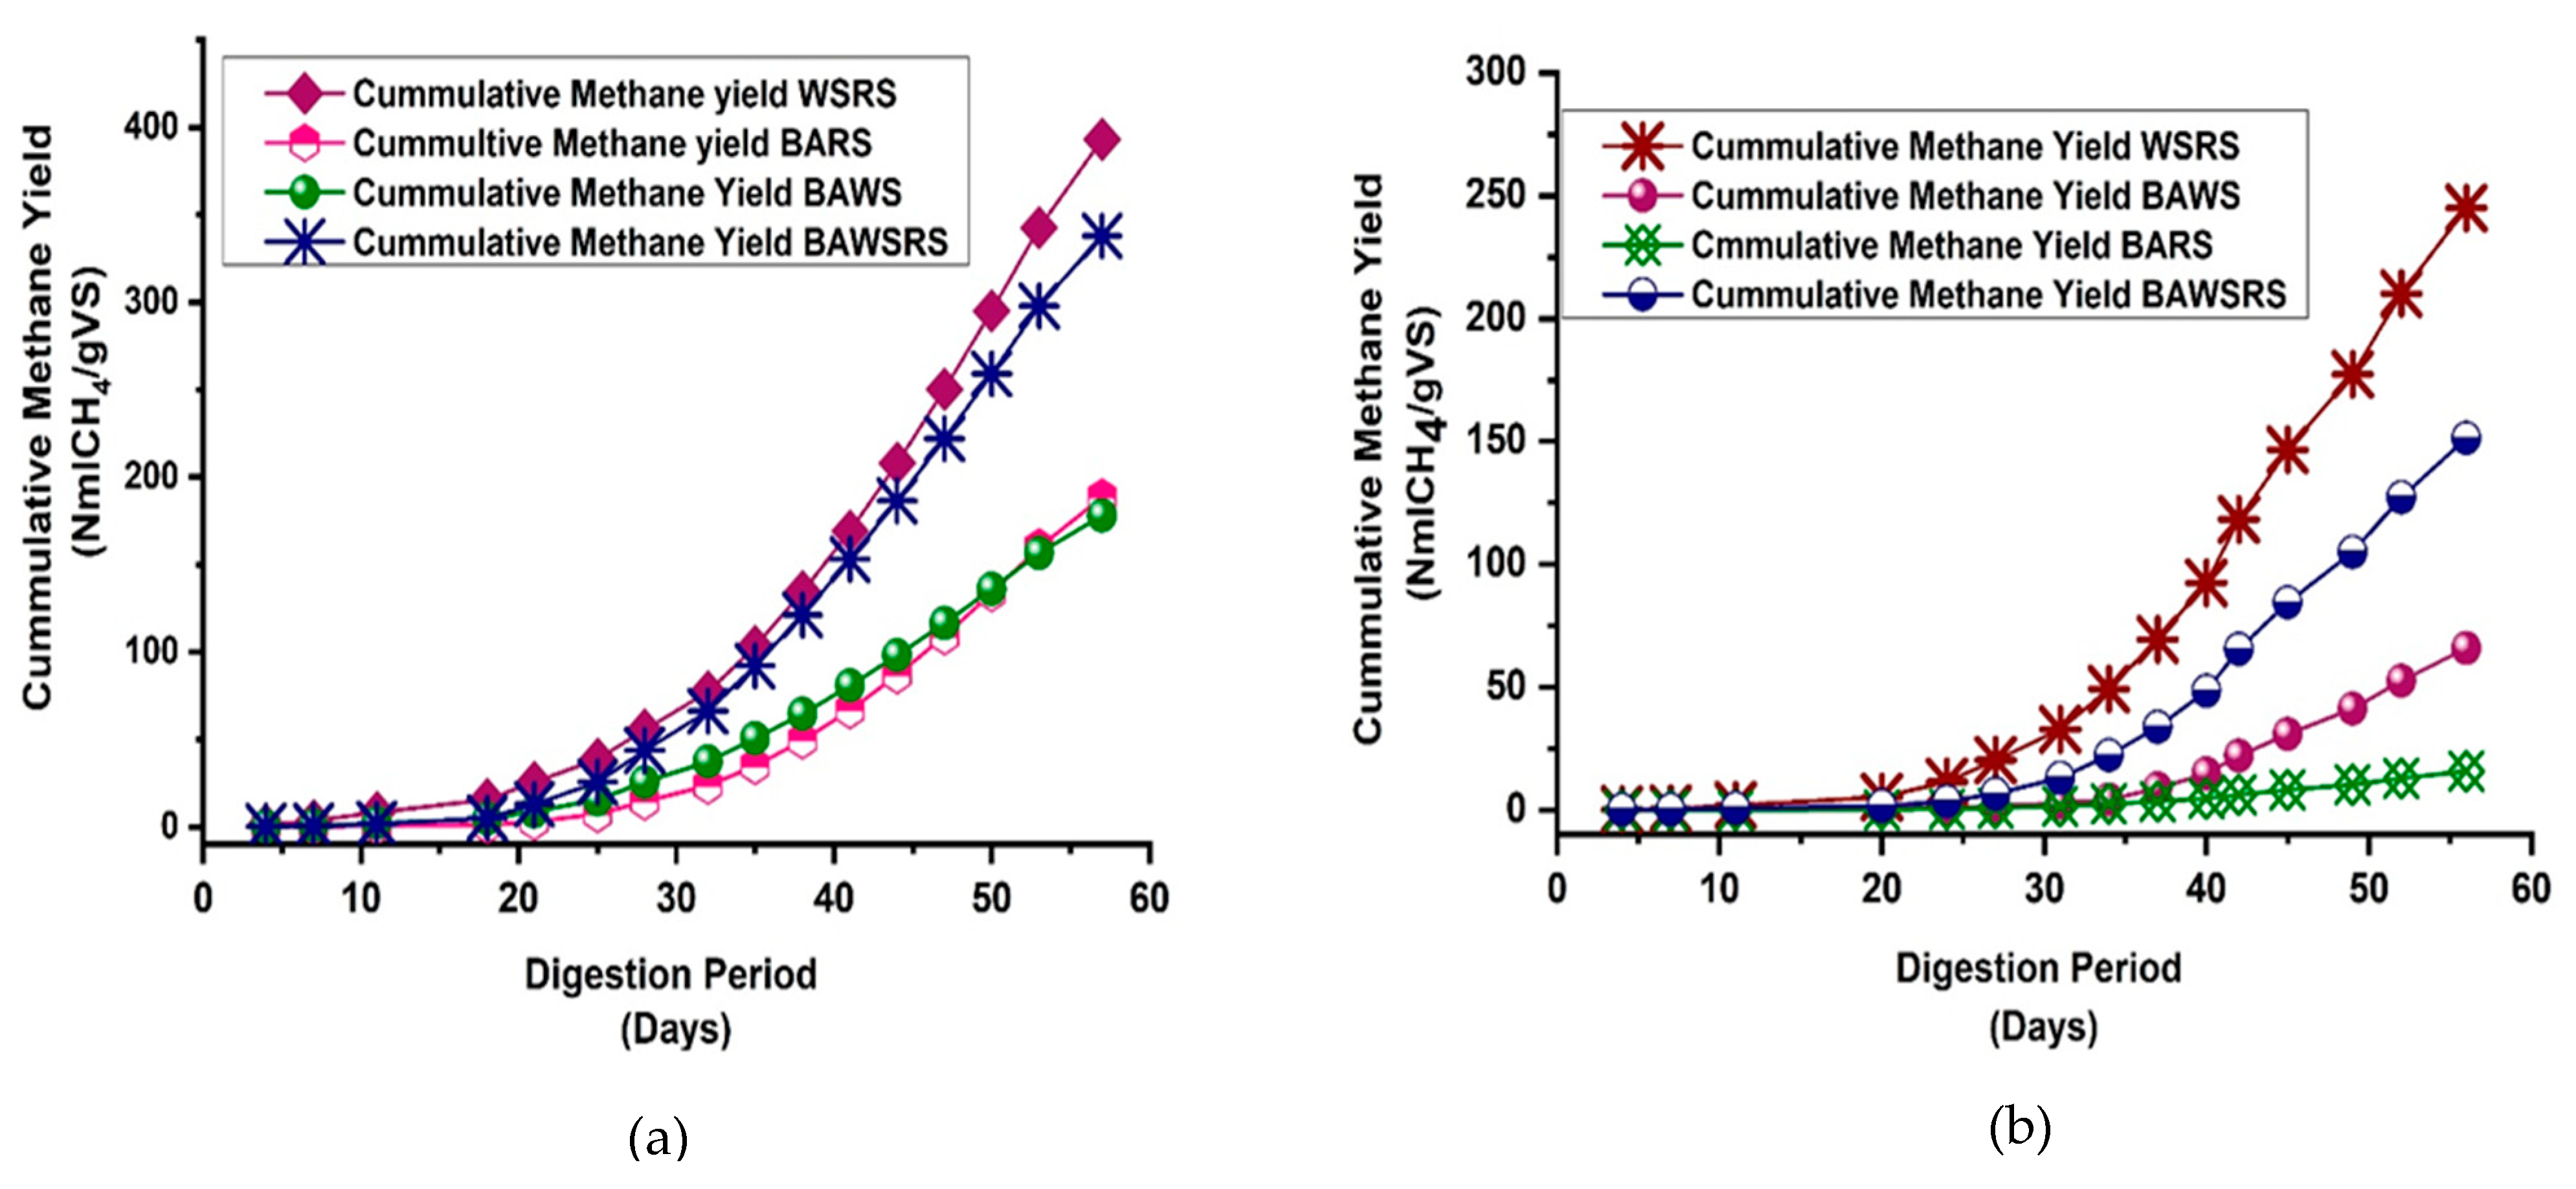
3.1. Reactor Performance

Methane content in biogas was measured to determine the performance of reactor Figure 2a,b illustrates the methane production curve of both experiments for S/I ratio 1.5 and 2.5 comprising of all reactors (WSRS, BAWSRS, BARS, BAWS), the trend shows a continuous rise in methane production, reactor WSRS has shorter lag phase when compared with other reactors. For experiment 1(S/I ratio 1.5), methane production was started within a week, efficient methane production was noticed by the reactor WSRS i.e., 41% on the fourth day of the experiment, whereas the startup phase for other reactors BAWSRS, BAWS was 29% and 37% on seventh and eleventh day respectively; for Experiment 2 (S/I ratio 2.5), WSRS, BAWSRS, and BAWS produced methane at 17%, 11% and 3% on the fourth, seventh and twentieth day respectively. Reactor RSBA showed the lowest methane production among all reactors in both experiments. Methane production for reactors other than WSRS was determined to slow because hydrolysis was the rate-limiting step in both experiments [33]. Hydrolysis of lignocellulosic material is mostly affected by its recalcitrant structure among lignocellulosic materials shorter hydrolysis, and enhanced methane production was observed for substrates having higher cellulose content, lignin concentration of each substrate effects total biogas production as well as the initial hydrolysis rate [34], the hydrolysis rate is shown in Table 4. Cellulose and hemicelluloses formulate almost ∼70% of the biomass and are linked to the lignin structural units all the way through covalent and hydrogenic bonds; thereby, the structure formulated is tremendously rigid and resistive against processing [35]. While comparing both ratios, a decrease in methane production and hydrolysis rate was observed for reactors of S/I ratio 20. Maximum Kh was observed for reactor WSRS (Experiment 1, S/I ratio 1.5) followed by BAWSRS.
This suggests that an increase in substrate concentration would lower the hydrolysis rate and methane production. After the startup phase, the maximum methane production recorded by reactors WSRS, BAWS, BARS, and BAWSRS (Experiment 1; S/I ratio 1.5) was 70.63%, 64.5%, 65%, 69%, respectively. Similarly, maximum methane production for reactors WSRS, BAWS, BAWSRS, and BARS (Experiment 2; S/I ratio 2.5) was recorded as 68.5%, 58%, 65.5%, and 18%, respectively. Furthermore, the graph of cumulative methane yield is shown in Figure 3a,b for both Experiments. The maximum methane yield observed for all reactors WSRS, BAWS, BARS, and BAWSRS of Experiment 1 were 393.08 NmLCH4/gVS, 177.96 NmLCH4/gVS, 188.299 NmLCH4/gVS, and 337.900 NmLCH4/gVS, respectively. Whereas, for Experiment 2, methane yield of reactors WSRS, BAWS, BARS, and BAWSRS were 244.78 NmLCH4/gVS, 65.79 NmLCH4/gVS, 15.74 NmLCH4/gVS, and 151.34 NmLCH4/gVS, respectively. Among both experiments, the combinations in Experiment 2 show an initial lag in methane production, the inhibition is likely due to higher lignin content and an increase in organic loading ratio (increase in the substrate concentration) [36]. Lignin has a recalcitrant structure that limits the degradation of lignocellulosic waste whereas cellulose and hemicellulose degrade after the hydrolysis process, the degradation of cellulose and hemicellulose in lignocellulosic material would govern methane production [37,38]. Moreover, the substrates used in the present study show bagasse has higher lignin content and lower methane production. Lignin is the protective barrier that provides support to the lignocellulosic structure and resists any microbial attack and oxidative stress. Additionally, lignin is insoluble in water hence, anaerobic bacteria require more time to adhere on the substrate to start the anaerobic digestion. In the comparison of both experiments’ reactor WSRS yields higher methane due to lower lag phase and lignin content, methanogenic bacteria degraded the lignin faster as compared to other reactors. Additionally, mechanical pretreatment given to all substrates increases surface accessible area, decreases crystallinity, and surface polymerization to enhance biodegradability; these are the factors that fasten the hydrolysis rate [39]. Production of biomethane is correlated with the degradation or digestibility of organic matter by anaerobic microorganisms. VS reduction is the amount of VS degraded by the bacteria; higher degradation leads to more VS reduction, which ultimately results in excessive biogas production [40]. Table 2 and Table 3 illustrate the VS reduction and pH of all reactors. For Experiment 1 (S/I ratio 1.5), reactor WSRS still has the potential to produce biogas, whereas all other reactors have shown maximum biogas production according to their potential due to utilization of carbon content present in substrates [41]. Moreover, in Experiment 2 reactors, WSRS and BAWS showed maximum VS reduction whereas, reactor BAWSRS still had the potential to degrade microorganisms and produce biogas. Concentrating on the BARS reactor, the methane production was minimum, and the result of maximum volatile solids reduction illustrates that the volatile solids fed into the reactor were degraded by propionic acid bacteria rather than methanogenic bacteria, which results in the accumulation of Volatile fatty acids (VFAs) [42]. It was observed that the performance of a reactor was low in terms of methane production and pH during the digestion. The pH profile of all reactors after anaerobic co-digestion is mentioned in Table 2. For Experiment 1 (S/I ratio 1.5), the reactors WSRS, BAWSRS BARS, and BAWS have a neutral pH of 7.0, 7.0, 6.95, and 7.8, respectively which means the methanogenic bacteria were active and yields maximum methane according to the substrate’s potential [43]. For Experiment 2 (S/I ratio 2.5), the reactors WSRS, BAWSRS, and BAWS have neutral pH of 7.1, 7.0, and 7.1, respectively. The optimum value of pH shows that methanogenic bacteria were active and produced maximum methane [43].
However, reactor BARS in the Experiment has provided the least pH value of 5.5 [44]; this pH value is observed during an acidic phase when Volatile fatty acids (VFAs). Mostly, the propionic acid bacteria grow when the pH ranges from 4.6–6.0 [44,45] which inhibit the bacteria to produce maximum biomethane production. Concentrating on methane production, BARS has given minimum methane production [44]. The reactor’s performance was analyzed based on methane content, pH, and VS reduction. While analyzing the performance of all reactors in both experiments two factors have been observed. Firstly, it was determined that reactors of the mixed substrate, if including bagasse, had shown lower methane production due to higher lignin content. Secondly, the decrease in methane production occurred when the substrate concentration was increased.

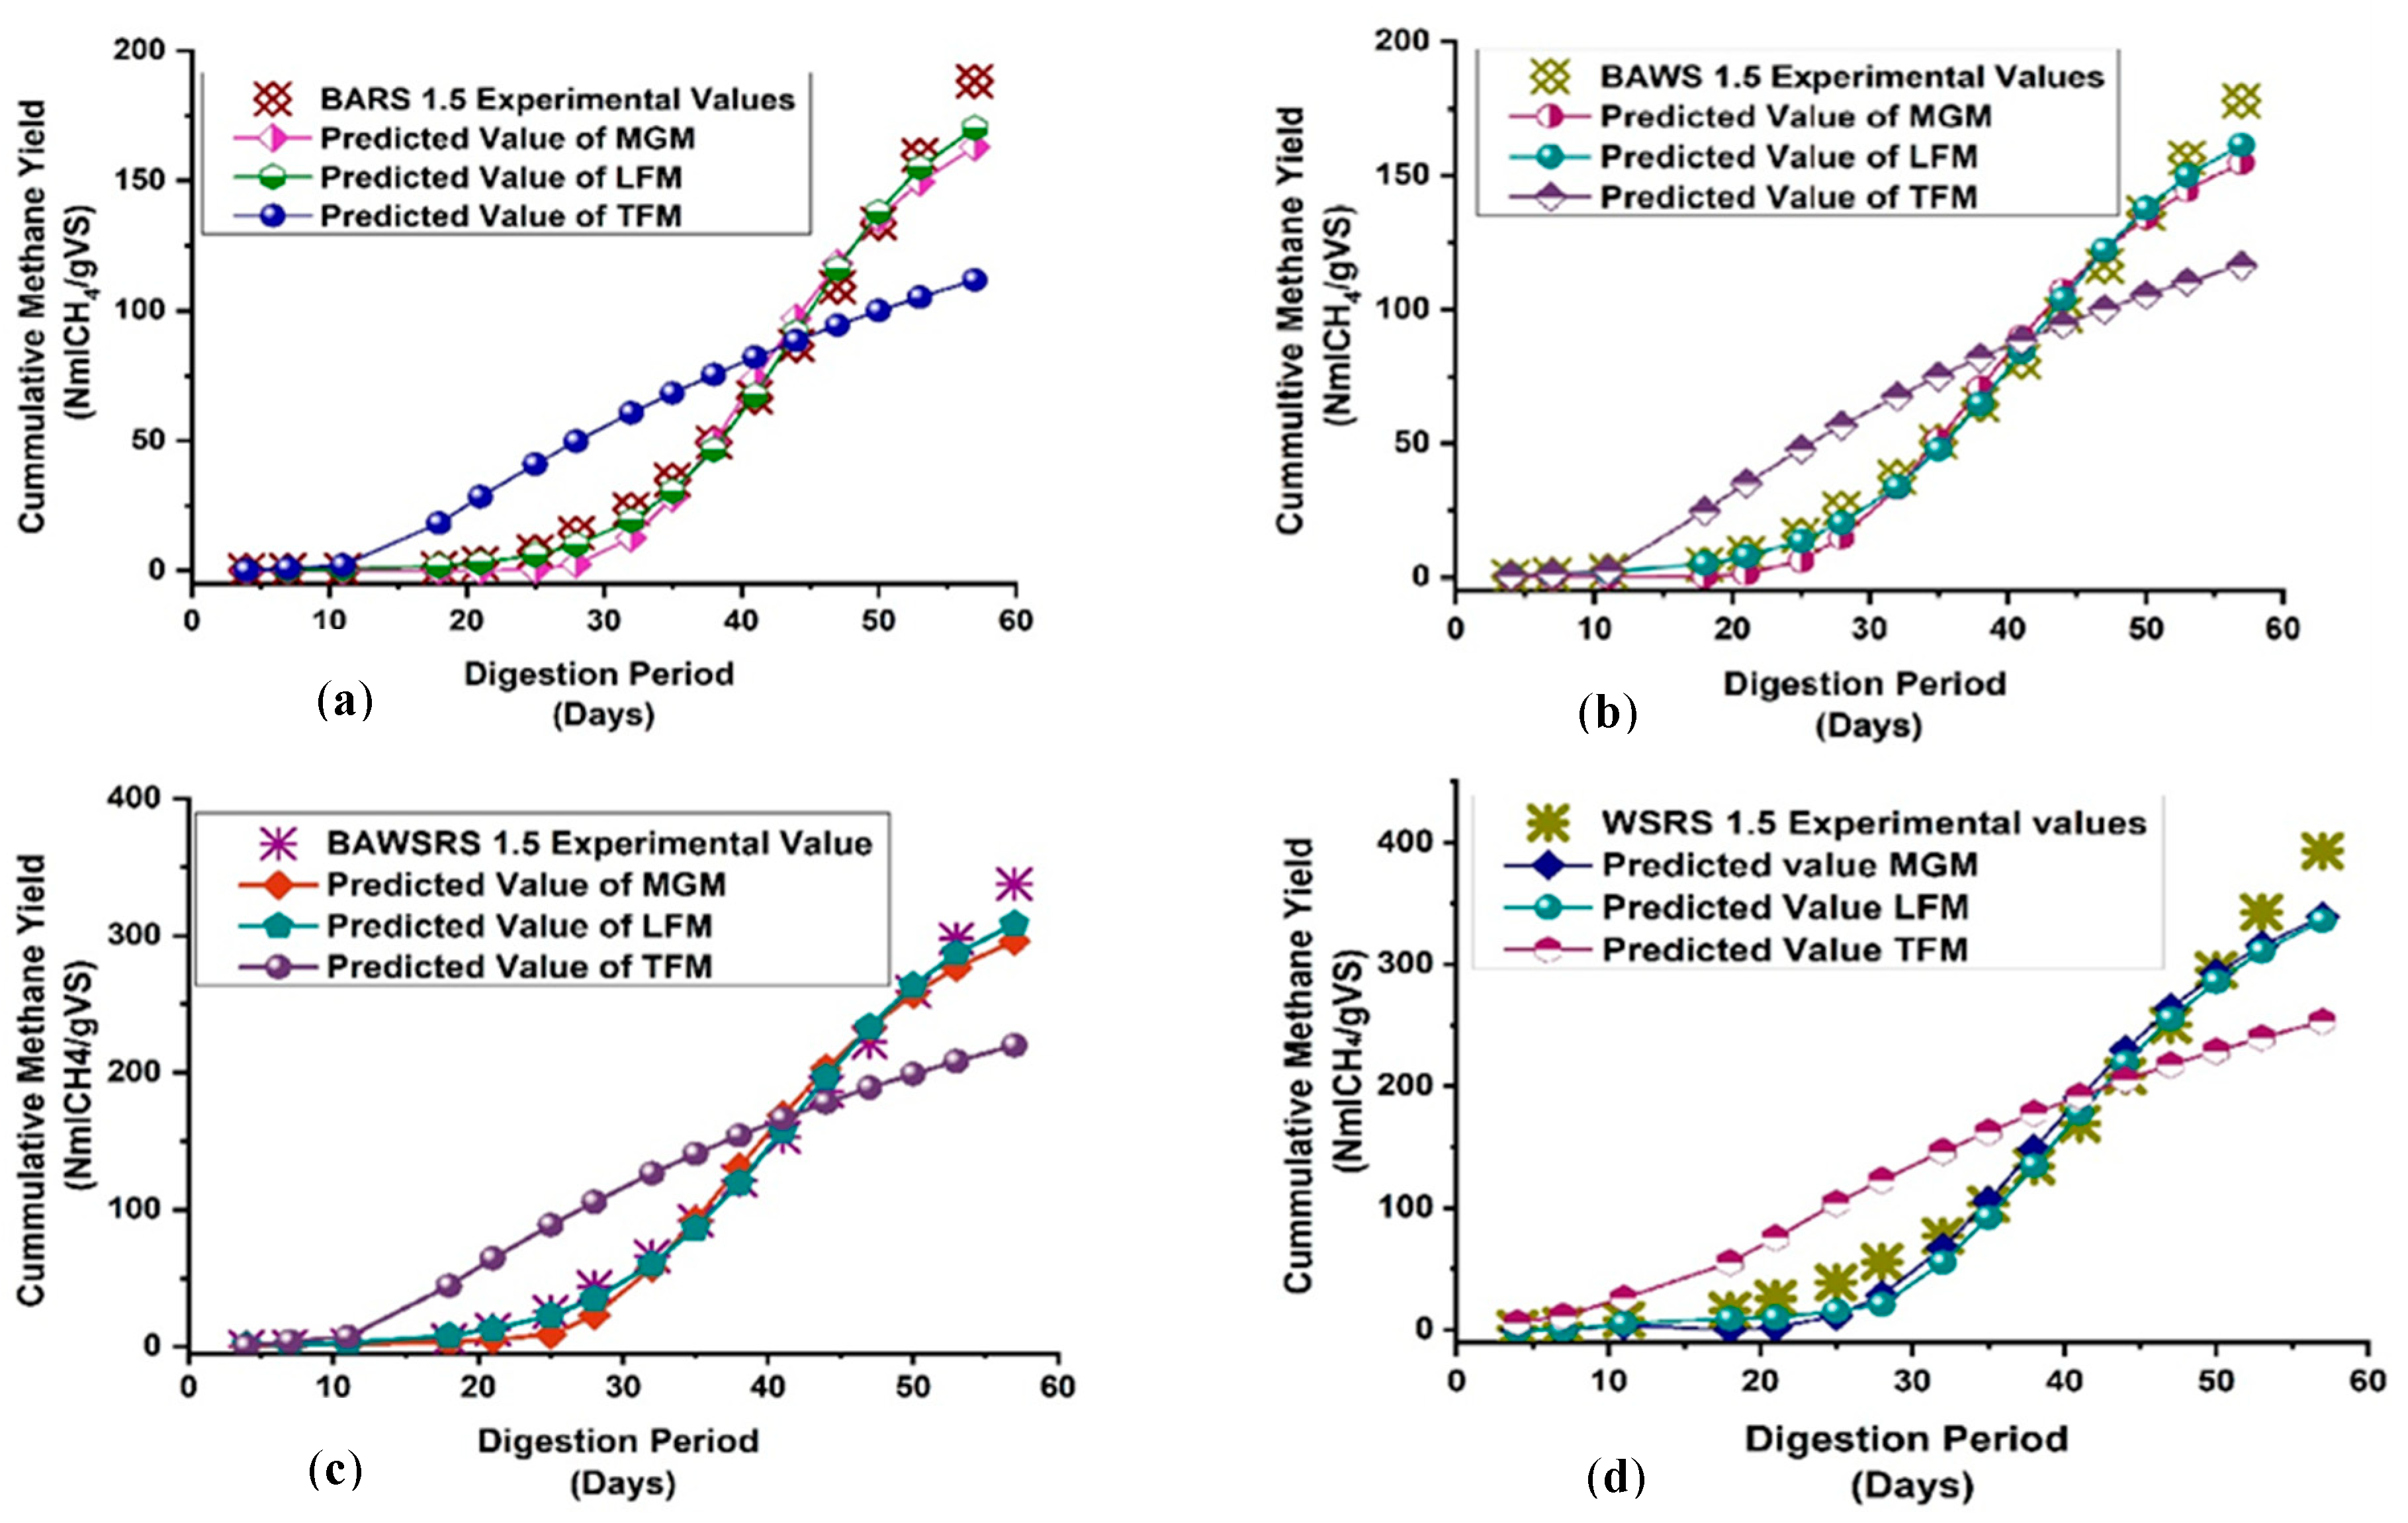
3.2. Application of Kinetic Modelling

The accumulated methane production curve was simulated using four models; first-order kinetics, modified Gompertz model, logistic function model, and transference function model to analyze the best combination reactor and S/I that has potential for maximum biomethane production. Parameters as hydrolysis rate constant, maximum methane production rate, lag phase, biogas yield potential was studied; the fitness of these models depends on bio-kinetic parameters (λ, R2, RMSE, ϓ, and Rm) which are presented in Table 4. The simulation of experimental values and predicted values were plotted in Figure 4 and Figure 5. Among all applied kinetic models, the best-fitted model was the logistic function model followed by the modified Gompertz model. The transference function model could not replicate the experimental data for all reactors, the coefficient of determination for all reactors have low values, whereas RMSE values are high in the TF model and the % differences were very high therefore this model could not be the best-fitted model. The logistic model was best-fitted for both Experiments. The R2 values show that the predicted model was best fitted with experimental data, and the variance between predicted and experimental BMP’s was less than 10%, this low value demonstrates that the logistic model predicts the performance of reactors accurately. Furthermore, the lag phase suggests the time required by methanogenic bacteria to produce methane. However, according to our results of all reactors, the lag phase increases with an increase in organic loading ratio due to higher substrate concentration (solid substrate) which prolongs the hydrolysis process and increases the period of acclimation for microorganisms [5,46].
Considering the lag phase of all reactors in both experiments, the lowest lag phase was observed for the Reactor WSRS due to lower lignin content. The maximum methane production rate (Rm) increased with the decrease in the lag phase, and this is due to the pretreatment, which breaks the structure of lignocellulosic material and makes room for the acetogenic and methanogenic bacteria [47] The soundness of the modified Gompertz model depends on the bio-kinetic parameters, and these parameters, analyzed by Modified Gompertz Model, exemplifies a lower methane production with a longer lag phase due to an increase in substrate concentration, the more substrates concentration, the longer the hydrolysis phase would be. R2 values illustrate that the predicted model was fitted with the experimental values that are shown in Figure 4 and Figure 5. LF and GM models have almost similar values, but the difference between the predicted model and experimental values was nearly equal to 10% or more than 10%; that is why GM was not considered as the best fit [48].
Based on the best fit, the reactor WSRS with a S/I ratio of 1.5 produces the highest methane production and have the lowest lag phase, whereas insignificant variation in the maximum rate of methane production was observed, the cumulative methane production was from the experiment and predicted by the model was close to the logistic function model and with the modified Gompertz model, but there was a huge variation in the data when compared with transference function model.

4. Way Forward

The application of current work is the adoption of co-digestion technology for agricultural residues to meet the energy demands for heating and cooking in a small-scale rural community. The environmental and social impacts of the projects improve the social well-being of the community.
Future prospects of the study involve further research and development to enhance the efficiency and stability of the system for adoption at an industrial scale. The challenges link with technology is the indigenous manufacturing of the bio-digesters and human resource training.

5. Conclusions

Lignocellulosic materials are present in abundance, readily available, and are environmentally friendly. The efficient use of such potential residues will result in cutoff the menace of burning. In this study, three lignocellulosic materials were combined in different proportions to determine the best reactor that produces maximum methane production. Analysis of methane production trends during anaerobic Co-digestion of lignocellulosic residues i.e., wheat straw and rice straw (WSRS), bagasse, and wheat straw (BAWS), bagasse and rice straw (BARS), bagasse, wheat straw and rice straw (BAWSRS) revealed variation in methane production by each reactor in both experiments. This variation was induced due to different substrate concentrations, lignin content, and hydrolysis rate. The study suggests that a decrease in methane production was due to a lower hydrolysis rate and higher lignin content. From the experimental results can be inferred that the pH of all reactors was neutral except for reactor BARS (S/I 2.5) due to the accumulation of volatile fatty acids that inhibit the methanogenic bacteria to produce methane. Experimental results were further validated by simulation of kinetic models estimating performance parameters. Evaluation of kinetic models demonstrated that the logistic function model was the best fit, and it reproduced the experimental data followed by the modified Gompertz model. Comparison of both experimental and kinetic modeling results denotes that the optimum methane production was exhibited by the reactor WSRS at the substrate to inoculum ratio (S/I) 1.5, with lower lignin content and higher hydrolysis rate. These reactors possess the optimum value of R2, maximum methane production (M) and low initial lag phase (λ), RMSE, and ϓ.

Author Contributions

Conceptualization, R.L., S.M.; Formal analysis, Z.S. and A.A.; Methodology, S.M. and A.Z.; Resources, Z.S.; Software, S.R.N., S.M. and A.H.K.; Supervision, R.L.; Write up D.J. All authors have read and agreed to the published version of the manuscript.

Funding

This research received no external funding.

Acknowledgments

We thank the U.S. Pakistan Center for Advanced Studies in Energy (USPCAS-E) at National University of Science and Technology (NUST) Islamabad, Pakistan to carry out this research work.

Conflicts of Interest

The authors declare that they have no known competing financial interests or personal relationships that could have appeared to influence the work reported in this paper.

References

  1. Xu, X.; Wei, Z.; Ji, Q.; Wang, C.; Gao, G. Global renewable energy development: Influencing factors, trend predictions and countermeasures. Resour. Policy 2019, 63. [Google Scholar] [CrossRef]
  2. Kamran, M. Current status and future success of renewable energy in Pakistan. Renew. Sustain. Energy Rev. 2018, 82, 609–617. [Google Scholar] [CrossRef]
  3. Ghafoor, A.; Rehman, T.U.; Munir, A.; Ahmad, M.; Iqbal, M. Current status and overview of renewable energy potential in Pakistan for continuous energy sustainability. Renew. Sustain. Energy Rev. 2016, 60, 1332–1342. [Google Scholar] [CrossRef]
  4. Boontian, N. Conditions of the Anaerobic Digestion of Biomass. Int. J. Biol. Biomol. Agric. Food Biotechnol. Eng. 2014, 8, 1036–1040. [Google Scholar]
  5. Paul, S.; Dutta, A. Challenges and opportunities of lignocellulosic biomass for anaerobic digestion. Resour. Conserv. Recycl. 2018, 130, 164–174. [Google Scholar] [CrossRef]
  6. Wang, S.; Sun, X.; Yuan, Q. Strategies for enhancing microbial tolerance to inhibitors for biofuel production: A review. Bioresour. Technol. 2018, 258, 302–309. [Google Scholar] [CrossRef] [PubMed]
  7. Zheng, Y.; Zhao, J.; Xu, F.; Li, Y. Pretreatment of lignocellulosic biomass for enhanced biogas production. Prog. Energy Combust. Sci. 2014, 42, 35–53. [Google Scholar] [CrossRef]
  8. Gummert, M.; Van Hung, N.; Chivenge, P.; Douthwaite, B. Sustainable Rice Straw Management; Springer: New York, NY, USA, 2020. [Google Scholar]
  9. Sun, S.; Sun, S.; Cao, X.; Sun, R. The role of pretreatment in improving the enzymatic hydrolysis of lignocellulosic materials. Bioresour. Technol. 2016, 199, 49–58. [Google Scholar] [CrossRef] [PubMed]
  10. Kumari, D.; Singh, R. Pretreatment of lignocellulosic wastes for biofuel production: A critical review. Renew. Sustain. Energy Rev. 2018, 90, 877–891. [Google Scholar] [CrossRef]
  11. Song, Z.; Zhang, C. Bioresource Technology Anaerobic codigestion of pretreated wheat straw with cattle manure and analysis of the microbial community. Bioresour. Technol. 2015, 186, 128–135. [Google Scholar] [CrossRef]
  12. Rajput, A.A.; Sheikh, Z. Effect of inoculum type and organic loading on biogas production of sunflower meal and wheat straw. Sustain. Environ. Res. 2019, 29, 4. [Google Scholar] [CrossRef] [Green Version]
  13. Li, D.; Liu, S.; Mi, L.; Li, Z.; Yuan, Y.; Yan, Z.; Liu, X. Effects of feedstock ratio and organic loading rate on the anaerobic mesophilic co-digestion of rice straw and cow manure. Bioresour. Technol. 2015, 189, 319–326. [Google Scholar] [CrossRef]
  14. Soltanian, S.; Aghbashlo, M.; Almasi, F.; Hosseinzadeh-Bandbafha, H.; Nizami, A.-S.; Ok, Y.S.; Lam, S.S.; Tabatabei, M. A critical review of the effects of pretreatment methods on the exergetic aspects of lignocellulosic biofuels. Energy Convers. Manag. 2020, 212, 112792. [Google Scholar] [CrossRef]
  15. Zealand, A.; Roskilly, A.; Graham, D. Effect of feeding frequency and organic loading rate on biomethane production in the anaerobic digestion of rice straw. Appl. Energy 2017, 207, 156–165. [Google Scholar] [CrossRef]
  16. Ríos-Badrán, I.M.; Luzardo-Ocampo, I.; García-Trejo, J.F.; Santos-Cruz, J.; Gutiérrez-Antonio, C. Production and characterization of fuel pellets from rice husk and wheat straw. Renew. Energy 2020, 145, 500–507. [Google Scholar] [CrossRef]
  17. Moretti, M.M.D.S.; Perrone, O.M.; Nunes, C.D.C.C.; Taboga, S.; Boscolo, M.; Da Silva, R.; Gomes, E. Effect of pretreatment and enzymatic hydrolysis on the physical-chemical composition and morphologic structure of sugarcane bagasse and sugarcane straw. Bioresour. Technol. 2016, 219, 773–777. [Google Scholar] [CrossRef]
  18. Yao, Y.; Bergeron, A.D.; Davaritouchaee, M. Methane recovery from anaerobic digestion of urea-pretreated wheat straw. Renew. Energy 2018, 115, 139–148. [Google Scholar] [CrossRef]
  19. Hobbs, S.R.; Landis, A.E.; Rittmann, B.E.; Young, M.N.; Parameswaran, P. Enhancing anaerobic digestion of food waste through biochemical methane potential assays at different substrate: Inoculum ratios. Waste Manag. 2018, 71, 612–617. [Google Scholar] [CrossRef] [Green Version]
  20. Iqbal, T.; Dong, C.-Q.; Lu, Q.; Ali, Z.; Khan, I.; Hussain, Z.; Abbas, A. Sketching Pakistan’s energy dynamics: Prospects of biomass energy. J. Renew. Sustain. Energy 2018, 10, 023101. [Google Scholar] [CrossRef]
  21. Saratale, G.D.; Jung, M.-Y.; Oh, M.-K. Reutilization of green liquor chemicals for pretreatment of whole rice waste biomass and its application to 2,3-butanediol production. Bioresour. Technol. 2016, 205, 90–96. [Google Scholar] [CrossRef]
  22. Saratale, G.D.; Saratale, R.G.; Varjani, S.; Cho, S.-K.; Ghodake, G.S.; Kadam, A.; I Mulla, S.; Bharagava, R.N.; Kim, D.-S.; Shin, H.S. Development of ultrasound aided chemical pretreatment methods to enrich saccharification of wheat waste biomass for polyhydroxybutyrate production and its characterization. Ind. Crop. Prod. 2020, 150, 112425. [Google Scholar] [CrossRef]
  23. Belle, A.J.; Lansing, S.; Mulbry, W.; Weil, R.R. Methane and hydrogen sulfide production during co-digestion of forage radish and dairy manure. Biomass Bioenergy 2015, 80, 44–51. [Google Scholar] [CrossRef]
  24. Reungsang, A.; Pattra, S.; Sittijunda, S. Optimization of Key Factors Affecting Methane Production from Acidic Effluent Coming from the Sugarcane Juice Hydrogen Fermentation Process. Energies 2012, 5, 4746–4757. [Google Scholar] [CrossRef] [Green Version]
  25. Karray, R.; Karray, F.; Loukil, S.; Mhiri, N.; Sayadi, S. Anaerobic co-digestion of Tunisian green macroalgae Ulva rigida with sugar industry wastewater for biogas and methane production enhancement. Waste Manag. 2017, 61, 171–178. [Google Scholar] [CrossRef] [PubMed]
  26. Telliard, W.A. METHOD 1684 Total, Fixed, and Volatile Solids in Water, Solids, and Biosolids; US Environmental Protection Agency: Washington, DC, USA, 2001.
  27. APHA/AWWA/WEF. Standard Methods for Examination of Water and Wastewater. Stand. Methods. 2012, p. 541. Available online: https://www.wef.org/resources/publications/books/StandardMethods/ (accessed on 31 May 2021).
  28. Al-Selwi, A.; Joshi, M. Source Rock Evaluation using Total Organic Carbon (TOC) and the Loss- On-Ignition (LOI) Techniques. Oil Gas Res. 2015, 1, 1–5. [Google Scholar] [CrossRef] [Green Version]
  29. Nie, H.; Jacobi, H.F.; Strach, K.; Xu, C.; Zhou, H.; Liebetrau, J. Mono-fermentation of chicken manure: Ammonia inhibition and recirculation of the digestate. Bioresour. Technol. 2015, 178, 238–246. [Google Scholar] [CrossRef] [PubMed]
  30. Nguimkeu, P. A simple selection test between the Gompertz and Logistic growth models. Technol. Forecast. Soc. Chang. 2014, 88, 98–105. [Google Scholar] [CrossRef]
  31. Chauvatcharin, S.; Siripatana, C.; Seki, T.; Takagi, M.; Yoshida, T. Metabolism analysis and on-line physiological state diagnosis of acetone–butanol fermentation. Biotechnol. Bioeng. 1998, 58, 561–571. [Google Scholar] [CrossRef]
  32. Kainthola, J.; Kalamdhad, A.S.; Goud, V.V. Enhanced methane production from anaerobic co-digestion of rice straw and hydrilla verticillata and its kinetic analysis. Biomass Bioenergy 2019, 125, 8–16. [Google Scholar] [CrossRef]
  33. Hagos, K.; Zong, J.; Li, D.; Liu, C.; Lu, X. Anaerobic co-digestion process for biogas production: Progress, challenges and perspectives. Renew. Sustain. Energy Rev. 2017, 76, 1485–1496. [Google Scholar] [CrossRef]
  34. Sawatdeenarunat, C.; Surendra, K.; Takara, D.; Oechsner, H.; Khanal, S.K. Anaerobic digestion of lignocellulosic biomass: Challenges and opportunities. Bioresour. Technol. 2015, 178, 178–186. [Google Scholar] [CrossRef]
  35. Kumar, G.; Dharmaraja, J.; Arvindnarayan, S.; Shoban, S.; Bakonyi, P.; Saratale, G.D.; Nemestóthy, N.; Bélafi–Bakó, K.; Yoon, J.; Kim, S. A comprehensive review on thermochemical, biological, biochemical and hybrid conversion methods of bio-derived lignocellulosic molecules into renewable fuels. Fuel 2019, 251, 352–367. [Google Scholar] [CrossRef]
  36. Hassan, M.; Ding, W.; Shi, Z.; Zhao, S. Methane enhancement through co-digestion of chicken manure and thermo-oxidative cleaved wheat straw with waste activated sludge: A C/N optimization case. Bioresour. Technol. 2016, 211, 534–541. [Google Scholar] [CrossRef]
  37. Liew, L.N.; Shi, J.; Li, Y. Enhancing the solid-state anaerobic digestion of fallen leaves through simultaneous alkaline treatment. Bioresour. Technol. 2011, 102, 8828–8834. [Google Scholar] [CrossRef] [PubMed]
  38. Islam, K.; Wang, H.; Rehman, S.; Dong, C.; Hsu, H.-Y.; Lin, C.S.K.; Leu, S.-Y. Sustainability metrics of pretreatment processes in a waste derived lignocellulosic biomass biorefinery. Bioresour. Technol. 2020, 298, 122558. [Google Scholar] [CrossRef] [PubMed]
  39. Mahmood, H.; Moniruzzaman, M.; Iqbal, T.; Khan, M.J. Recent advances in the pretreatment of lignocellulosic biomass for biofuels and value-added products. Curr. Opin. Green Sustain. Chem. 2019, 20, 18–24. [Google Scholar] [CrossRef]
  40. Chandra, R.; Takeuchi, H.; Hasegawa, T. Methane production from lignocellulosic agricultural crop wastes: A review in context to second generation of biofuel production. Renew. Sustain. Energy Rev. 2012, 16, 1462–1476. [Google Scholar] [CrossRef]
  41. Syaichurrozi, I. Biogas production from co-digestion Salvinia molesta and rice straw and kinetics. Renew. Energy 2018, 115, 76–86. [Google Scholar] [CrossRef]
  42. Zou, H.; Chen, Y.; Shi, J.; Zhao, T.; Yu, Q.; Yu, S.; Shi, D.; Chai, H.; Gu, L.; He, Q.; et al. Mesophilic anaerobic co-digestion of residual sludge with different lignocellulosic wastes in the batch digester. Bioresour. Technol. 2018, 268, 371–381. [Google Scholar] [CrossRef]
  43. Jiang, J.; Zhang, Y.; Li, K.; Wang, Q.; Gong, C.; Li, M. Volatile fatty acids production from food waste: Effects of pH, temperature, and organic loading rate. Bioresour. Technol. 2013, 143, 525–530. [Google Scholar] [CrossRef]
  44. Veluchamy, C.; Kalamdhad, A.S. Biochemical methane potential test for pulp and paper mill sludge with different food/microorganisms ratios and its kinetics. Int. Biodeterior. Biodegrad. 2017, 117, 197–204. [Google Scholar] [CrossRef]
  45. Eryildiz, B.; Lukitawesa; Taherzadeh, M.J. Effect of pH, substrate loading, oxygen, and methanogens inhibitors on volatile fatty acid (VFA) production from citrus waste by anaerobic digestion. Bioresour. Technol. 2020, 302, 122800. [Google Scholar] [CrossRef]
  46. Dinamarca, S.; Aroca, G.; Chamy, R.; Guerrero, L. The influence of pH in the hydrolytic stage of anaerobic digestion of the organic fraction of urban solid waste. Water Sci. Technol. 2003, 48, 249–254. [Google Scholar] [CrossRef] [PubMed]
  47. Nguyen, D.; Wu, Z.; Shrestha, S.; Lee, P.-H.; Raskin, L.; Khanal, S.K. Intermittent micro-aeration: New strategy to control volatile fatty acid accumulation in high organic loading anaerobic digestion. Water Res. 2019, 166, 115080. [Google Scholar] [CrossRef] [PubMed]
  48. Kiran, E.U.; Stamatelatou, K.; Antonopoulou, G.; Lyberatos, G. Production of Biogas via Anaerobic Digestion; Elsevier: Amsterdam, The Netherlands, 2016; pp. 259–301. [Google Scholar]
Figure 1. Lab-Scale Biochemical Methane Potential Setup.
Applsci 11 06069 g001
Figure 2. Methane % Potential of Reactors with (S/I ratio) (a) 1.5 and (b) 2.5.
Applsci 11 06069 g002
Figure 3. Cumulative Methane Yield (NmLCH4/gVS) of S/I ratio, (a) 1.5 and (b) 2.5.
Applsci 11 06069 g003
Figure 4. Cumulative Methane Production–Experimental; Transference, Logistic and Modified Gompertz Model for Reactors (a) Baggase and Rice straw(BARS), (b) Baggase and Wheat Straw (BAWS) (c) Baggase, Wheat straw and Rice starw (BAWSRS), (d) Wheat straw and Rice Straw (WSRS) with S/I 1.5.
Applsci 11 06069 g004
Figure 5. Cumulative Methane Production–Experimental; Transference, Logistic and Modified Gompertz Model for Reactors (a) Baggase and Rice straw(BARS), (b) Baggase and Wheat Straw (BAWS) (c) Baggase, Wheat straw and Rice starw (BAWSRS), (d) Wheat straw and Rice Straw (WSRS) with S/I 2.5.
Applsci 11 06069 g005
Table 1. Proximate Analysis of Substrates.
ParametersWheat StrawRice StrawBagasseInoculum
Total Solids %9998.59885
Volatile Solids %83.3362.428058.6
Total Organic Carbon (TOC) %46.2934.4644.4432.555
Moisture Content %11.5290.6
pH---6.6
Table 2. pH and VS Reduction % after Co-digestion of S/I Ratio 1.5.
ReactorspHVS Reduction (%)
Control 17.088.9
WSRS7.098.8
BARS6.998.5
BAWS7.898.1
BAWSRS7.099.0
Table 3. pH and VS Reduction % after Co-digestion of S/I Ratio 2.5.
ReactorspHVS Reduction (%)
Control 27.187.0
WSRS7.199.2
BARS5.599.4
BAWS6.597.7
BAWSRS7.096.9
Table 4. Summary of Kinetic Parameters.
ParametersS/I 1.5S/I 2.5
WSRSBAWSBARSBAWSRSWSRSBAWSBARSBAWSRS
Modified Gompertz Model
R20.9720.9770.9770.9810.9810.9830.9750.984
RMSE0.5810.2690.6380.5410.5940.6820.6380.636
λ (days)1018221718252221
Rm mLCH4/VS. d4.1230.3000.2560.5010.2980.0910.01810.1574
Predicted Methane Yield NmLCH4/gVS338.878154.768163.010295.993215.49357.73213.560133.583
Experimental Methane NmLCH4/gVS393.008177.965188.299337.900244.78565.79315.748151.345
Difference % (ϓ)6.87.214.846.235.865.637.445.82
Logistic Function Model
R20.9900.9920.9910.9930.9940.9920.9900.994
RMSE0.1380.230.1150.1660.3030.6820.6560.200
λ (days)1017211519363325
Rm mLCH4/VS. d2.5661.4772.3682.7131.2600.6700.1912.002
Predicted Methane Yield NmLCH4/gVS335.716161.425170.27466.334224.17859.89514.15138.107
Experimental Methane Yield NmLCH4/gVS393.008177.965188.299337.900244.78565.79315.74841.399
Difference % (ϓ)4.675.394.394.684.044.124.914.14
Transfer Function Model
R20.7370.7420.6770.7440.6850.5750.6420.641
RMSE0.6602.4563.4533.6591.96510.2933.664.141
(days)1115131112141312
Rm2.5660.1641.1061.7571.2600.2120.0800.831
Predicted Methane Yield mLCH4/gVS252.851116.326111.758219.783150.79134.4458.93087.913
Experimental Methane Yield NmLCH4/gVS393.008177.965188.299337.900244.78565.79315.748151.345
Difference % (ϓ)21.1820.925.4719.7423.0330.6226.9926.06
First Order Kinetics
Kh0.030.020.0070.030.0190.0090.0050.009
Predicted Methane Yield NmLCH4/gVS334.206140.324852.3473284.856163.67152.57610.251100.486
Experimental Methane Yield NmLCH4/gVS393.008177.965188.299337.900244.78565.79315.748151.345
Publisher’s Note: MDPI stays neutral with regard to jurisdictional claims in published maps and institutional affiliations.

